 Deutsch
 English
 Español
 Français
 Italiano
 Nederlands
 Polski
 Português
 Русский
 Türkçe
 Svenska
 Chinese
 Magyar
Acer Predator Triton 14 reviewed: A 14-inch gaming laptop with a bright display and an RTX 4050

The compact gaming laptop represents the current state of the art: Raptor Lake, Ada Lovelace, LPDDR5, PCIe 4, Thunderbolt 4. What we're dealing with here is the almost identical successor to the already reviewed Acer Predator Triton 300 SE. Competing devices are the Razer Blade 14, the MSI Stealth 14 Studio A13V, the Gigabyte Aero 14 OLED BMF, the Apple MacBook Pro 14 2023 M2 Pro Entry and the Asus ROG Zephyrus G14 GA402RJ.
Possible competitors compared
Rating | Date | Model | Weight | Height | Size | Resolution | Best Price |
|---|---|---|---|---|---|---|---|
| 87.3 % | 07/2023 | Acer Predator Triton 14 PT14-51 i7-13700H, NVIDIA GeForce RTX 4050 Laptop GPU | 1.7 kg | 19.81 mm | 14.00" | 2560x1600 | |
| 88.7 % | 06/2023 | Razer Blade 14 RTX 4070 R9 7940HS, NVIDIA GeForce RTX 4070 Laptop GPU | 1.8 kg | 17.99 mm | 14.00" | 2560x1600 | |
| 86.4 % | 10/2022 | Asus ROG Zephyrus G14 GA402RJ R7 6800HS, Radeon RX 6700S | 1.7 kg | 19.5 mm | 14.00" | 2560x1600 | |
| 85.4 % | 07/2023 | MSI Stealth 14 Studio A13V i7-13700H, NVIDIA GeForce RTX 4050 Laptop GPU | 1.7 kg | 19 mm | 14.00" | 2560x1600 | |
| 89.4 % | 05/2023 | Gigabyte Aero 14 OLED BMF i7-13700H, NVIDIA GeForce RTX 4050 Laptop GPU | 1.4 kg | 17 mm | 14.00" | 2880x1800 | |
| 93.4 % | 03/2023 | Apple MacBook Pro 14 2023 M2 Pro Entry M2 Pro 10-Core, M2 Pro 16-Core GPU | 1.6 kg | 15.5 mm | 14.20" | 3024x1964 |
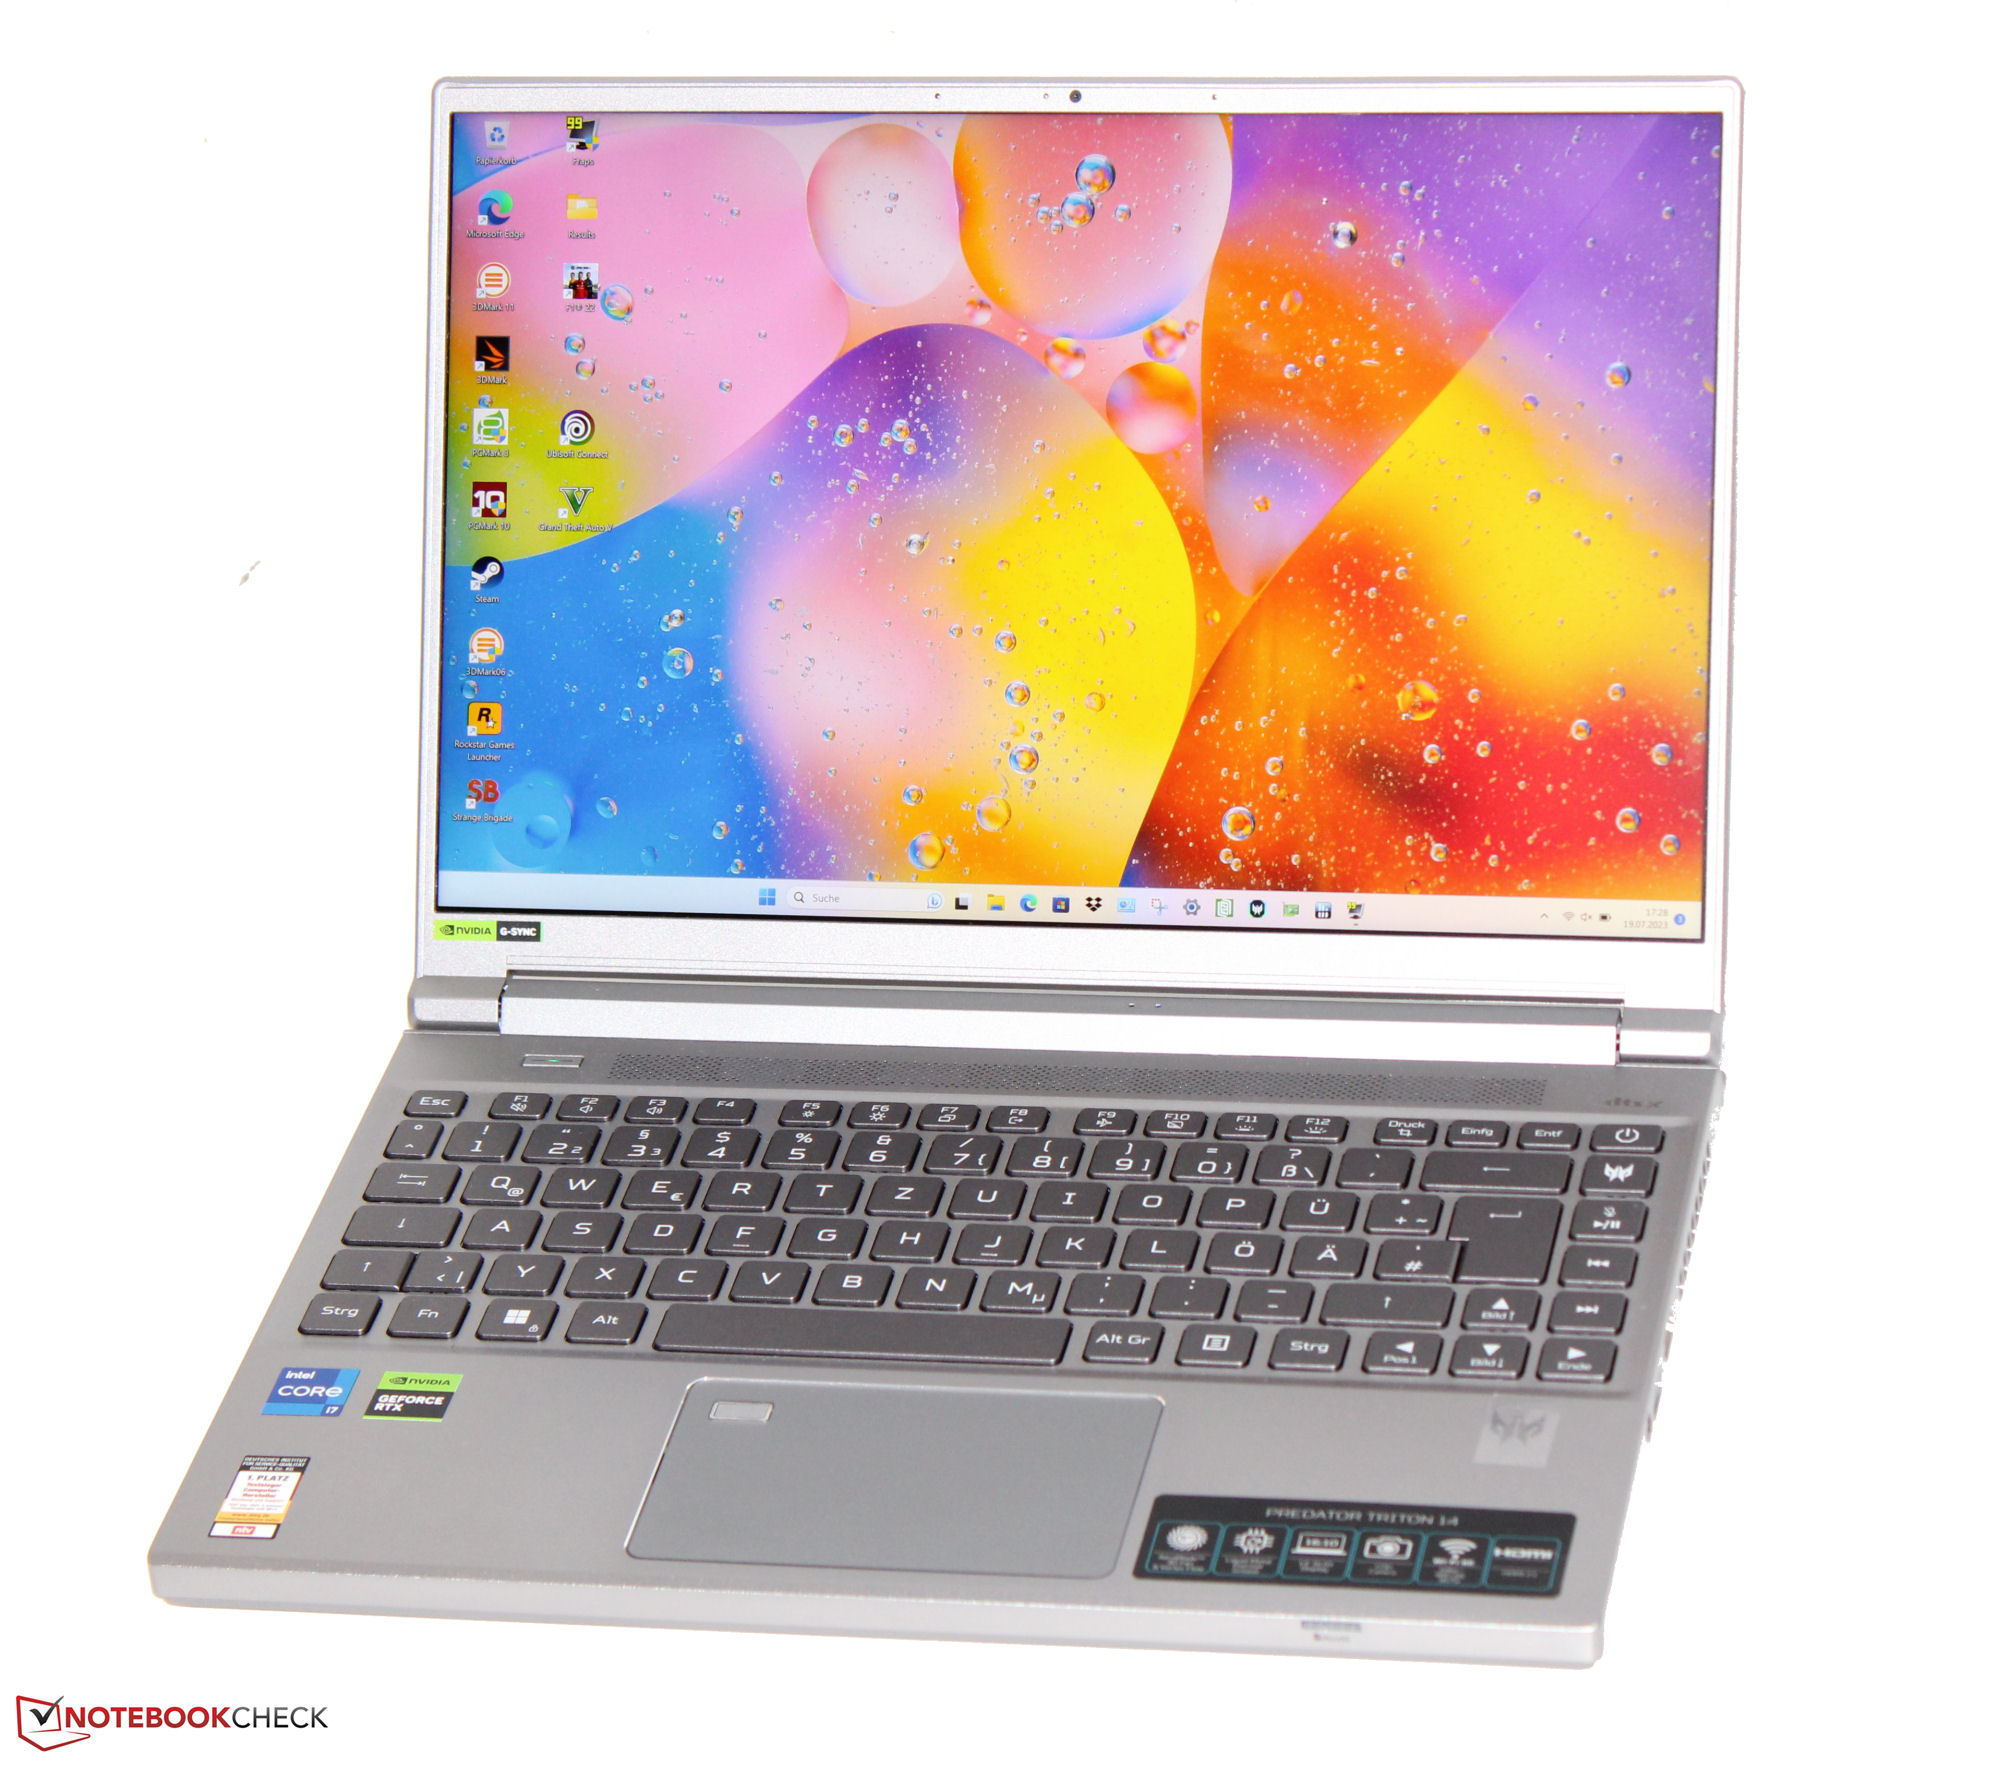
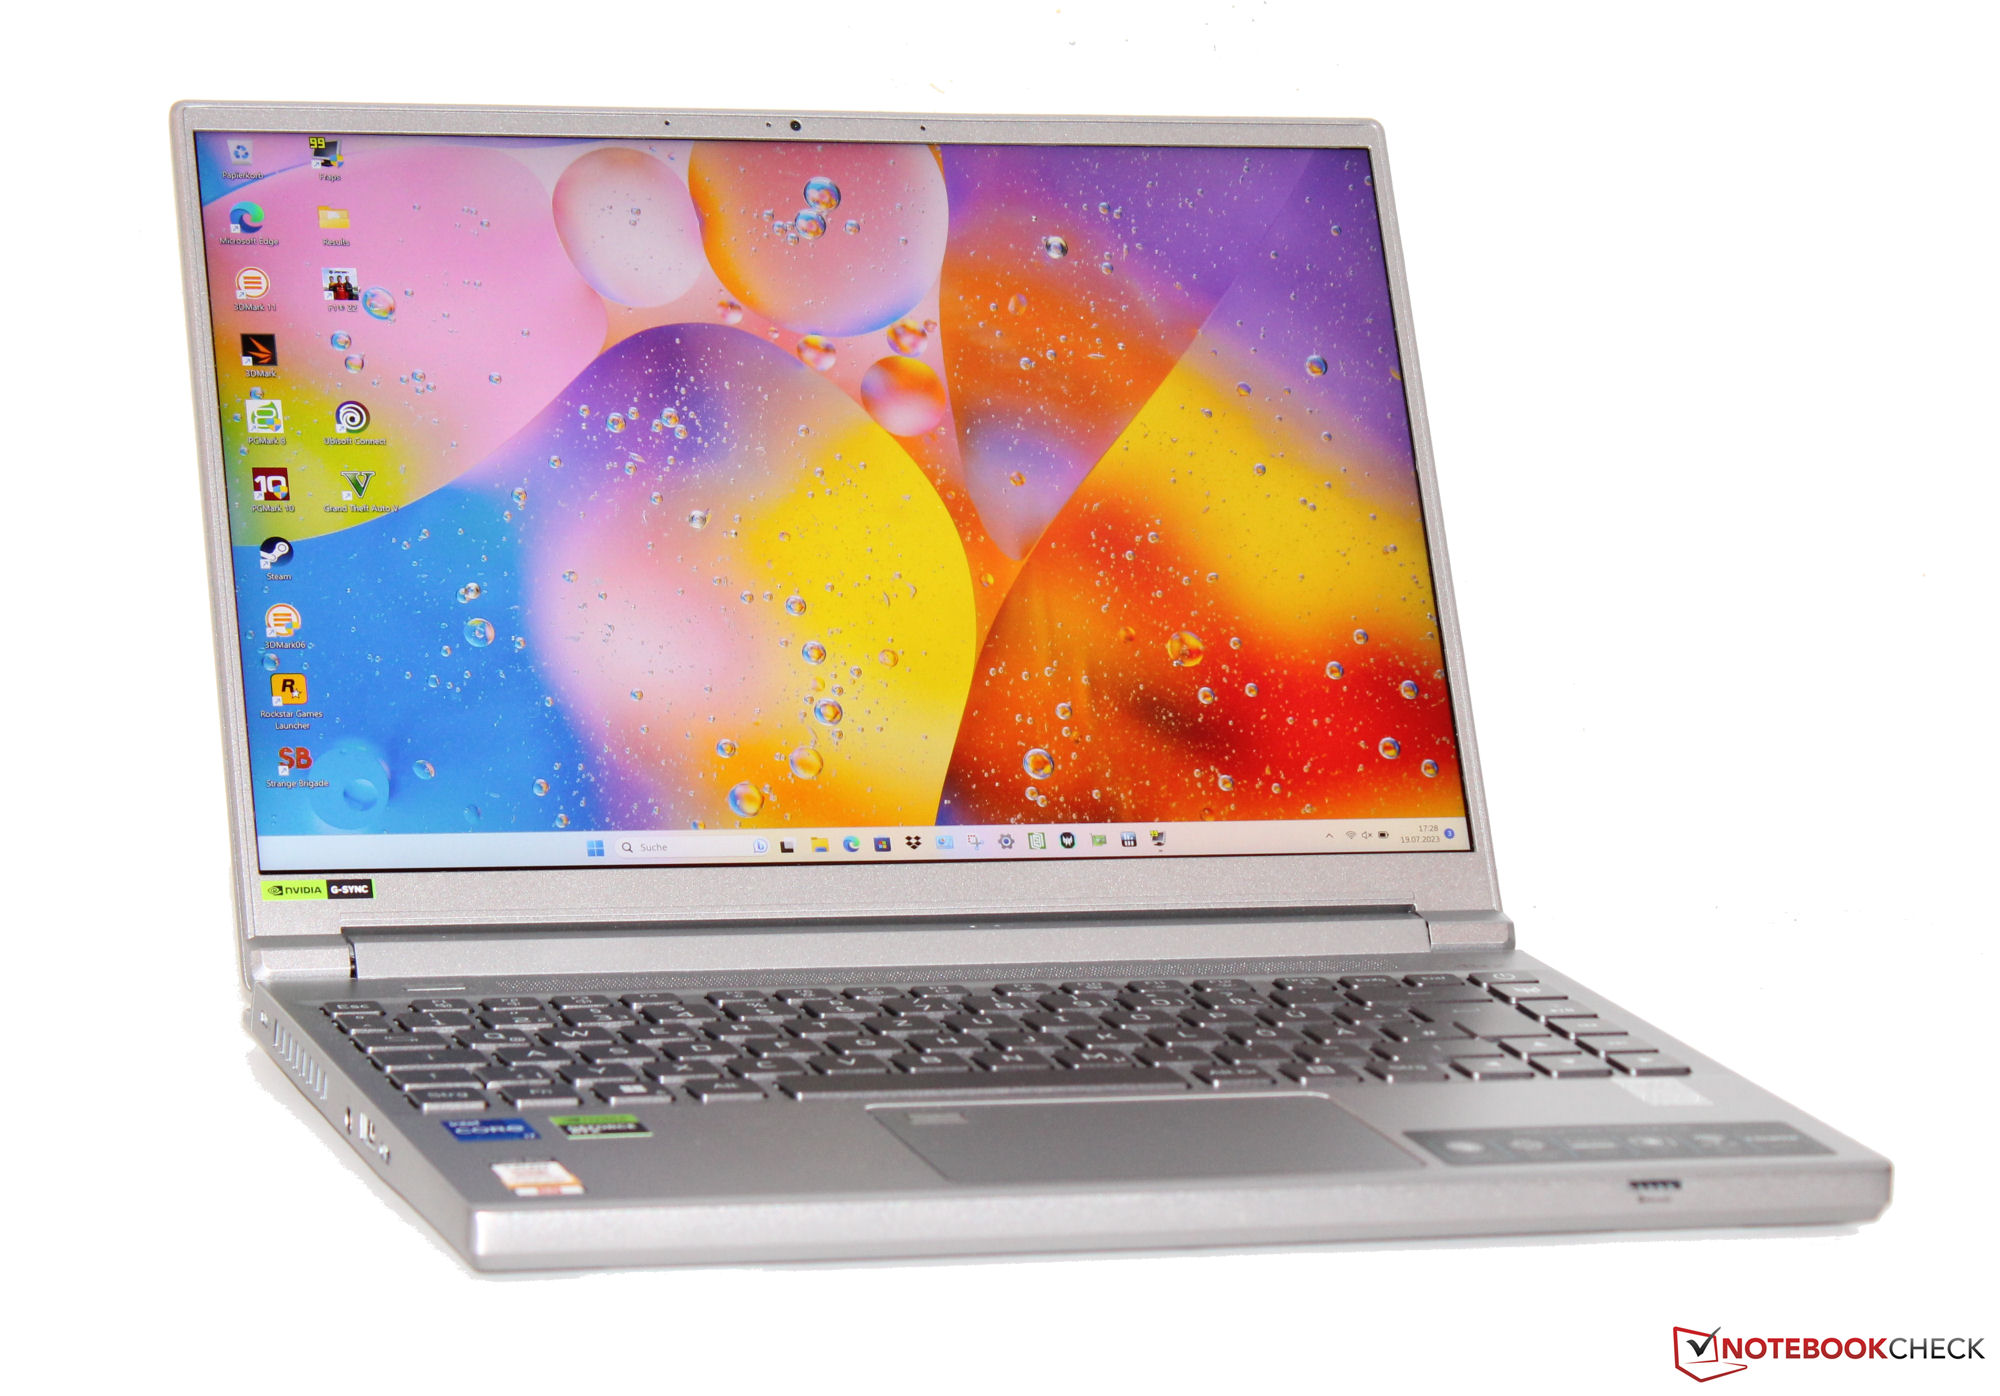
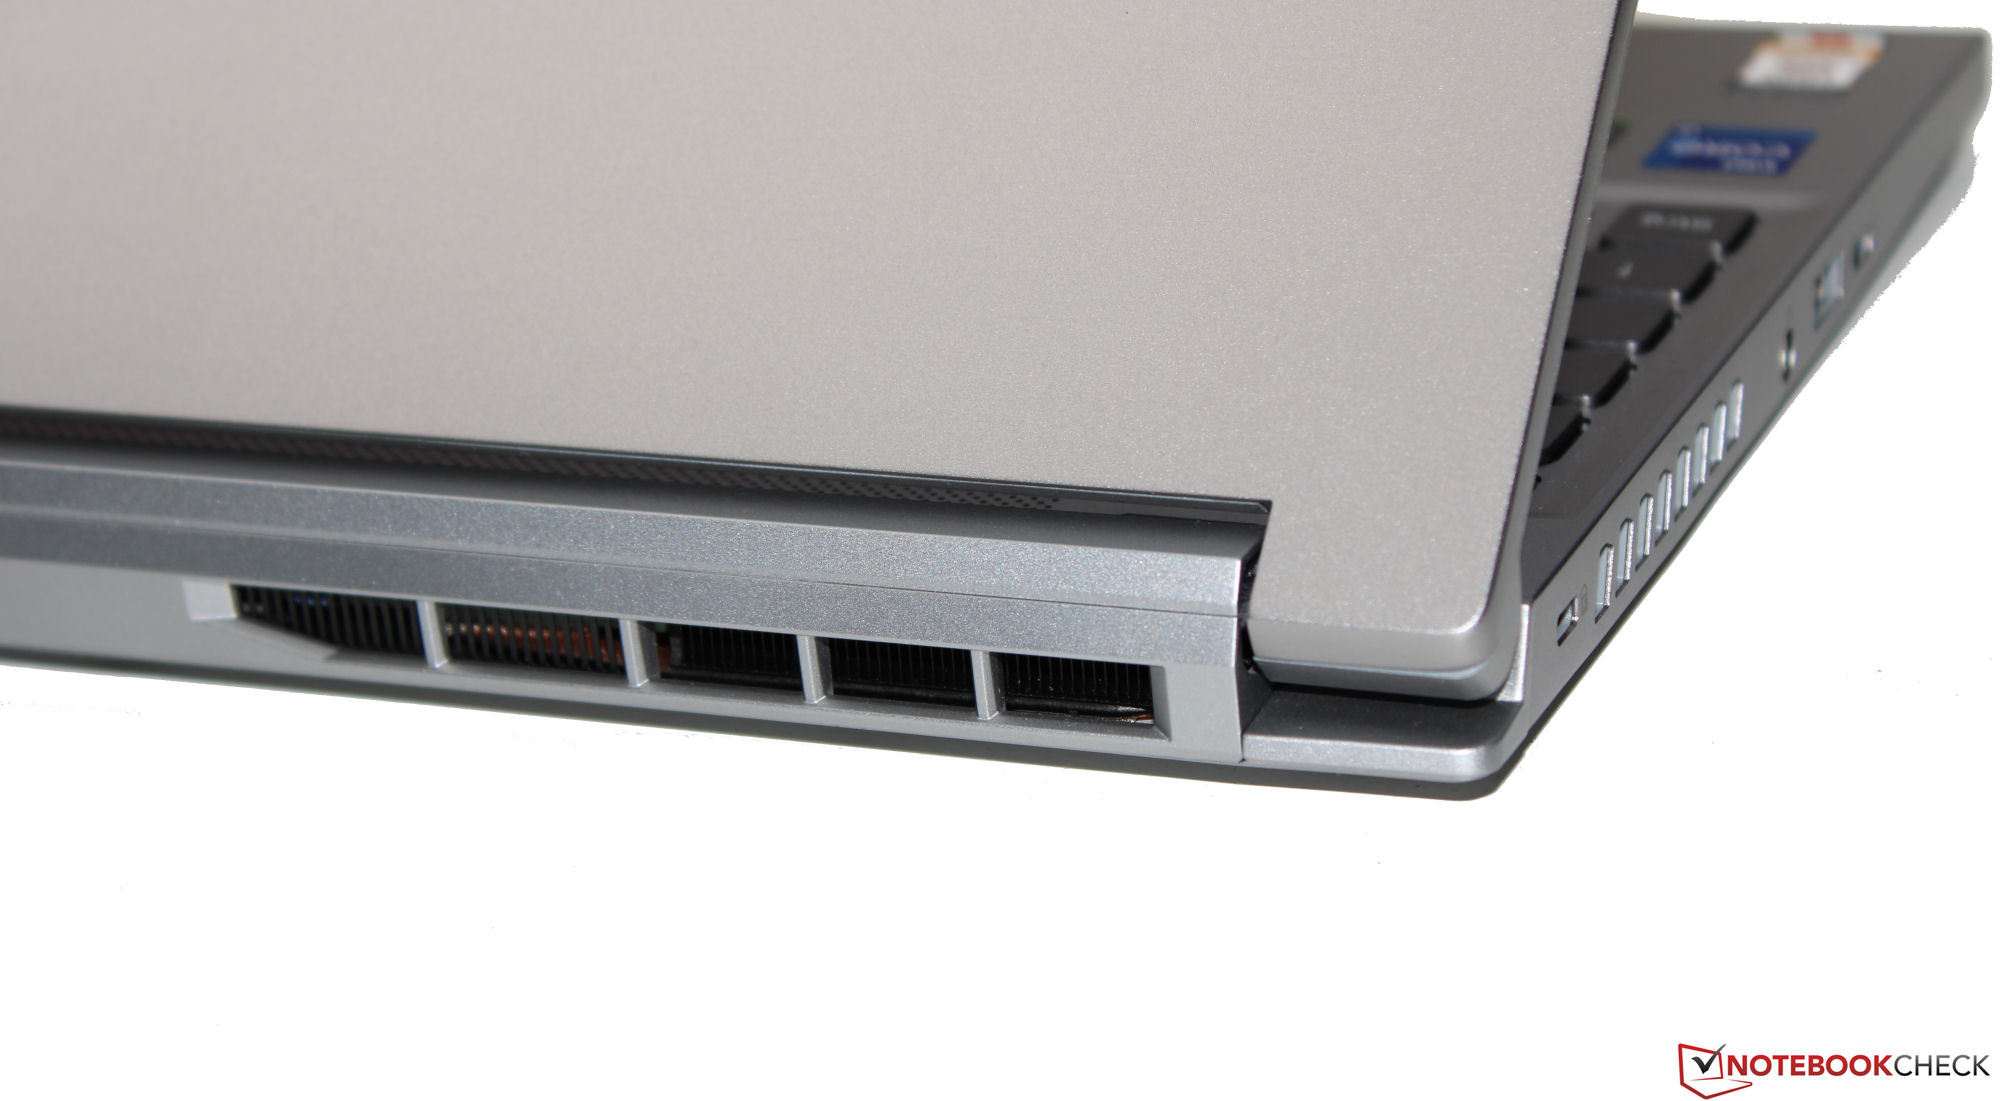
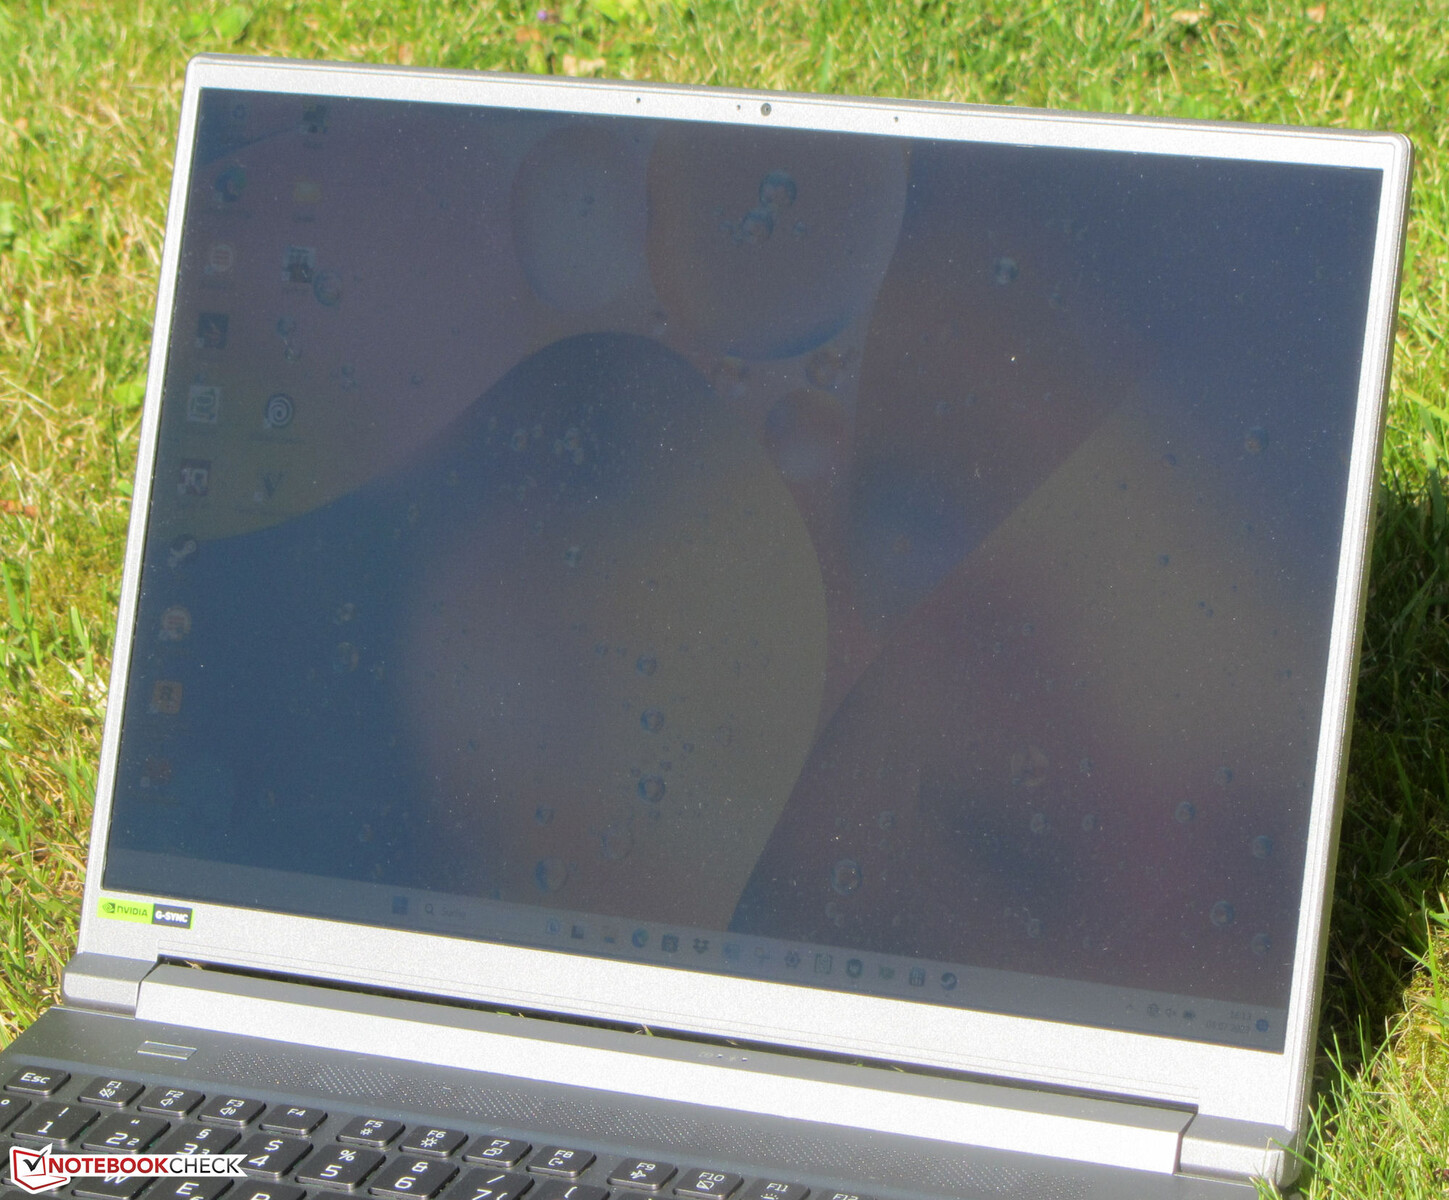
Case - Acer has treated the Triton to a metal chassis
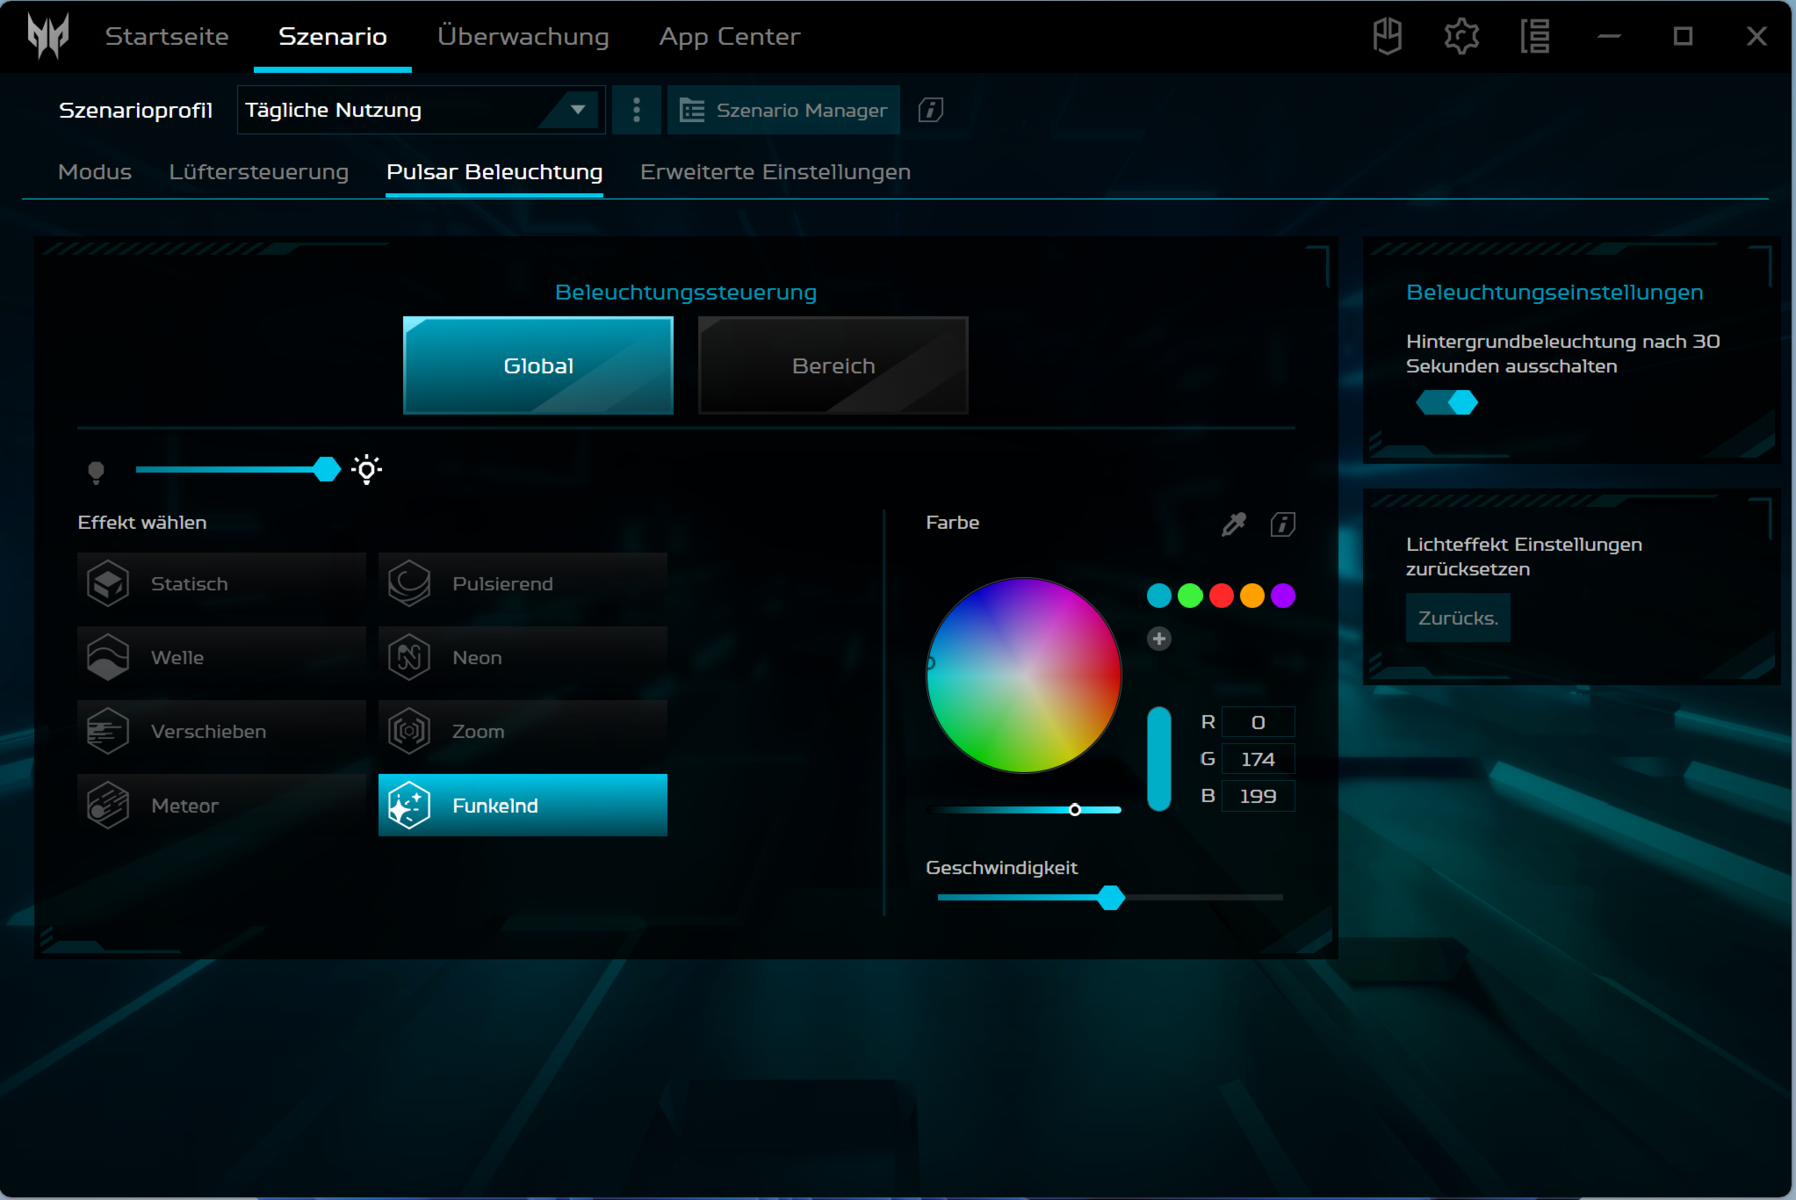
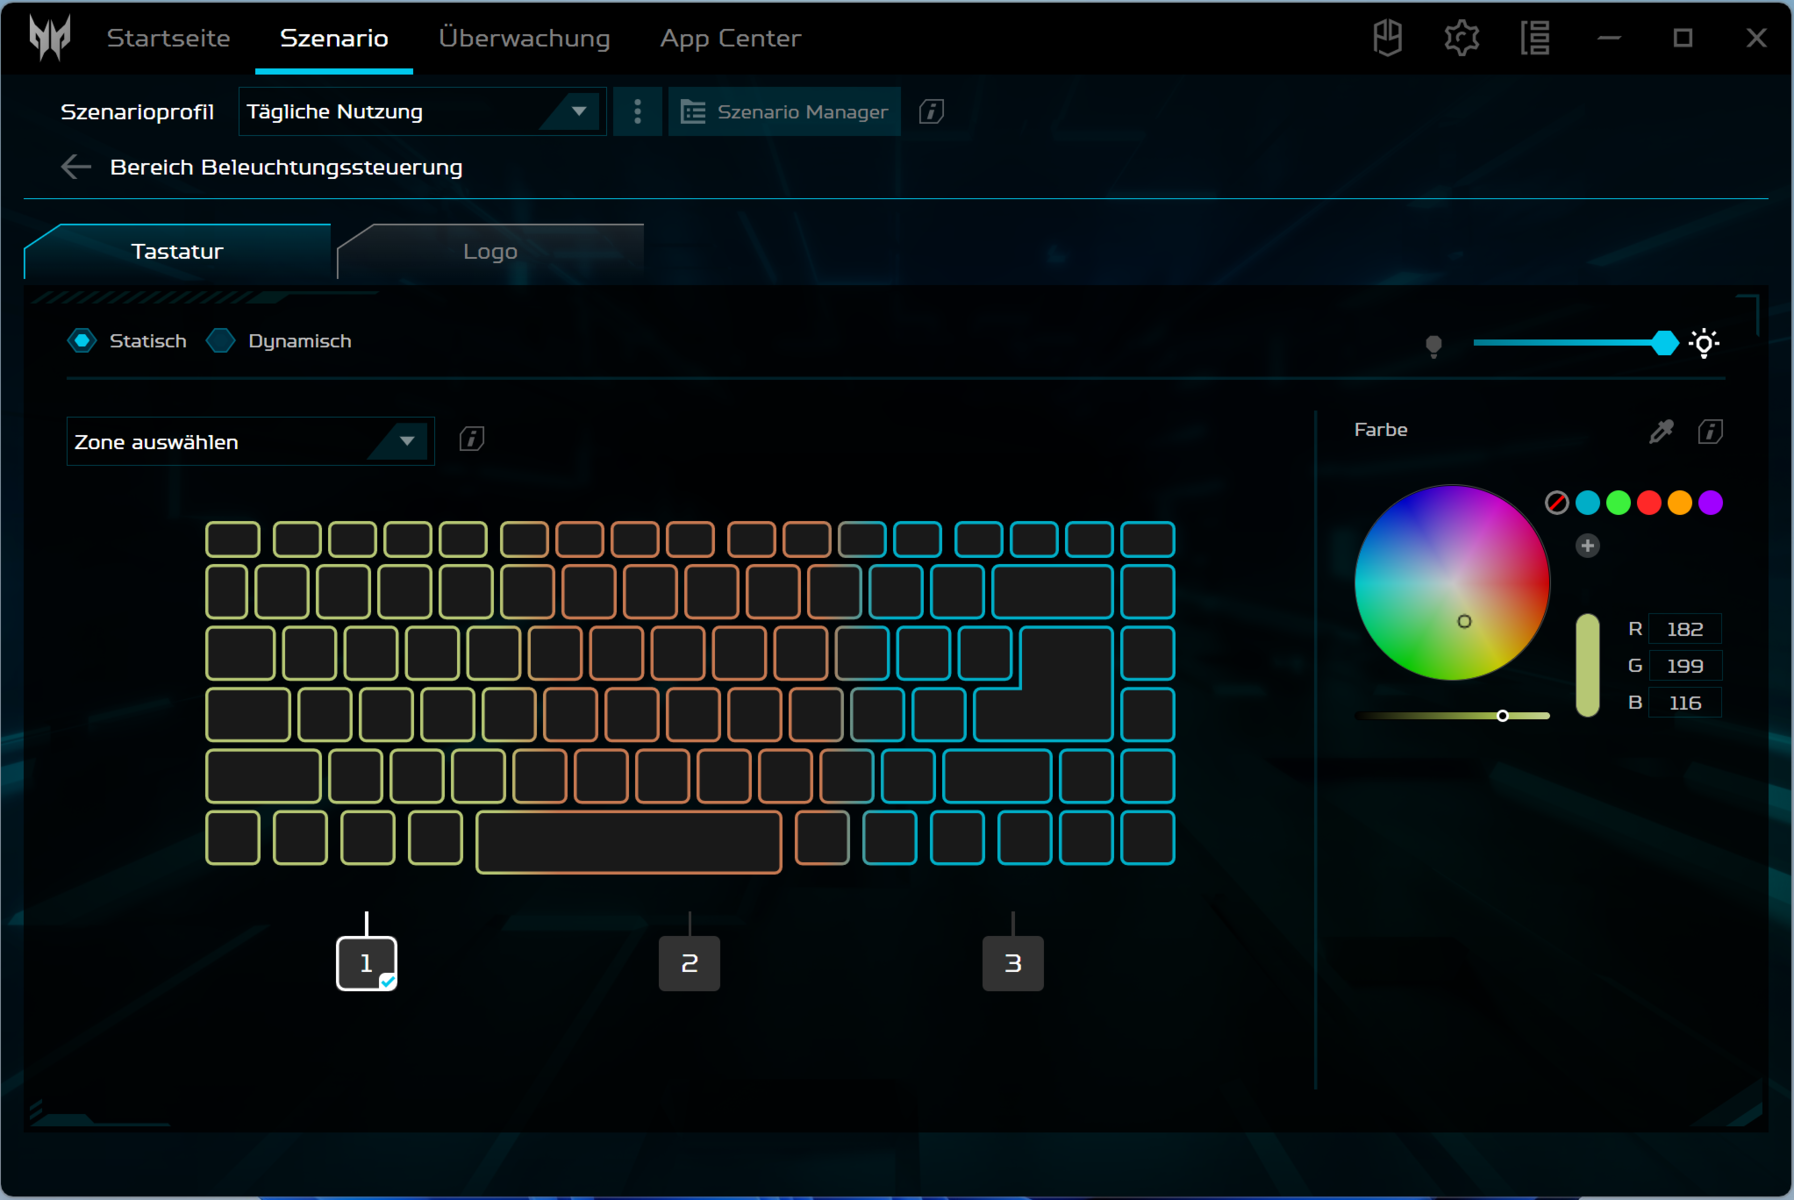
The laptop's technology is housed in a silver-gray metal case. Acer has opted for smooth, matte surfaces. The compact computer doesn't offer any eye-catching design elements meaning it can also pass as an office laptop. Likewise, extravagant LED bars are also absent. In addition to the key lighting, a small illuminated Predator logo on the palm rest mixes things up color-wise.
The Triton does not show any signs of manufacturing flaws. The gap dimensions are correct and no excess material protrudes from the device. The base unit and the lid can be twisted slightly but all within an acceptable range. Pressure placed on the rear of the lid does not result in any image distortions. The hinges hold the lid firmly in place with the maximum opening angle coming in at around 175 degrees. Opening the device one-handed is possible.


Regarding the dimensions, there's not much to choose between most of the competing devices. The MSI Stealth 14 Studio A13V is the exception to the rule: It takes up more space than the competition. When it comes to weight, the Acer laptop finds itself in the middle of the pack.
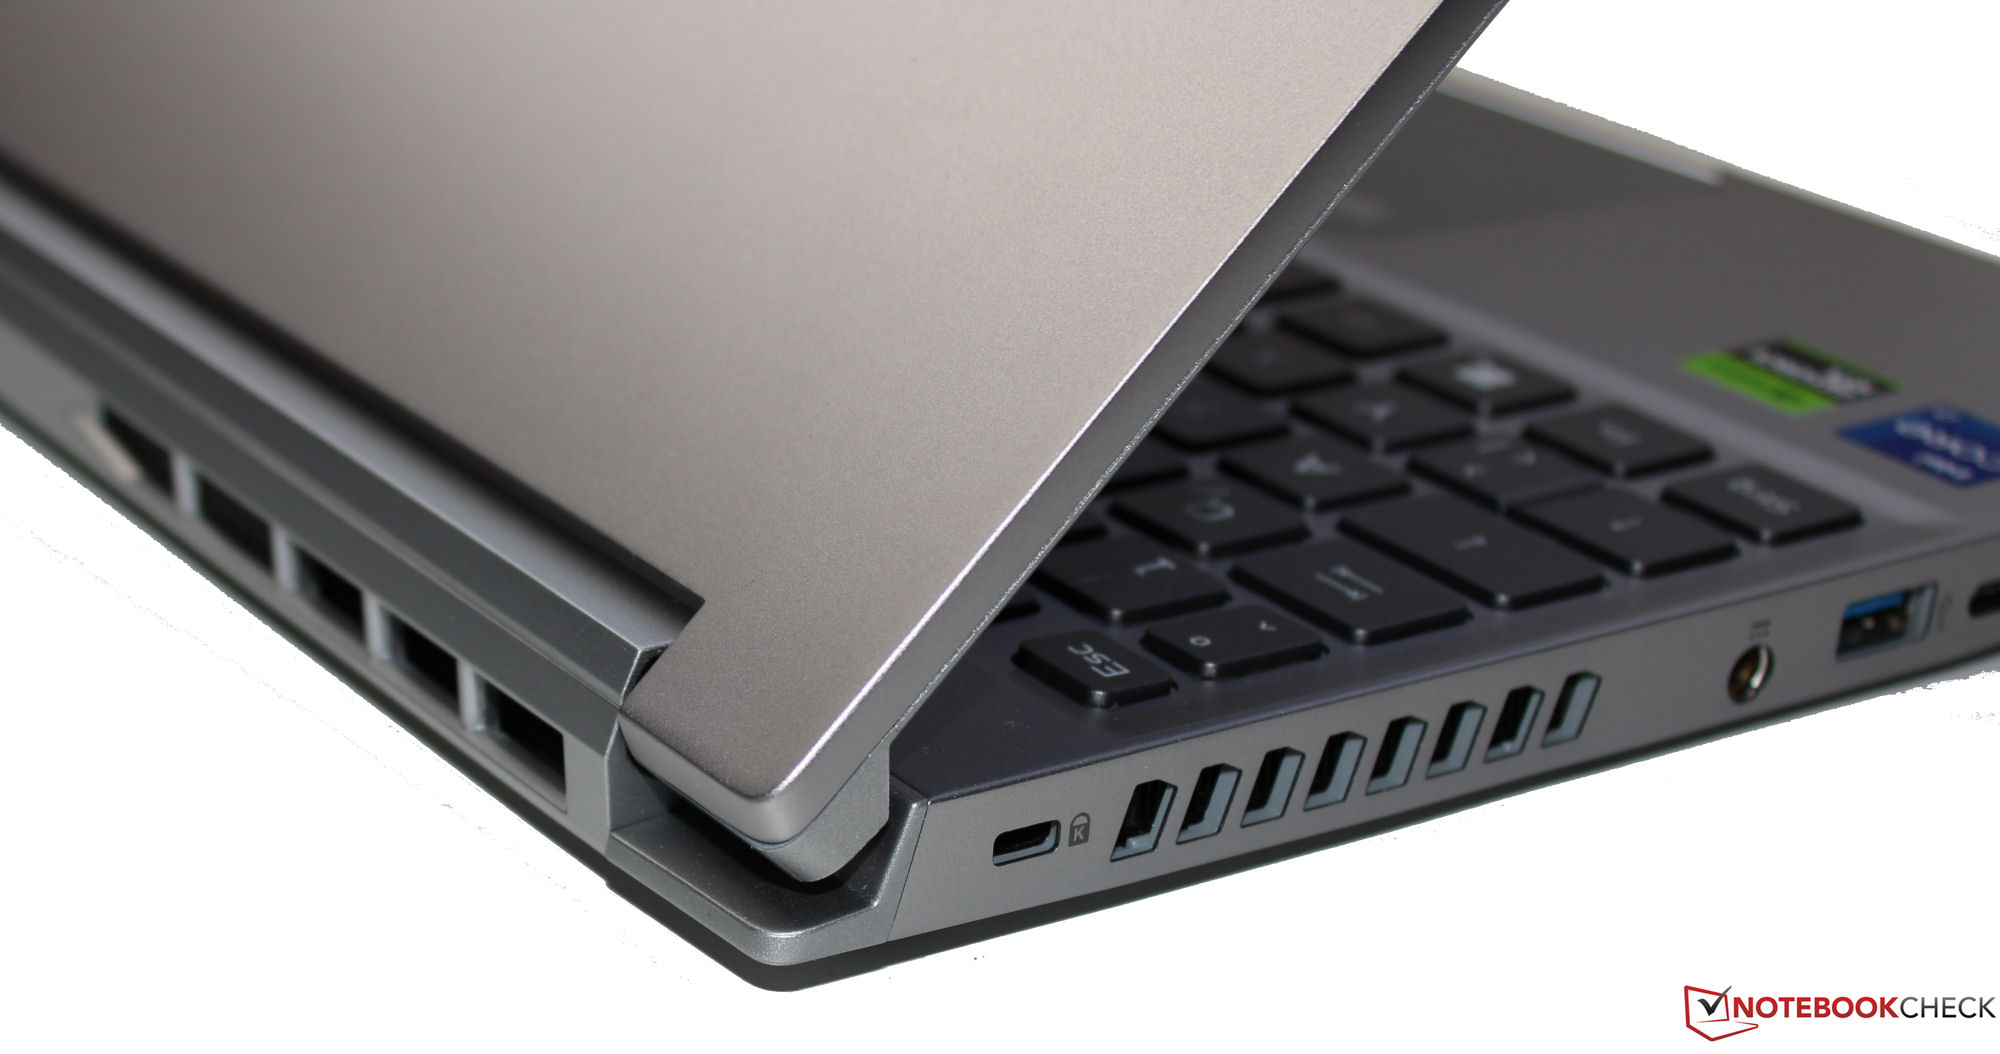
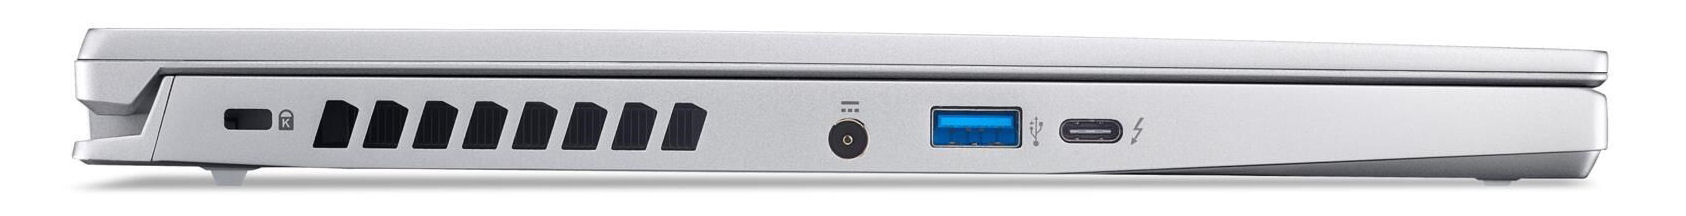
Features - The PT14 offers Thunderbolt 4
The selection of ports is quite limited: The PT14 can call two USB-A ports (USB 3.2 Gen 2) and a USB-C port (Thunderbolt 4) its own. The USB-C port supports Power Delivery and can output a Displayport signal. There are a total of two video outputs (HDMI 2.1, DP). An audio jack completes the package.


SD Card Reader
The MicroSD memory card reader (reference card: AV PRO microSD 128 GB V60) belongs to the slowest models with its maximum transfer speeds of 19 MB/s (the transfer of 250 jpg image files at around 5 MB each) and 26 MB/s (copying large data blocks).
| SD Card Reader | |
| average JPG Copy Test (av. of 3 runs) | |
| Gigabyte Aero 14 OLED BMF | |
| Asus ROG Zephyrus G14 GA402RJ (AV PRO microSD 128 GB V60) | |
| Average of class Gaming (19 - 202, n=99, last 2 years) | |
| Acer Predator Triton 14 PT14-51 (AV PRO microSD 128 GB V60) | |
| maximum AS SSD Seq Read Test (1GB) | |
| Gigabyte Aero 14 OLED BMF | |
| Asus ROG Zephyrus G14 GA402RJ (AV PRO microSD 128 GB V60) | |
| Average of class Gaming (26 - 269, n=90, last 2 years) | |
| Acer Predator Triton 14 PT14-51 (AV PRO microSD 128 GB V60) | |
Communication
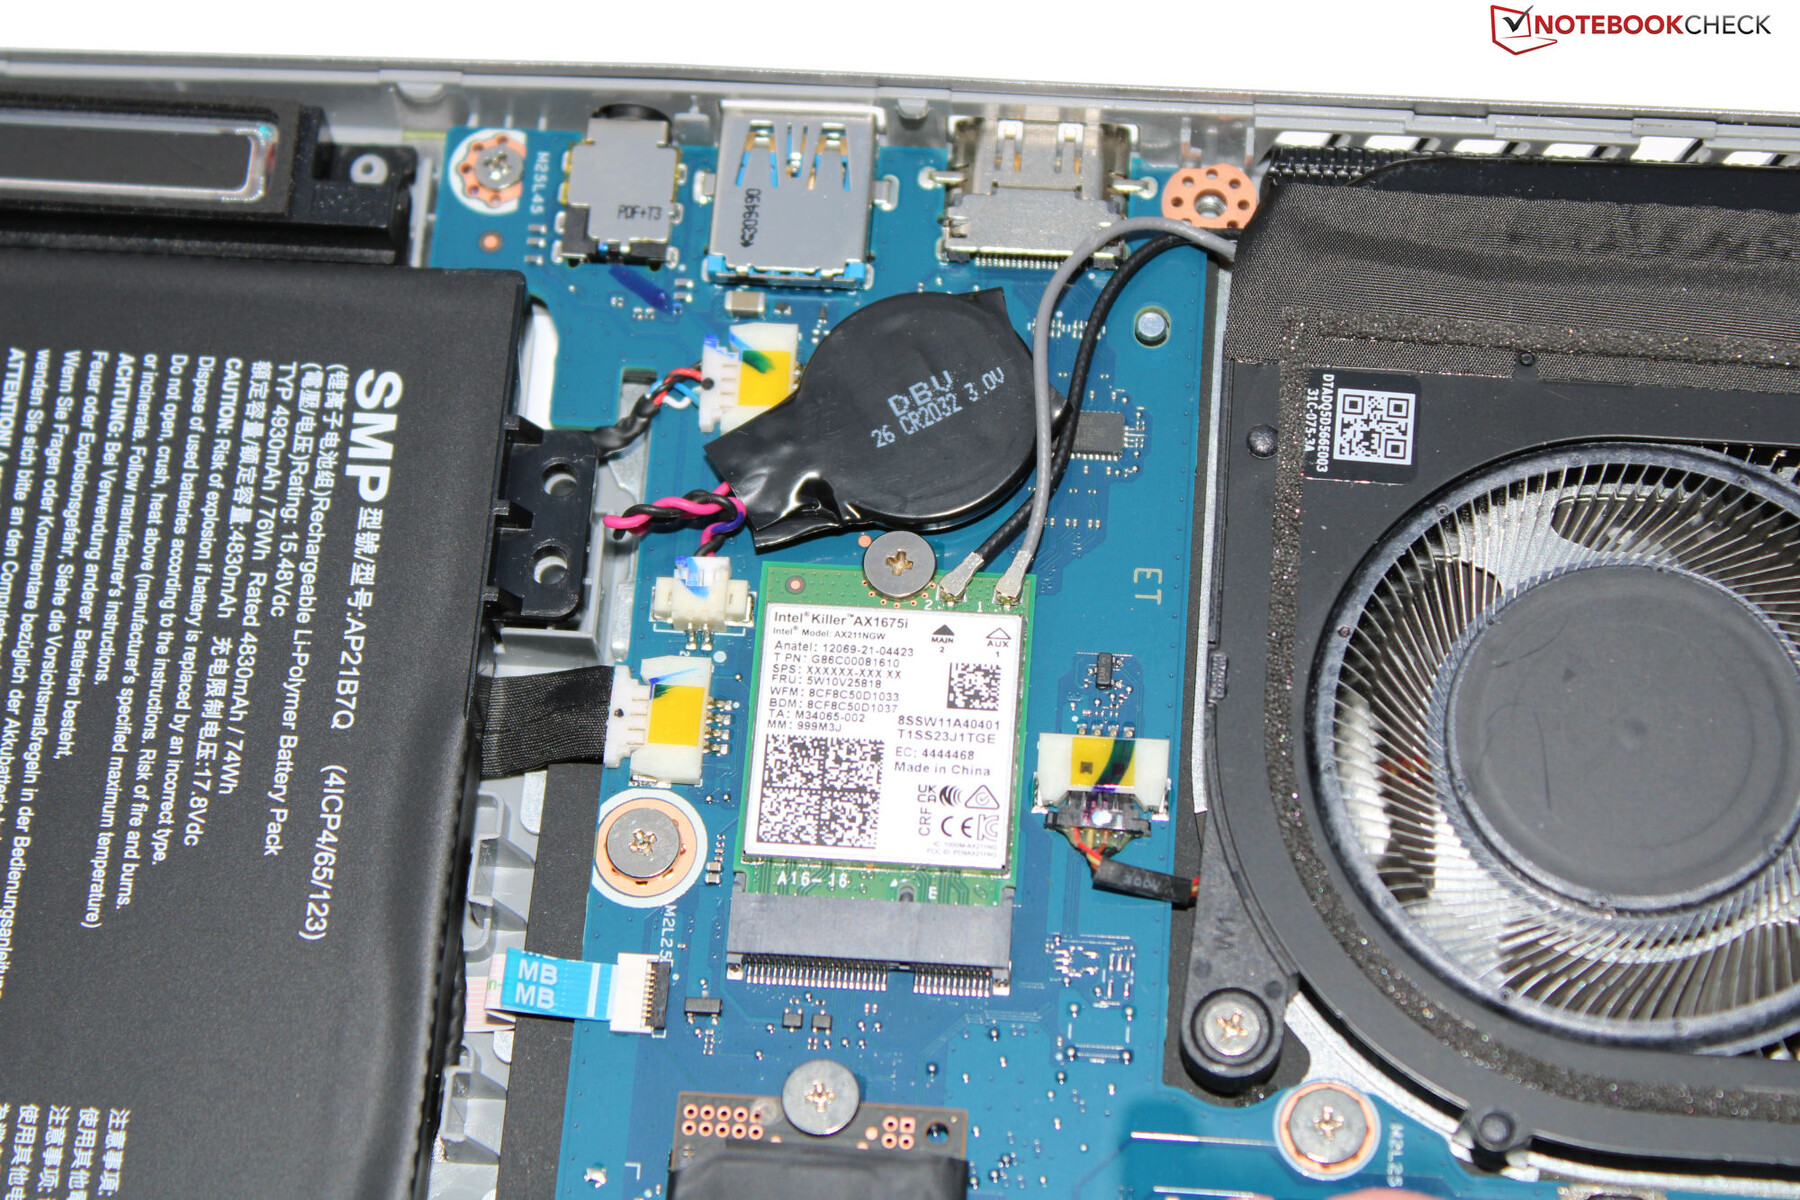
Under optimum conditions (no Wi-Fi devices nearby, a short distance between the laptop and the server PC), wonderful Wi-Fi data speeds can be achieved. The laptop has a Wi-Fi 6E chip (Killer AX1675i) on board. An ethernet port is not available.
| Networking | |
| iperf3 transmit AXE11000 | |
| Gigabyte Aero 14 OLED BMF | |
| Acer Predator Triton 14 PT14-51 | |
| MSI Stealth 14 Studio A13V | |
| Average Killer Wi-Fi 6E AX1675i 160MHz Wireless Network Adapter (942 - 1622, n=19) | |
| Razer Blade 14 RTX 4070 | |
| Average of class Gaming (648 - 1780, n=126, last 2 years) | |
| iperf3 receive AXE11000 | |
| Asus ROG Zephyrus G14 GA402RJ | |
| Acer Predator Triton 14 PT14-51 | |
| Gigabyte Aero 14 OLED BMF | |
| Razer Blade 14 RTX 4070 | |
| Average Killer Wi-Fi 6E AX1675i 160MHz Wireless Network Adapter (872 - 1714, n=21) | |
| MSI Stealth 14 Studio A13V | |
| Average of class Gaming (685 - 1890, n=133, last 2 years) | |
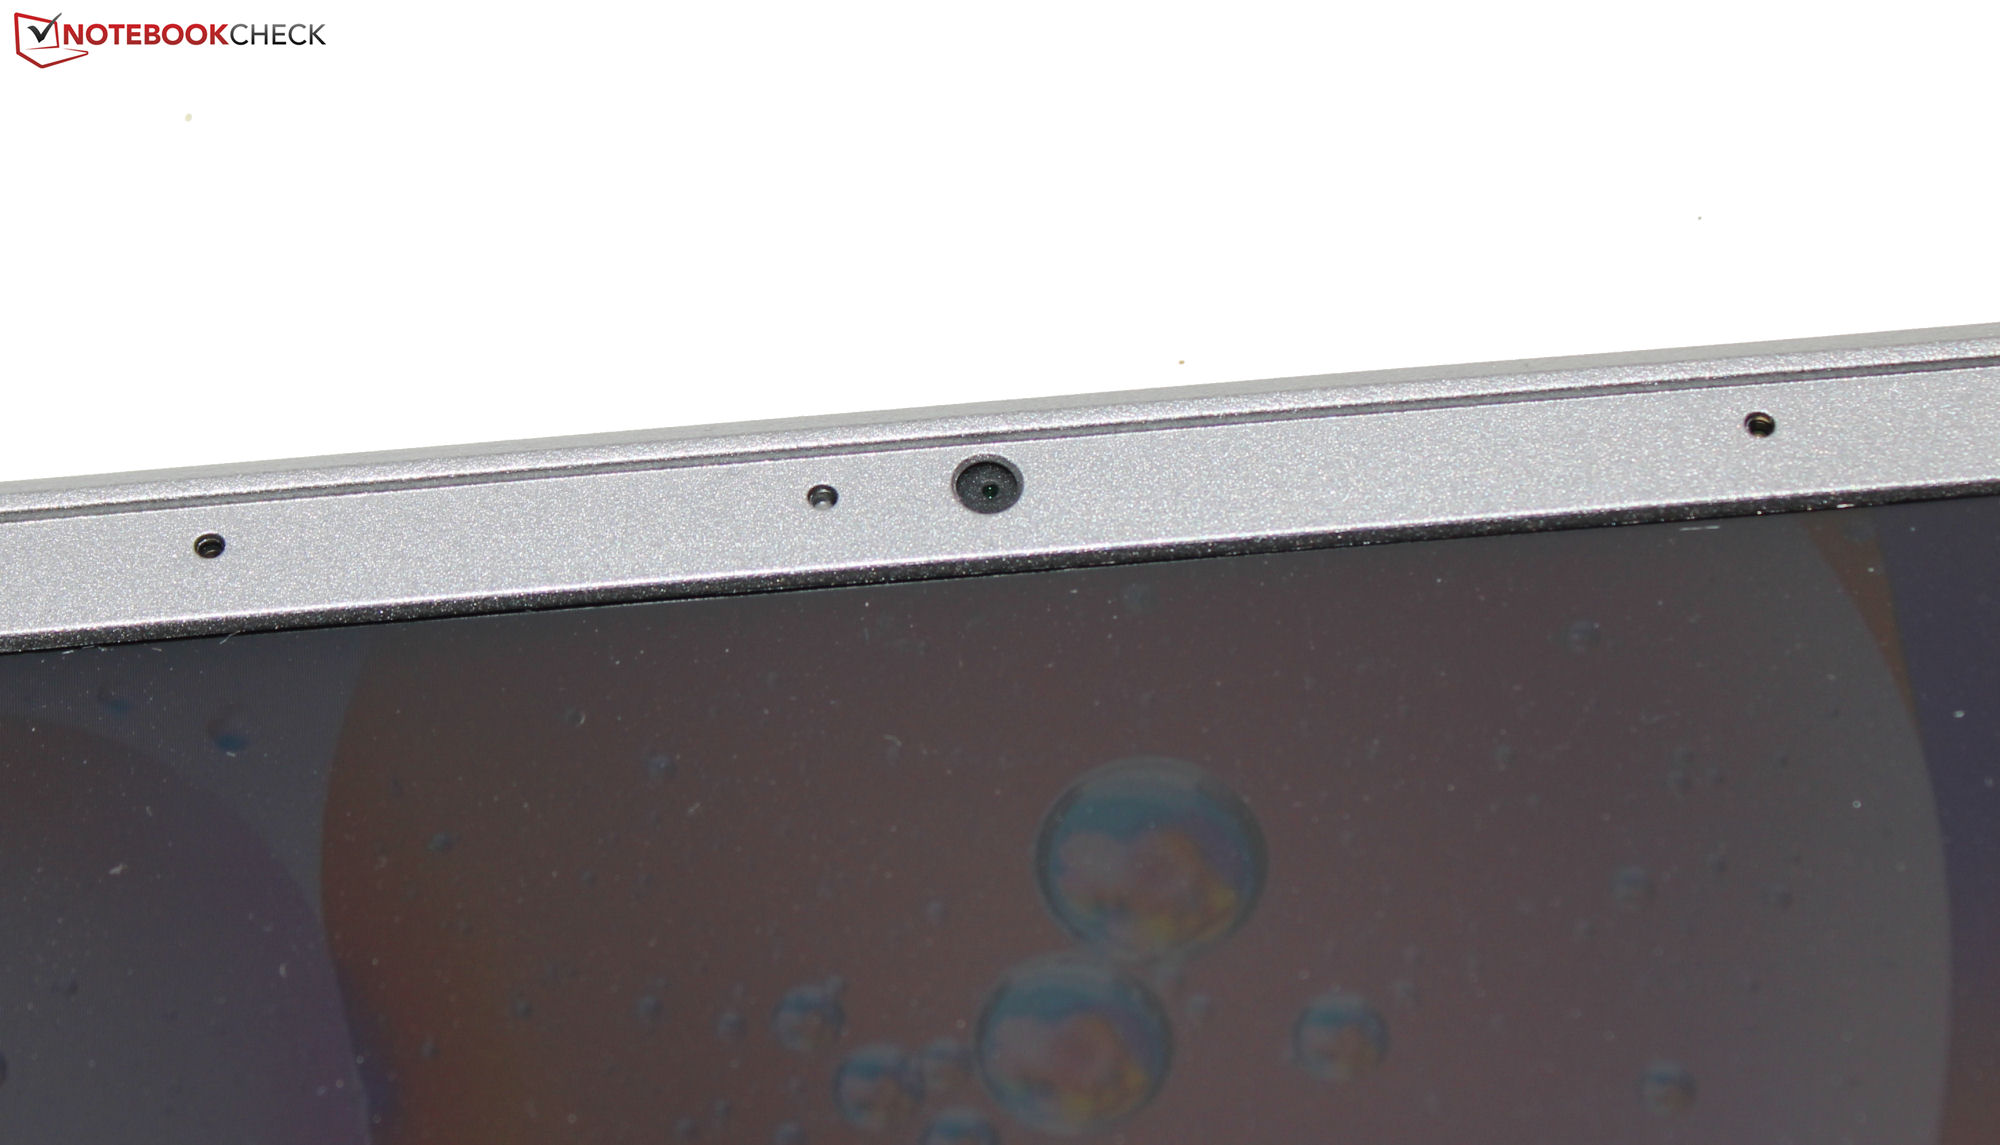
Webcam
The webcam (2.1 MP, max. 1,920 x 1,080 pixels) doesn't come with a mechanical shutter. However, in terms of quality, it cannot set itself apart from the competition. It falters in the area of color accuracy with the colors deviating from their target value.


Accessories
On top of the usual documents (quick start guide and warranty information), no additional accessories are included with the laptop.
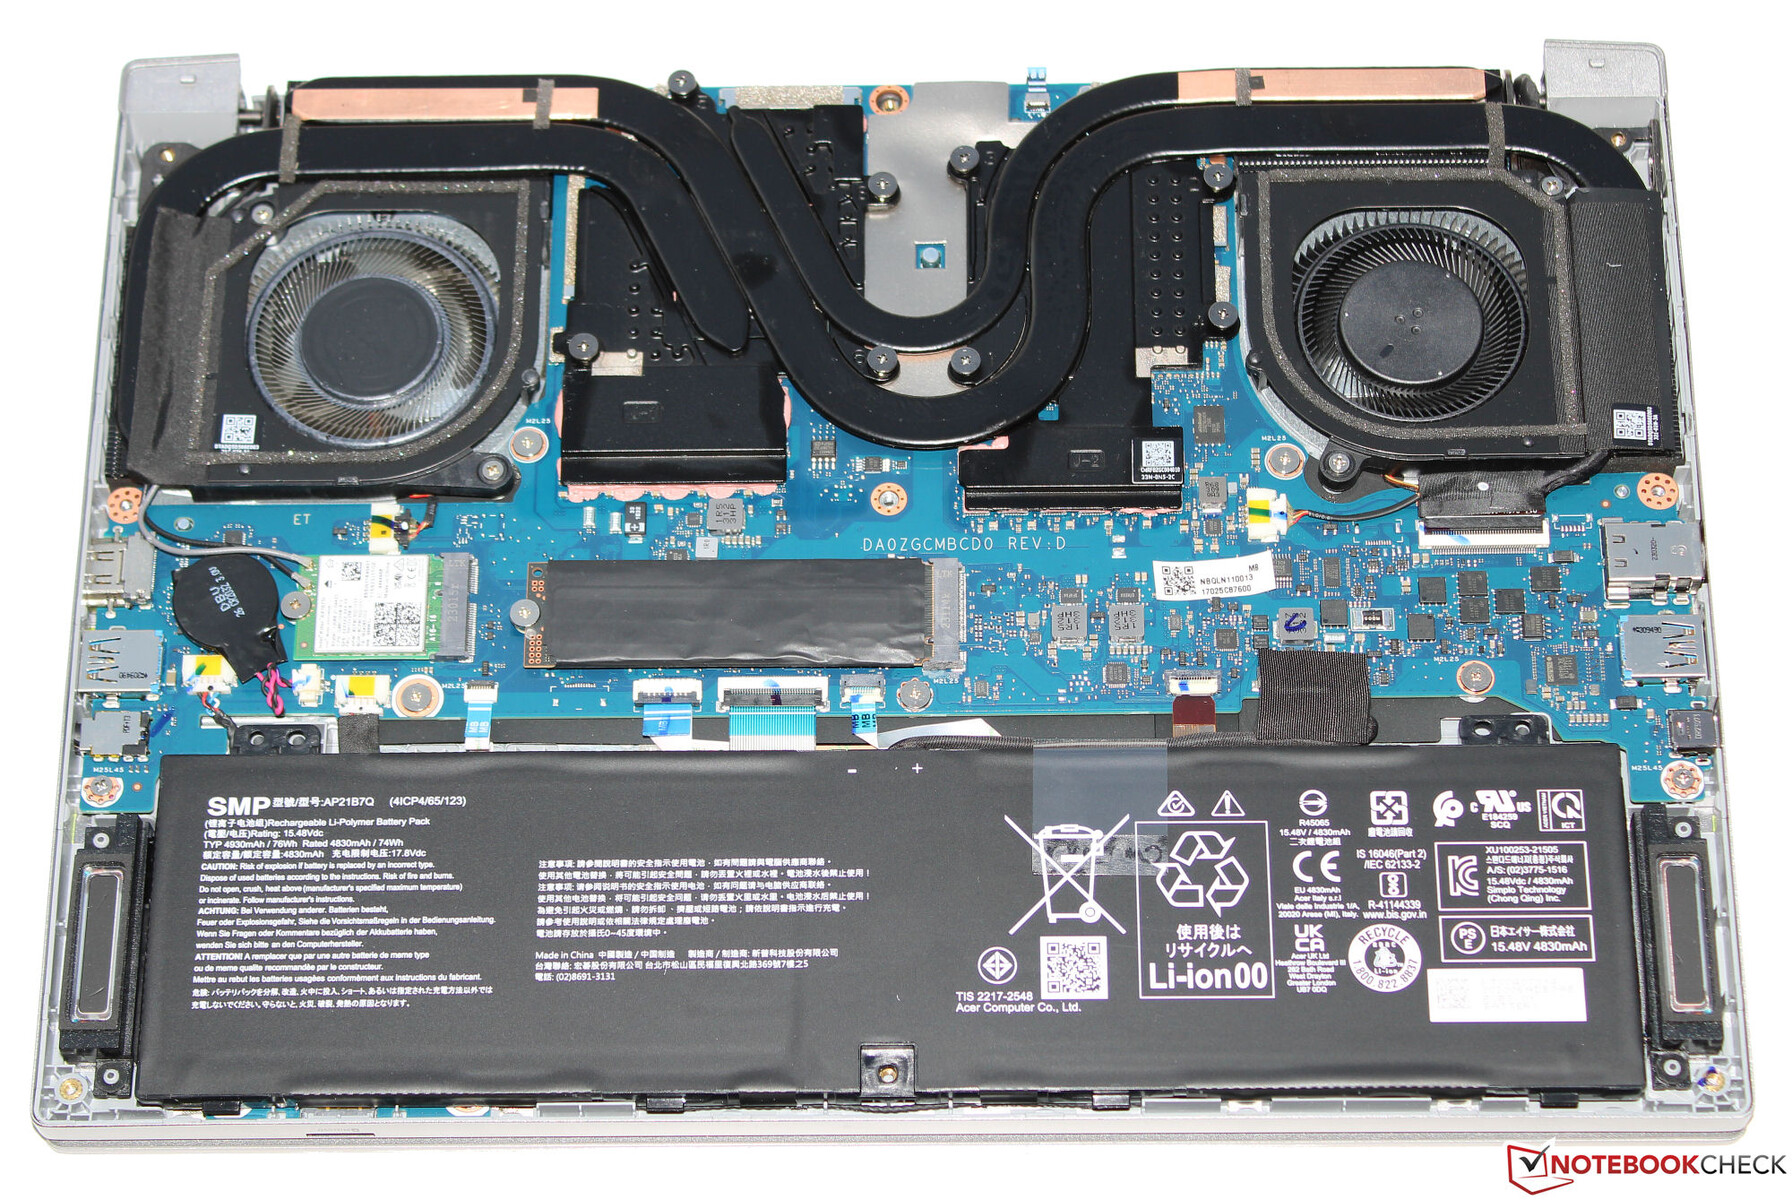
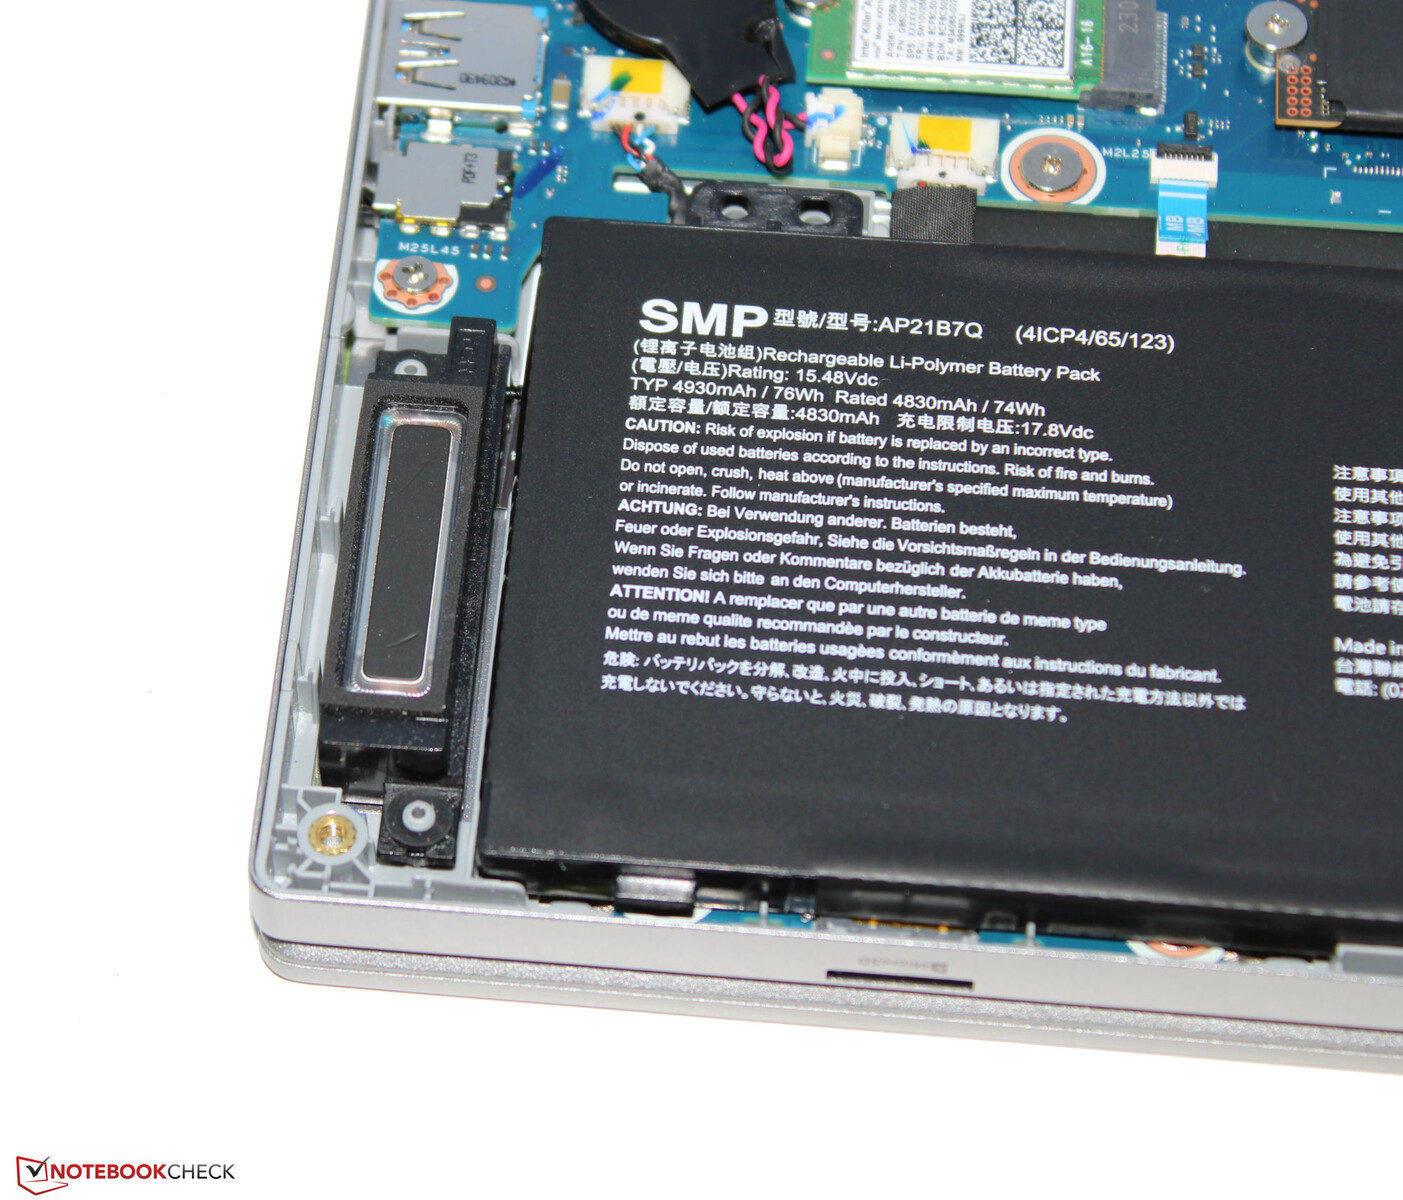
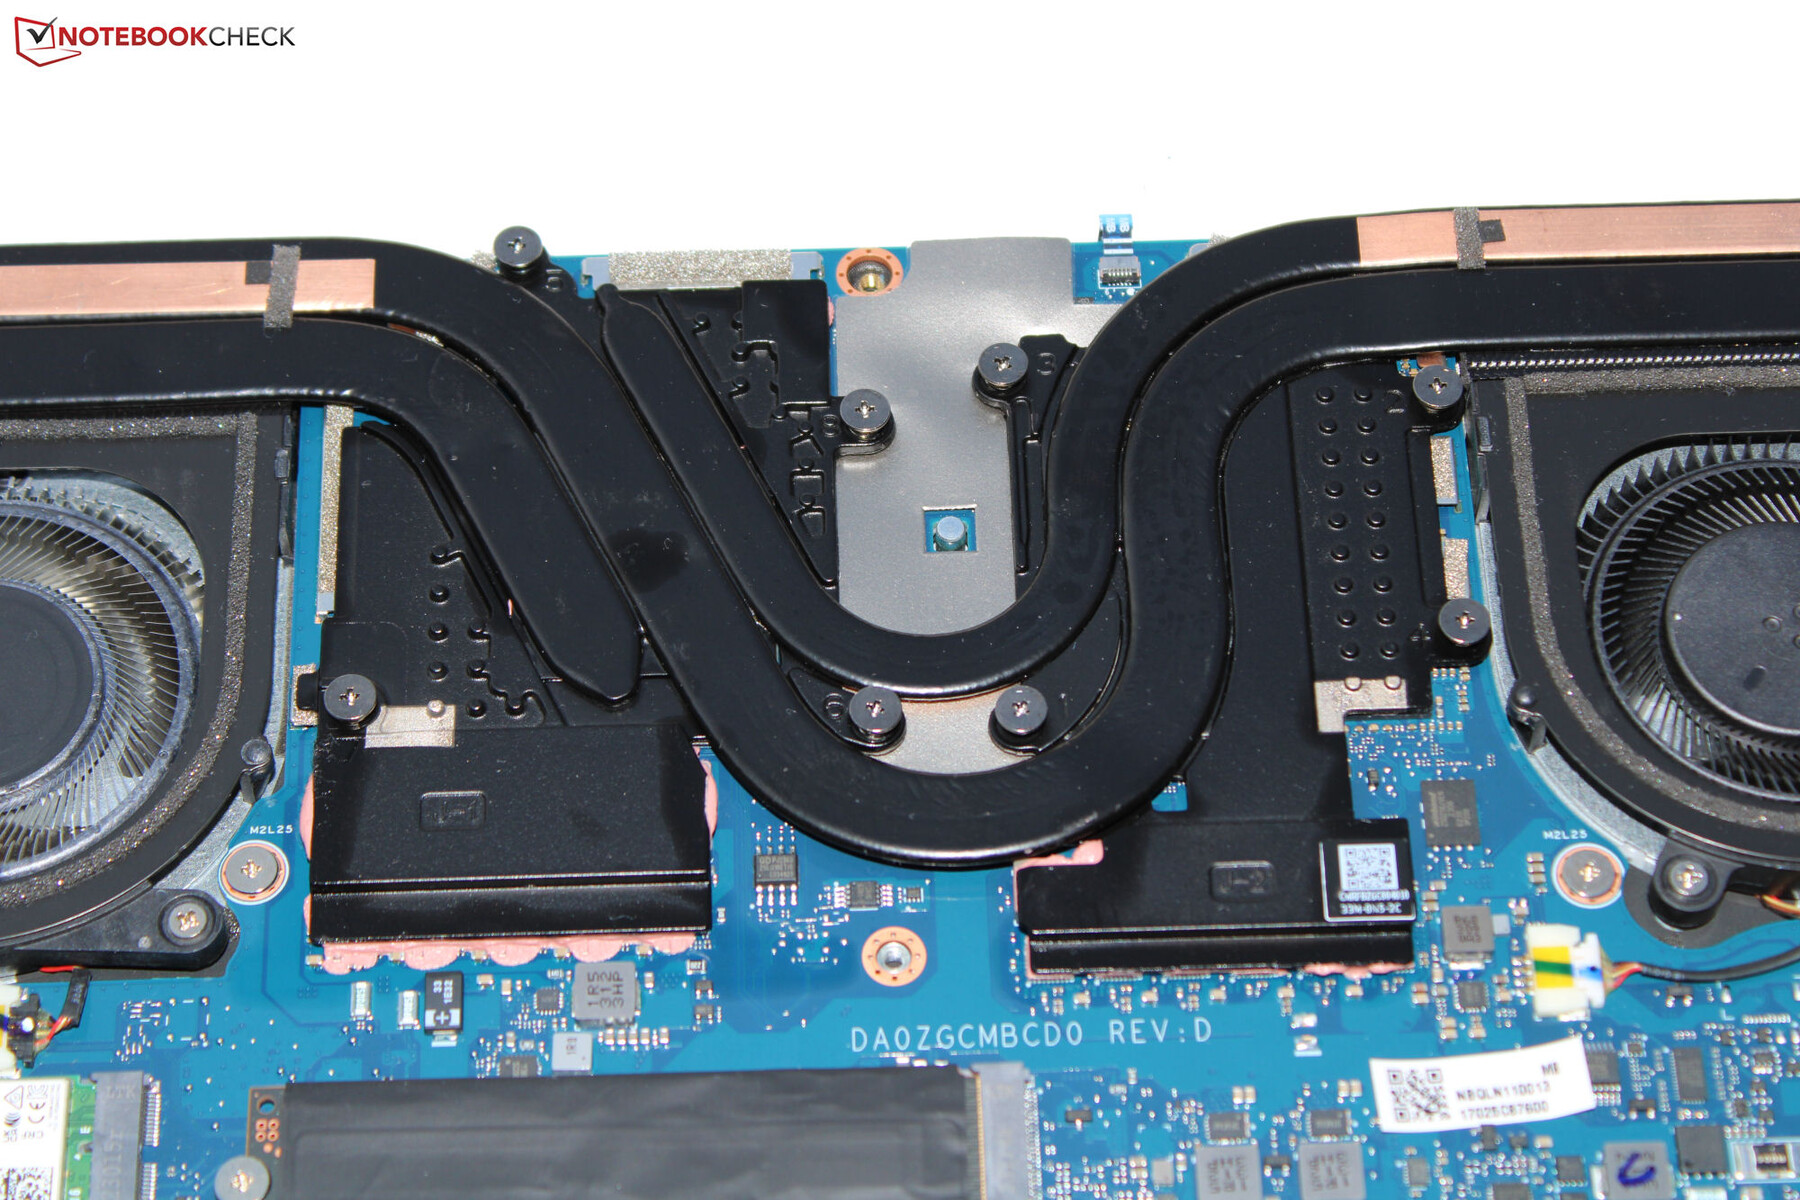
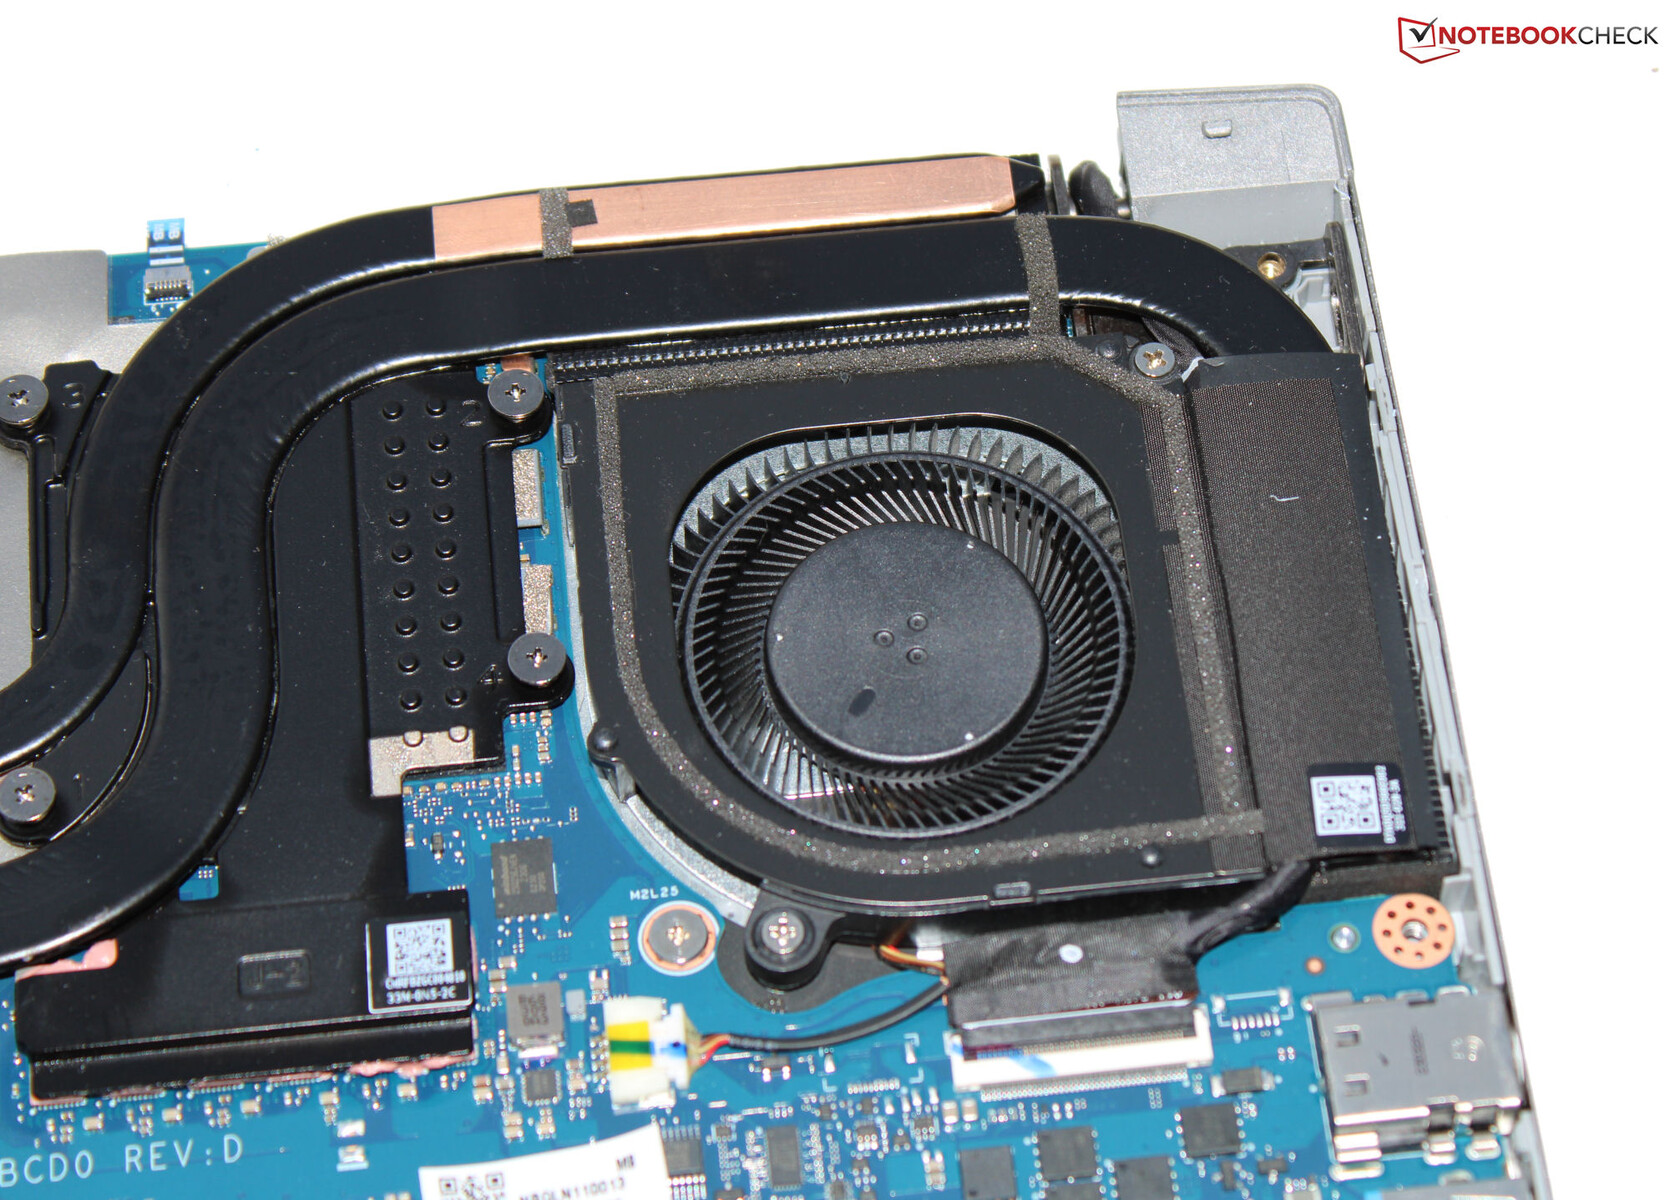
Maintenance
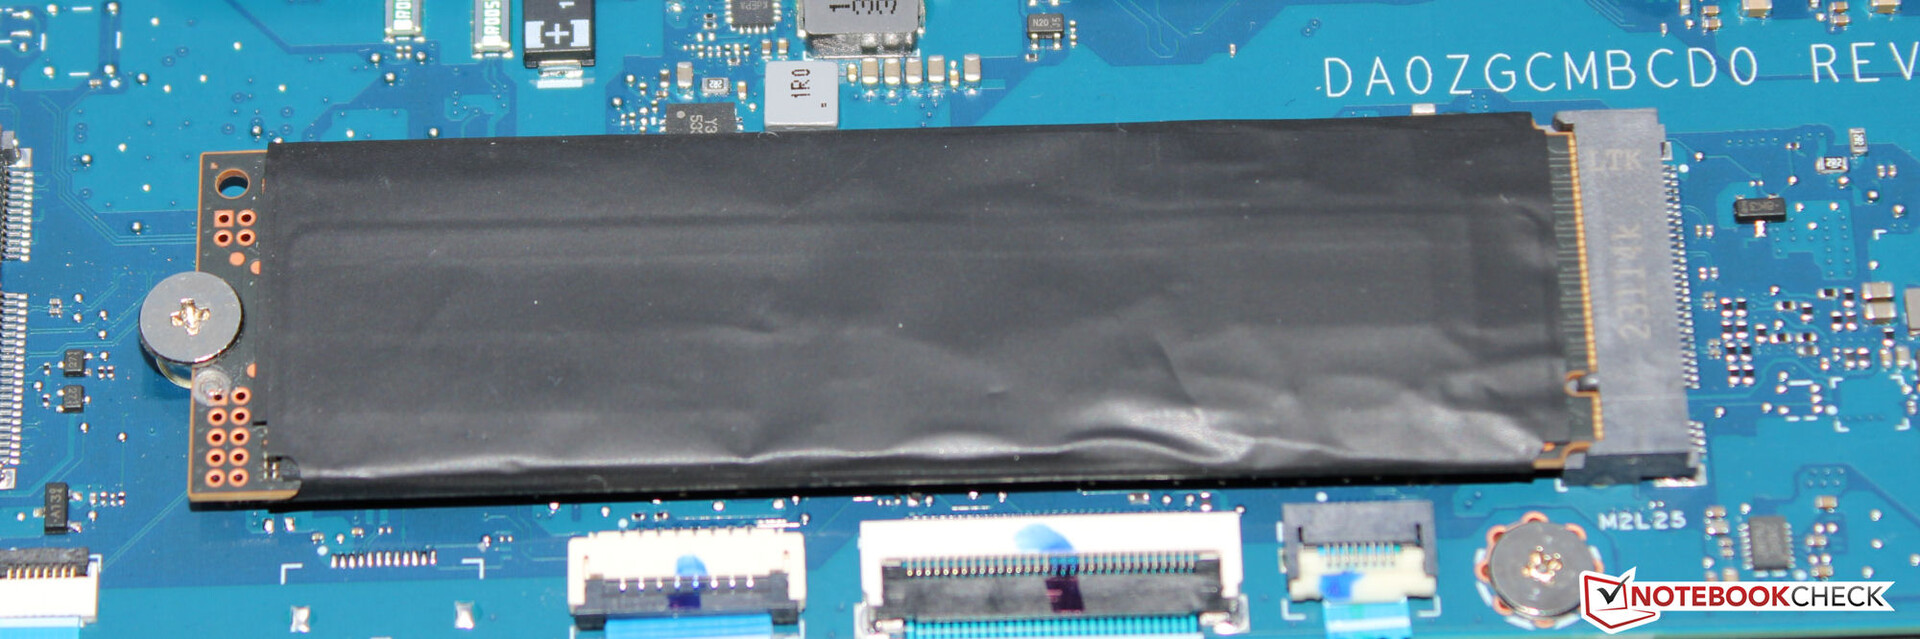
After removing all of the screws on the base of the device, the lower shell can be removed with the help of a plectrum. Consequently, this helps gain access to the SSD (PCIe 4, M.2 2280), the BIOS battery, the Wi-Fi module, fans, speakers and the battery.

Warranty
Acer has granted the 14-inch device a two-year warranty (applicable to Germany). Extending this to three years costs almost $100.
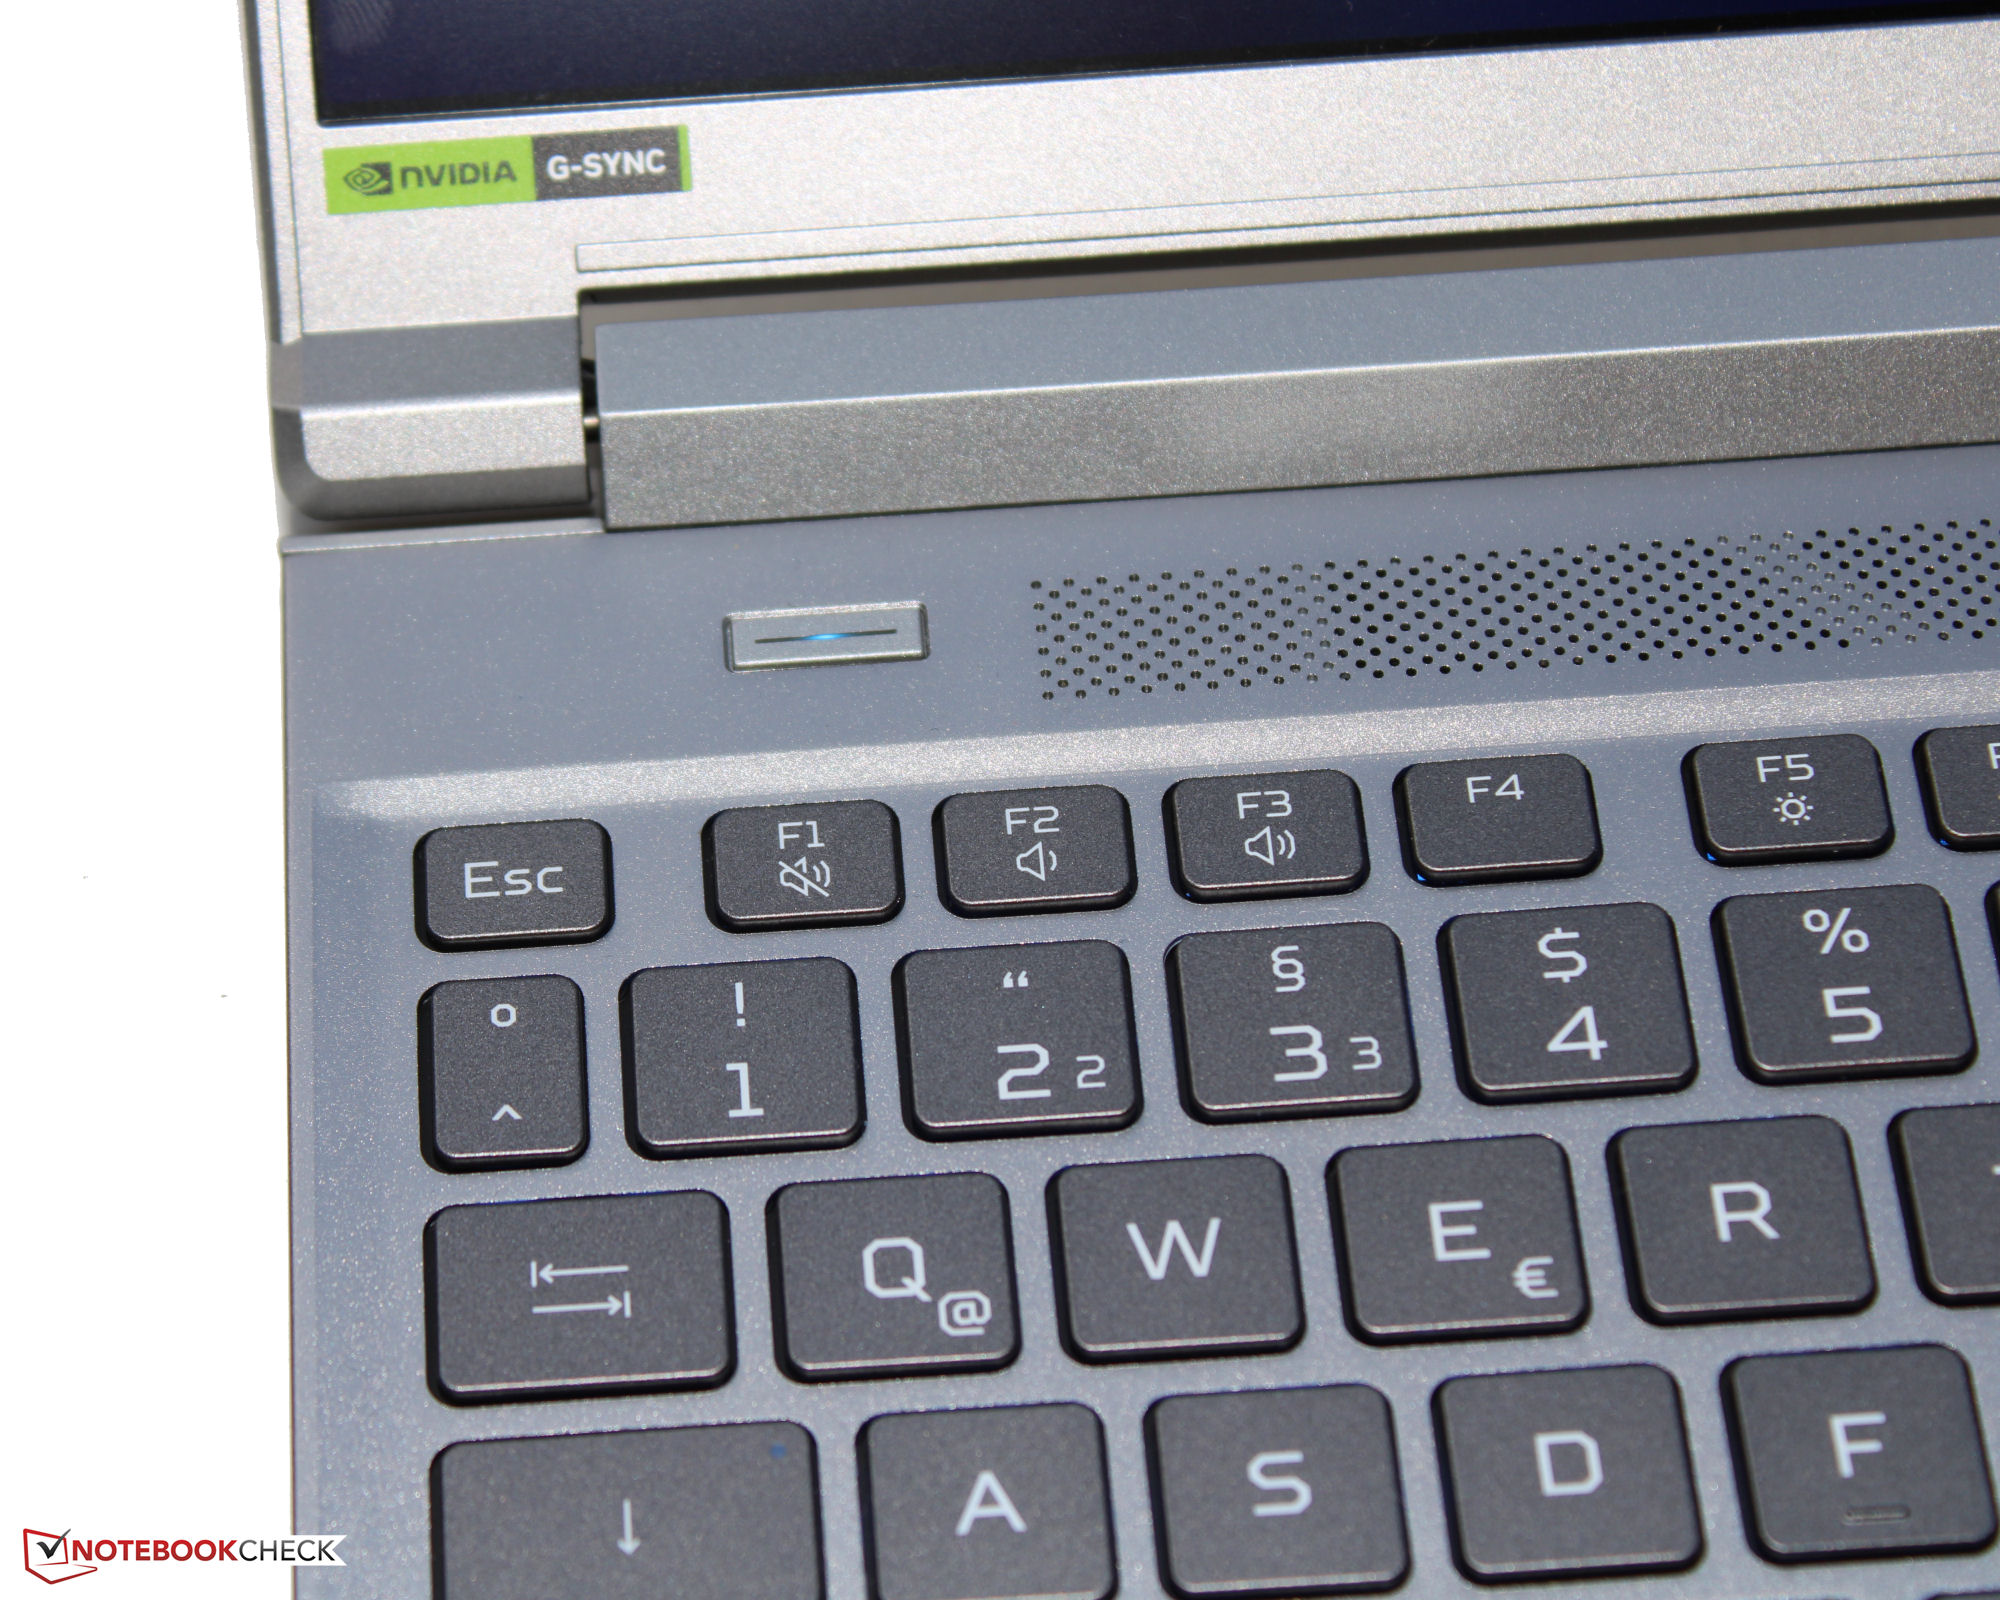
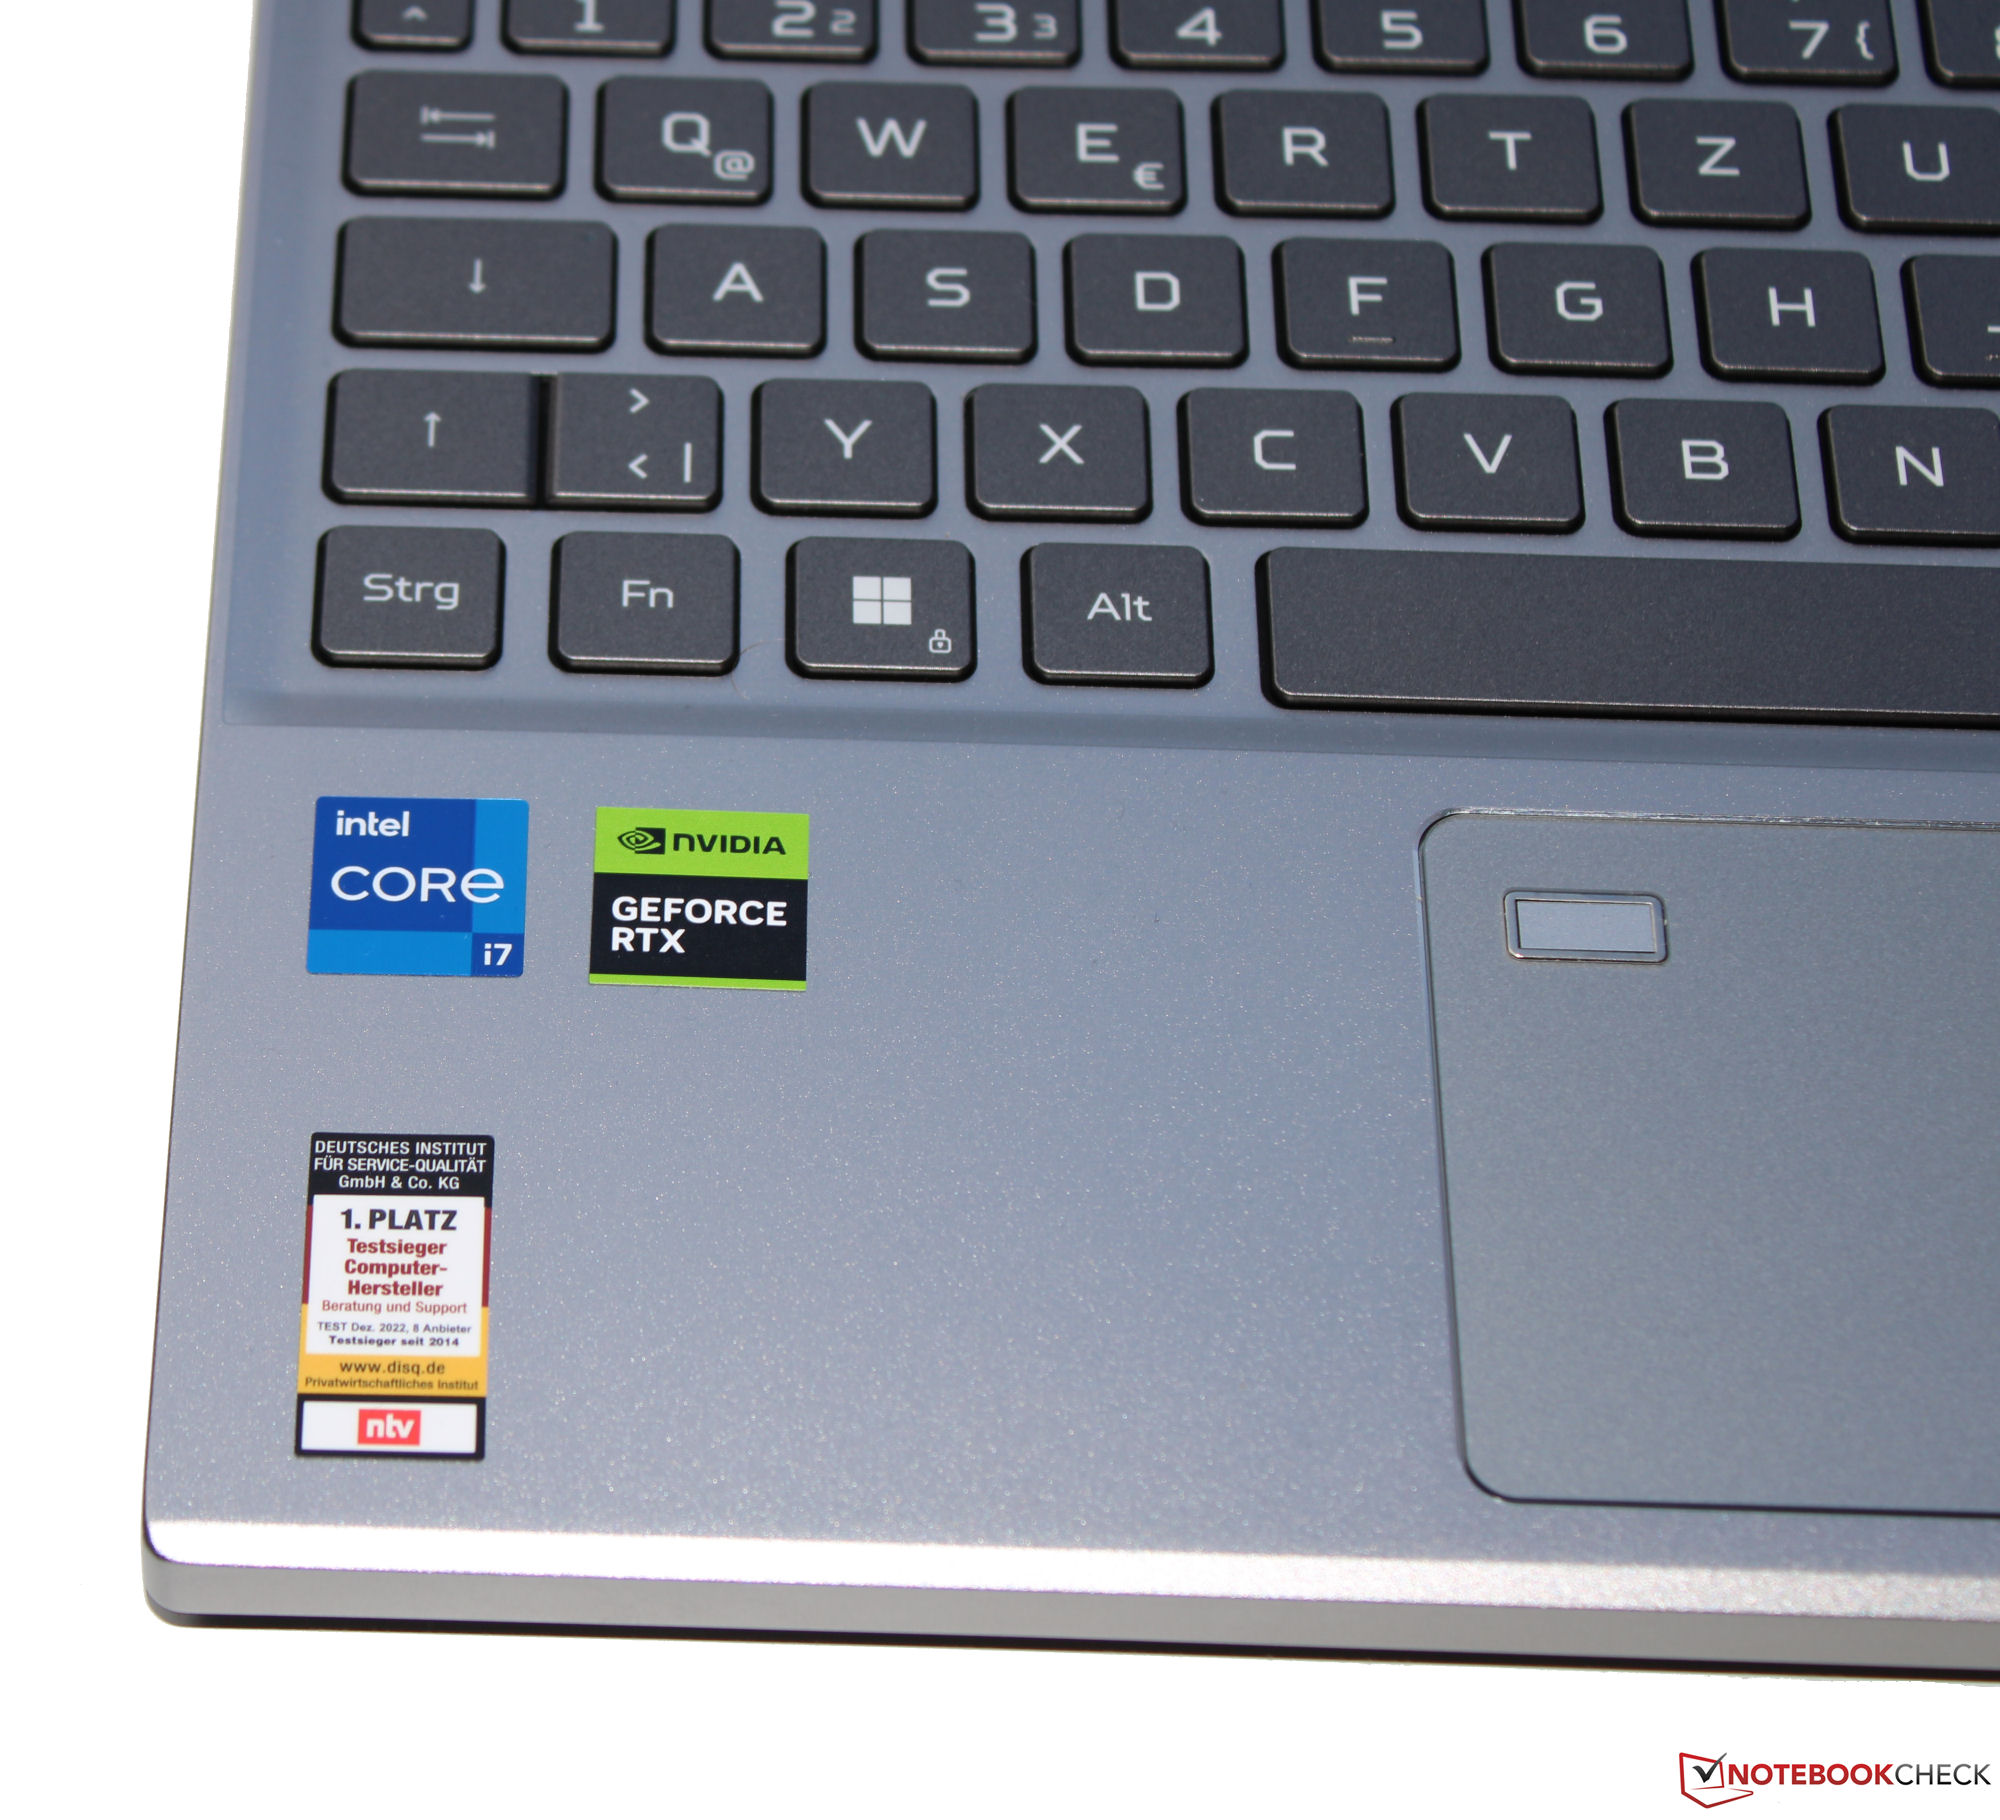
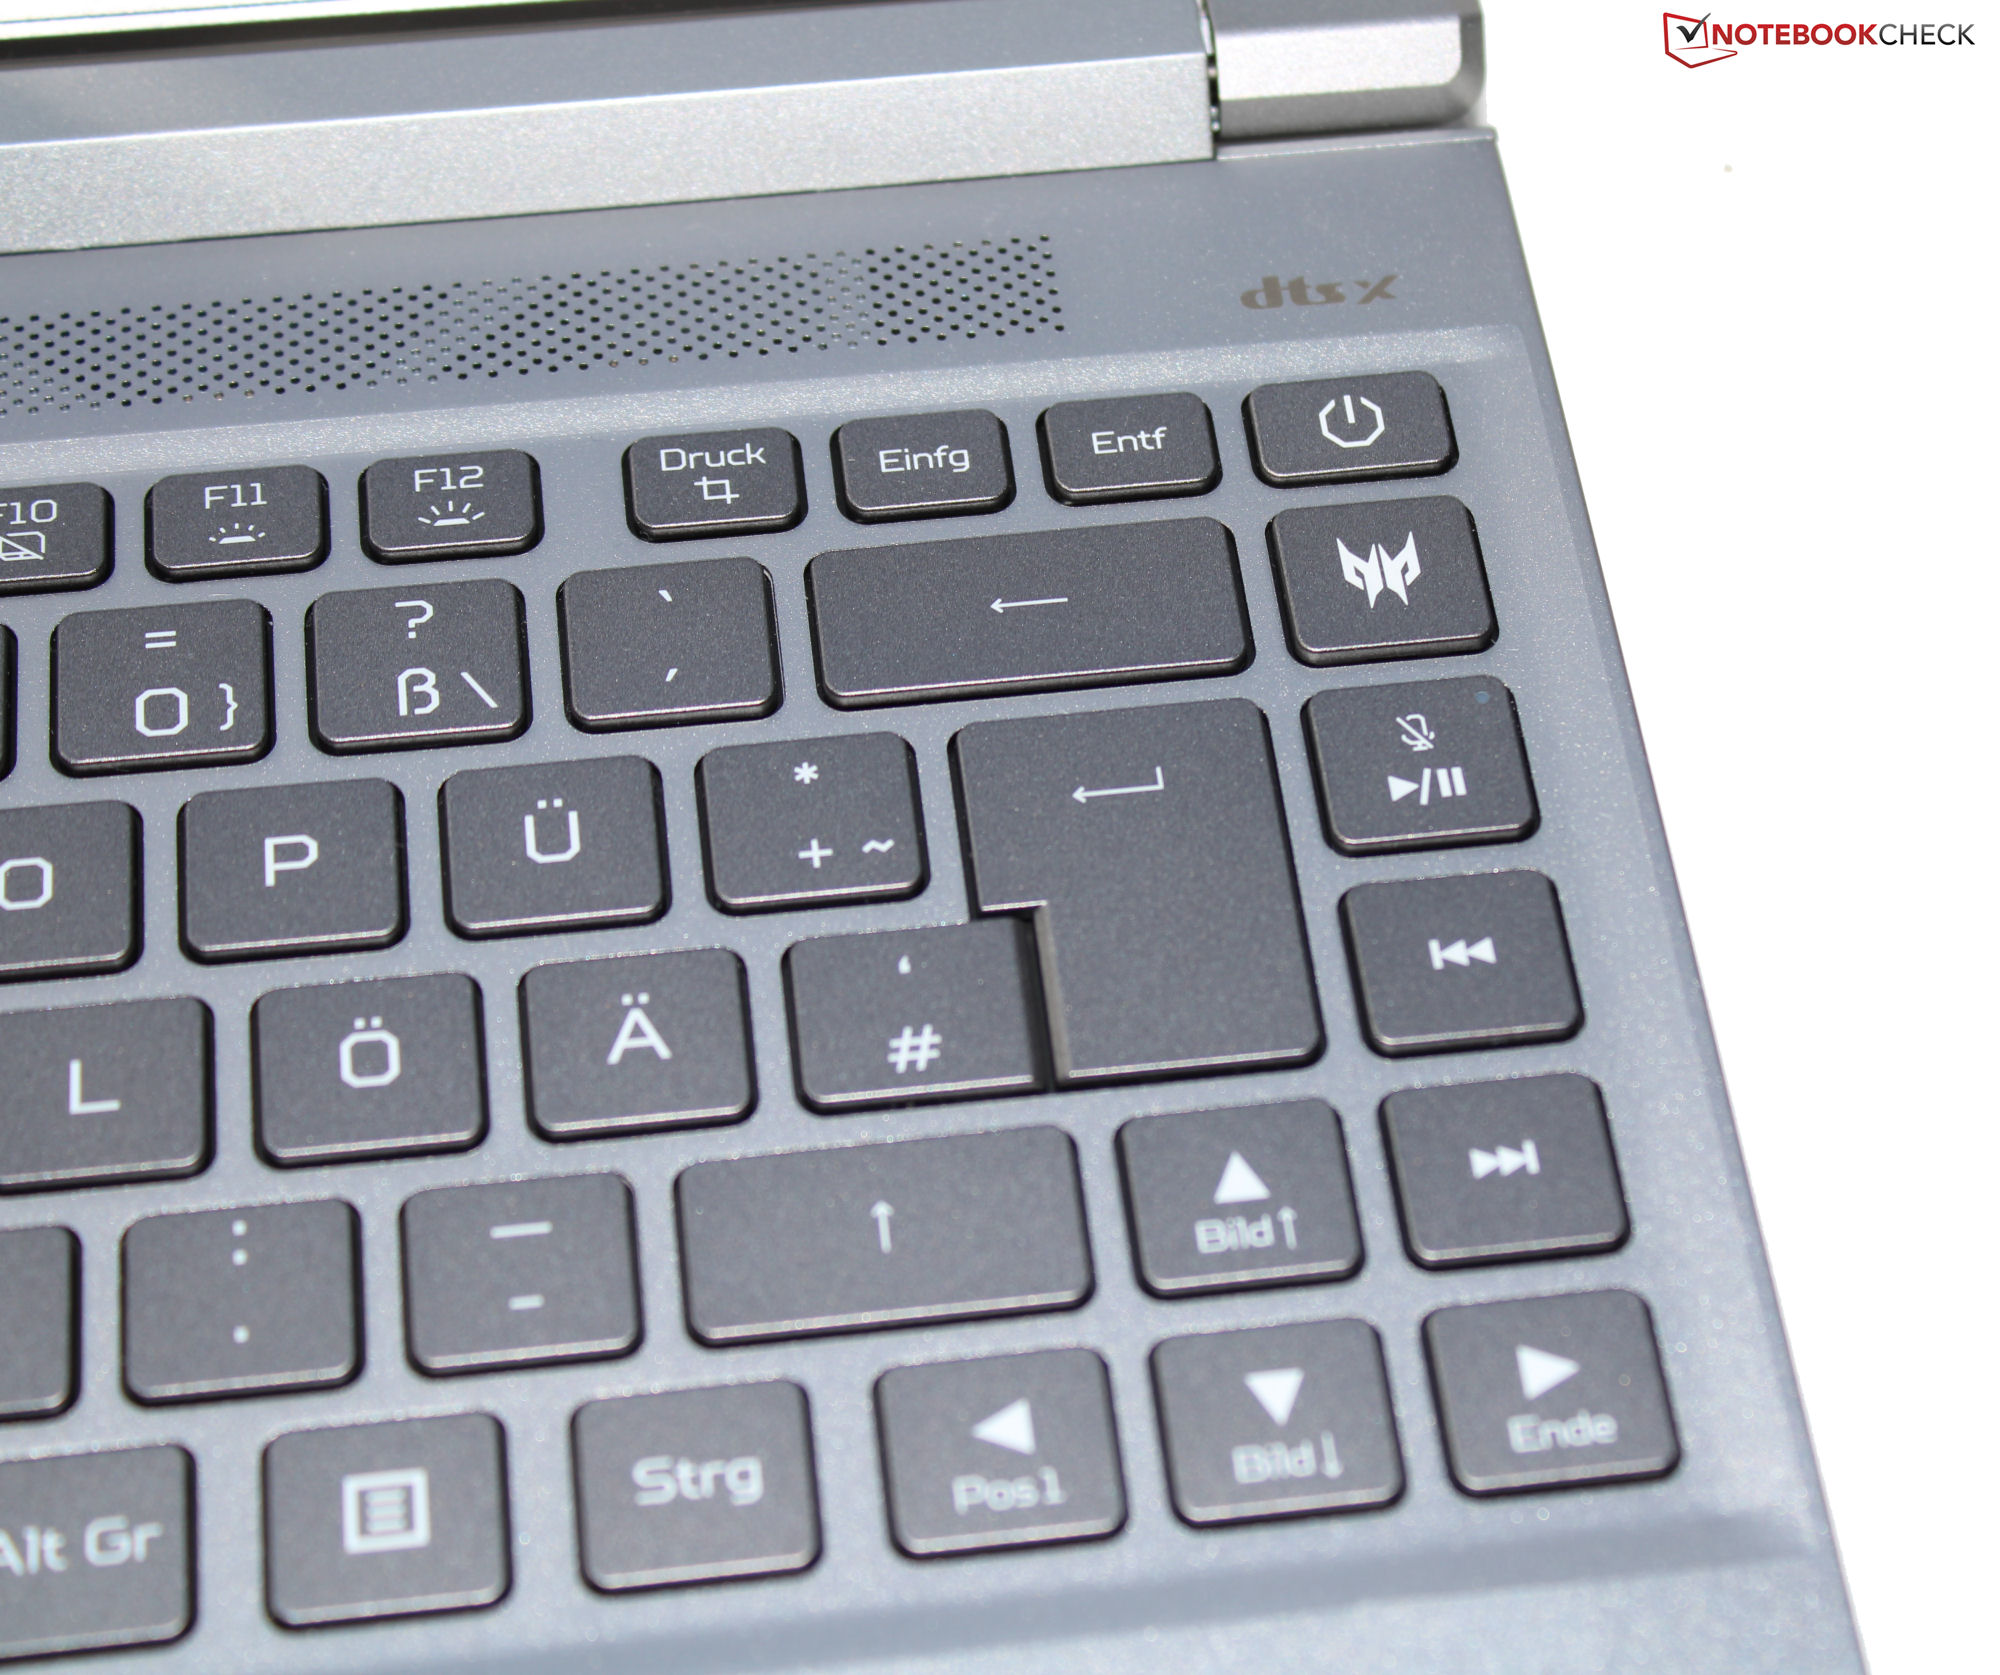
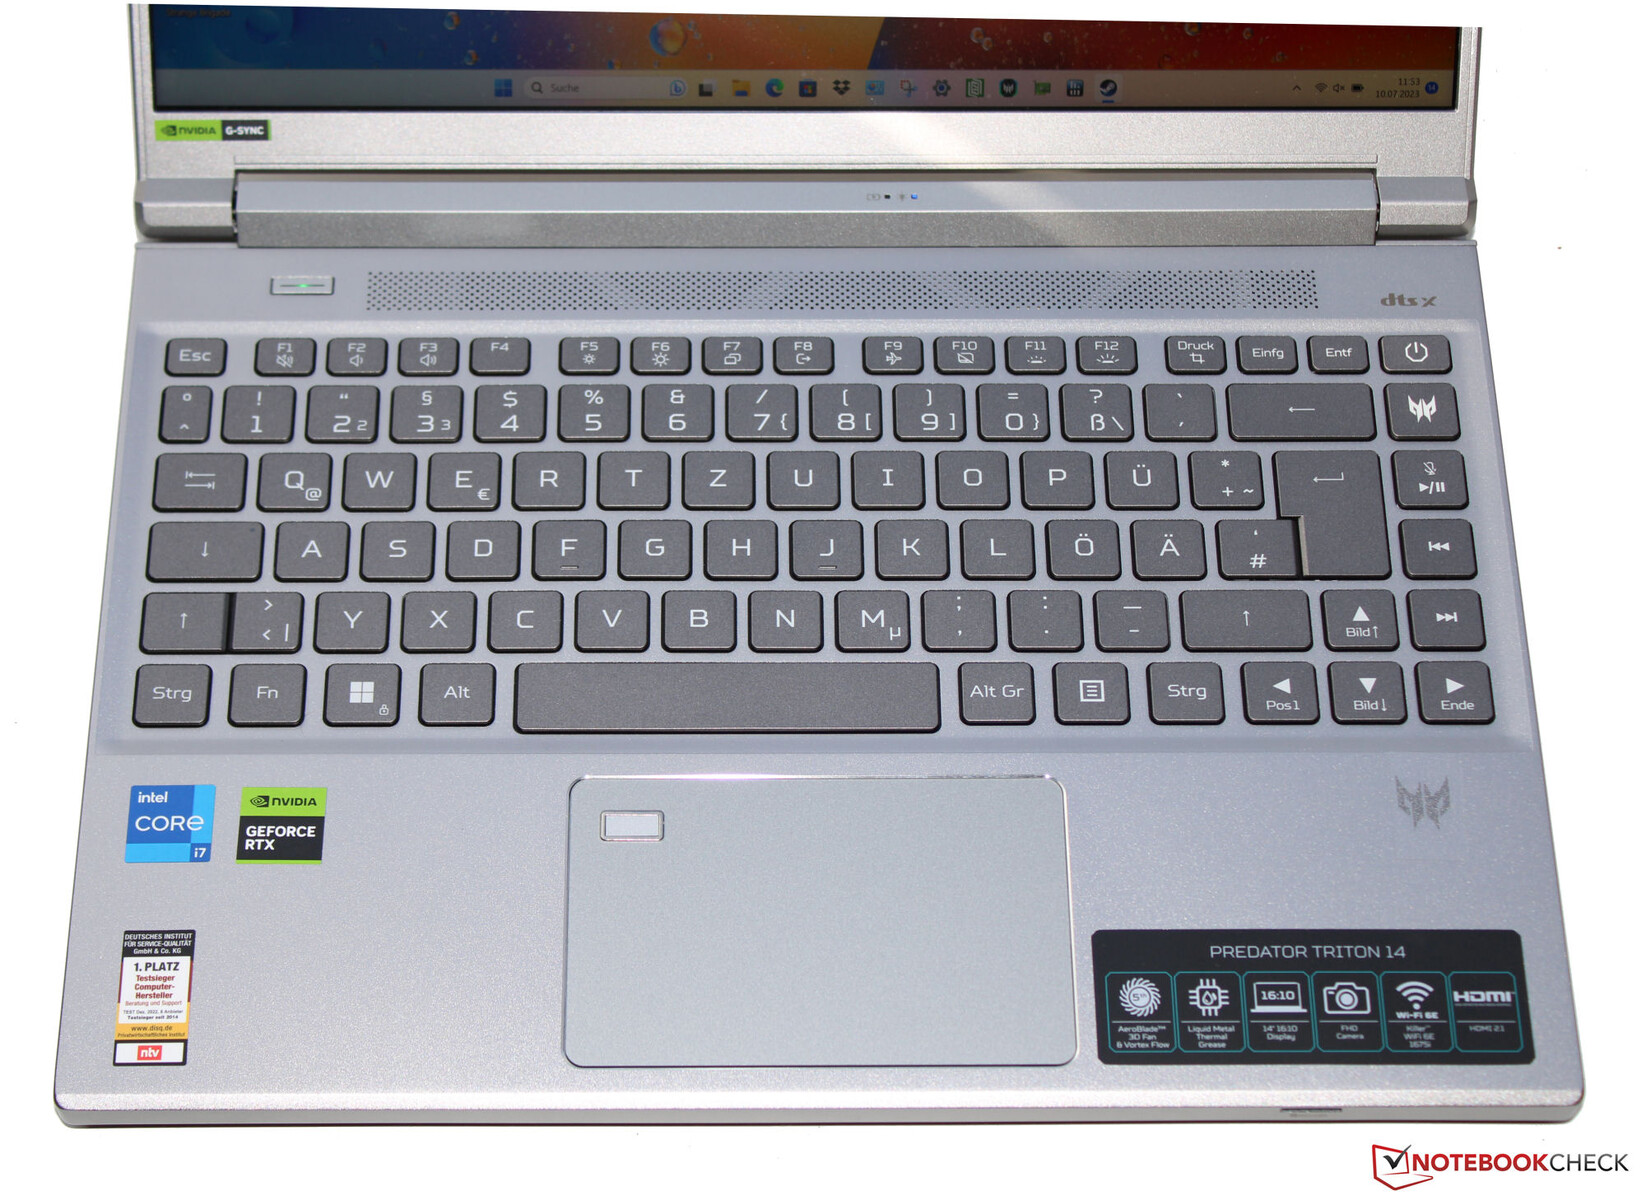
Input devices - The Acer Predator comes with RGB key lighting
Keyboard
The chiclet keyboard's flat, smooth keys (RGB lighting) have short travel and a clearly defined pressure point and nice key resistance. When typing, the keyboard doesn't wobble. Good: All four arrow keys are normal-sized. Overall, Acer has provided a keyboard suitable for everyday use.
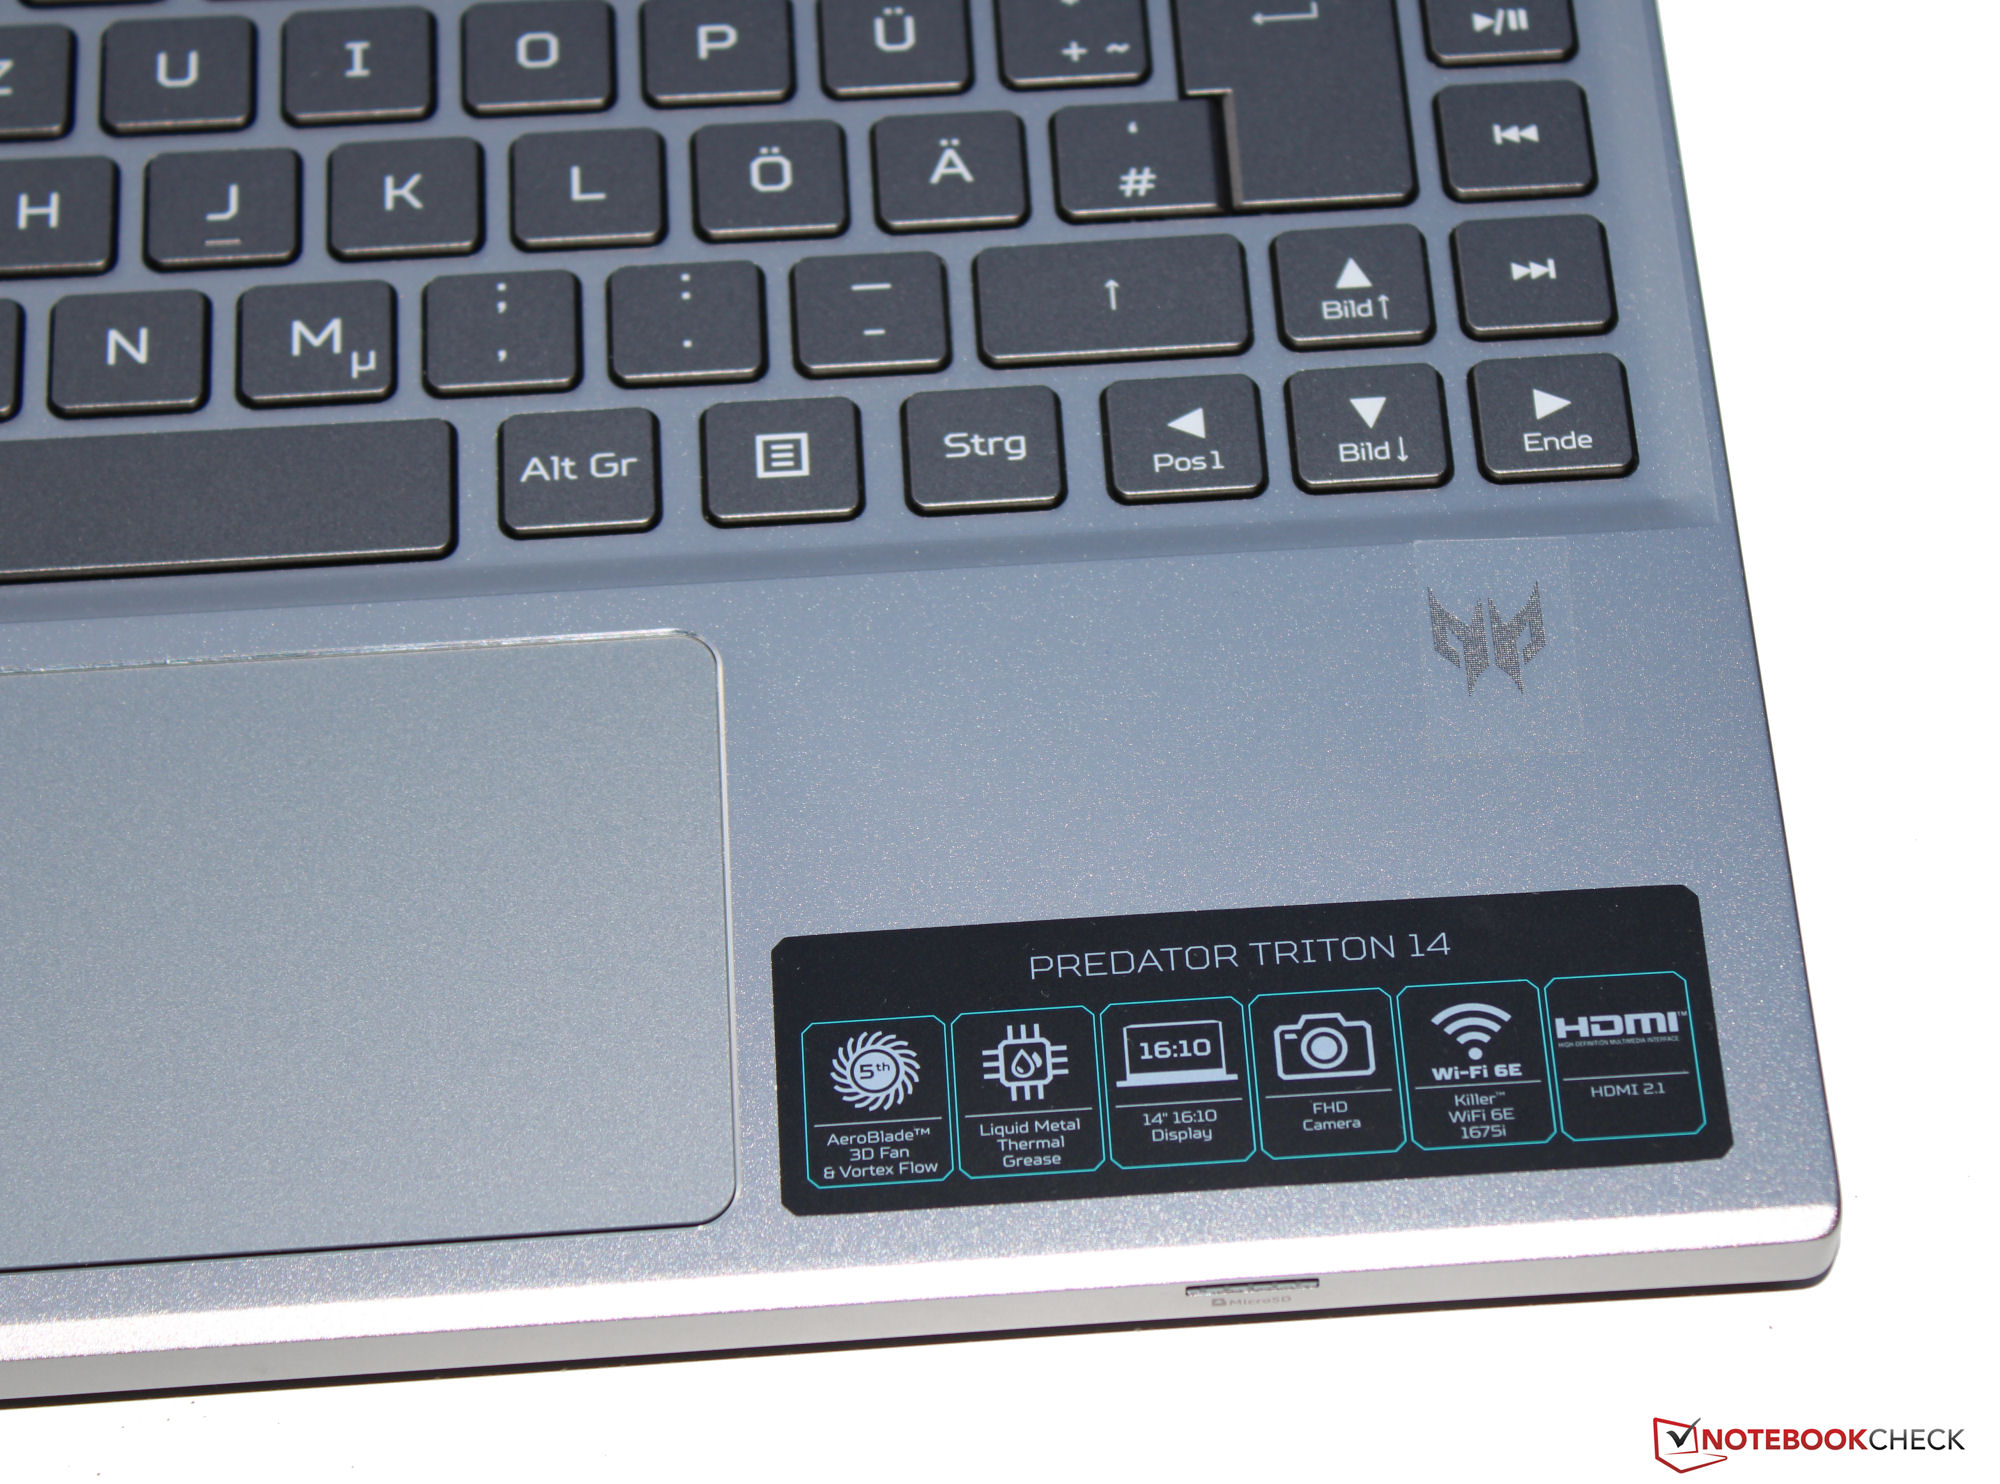
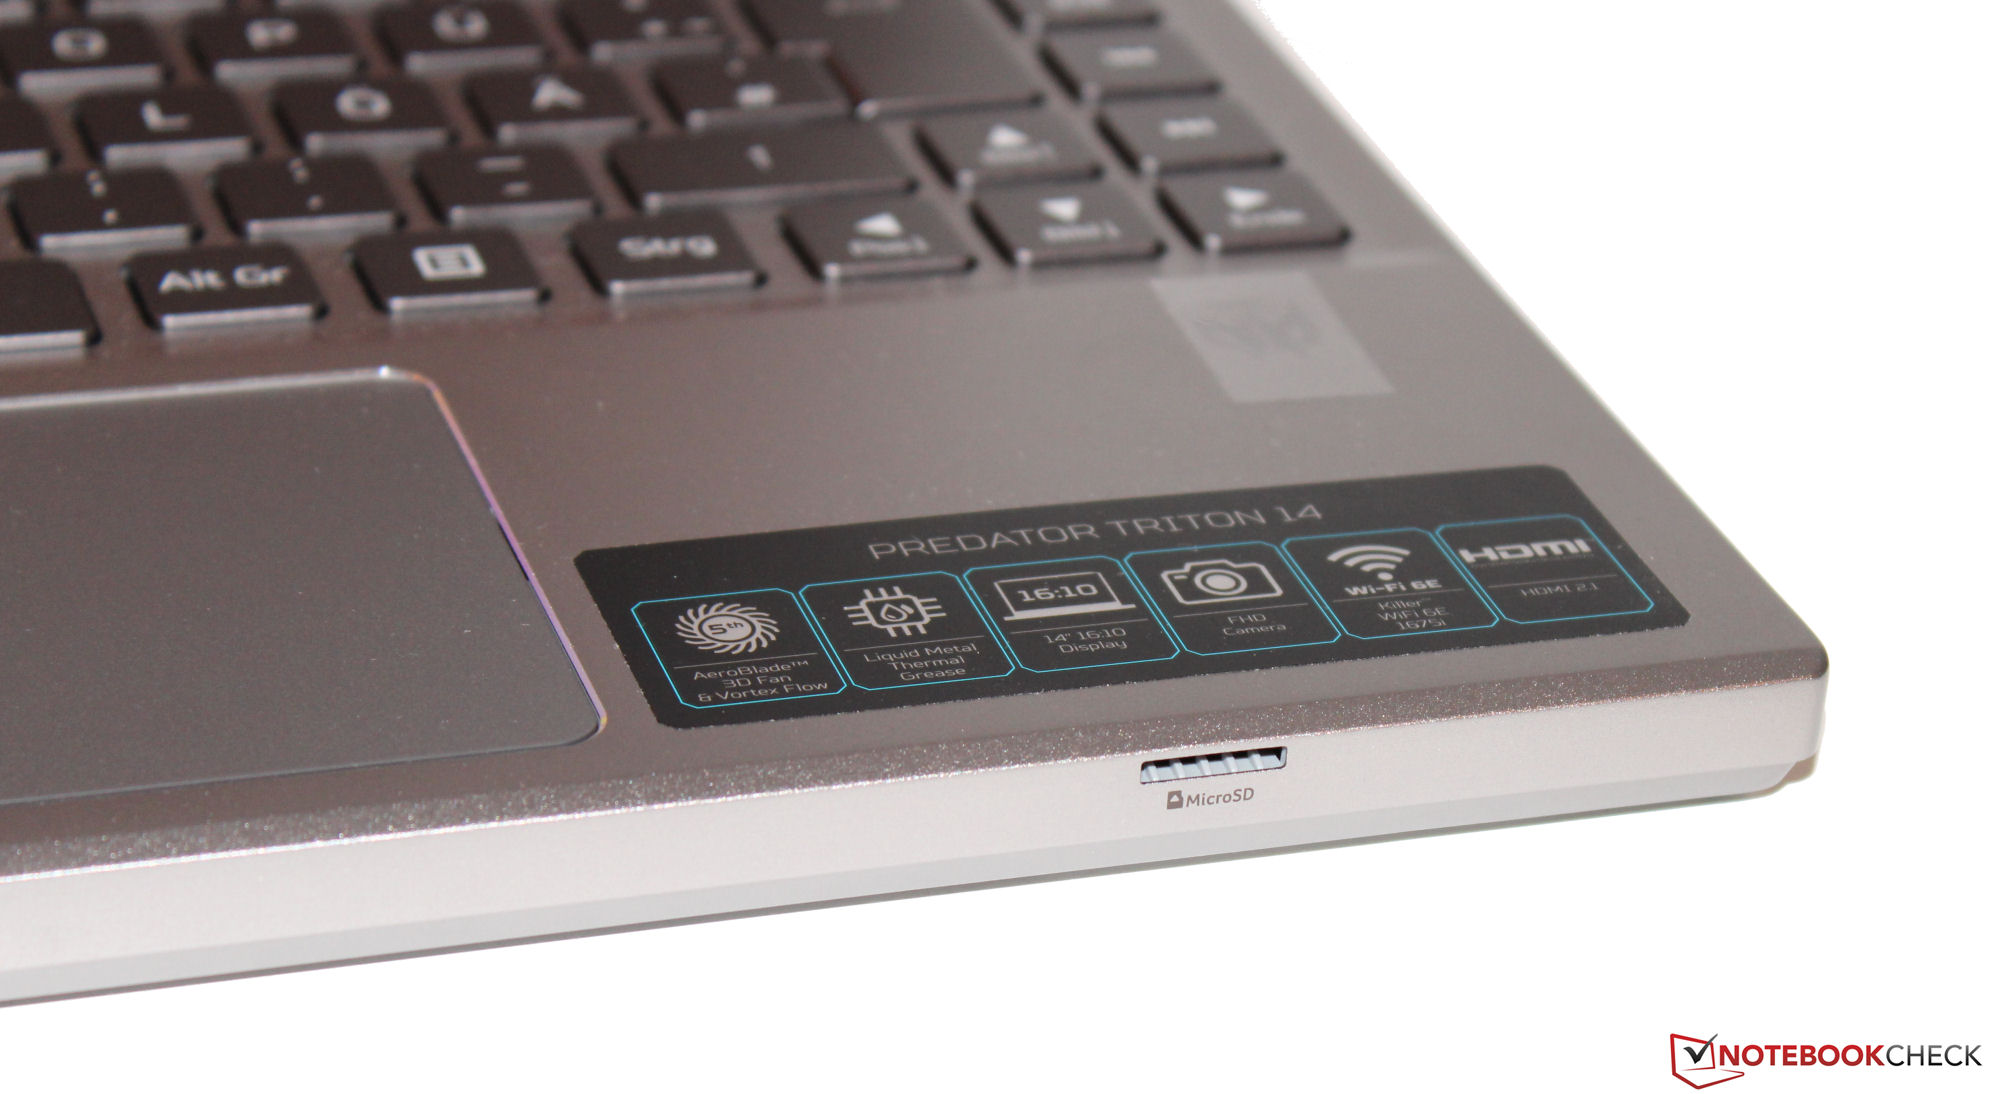
Touchpad
A mouse alternative comes in the form of a multi-touch capable Clickpad (around 10.5 x 6.5 cm) across which the user's fingers gilde effortlessly. It enjoys short travel and a clearly defined pressure point.
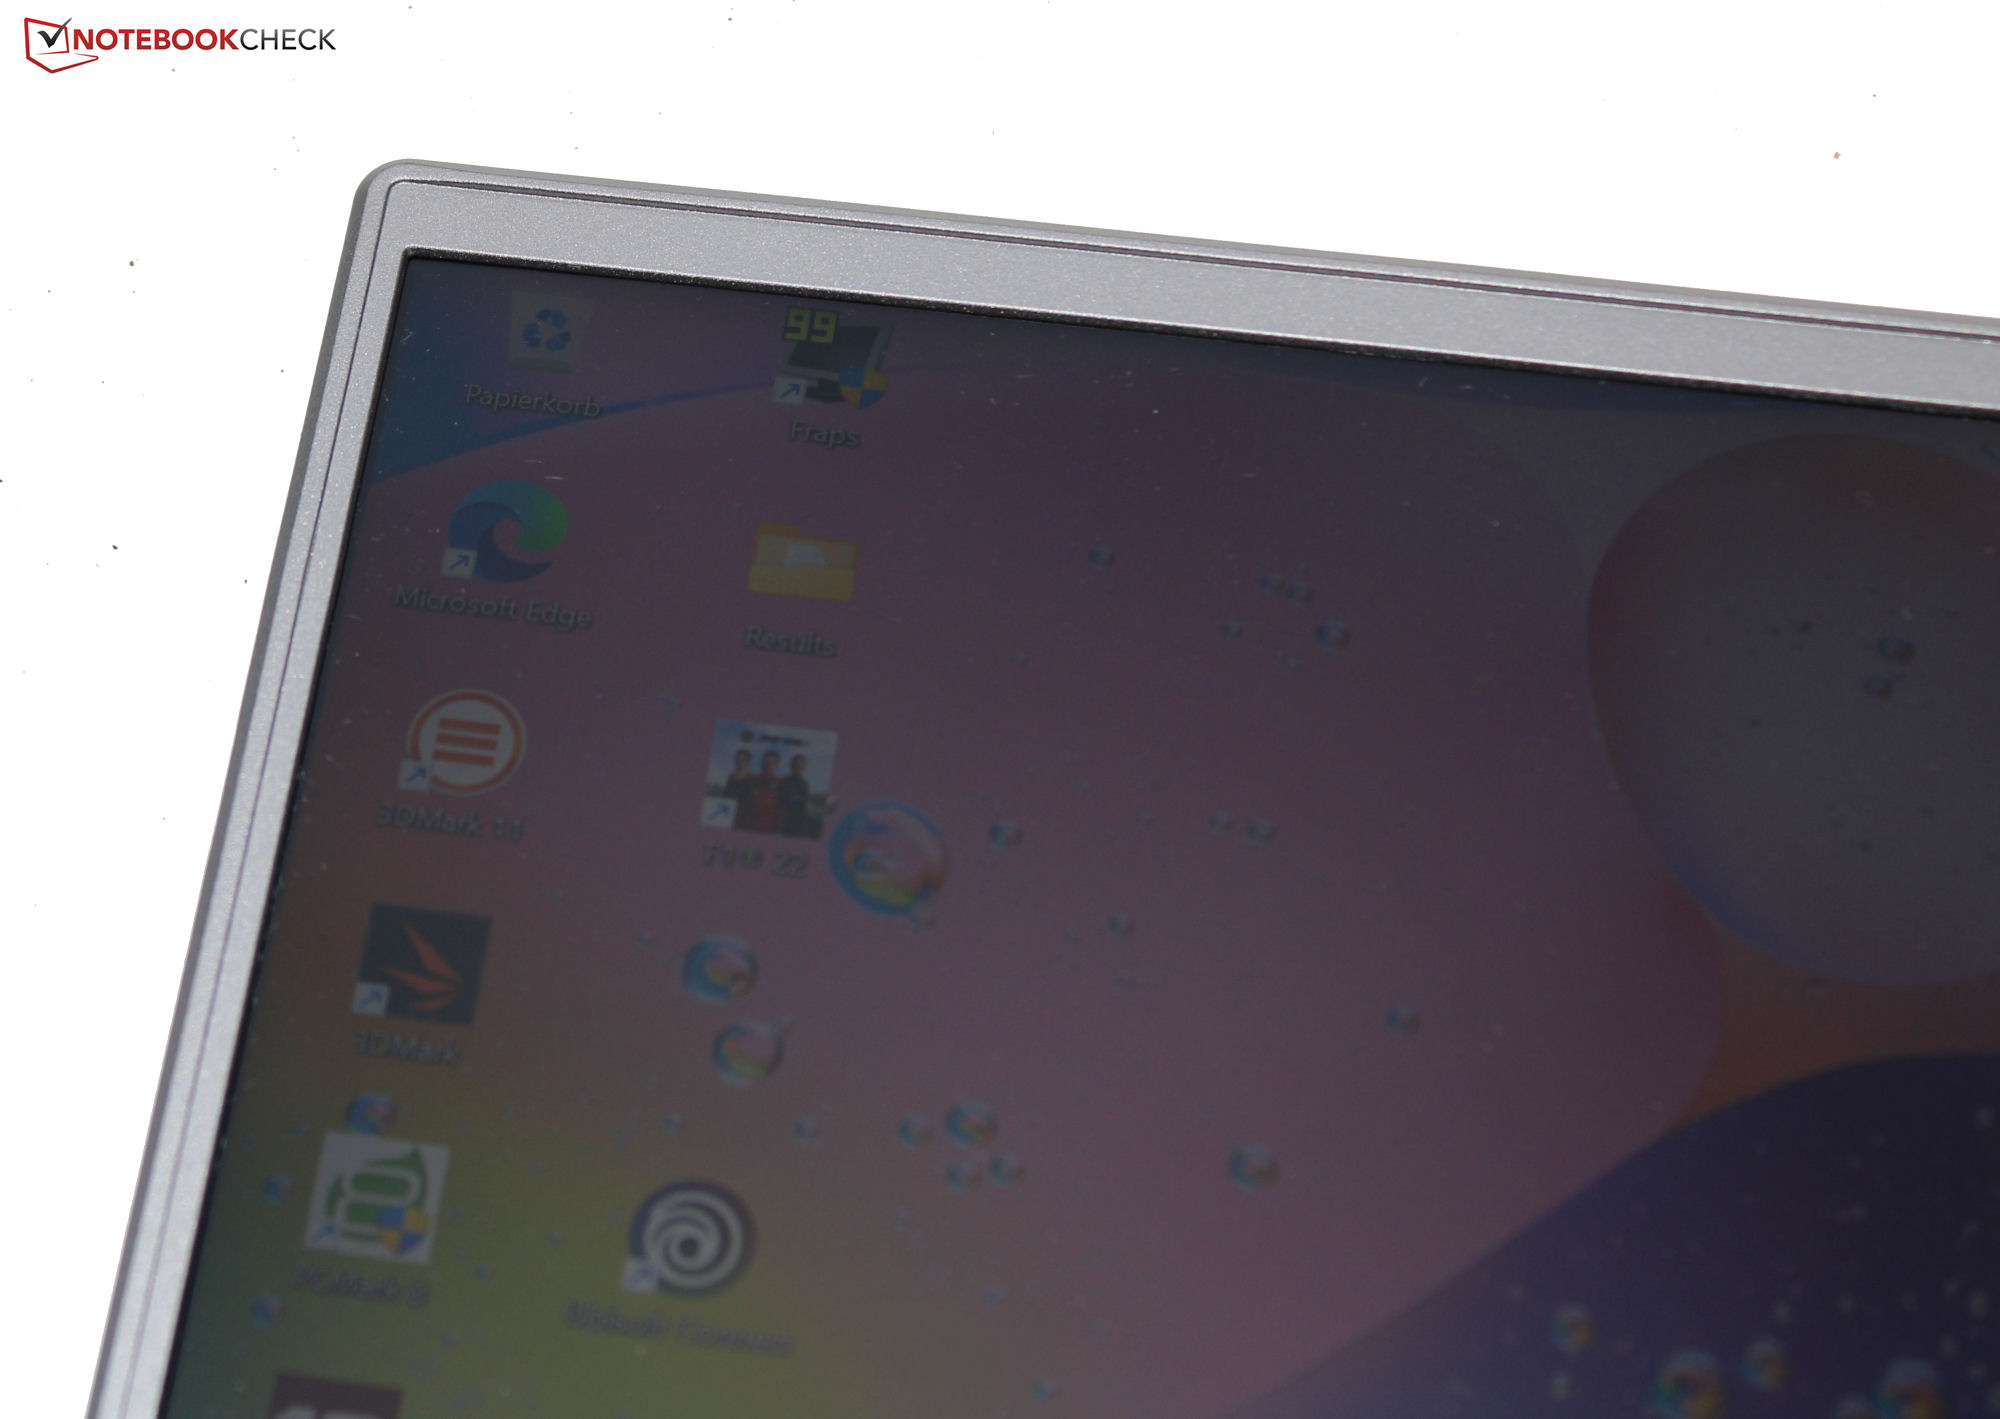
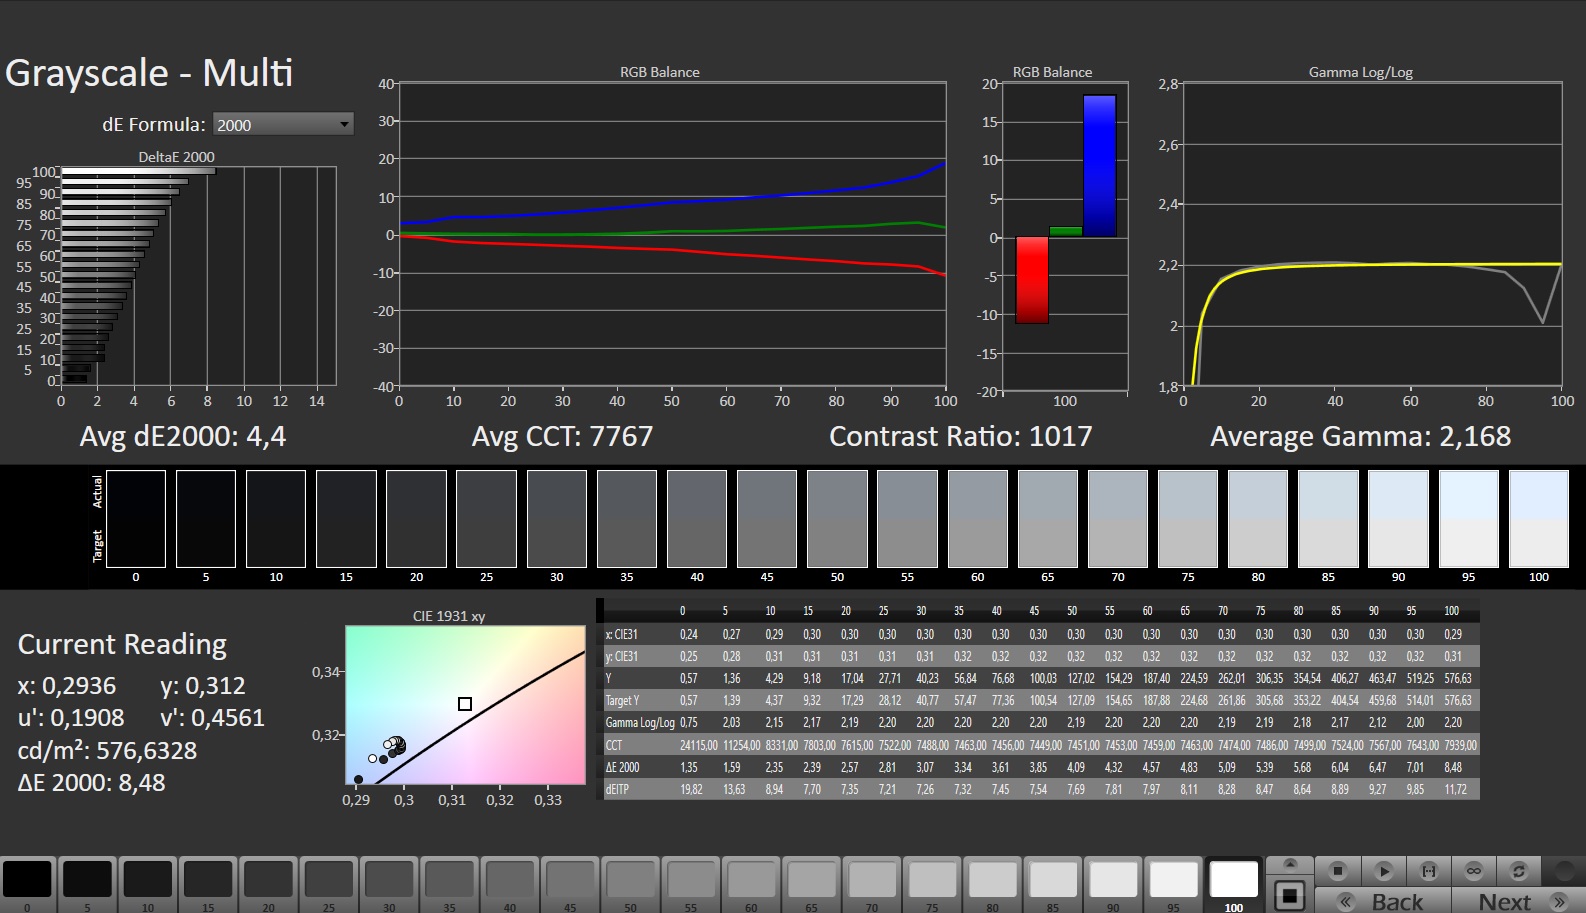
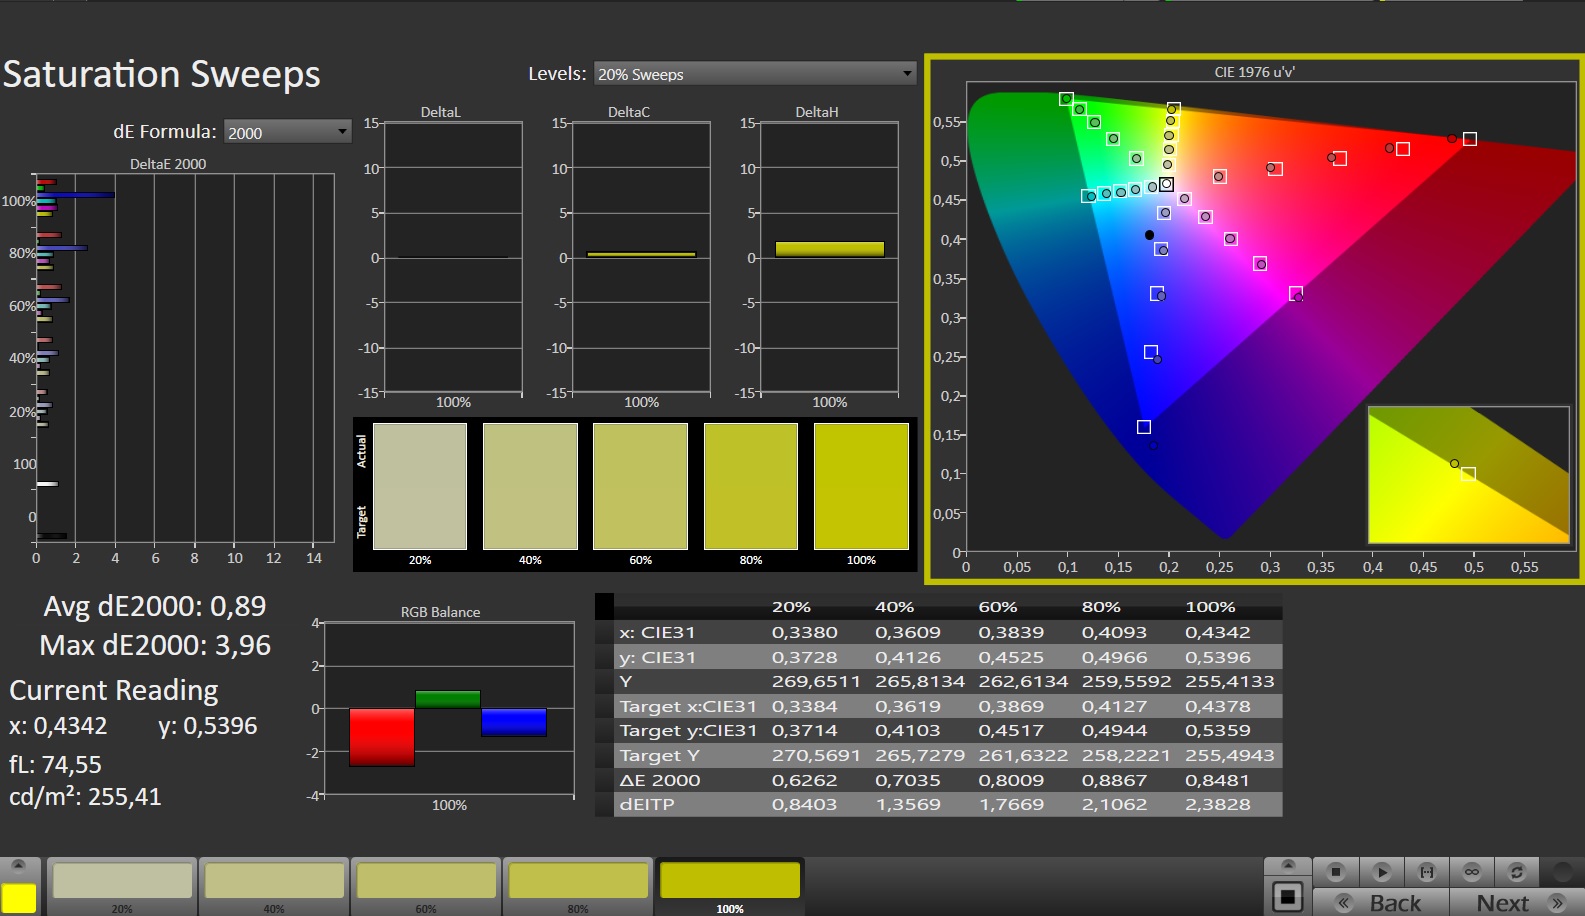
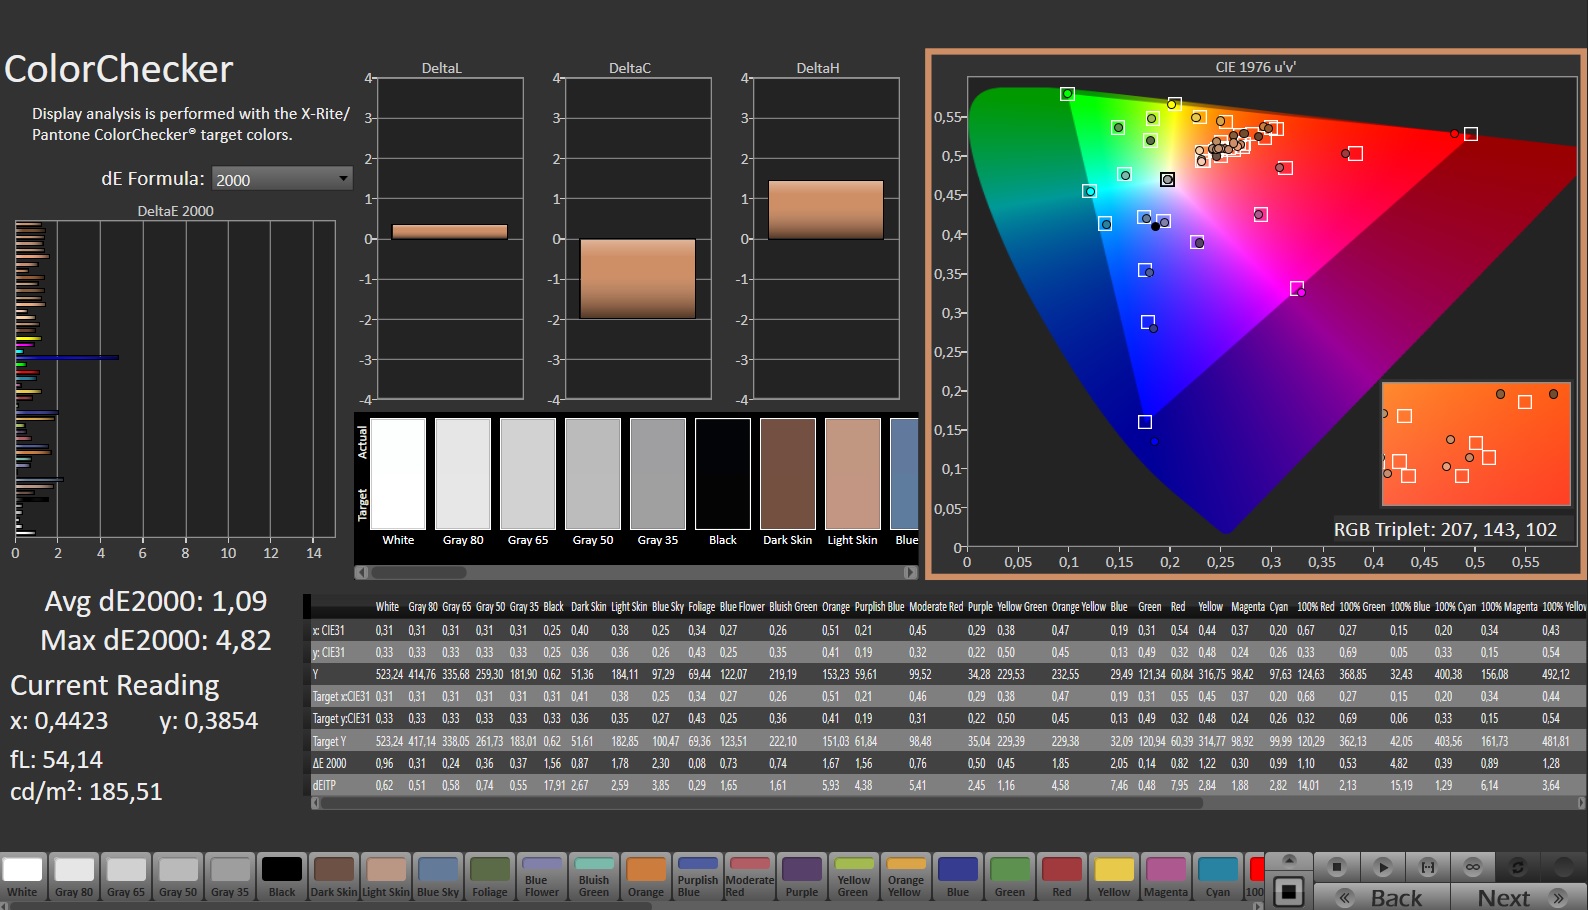
Display - Very bright with DCI P3 color coverage
Acer has equipped its Predator with a 14-inch display (2,560 x 1,600 pixels) in a work-friendly, 16:10 aspect ratio. On the plus side, there is G-Sync support, the absence of PWM flickering, short response times and high average brightness of 516.2 cd/m². The contrast ratio (944:1) just misses its target value (> 1.000:1).
The alternatively available mini-LED display (2,560 x 1,600 pixels) ought to have significantly higher contrast and comes with a DisplayHDR 600 certification.
| |||||||||||||||||||||||||
Brightness Distribution: 88 %
Center on Battery: 547 cd/m²
Contrast: 977:1 (Black: 0.56 cd/m²)
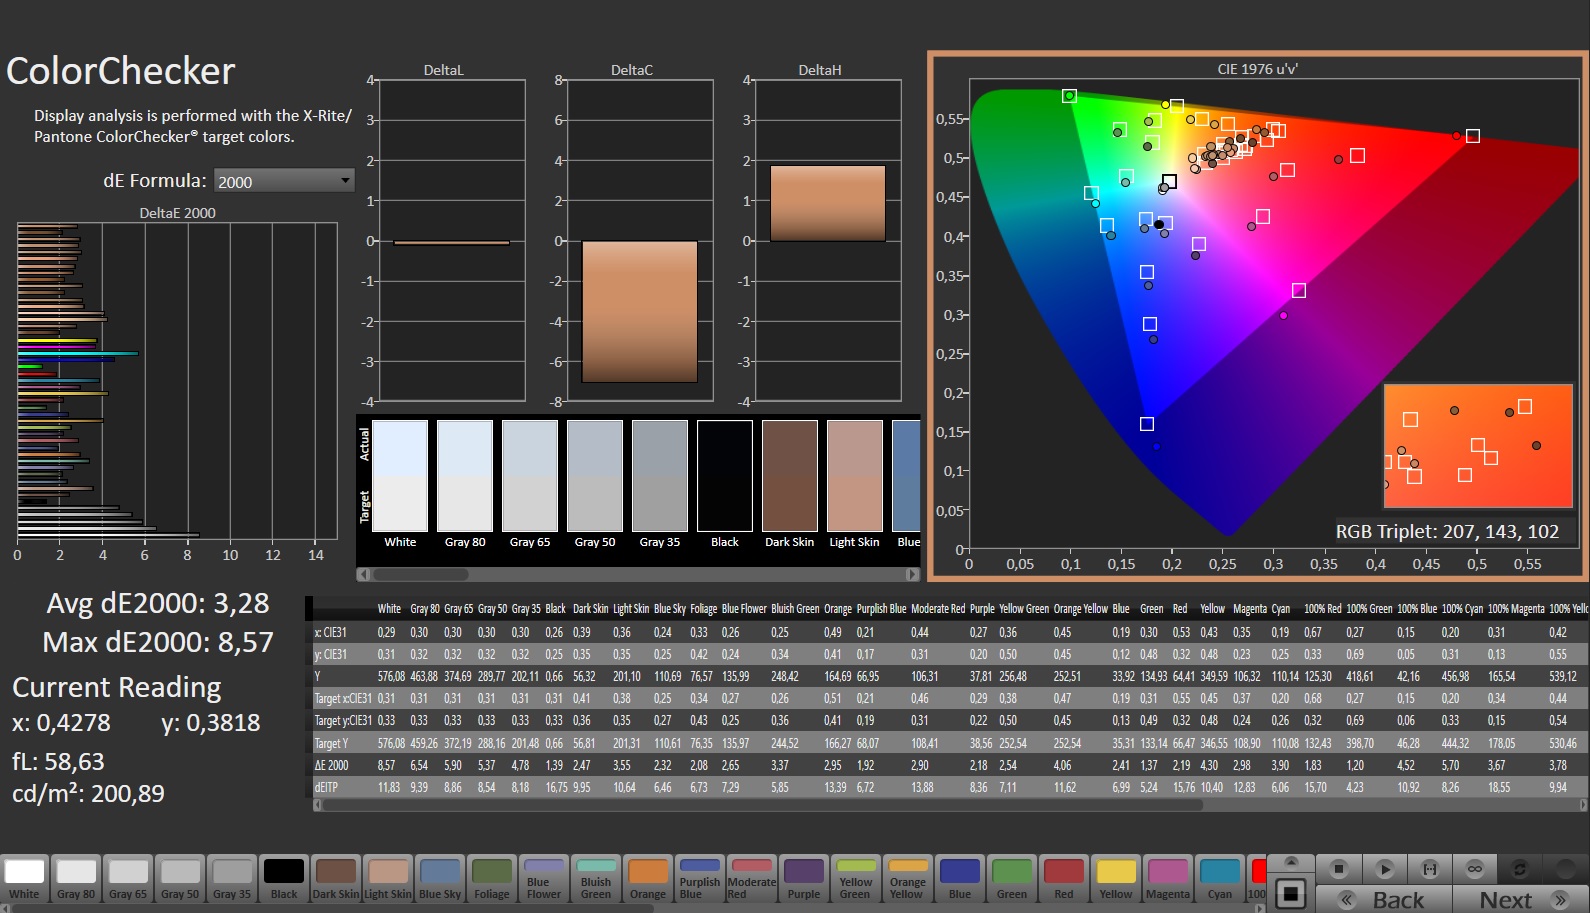
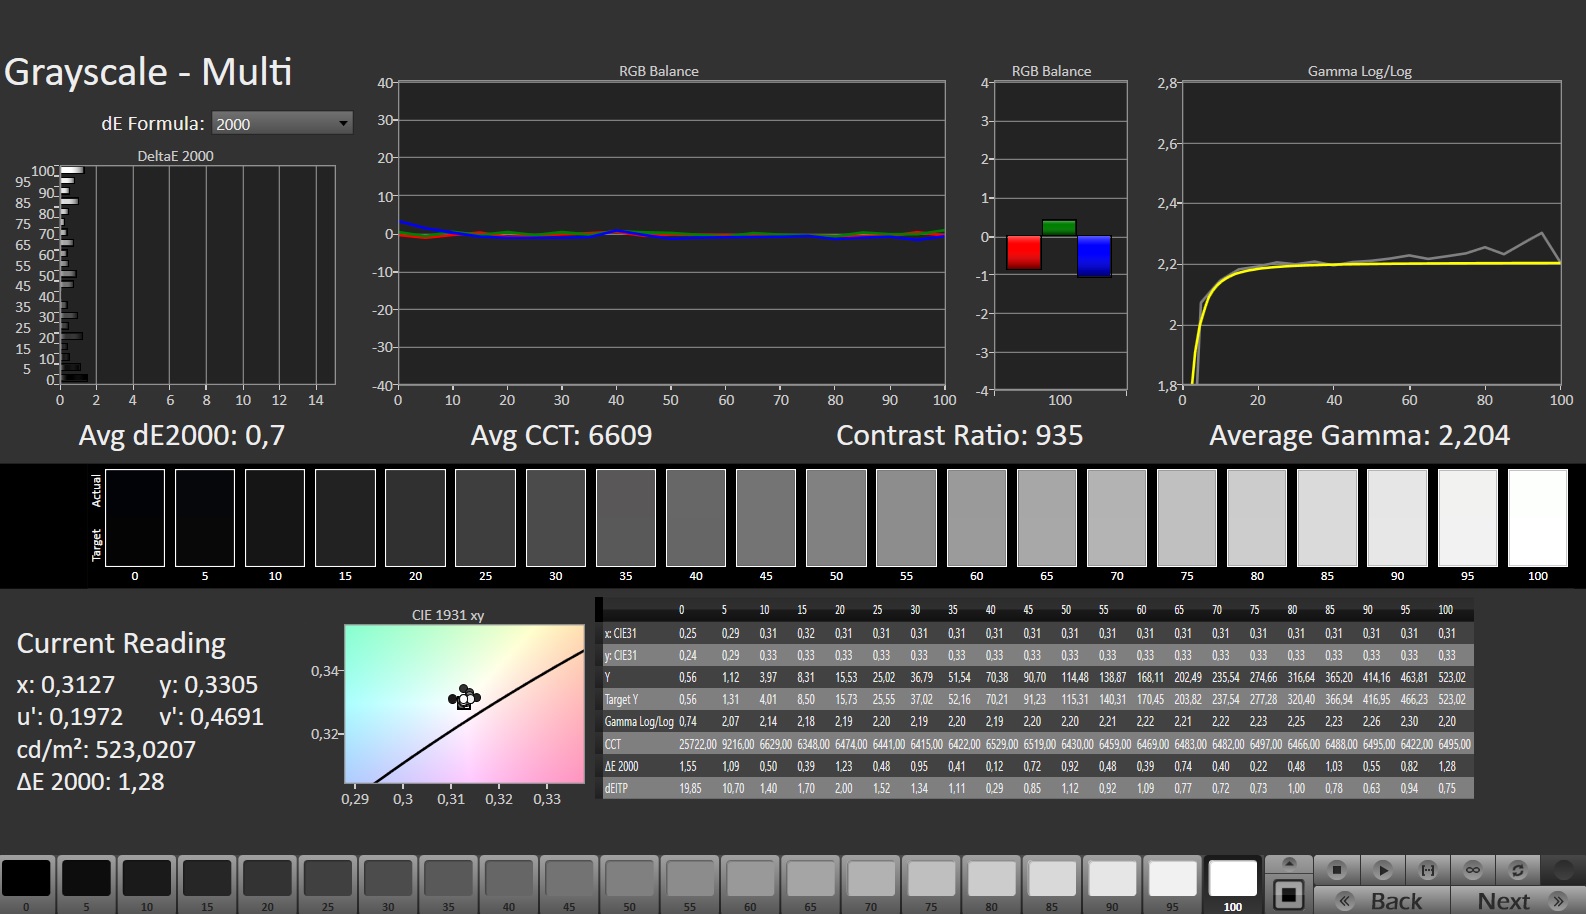
ΔE Color 3.28 | 0.5-29.43 Ø5.1, calibrated: 1.09
ΔE Greyscale 4.4 | 0.57-98 Ø5.3
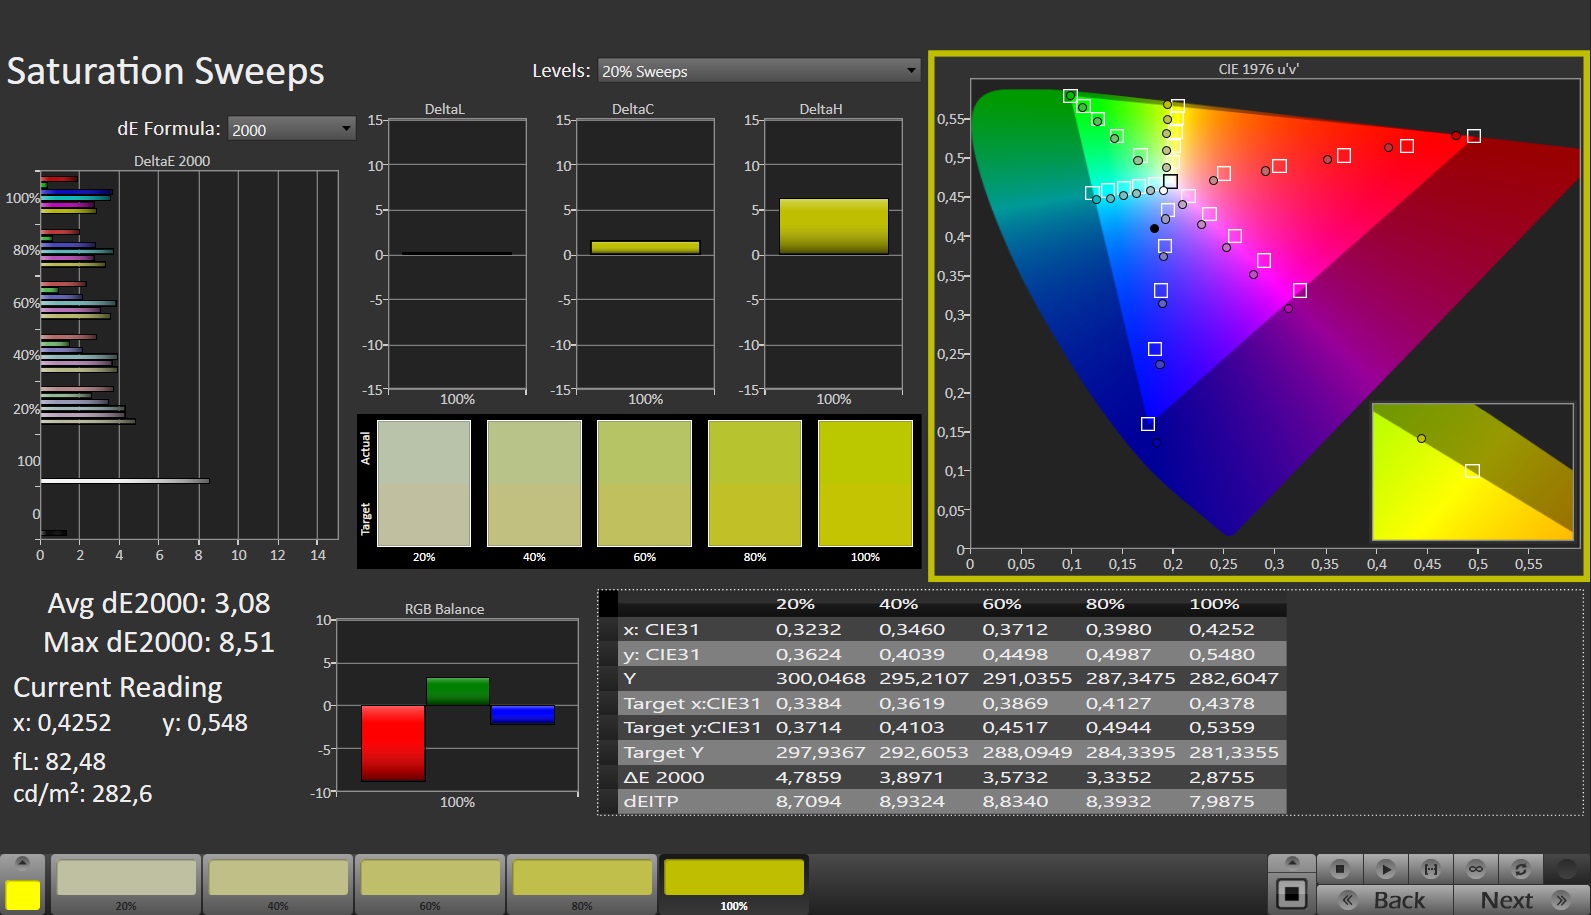
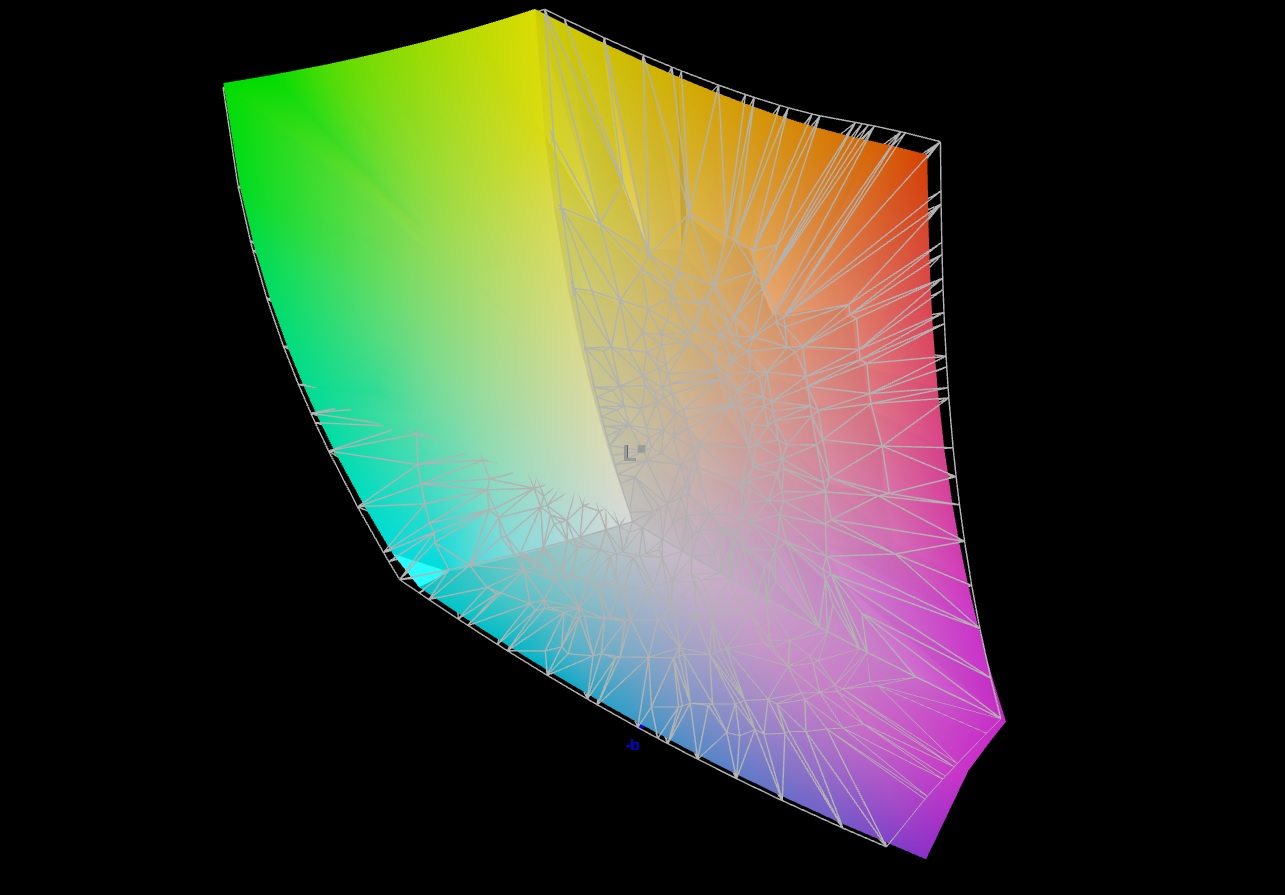
85.5% AdobeRGB 1998 (Argyll 2.2.0 3D)
99.9% sRGB (Argyll 2.2.0 3D)
96.9% Display P3 (Argyll 2.2.0 3D)
Gamma: 2.168
| Acer Predator Triton 14 PT14-51 BOE NE140QDM-NY1, IPS, 2560x1600, 14.00 | Razer Blade 14 RTX 4070 AU Optronics B140QAN06.U, IPS, 2560x1600, 14.00 | Asus ROG Zephyrus G14 GA402RJ BOEhydis NE140QDM-NX1, IPS, 2560x1600, 14.00 | MSI Stealth 14 Studio A13V B140QAN06.T, IPS, 2560x1600, 14.00 | Gigabyte Aero 14 OLED BMF Samsung SDC4192 (ATNA40YK14-0), OLED, 2880x1800, 14.00 | Apple MacBook Pro 14 2023 M2 Pro Entry Mini-LED, 3024x1964, 14.20 | |
|---|---|---|---|---|---|---|
| Display | 0% | 0% | -0% | 2% | ||
| Display P3 Coverage | 96.9 | 97.3 0% | 97.6 1% | 96.2 -1% | 99.8 3% | |
| sRGB Coverage | 99.9 | 99.8 0% | 99.9 0% | 99.6 0% | 100 0% | |
| AdobeRGB 1998 Coverage | 85.5 | 85.3 0% | 85.6 0% | 85.3 0% | 88.7 4% | |
| Response Times | -9% | 21% | 32% | 72% | ||
| Response Time Grey 50% / Grey 80% * | 15.1 ? | 11.9 ? 21% | 8.3 ? 45% | 5.5 ? 64% | 2.4 ? 84% | |
| Response Time Black / White * | 5.8 ? | 8 ? -38% | 6 ? -3% | 5.8 ? -0% | 2.4 ? 59% | |
| PWM Frequency | 26191 ? | 300 | ||||
| Screen | 3% | 12% | 9% | 70% | ||
| Brightness middle | 547 | 559.3 2% | 500 -9% | 419 -23% | 423 -23% | |
| Brightness | 516 | 560 9% | 470 -9% | 402 -22% | 427 -17% | |
| Brightness Distribution | 88 | 88 0% | 85 -3% | 89 1% | 98 11% | |
| Black Level * | 0.56 | 0.44 21% | 0.42 25% | 0.43 23% | 0.1 82% | |
| Contrast | 977 | 1271 30% | 1190 22% | 974 0% | 4230 333% | |
| Colorchecker dE 2000 * | 3.28 | 4.44 -35% | 2.45 25% | 2.3 30% | 0.55 83% | |
| Colorchecker dE 2000 max. * | 8.57 | 9.3 -9% | 5.34 38% | 5.8 32% | 1.15 87% | |
| Colorchecker dE 2000 calibrated * | 1.09 | 0.39 64% | 1.2 -10% | 0.9 17% | 1.15 -6% | |
| Greyscale dE 2000 * | 4.4 | 6.8 -55% | 3.1 30% | 3.3 25% | 0.69 84% | |
| Gamma | 2.168 101% | 2.3 96% | 2.213 99% | 2.14 103% | 2.42 91% | |
| CCT | 7767 84% | 6242 104% | 7251 90% | 6550 99% | 6479 100% | |
| Total Average (Program / Settings) | -2% /
1% | 11% /
11% | 14% /
10% | 48% /
56% |
* ... smaller is better
Out-of-the-box, the screen has decent color reproduction: With a deviation of around 3.3, the target value (DeltaE < 3) is narrowly missed. A calibration reduces this value to 1.1 and ensures balanced gray scales. Color accuracy is given: The panel reproduces the sRGB and the DCI P3 color spaces completely and the AdobeRGB space to 86 percent. The competition's screens tell the same story.
We have created our very own color profile which can be downloaded and used. A link for this can be found in the "Display" inbox.


Display Response Times
| ↔ Response Time Black to White | ||
|---|---|---|
| 5.8 ms ... rise ↗ and fall ↘ combined | ↗ 2.1 ms rise | 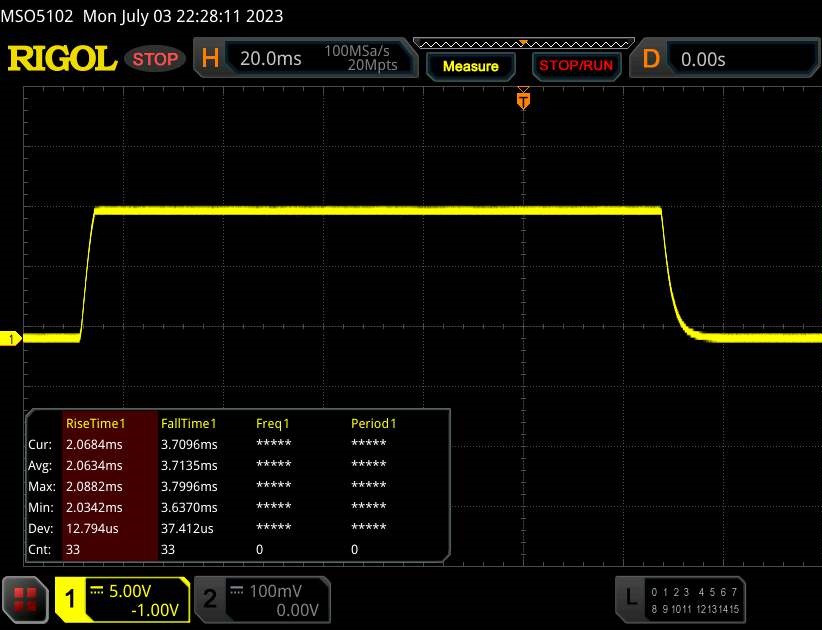 |
| ↘ 3.7 ms fall | ||
| The screen shows very fast response rates in our tests and should be very well suited for fast-paced gaming. In comparison, all tested devices range from 0.1 (minimum) to 240 (maximum) ms. » 11 % of all devices are better. This means that the measured response time is better than the average of all tested devices (21.8 ms). | ||
| ↔ Response Time 50% Grey to 80% Grey | ||
| 15.1 ms ... rise ↗ and fall ↘ combined | ↗ 6.8 ms rise | 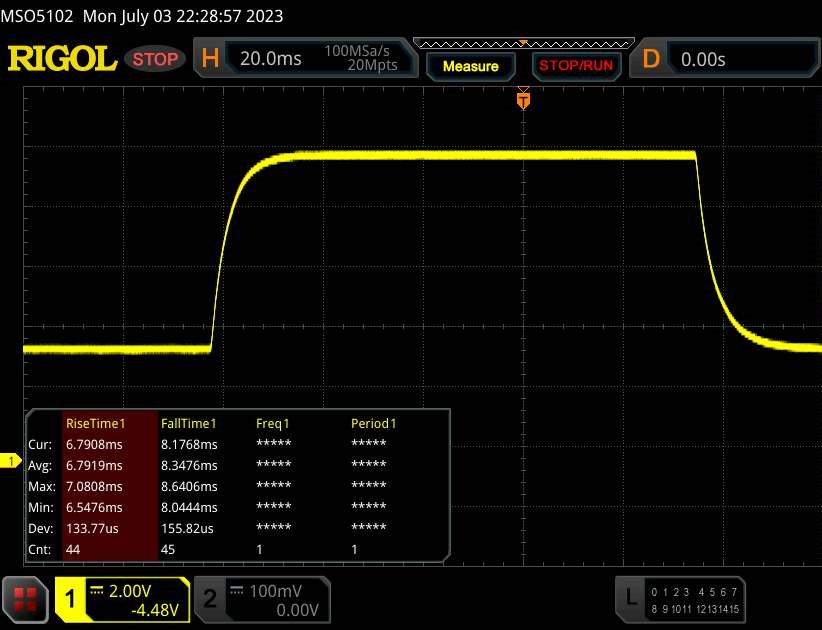 |
| ↘ 8.3 ms fall | ||
| The screen shows good response rates in our tests, but may be too slow for competitive gamers. In comparison, all tested devices range from 0.2 (minimum) to 636 (maximum) ms. » 22 % of all devices are better. This means that the measured response time is better than the average of all tested devices (34.3 ms). | ||
Screen Flickering / PWM (Pulse-Width Modulation)
| Screen flickering / PWM not detected | 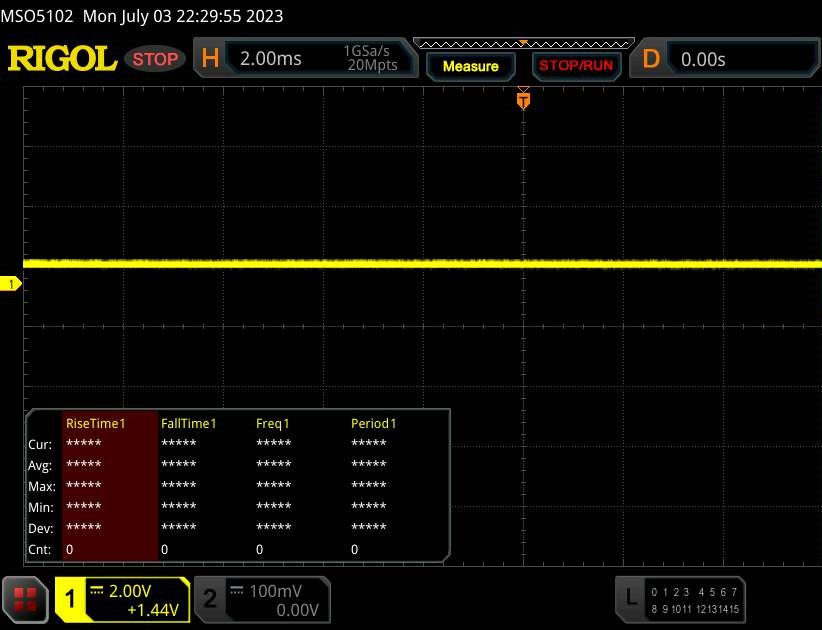 | ||
In comparison: 53 % of all tested devices do not use PWM to dim the display. If PWM was detected, an average of 18722 (minimum: 5 - maximum: 3846000) Hz was measured. | |||
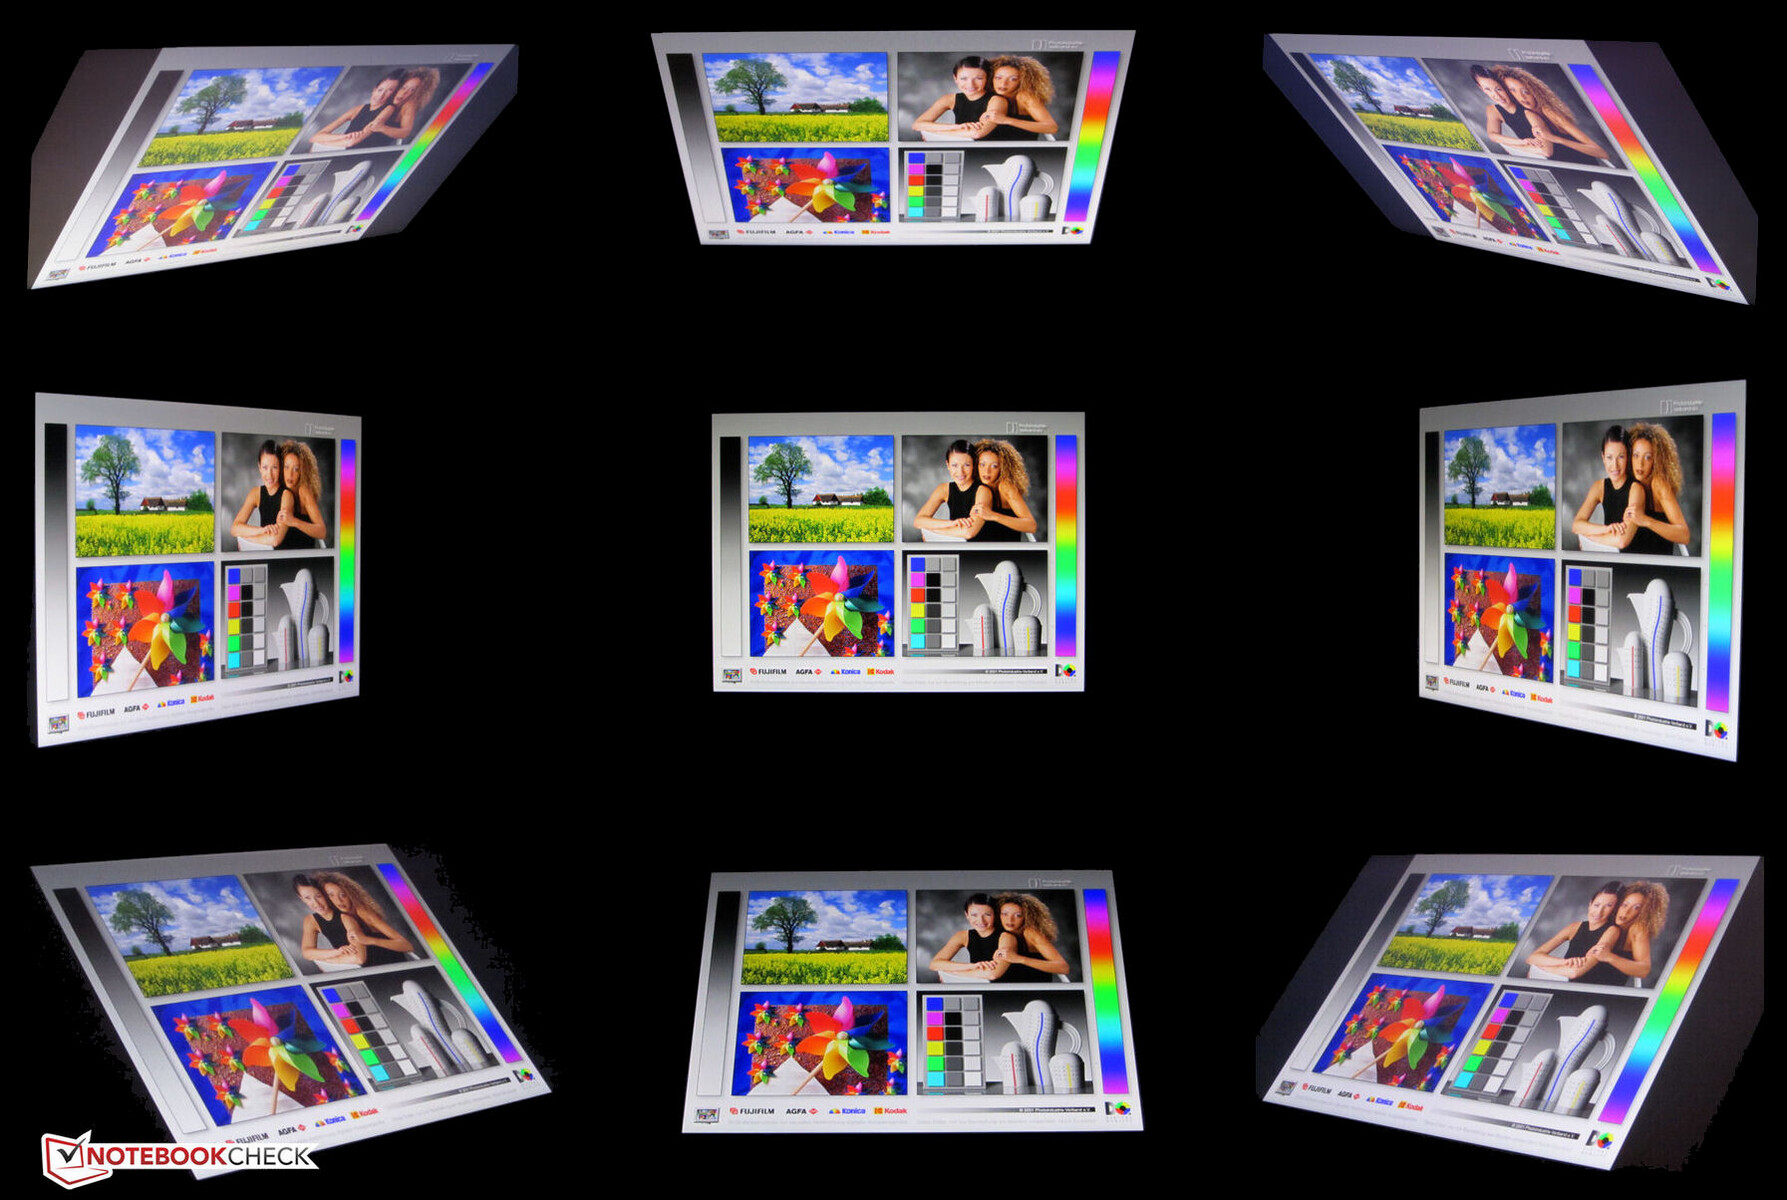
The IPS panel has stable viewing angles and is legible from every position. Thanks to the display's high brightness, the screen can also be viewed in an outdoor setting.
Performance - Raptor Lake and Ada Lovelace power the Acer laptop
With the Predator Triton 14, Acer has a 14-inch laptop made for gaming and rendering. The Core i7-13700H and GeForce RTX 4050 deliver the necessary computational power. More performant variants have a GeForce RTX 4070 on board.
Test conditions
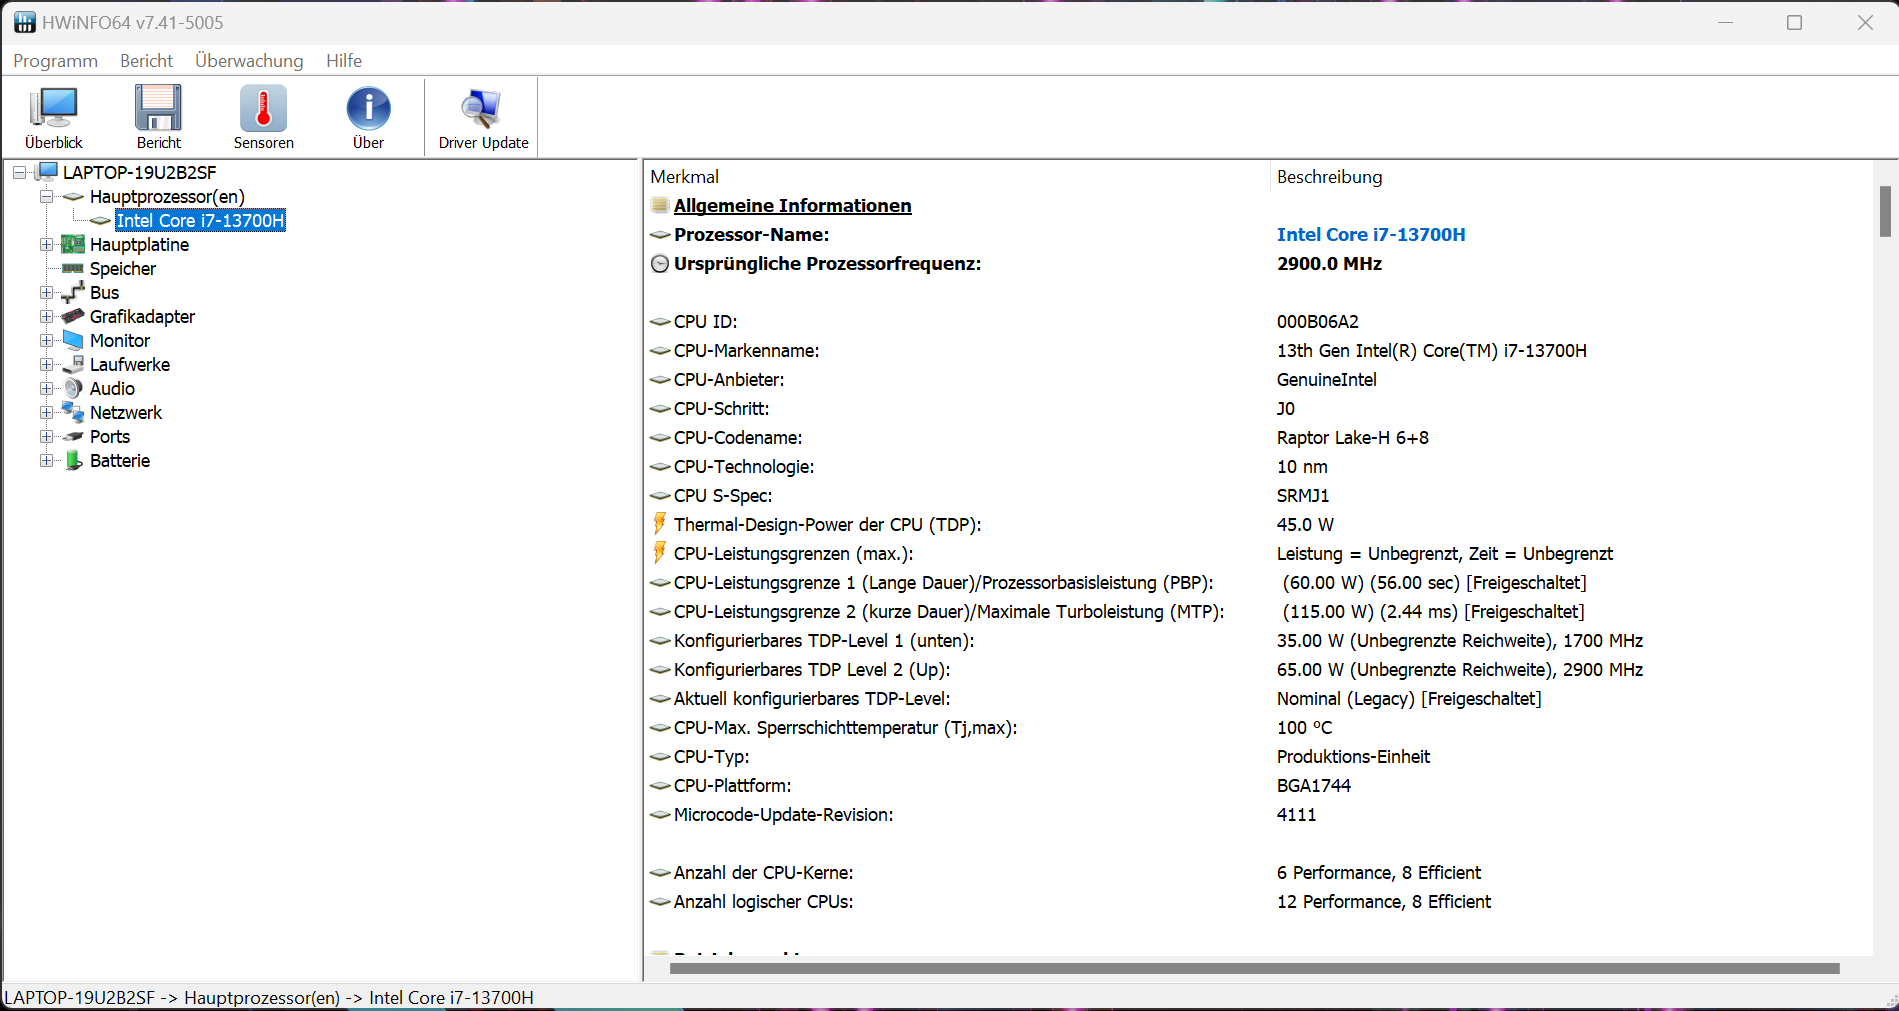
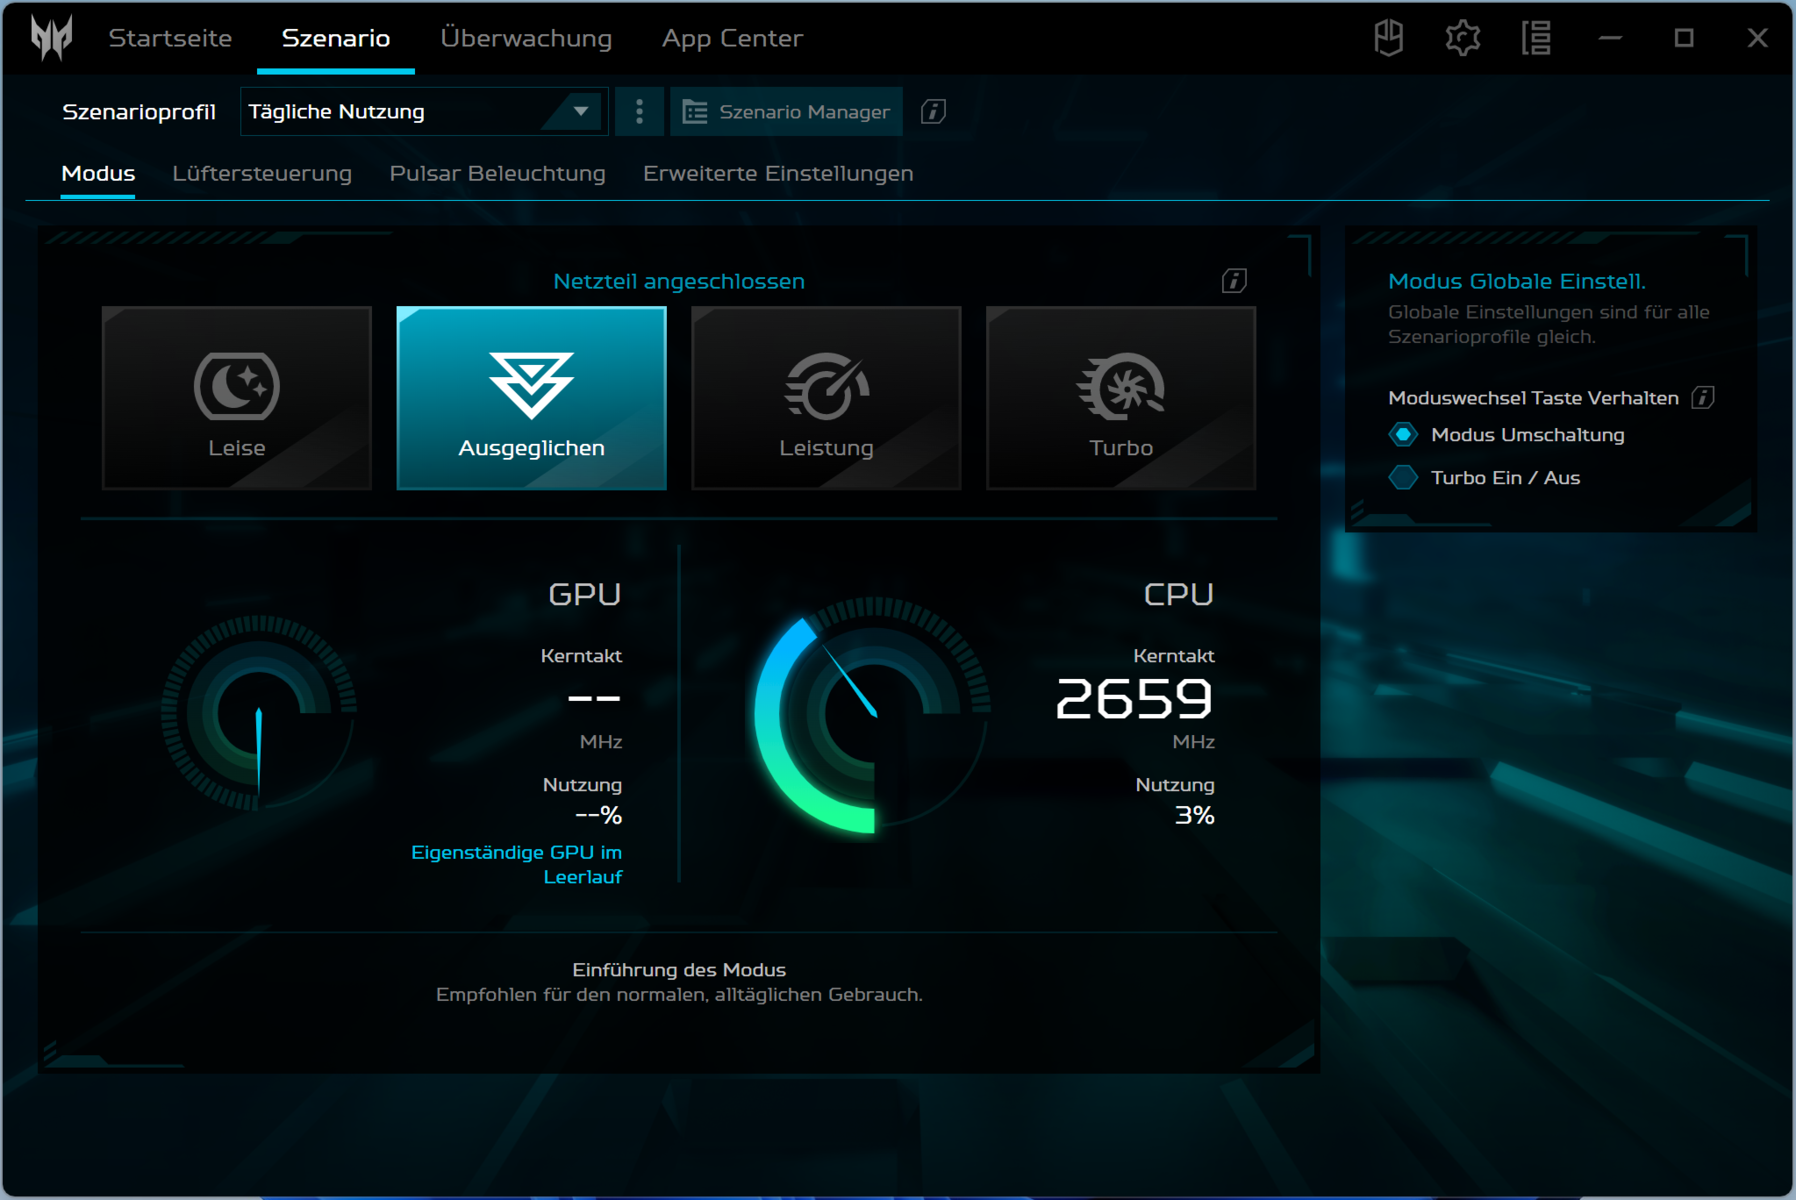
The laptop offers six manufacturer-specific system modes - four in mains operation and two in battery mode (see table). We used the "Balanced" (benchmarks) and "Eco" (battery tests) modes. "Turbo" and "Performance" are only available when plugged into the wall (battery level > 30 %).
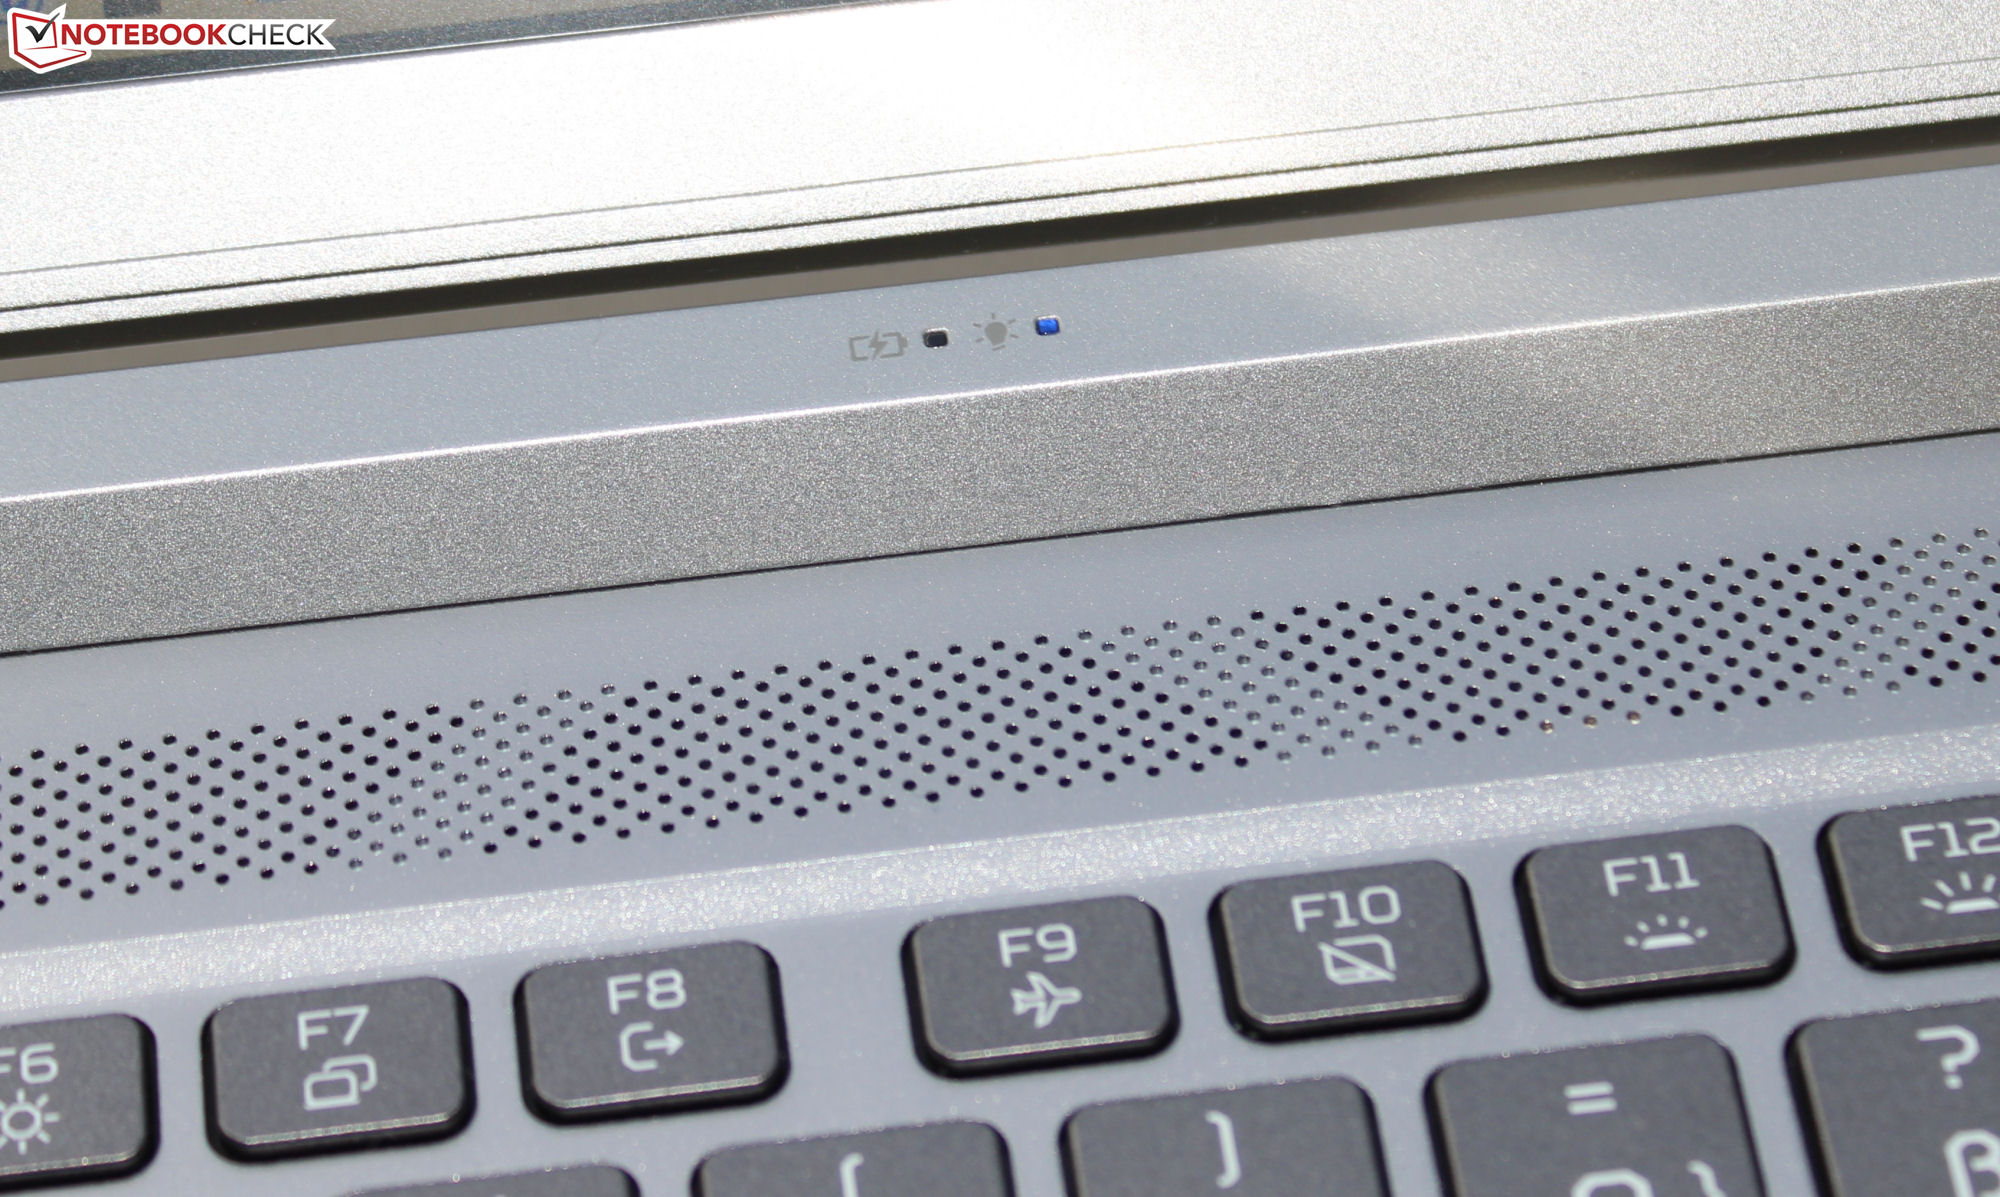
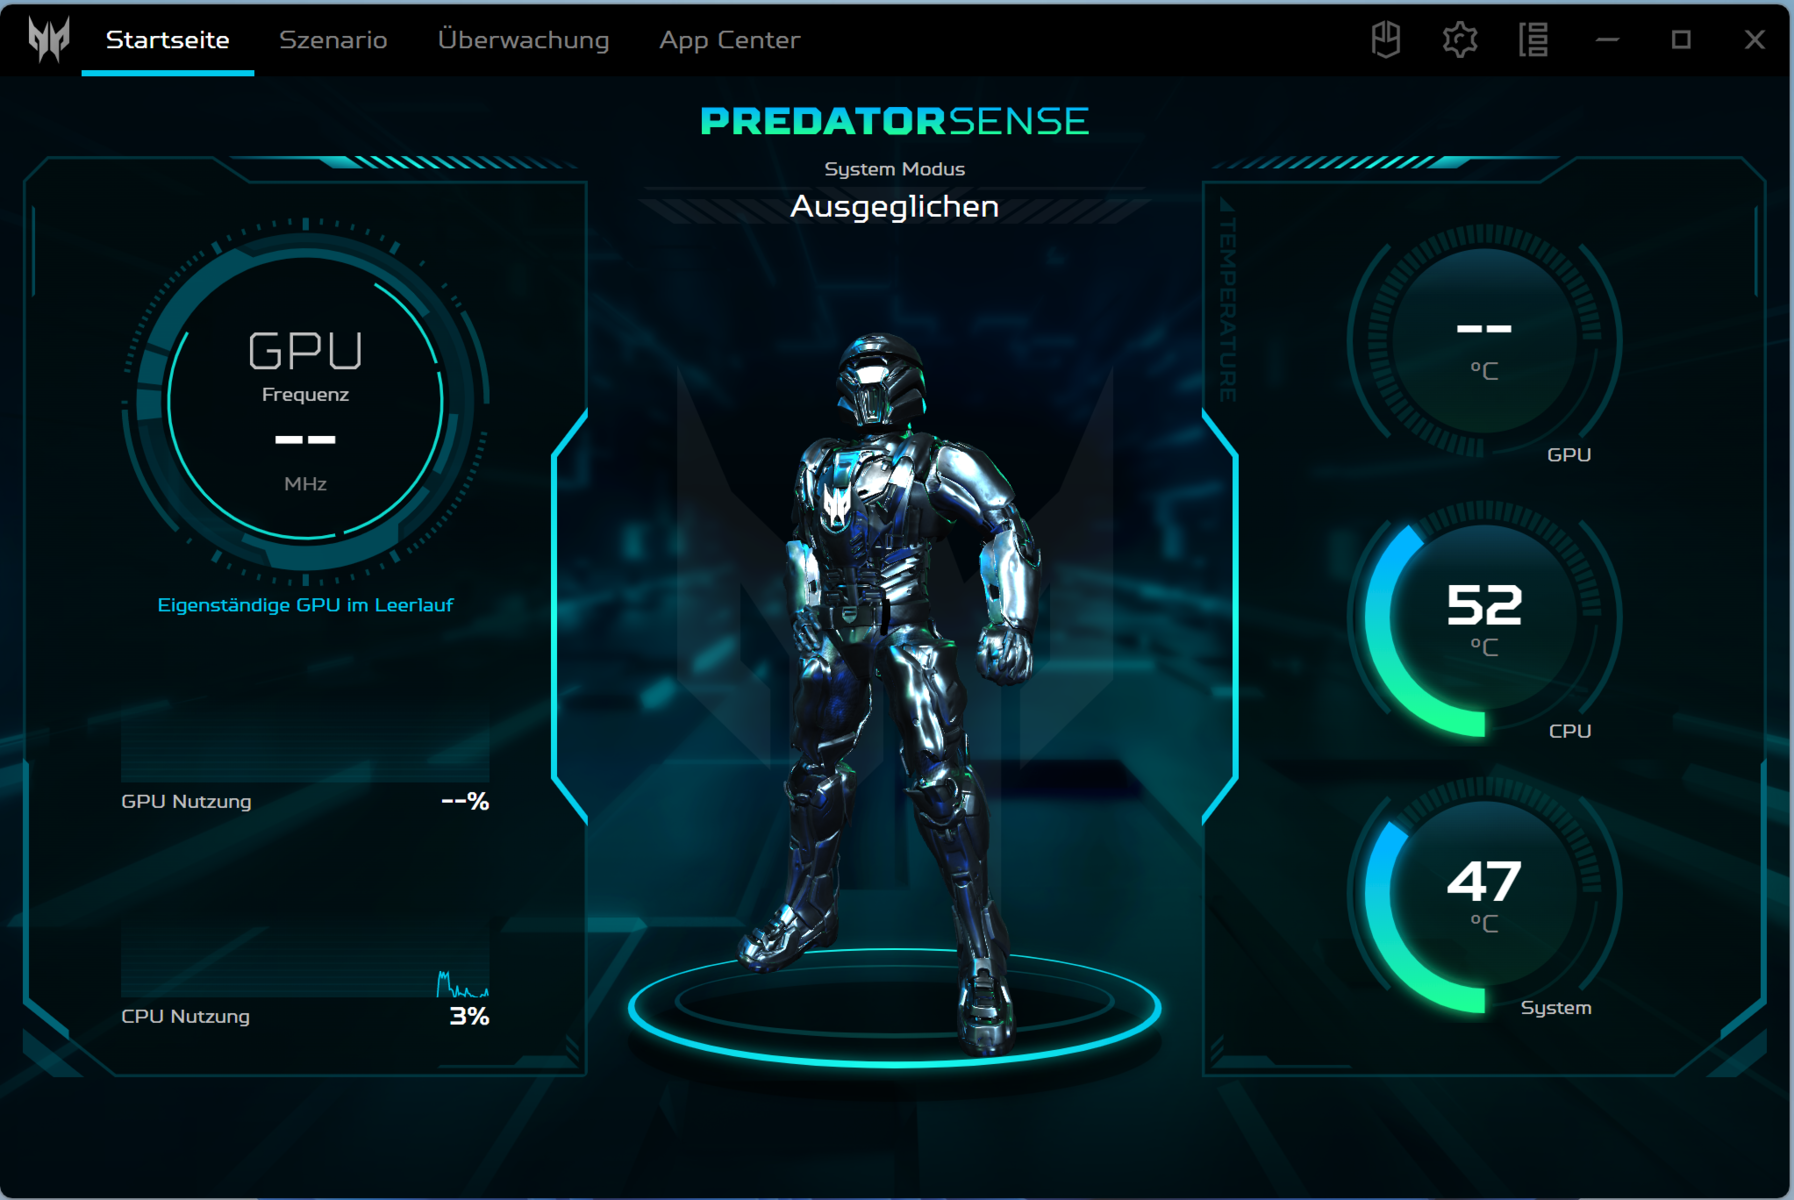
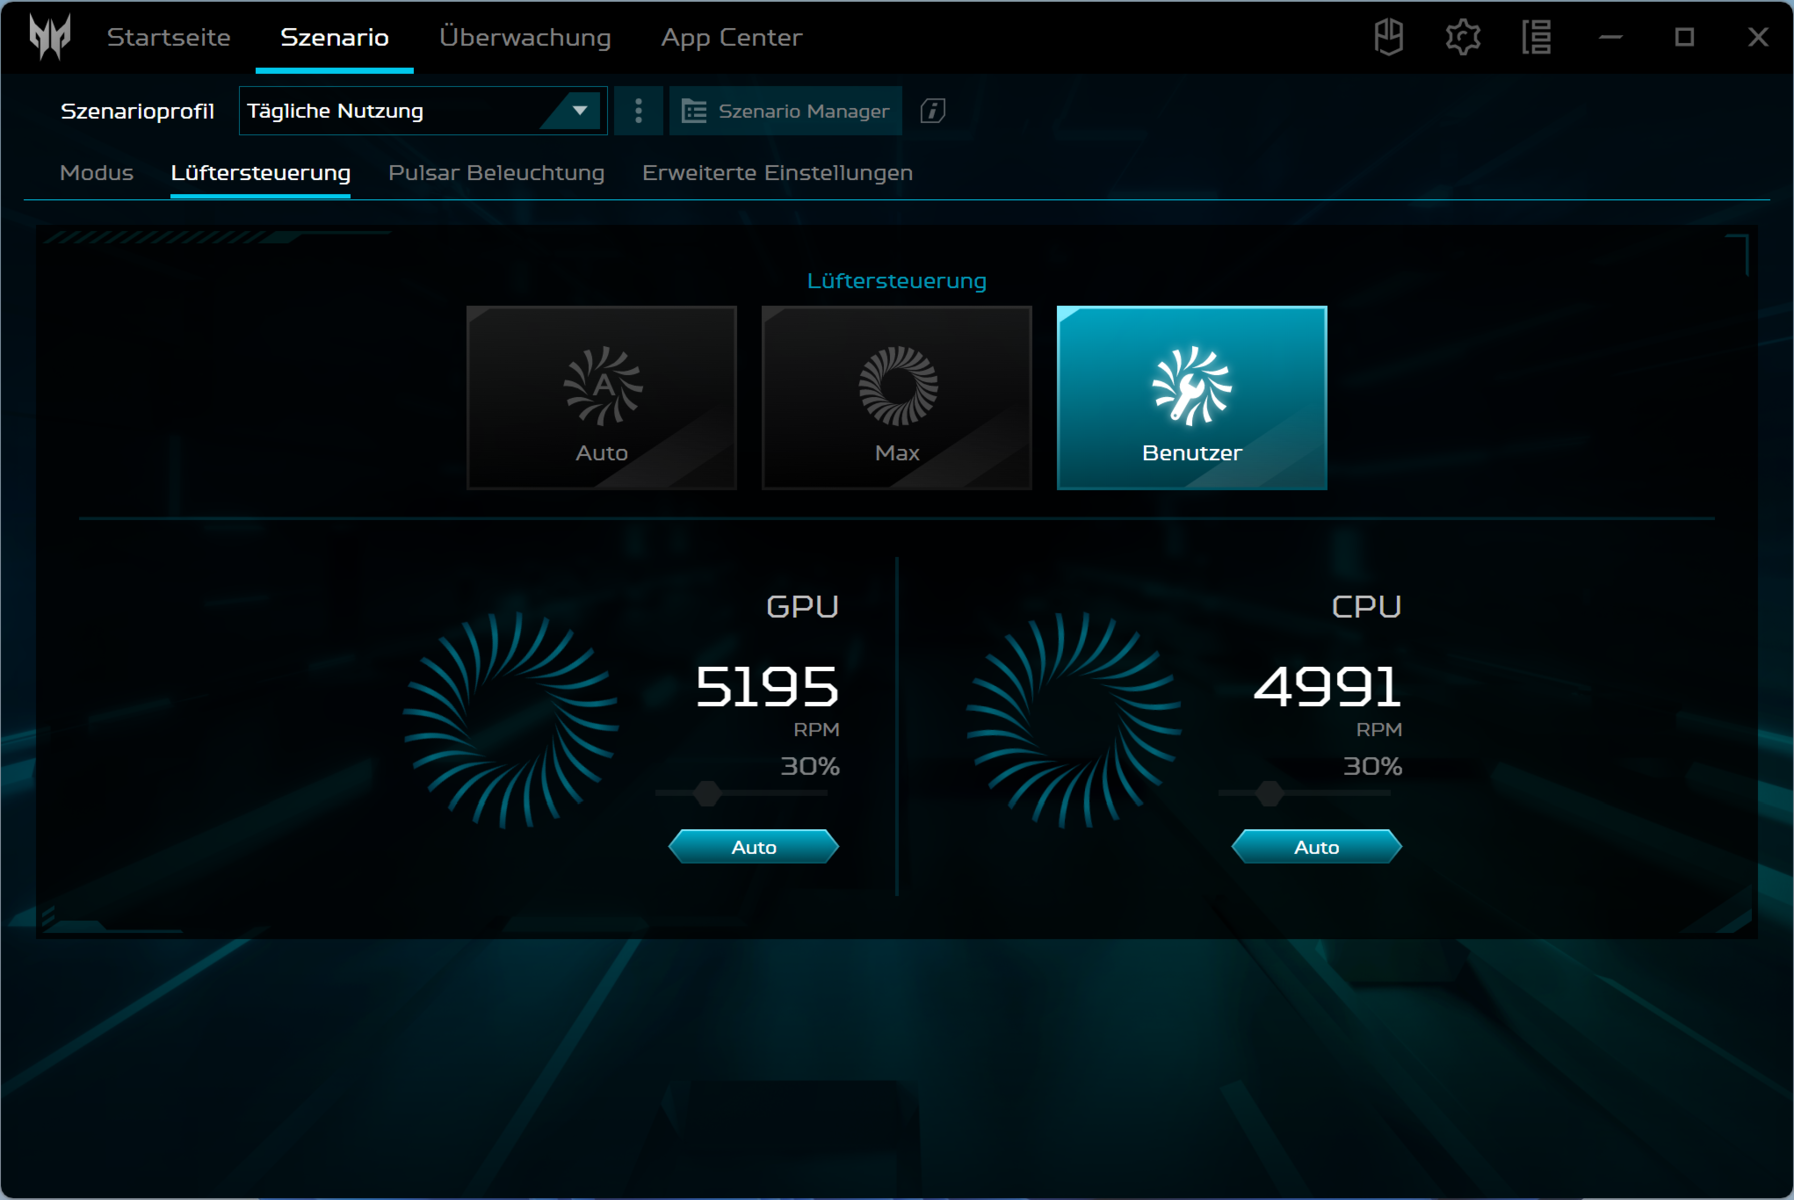
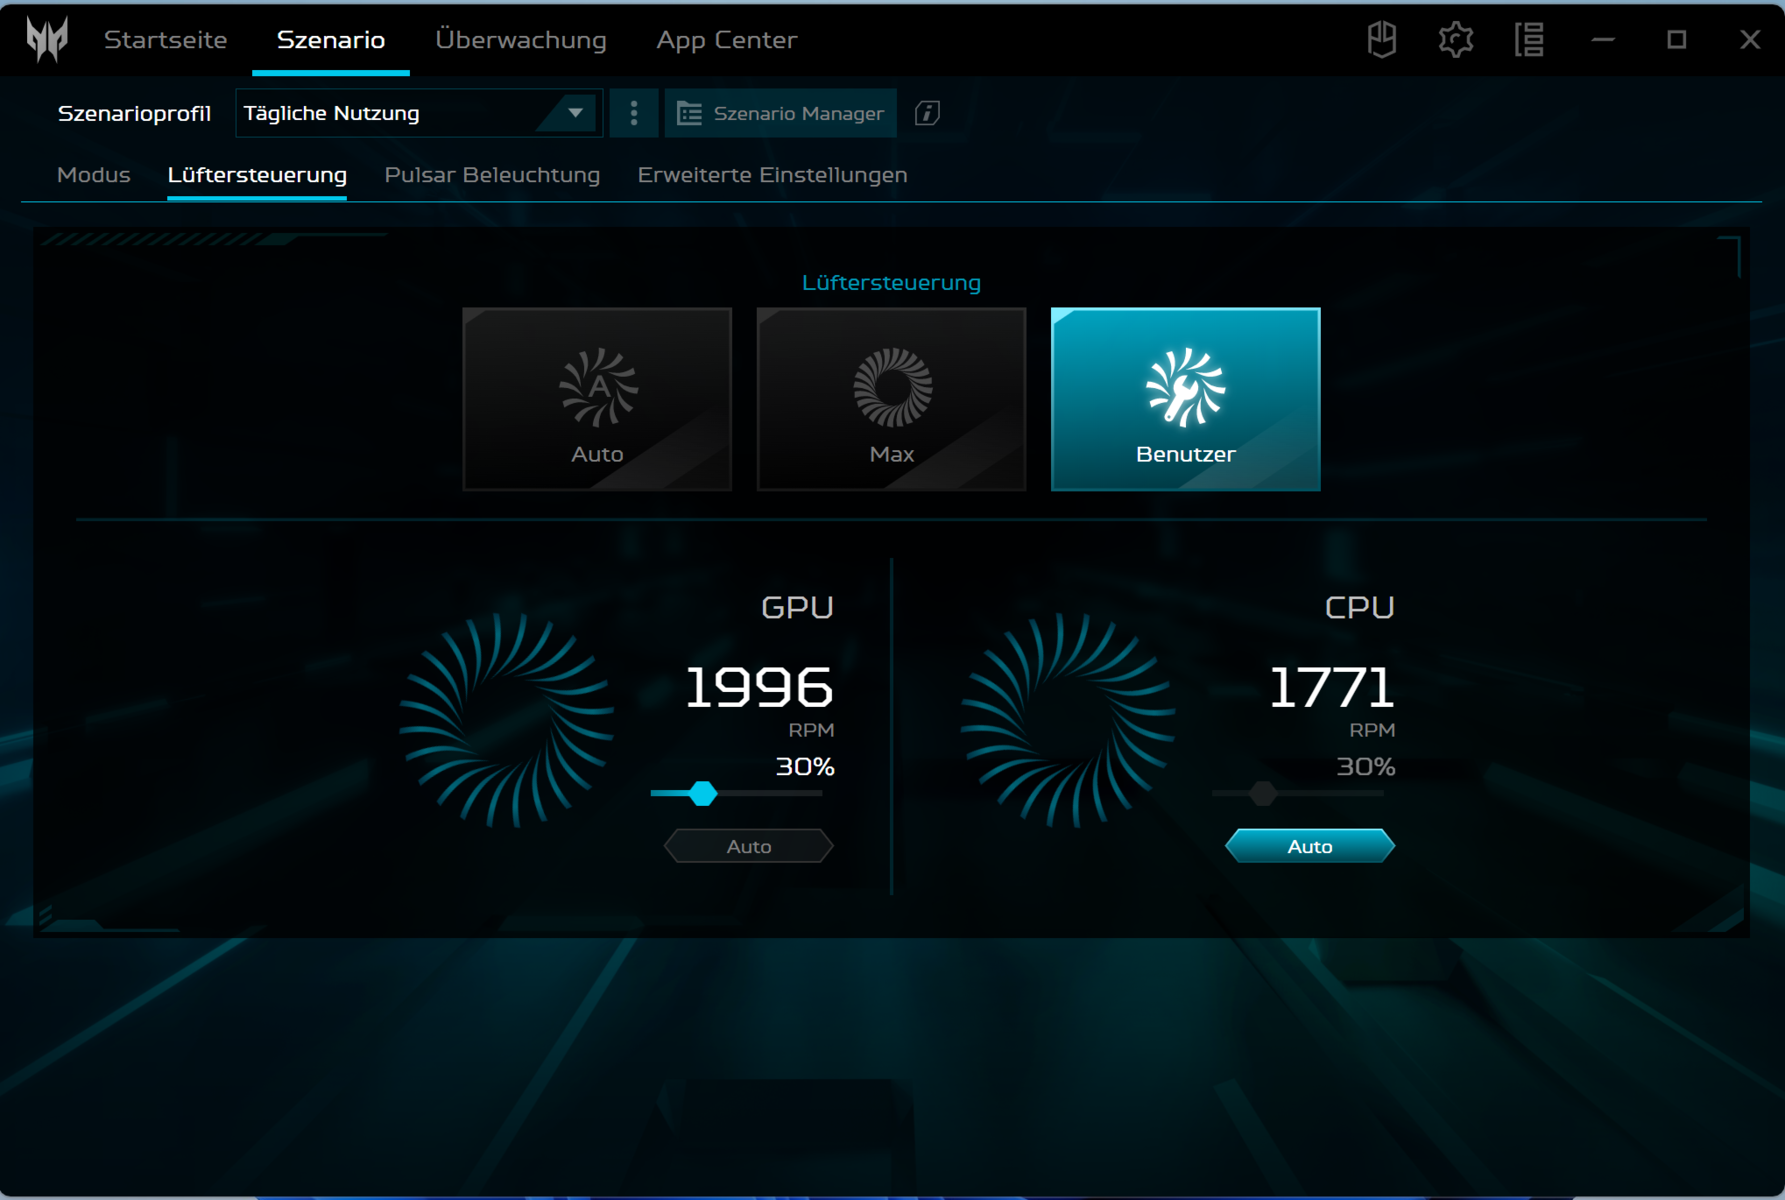
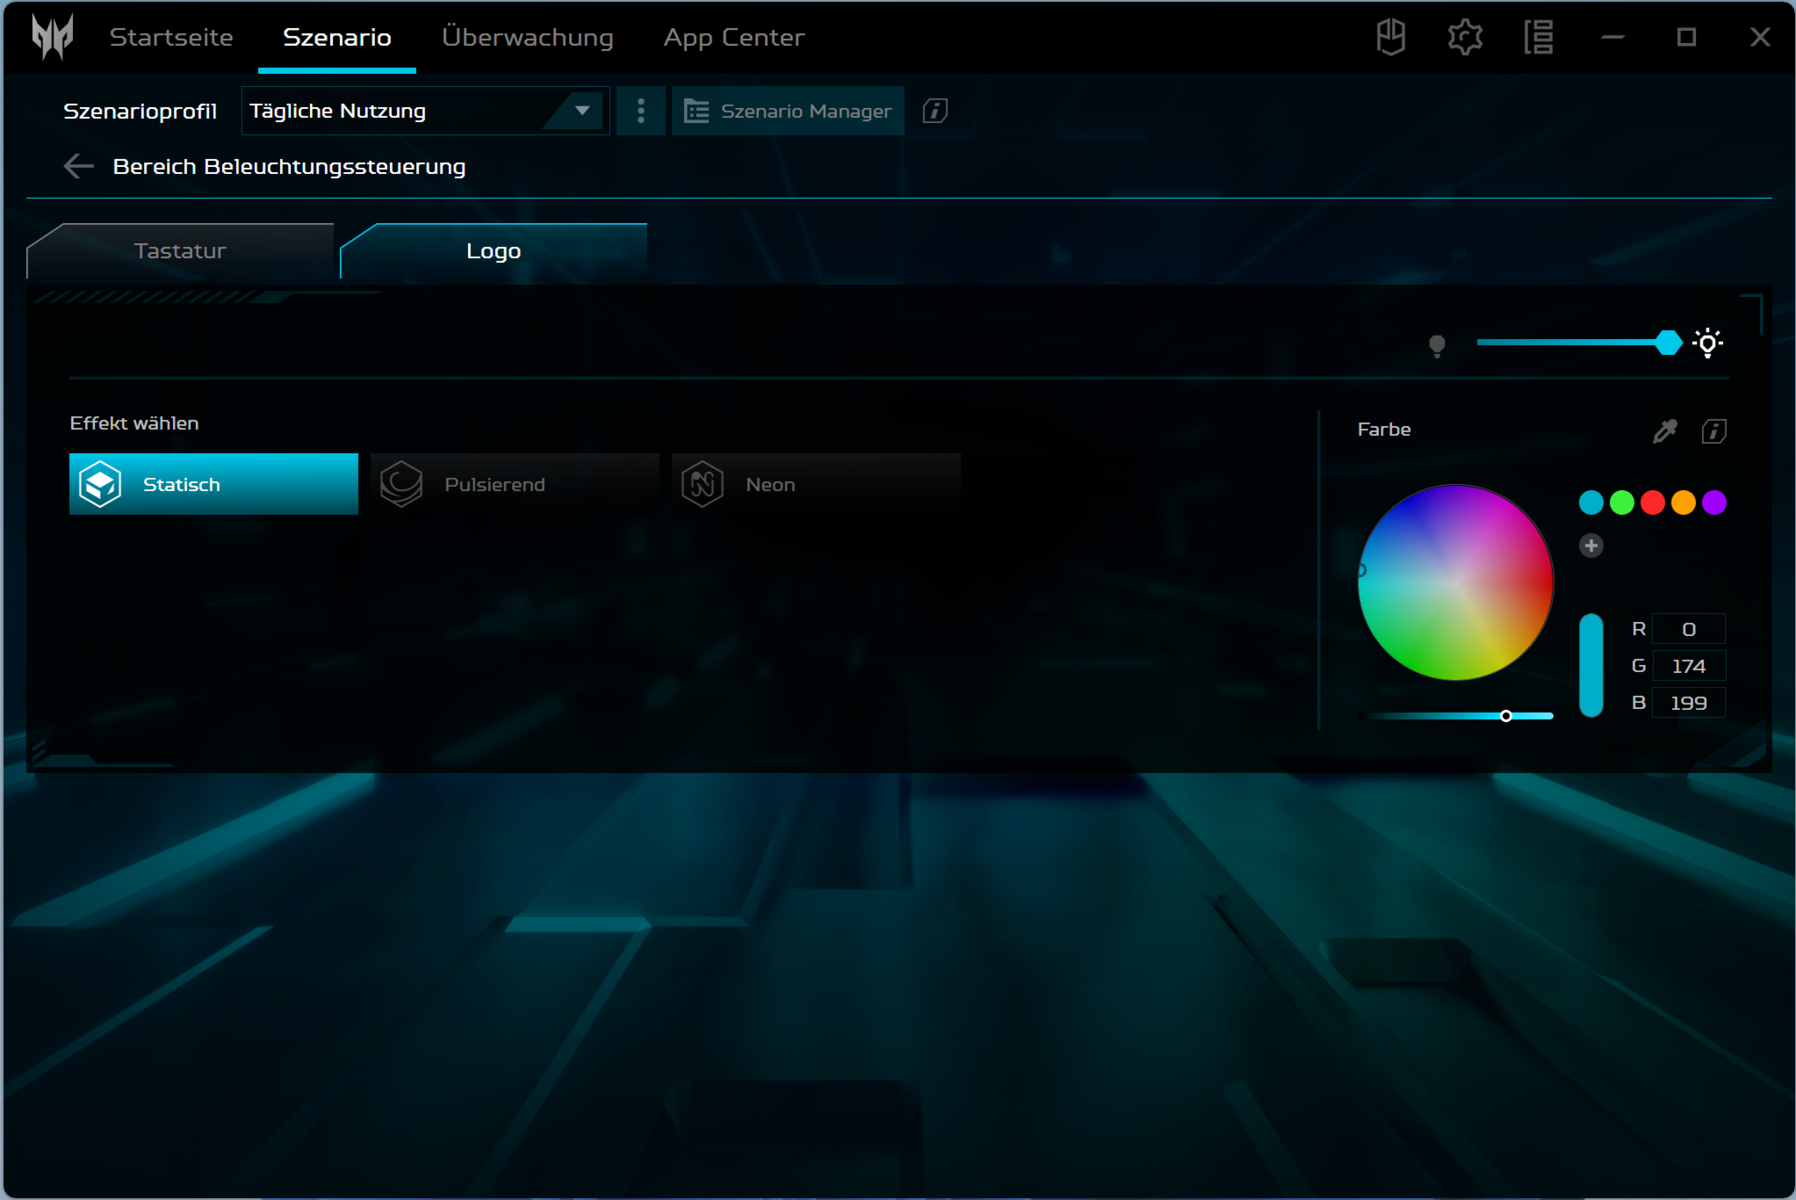
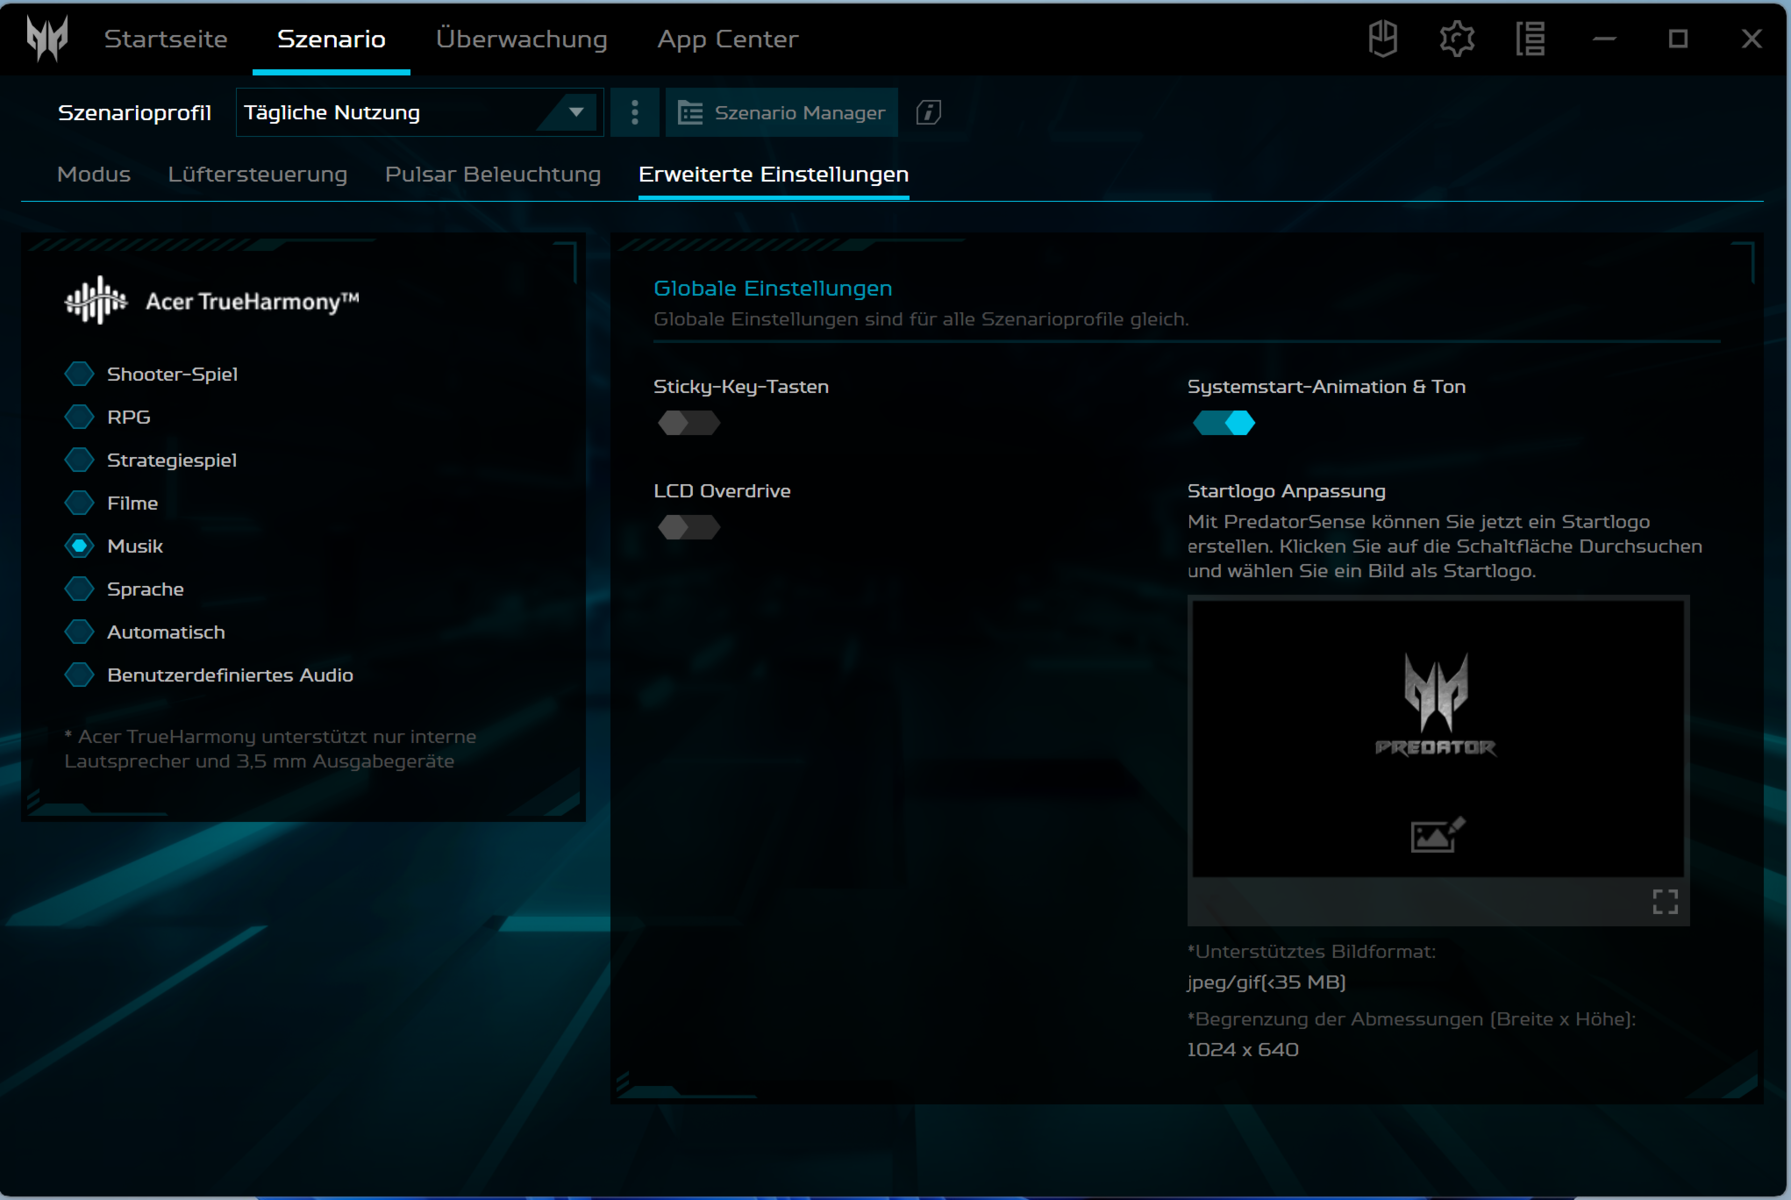
One key located above the keyboard is responsible for fast switching between the modes. Alternatively, this can be done via the PredatorSense software (the laptop's control center). An LED displays the active mode.
| Turbo | Performance | Balanced | Quiet | Balanced (Battery) | Eco (Battery) | |
|---|---|---|---|---|---|---|
| Power Limit 1 (HWInfo) | 80 watts | 75 watts | 60 watts | 50 watts | 60 watts | 25 watts |
| Power Limit 2 (HWInfo) | 115 watts | 115 watts | 115 watts | 115 watts | 115 watts | 30 watts |
| Noise (Witcher 3) | 56 dB(A) | 53 dB(A) | 43 dB(A) | 36 dB(A) | - | - |
| Performance (Witcher 3) | ~86 fps | ~83 fps | ~82 fps | ~58 fps | - | - |

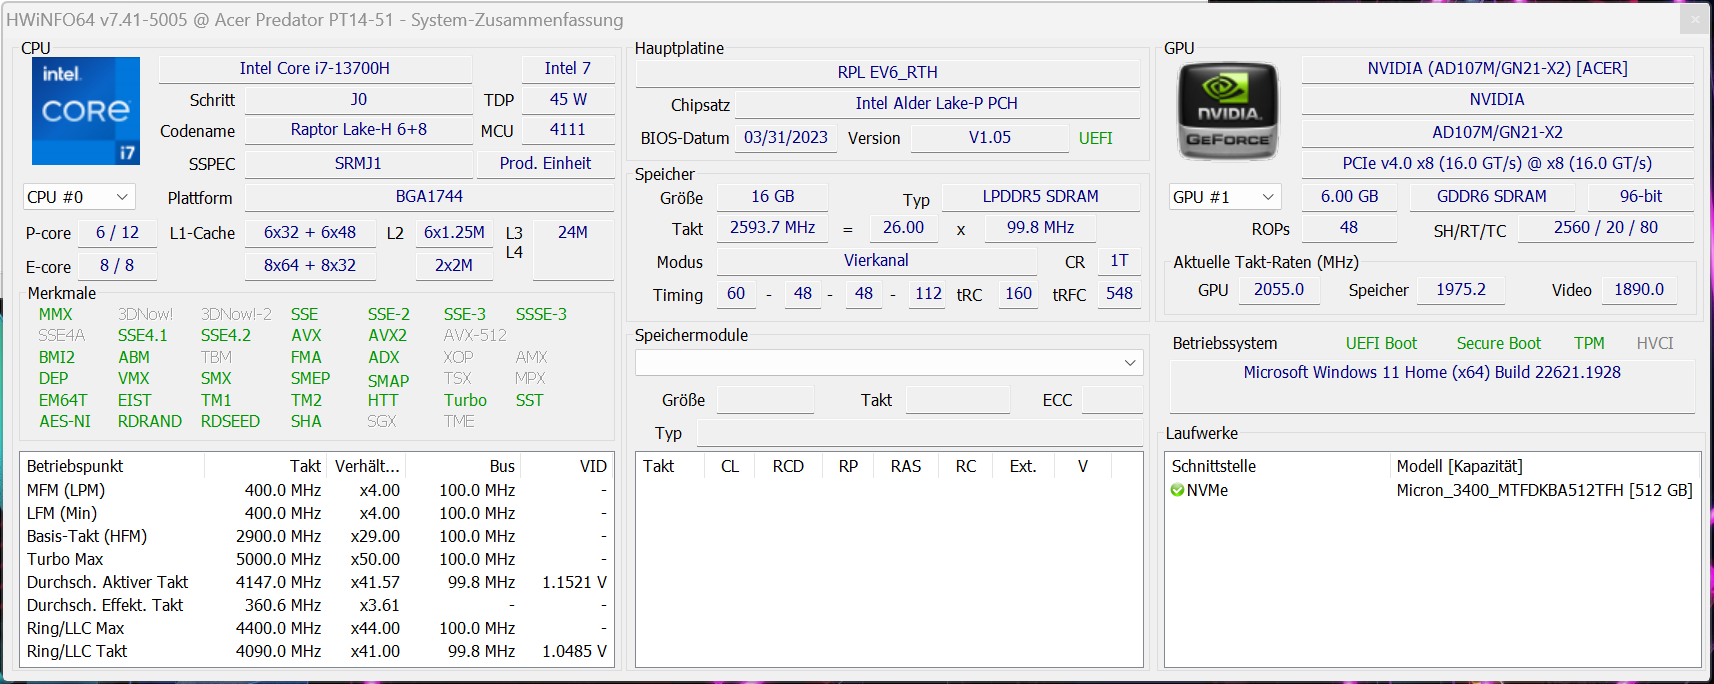
Processor
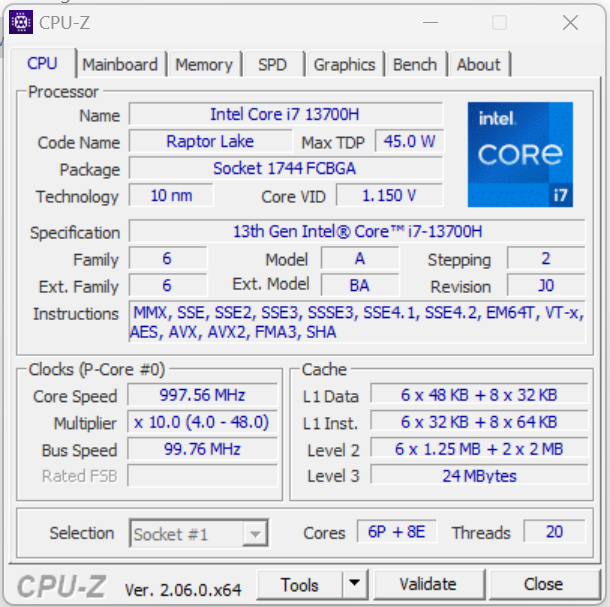
The Core i7-13700H processor (Raptor Lake) consists of eight efficiency cores (no hyperthreading, 1.8 to 3.7 GHz) and six performance cores (hyperthreading, 2.4 to 5 GHz). In total, this represents a total of 20 logical CPU cores.
The benchmark results are above the typical CPU average - regardless of the selected performance mode. The relevant single-thread performance (179 points) drops less in battery mode than the multi-thread performance (992 points).
Under continuous multi-thread load (CB15 loop) the turbo clock speed drops from the first to the third run. Subsequently, a consistent level is maintained. The "Turbo" profile ensures minimally higher results. Generally, the difference between the modes is very small.


Cinebench R15 Multi Continuous Test


| Cinebench R23 | |
| Multi Core | |
| Acer Predator Triton 14 PT14-51 | |
| Average of class Gaming (2435 - 34521, n=241, last 2 years) | |
| Razer Blade 14 RTX 4070 | |
| MSI Stealth 14 Studio A13V | |
| Average Intel Core i7-13700H (5890 - 20034, n=25) | |
| Gigabyte Aero 14 OLED BMF | |
| Asus ROG Zephyrus G14 GA402RJ | |
| Apple MacBook Pro 14 2023 M2 Pro Entry | |
| Single Core | |
| Gigabyte Aero 14 OLED BMF | |
| Razer Blade 14 RTX 4070 | |
| Average Intel Core i7-13700H (1323 - 1912, n=25) | |
| Average of class Gaming (527 - 2169, n=239, last 2 years) | |
| Acer Predator Triton 14 PT14-51 | |
| Apple MacBook Pro 14 2023 M2 Pro Entry | |
| MSI Stealth 14 Studio A13V | |
| Asus ROG Zephyrus G14 GA402RJ | |
| Cinebench R20 | |
| CPU (Multi Core) | |
| Acer Predator Triton 14 PT14-51 | |
| Average of class Gaming (930 - 13769, n=239, last 2 years) | |
| Razer Blade 14 RTX 4070 | |
| MSI Stealth 14 Studio A13V | |
| Average Intel Core i7-13700H (2322 - 7674, n=25) | |
| Gigabyte Aero 14 OLED BMF | |
| Asus ROG Zephyrus G14 GA402RJ | |
| Apple MacBook Pro 14 2023 M2 Pro Entry | |
| CPU (Single Core) | |
| Gigabyte Aero 14 OLED BMF | |
| Razer Blade 14 RTX 4070 | |
| Average Intel Core i7-13700H (508 - 734, n=25) | |
| Average of class Gaming (169 - 825, n=239, last 2 years) | |
| Acer Predator Triton 14 PT14-51 | |
| MSI Stealth 14 Studio A13V | |
| Asus ROG Zephyrus G14 GA402RJ | |
| Apple MacBook Pro 14 2023 M2 Pro Entry | |
| Cinebench R15 | |
| CPU Multi 64Bit | |
| Acer Predator Triton 14 PT14-51 | |
| Average of class Gaming (400 - 5663, n=245, last 2 years) | |
| Razer Blade 14 RTX 4070 | |
| MSI Stealth 14 Studio A13V | |
| Gigabyte Aero 14 OLED BMF | |
| Average Intel Core i7-13700H (905 - 2982, n=25) | |
| Asus ROG Zephyrus G14 GA402RJ | |
| Apple MacBook Pro 14 2023 M2 Pro Entry | |
| CPU Single 64Bit | |
| Razer Blade 14 RTX 4070 | |
| Gigabyte Aero 14 OLED BMF | |
| Average of class Gaming (79.2 - 312, n=244, last 2 years) | |
| Average Intel Core i7-13700H (213 - 276, n=25) | |
| Acer Predator Triton 14 PT14-51 | |
| MSI Stealth 14 Studio A13V | |
| Asus ROG Zephyrus G14 GA402RJ | |
| Apple MacBook Pro 14 2023 M2 Pro Entry | |
| Blender - v2.79 BMW27 CPU | |
| Apple MacBook Pro 14 2023 M2 Pro Entry | |
| Asus ROG Zephyrus G14 GA402RJ | |
| Gigabyte Aero 14 OLED BMF | |
| Average Intel Core i7-13700H (169 - 555, n=25) | |
| Average of class Gaming (91 - 1259, n=237, last 2 years) | |
| MSI Stealth 14 Studio A13V | |
| Acer Predator Triton 14 PT14-51 | |
| Razer Blade 14 RTX 4070 | |
| 7-Zip 18.03 | |
| 7z b 4 | |
| Acer Predator Triton 14 PT14-51 | |
| Average of class Gaming (11386 - 140932, n=236, last 2 years) | |
| MSI Stealth 14 Studio A13V | |
| Razer Blade 14 RTX 4070 | |
| Average Intel Core i7-13700H (27322 - 76344, n=25) | |
| Gigabyte Aero 14 OLED BMF | |
| Asus ROG Zephyrus G14 GA402RJ | |
| 7z b 4 -mmt1 | |
| Razer Blade 14 RTX 4070 | |
| Gigabyte Aero 14 OLED BMF | |
| Average of class Gaming (2685 - 7581, n=237, last 2 years) | |
| Average Intel Core i7-13700H (4825 - 6238, n=25) | |
| Acer Predator Triton 14 PT14-51 | |
| Asus ROG Zephyrus G14 GA402RJ | |
| MSI Stealth 14 Studio A13V | |
| Geekbench 5.5 | |
| Multi-Core | |
| Acer Predator Triton 14 PT14-51 | |
| MSI Stealth 14 Studio A13V | |
| Average of class Gaming (1946 - 22200, n=243, last 2 years) | |
| Apple MacBook Pro 14 2023 M2 Pro Entry | |
| Average Intel Core i7-13700H (6165 - 14215, n=25) | |
| Razer Blade 14 RTX 4070 | |
| Gigabyte Aero 14 OLED BMF | |
| Asus ROG Zephyrus G14 GA402RJ | |
| Single-Core | |
| Razer Blade 14 RTX 4070 | |
| Apple MacBook Pro 14 2023 M2 Pro Entry | |
| Gigabyte Aero 14 OLED BMF | |
| Average Intel Core i7-13700H (1362 - 1919, n=25) | |
| Average of class Gaming (158 - 2139, n=243, last 2 years) | |
| MSI Stealth 14 Studio A13V | |
| Acer Predator Triton 14 PT14-51 | |
| Asus ROG Zephyrus G14 GA402RJ | |
| HWBOT x265 Benchmark v2.2 - 4k Preset | |
| Razer Blade 14 RTX 4070 | |
| Acer Predator Triton 14 PT14-51 | |
| Average of class Gaming (3 - 37.6, n=240, last 2 years) | |
| MSI Stealth 14 Studio A13V | |
| Average Intel Core i7-13700H (6.72 - 21.2, n=25) | |
| Gigabyte Aero 14 OLED BMF | |
| Asus ROG Zephyrus G14 GA402RJ | |
| LibreOffice - 20 Documents To PDF | |
| MSI Stealth 14 Studio A13V | |
| Asus ROG Zephyrus G14 GA402RJ | |
| Average of class Gaming (32.8 - 332, n=235, last 2 years) | |
| Acer Predator Triton 14 PT14-51 | |
| Average Intel Core i7-13700H (31.3 - 62.4, n=25) | |
| Gigabyte Aero 14 OLED BMF | |
| Razer Blade 14 RTX 4070 | |
| R Benchmark 2.5 - Overall mean | |
| Asus ROG Zephyrus G14 GA402RJ | |
| MSI Stealth 14 Studio A13V | |
| Acer Predator Triton 14 PT14-51 | |
| Average of class Gaming (0.375 - 4.47, n=237, last 2 years) | |
| Average Intel Core i7-13700H (0.4308 - 0.607, n=25) | |
| Gigabyte Aero 14 OLED BMF | |
| Razer Blade 14 RTX 4070 | |
* ... smaller is better
AIDA64: FP32 Ray-Trace | FPU Julia | CPU SHA3 | CPU Queen | FPU SinJulia | FPU Mandel | CPU AES | CPU ZLib | FP64 Ray-Trace | CPU PhotoWorxx
| AIDA64 / FP32 Ray-Trace | |
| Razer Blade 14 RTX 4070 | |
| MSI Stealth 14 Studio A13V | |
| Average of class Gaming (2585 - 55084, n=233, last 2 years) | |
| Acer Predator Triton 14 PT14-51 | |
| Average Intel Core i7-13700H (4986 - 18908, n=25) | |
| Asus ROG Zephyrus G14 GA402RJ | |
| Gigabyte Aero 14 OLED BMF | |
| AIDA64 / FPU Julia | |
| Razer Blade 14 RTX 4070 | |
| Asus ROG Zephyrus G14 GA402RJ | |
| Acer Predator Triton 14 PT14-51 | |
| MSI Stealth 14 Studio A13V | |
| Average of class Gaming (12439 - 234848, n=233, last 2 years) | |
| Average Intel Core i7-13700H (25360 - 92359, n=25) | |
| Gigabyte Aero 14 OLED BMF | |
| AIDA64 / CPU SHA3 | |
| Razer Blade 14 RTX 4070 | |
| Acer Predator Triton 14 PT14-51 | |
| Average of class Gaming (629 - 9930, n=233, last 2 years) | |
| MSI Stealth 14 Studio A13V | |
| Average Intel Core i7-13700H (1339 - 4224, n=25) | |
| Gigabyte Aero 14 OLED BMF | |
| Asus ROG Zephyrus G14 GA402RJ | |
| AIDA64 / CPU Queen | |
| Razer Blade 14 RTX 4070 | |
| Gigabyte Aero 14 OLED BMF | |
| MSI Stealth 14 Studio A13V | |
| Average of class Gaming (15371 - 186519, n=233, last 2 years) | |
| Asus ROG Zephyrus G14 GA402RJ | |
| Average Intel Core i7-13700H (68763 - 107159, n=25) | |
| Acer Predator Triton 14 PT14-51 | |
| AIDA64 / FPU SinJulia | |
| Razer Blade 14 RTX 4070 | |
| Asus ROG Zephyrus G14 GA402RJ | |
| Average of class Gaming (2137 - 30810, n=233, last 2 years) | |
| MSI Stealth 14 Studio A13V | |
| Acer Predator Triton 14 PT14-51 | |
| Average Intel Core i7-13700H (4800 - 11050, n=25) | |
| Gigabyte Aero 14 OLED BMF | |
| AIDA64 / FPU Mandel | |
| Razer Blade 14 RTX 4070 | |
| Asus ROG Zephyrus G14 GA402RJ | |
| Average of class Gaming (7135 - 124377, n=233, last 2 years) | |
| MSI Stealth 14 Studio A13V | |
| Acer Predator Triton 14 PT14-51 | |
| Average Intel Core i7-13700H (12321 - 45118, n=25) | |
| Gigabyte Aero 14 OLED BMF | |
| AIDA64 / CPU AES | |
| Acer Predator Triton 14 PT14-51 | |
| Asus ROG Zephyrus G14 GA402RJ | |
| Gigabyte Aero 14 OLED BMF | |
| Average of class Gaming (18146 - 328679, n=233, last 2 years) | |
| Razer Blade 14 RTX 4070 | |
| Average Intel Core i7-13700H (28769 - 151254, n=25) | |
| MSI Stealth 14 Studio A13V | |
| AIDA64 / CPU ZLib | |
| Acer Predator Triton 14 PT14-51 | |
| Razer Blade 14 RTX 4070 | |
| MSI Stealth 14 Studio A13V | |
| Average of class Gaming (150.9 - 2231, n=233, last 2 years) | |
| Average Intel Core i7-13700H (389 - 1215, n=25) | |
| Gigabyte Aero 14 OLED BMF | |
| Asus ROG Zephyrus G14 GA402RJ | |
| AIDA64 / FP64 Ray-Trace | |
| Razer Blade 14 RTX 4070 | |
| MSI Stealth 14 Studio A13V | |
| Average of class Gaming (1437 - 29473, n=233, last 2 years) | |
| Acer Predator Triton 14 PT14-51 | |
| Average Intel Core i7-13700H (2540 - 10135, n=25) | |
| Asus ROG Zephyrus G14 GA402RJ | |
| Gigabyte Aero 14 OLED BMF | |
| AIDA64 / CPU PhotoWorxx | |
| Gigabyte Aero 14 OLED BMF | |
| Acer Predator Triton 14 PT14-51 | |
| Average Intel Core i7-13700H (19552 - 52727, n=25) | |
| MSI Stealth 14 Studio A13V | |
| Average of class Gaming (8341 - 60161, n=234, last 2 years) | |
| Razer Blade 14 RTX 4070 | |
| Asus ROG Zephyrus G14 GA402RJ | |
System performance
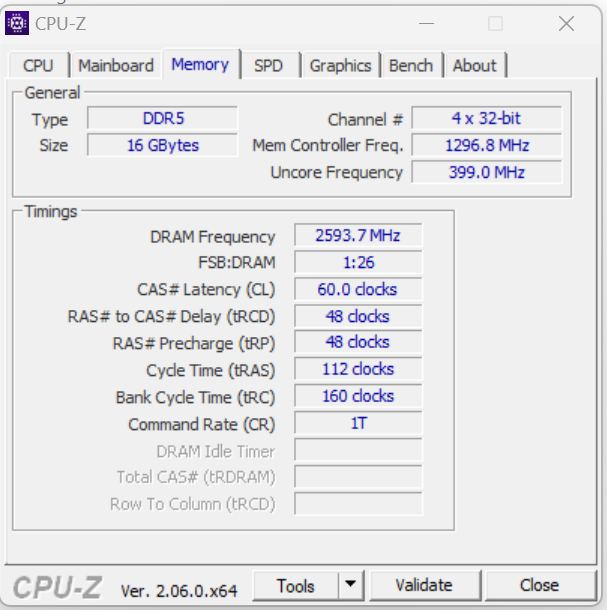
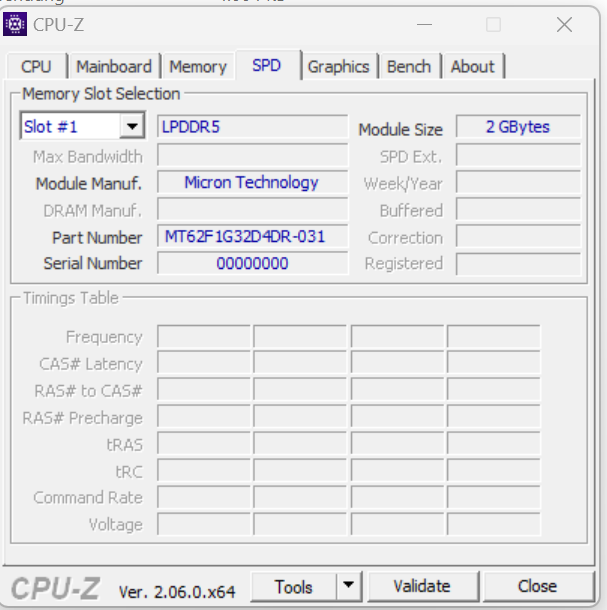
The smooth-running system has enough power at its disposal for demanding applications such as rendering and gaming - something confirmed by the good PC Mark results. The RAM's transfer rates are within a normal range for LPDDR5-6000 RAM.
CrossMark: Overall | Productivity | Creativity | Responsiveness
| PCMark 10 / Score | |
| Razer Blade 14 RTX 4070 | |
| Average of class Gaming (4477 - 9331, n=201, last 2 years) | |
| Acer Predator Triton 14 PT14-51 | |
| Asus ROG Zephyrus G14 GA402RJ | |
| Gigabyte Aero 14 OLED BMF | |
| Average Intel Core i7-13700H, NVIDIA GeForce RTX 4050 Laptop GPU (6822 - 7556, n=7) | |
| MSI Stealth 14 Studio A13V | |
| PCMark 10 / Essentials | |
| Gigabyte Aero 14 OLED BMF | |
| Razer Blade 14 RTX 4070 | |
| Average Intel Core i7-13700H, NVIDIA GeForce RTX 4050 Laptop GPU (10283 - 11549, n=7) | |
| Average of class Gaming (7334 - 12176, n=200, last 2 years) | |
| Acer Predator Triton 14 PT14-51 | |
| MSI Stealth 14 Studio A13V | |
| Asus ROG Zephyrus G14 GA402RJ | |
| PCMark 10 / Productivity | |
| Razer Blade 14 RTX 4070 | |
| Acer Predator Triton 14 PT14-51 | |
| Average of class Gaming (6161 - 11833, n=200, last 2 years) | |
| Asus ROG Zephyrus G14 GA402RJ | |
| Gigabyte Aero 14 OLED BMF | |
| Average Intel Core i7-13700H, NVIDIA GeForce RTX 4050 Laptop GPU (8368 - 9836, n=7) | |
| MSI Stealth 14 Studio A13V | |
| PCMark 10 / Digital Content Creation | |
| Razer Blade 14 RTX 4070 | |
| Asus ROG Zephyrus G14 GA402RJ | |
| Average of class Gaming (5288 - 16424, n=200, last 2 years) | |
| Acer Predator Triton 14 PT14-51 | |
| MSI Stealth 14 Studio A13V | |
| Average Intel Core i7-13700H, NVIDIA GeForce RTX 4050 Laptop GPU (9527 - 10643, n=7) | |
| Gigabyte Aero 14 OLED BMF | |
| CrossMark / Overall | |
| Acer Predator Triton 14 PT14-51 | |
| Average of class Gaming (974 - 2295, n=158, last 2 years) | |
| Gigabyte Aero 14 OLED BMF | |
| Razer Blade 14 RTX 4070 | |
| Apple MacBook Pro 14 2023 M2 Pro Entry | |
| MSI Stealth 14 Studio A13V | |
| Average Intel Core i7-13700H, NVIDIA GeForce RTX 4050 Laptop GPU (1205 - 1937, n=9) | |
| CrossMark / Productivity | |
| Gigabyte Aero 14 OLED BMF | |
| Average of class Gaming (907 - 2166, n=158, last 2 years) | |
| Razer Blade 14 RTX 4070 | |
| Acer Predator Triton 14 PT14-51 | |
| Average Intel Core i7-13700H, NVIDIA GeForce RTX 4050 Laptop GPU (1158 - 1877, n=9) | |
| MSI Stealth 14 Studio A13V | |
| Apple MacBook Pro 14 2023 M2 Pro Entry | |
| CrossMark / Creativity | |
| Apple MacBook Pro 14 2023 M2 Pro Entry | |
| Acer Predator Triton 14 PT14-51 | |
| Average of class Gaming (1027 - 2514, n=158, last 2 years) | |
| Razer Blade 14 RTX 4070 | |
| Gigabyte Aero 14 OLED BMF | |
| MSI Stealth 14 Studio A13V | |
| Average Intel Core i7-13700H, NVIDIA GeForce RTX 4050 Laptop GPU (1293 - 2044, n=9) | |
| CrossMark / Responsiveness | |
| Acer Predator Triton 14 PT14-51 | |
| Gigabyte Aero 14 OLED BMF | |
| Average of class Gaming (1029 - 2275, n=158, last 2 years) | |
| Average Intel Core i7-13700H, NVIDIA GeForce RTX 4050 Laptop GPU (1097 - 1929, n=9) | |
| Razer Blade 14 RTX 4070 | |
| MSI Stealth 14 Studio A13V | |
| Apple MacBook Pro 14 2023 M2 Pro Entry | |
| PCMark 8 Home Score Accelerated v2 | 5120 points | |
| PCMark 8 Work Score Accelerated v2 | 5617 points | |
| PCMark 10 Score | 7402 points | |
Help | ||
| AIDA64 / Memory Copy | |
| Gigabyte Aero 14 OLED BMF | |
| Acer Predator Triton 14 PT14-51 | |
| Average Intel Core i7-13700H (40018 - 78081, n=25) | |
| Razer Blade 14 RTX 4070 | |
| MSI Stealth 14 Studio A13V | |
| Average of class Gaming (18074 - 88014, n=233, last 2 years) | |
| Asus ROG Zephyrus G14 GA402RJ | |
| AIDA64 / Memory Read | |
| Gigabyte Aero 14 OLED BMF | |
| MSI Stealth 14 Studio A13V | |
| Average Intel Core i7-13700H (44583 - 79656, n=25) | |
| Acer Predator Triton 14 PT14-51 | |
| Razer Blade 14 RTX 4070 | |
| Average of class Gaming (20318 - 89096, n=233, last 2 years) | |
| Asus ROG Zephyrus G14 GA402RJ | |
| AIDA64 / Memory Write | |
| Gigabyte Aero 14 OLED BMF | |
| Acer Predator Triton 14 PT14-51 | |
| Razer Blade 14 RTX 4070 | |
| Average Intel Core i7-13700H (42710 - 99898, n=25) | |
| Average of class Gaming (15975 - 103259, n=233, last 2 years) | |
| Asus ROG Zephyrus G14 GA402RJ | |
| MSI Stealth 14 Studio A13V | |
| AIDA64 / Memory Latency | |
| Acer Predator Triton 14 PT14-51 | |
| Average Intel Core i7-13700H (82.4 - 136.8, n=25) | |
| Gigabyte Aero 14 OLED BMF | |
| Asus ROG Zephyrus G14 GA402RJ | |
| Razer Blade 14 RTX 4070 | |
| MSI Stealth 14 Studio A13V | |
| Average of class Gaming (76.2 - 136.8, n=230, last 2 years) | |
* ... smaller is better
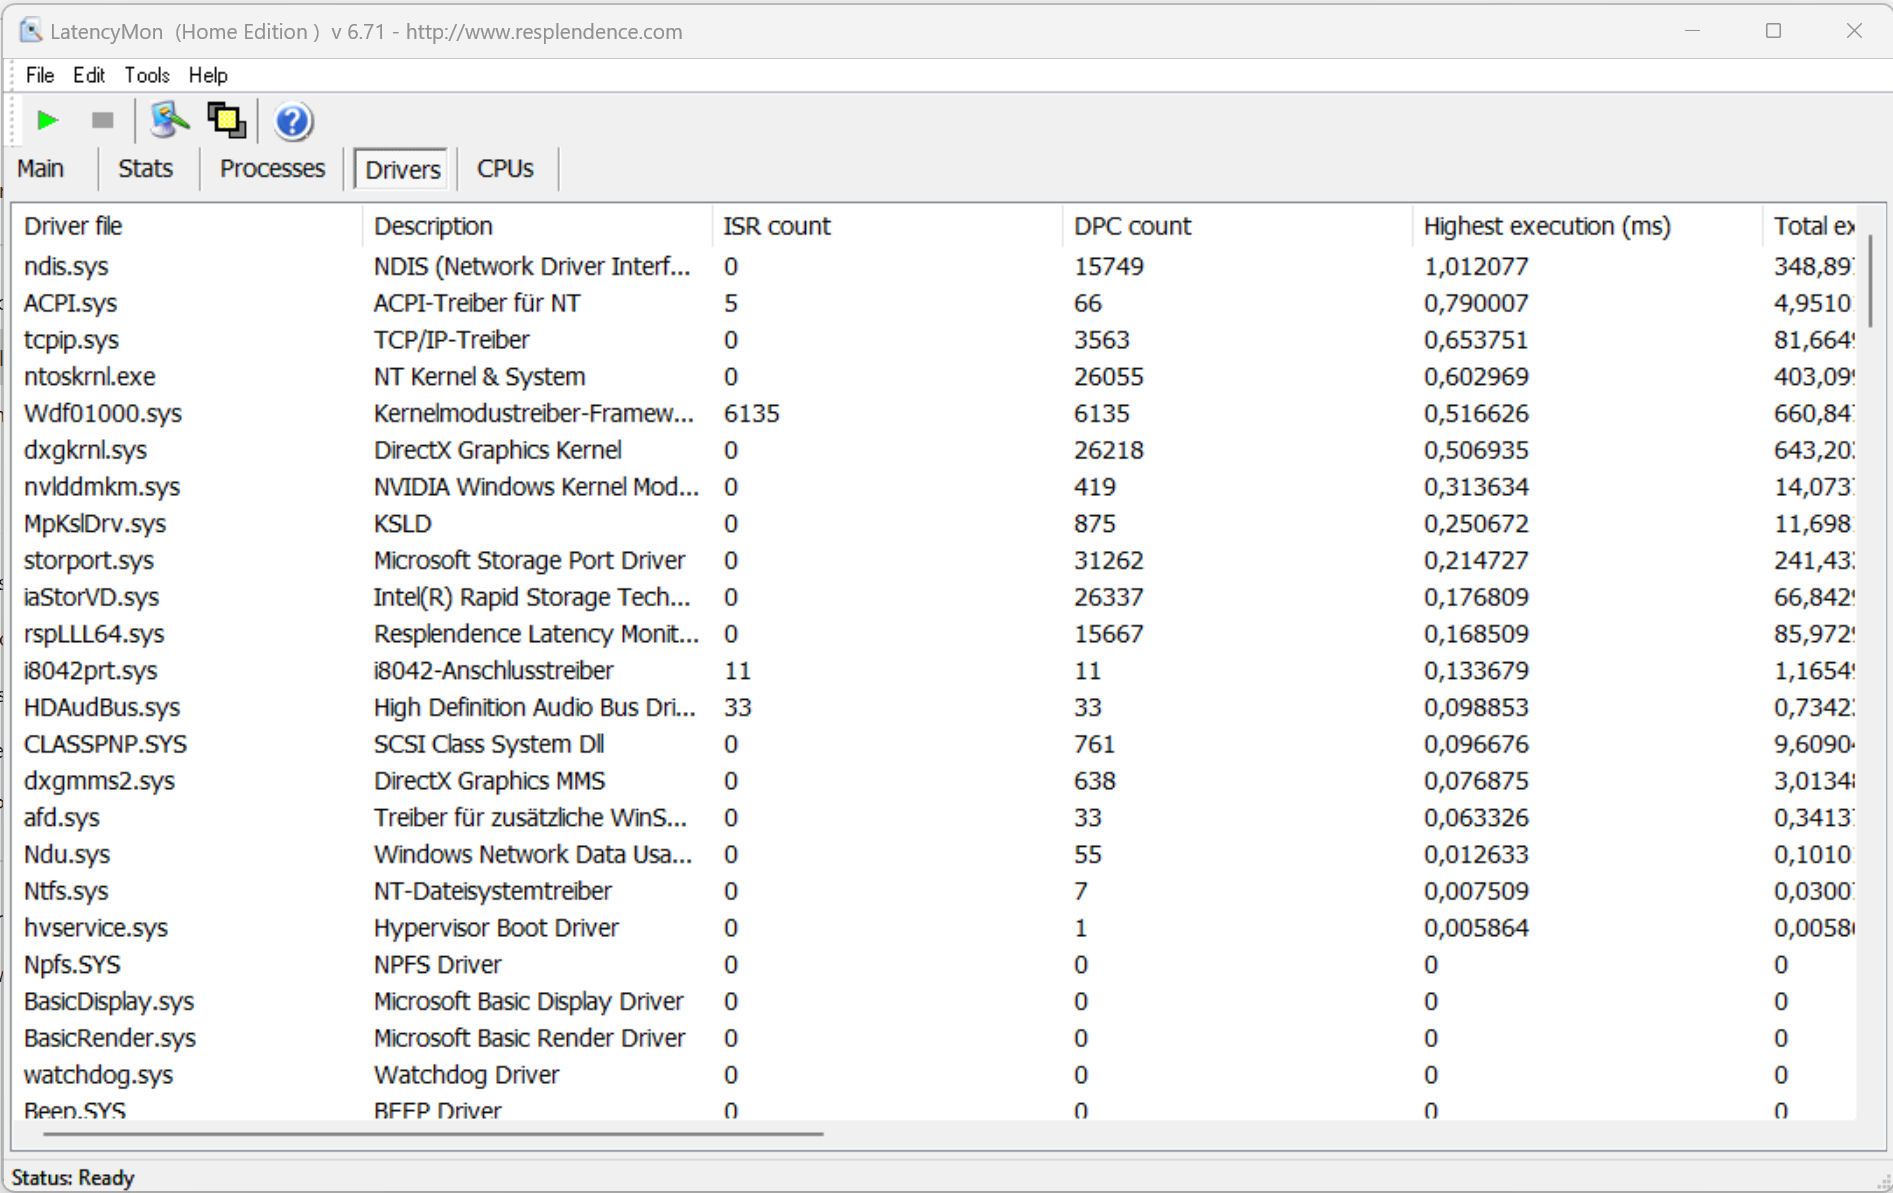
DPC latencies
The standardized Latency Monitor test (internet surfing, 4k video playback, Prime95) revealed abnormalities. The system doesn't appear to be suitable for real time video and audio editing. Future software updates could either improve or worsen matters.

| DPC Latencies / LatencyMon - interrupt to process latency (max), Web, Youtube, Prime95 | |
| Gigabyte Aero 14 OLED BMF | |
| MSI Stealth 14 Studio A13V | |
| Acer Predator Triton 14 PT14-51 | |
| Asus ROG Zephyrus G14 GA402RJ | |
| Razer Blade 14 RTX 4070 | |
* ... smaller is better
Mass storage
Storage stinginess at Acer: The installed PCIe 4 SSD (M.2 2280) has a capacity of only 512 GB - not enough for a gaming laptop and especially one in this price category. The Micron SSD is very decent but does not have outstanding transfer speeds. Cons: In the course of the DiskSpd loop, there are performance dips due to thermal throttling. There is no space for an additional storage medium.

* ... smaller is better
Continuous Performance Read: DiskSpd Read Loop, Queue Depth 8
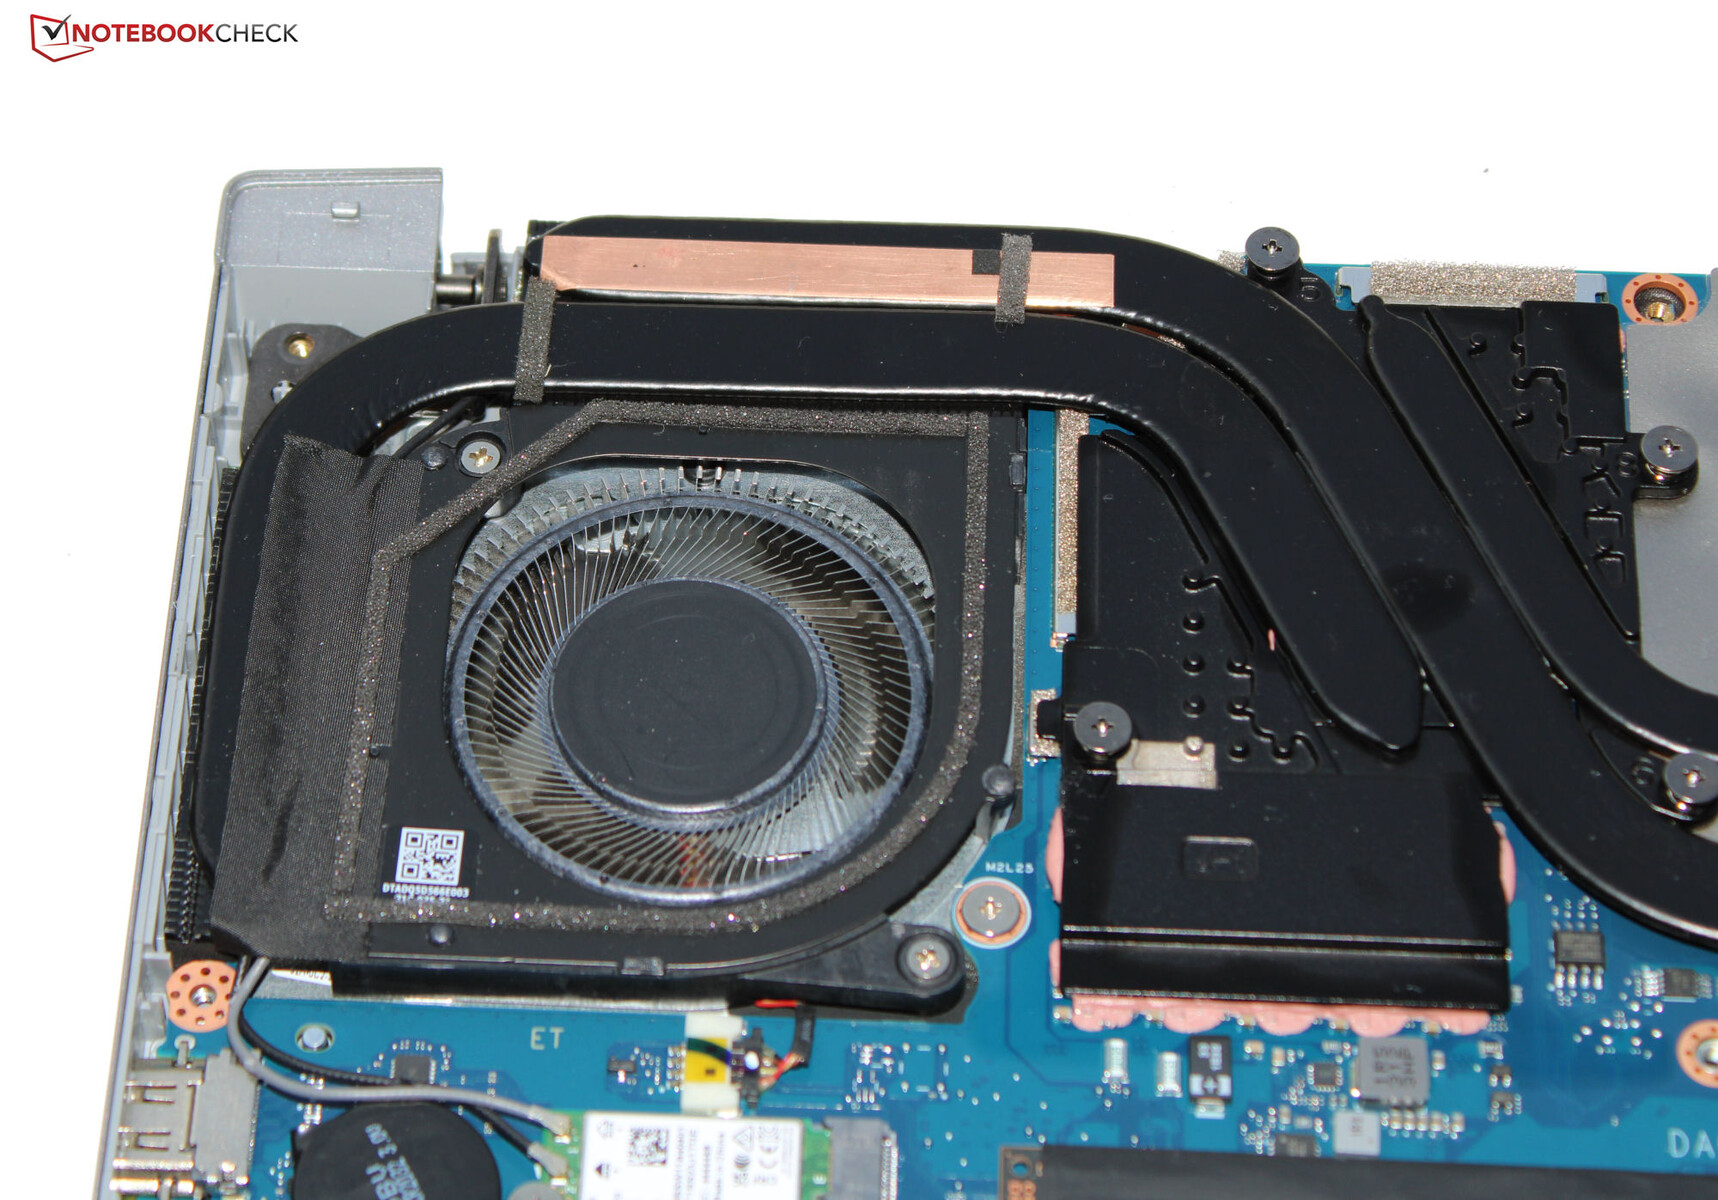
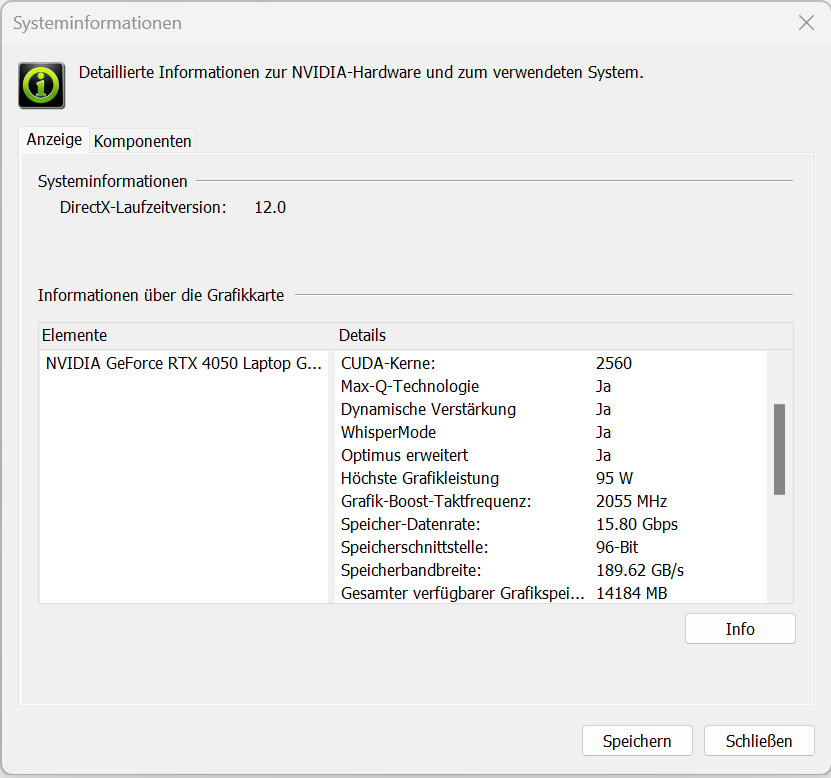
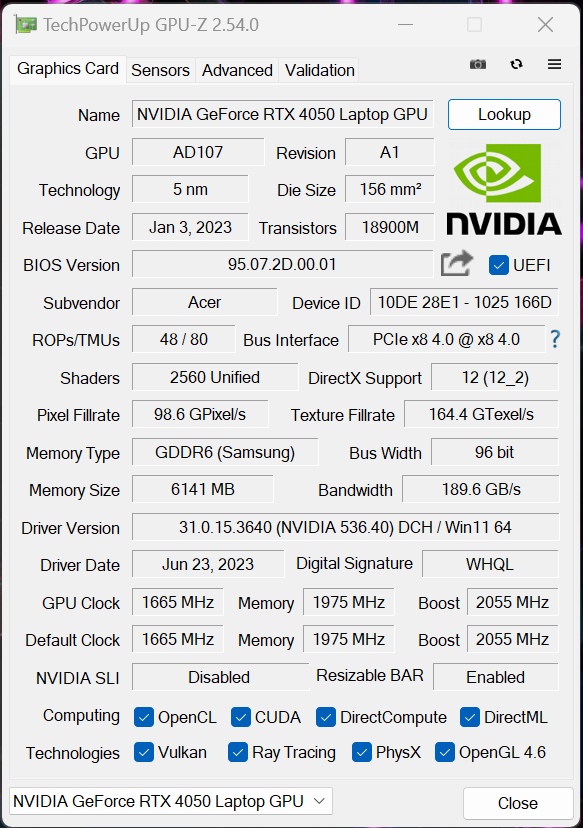
Graphics card
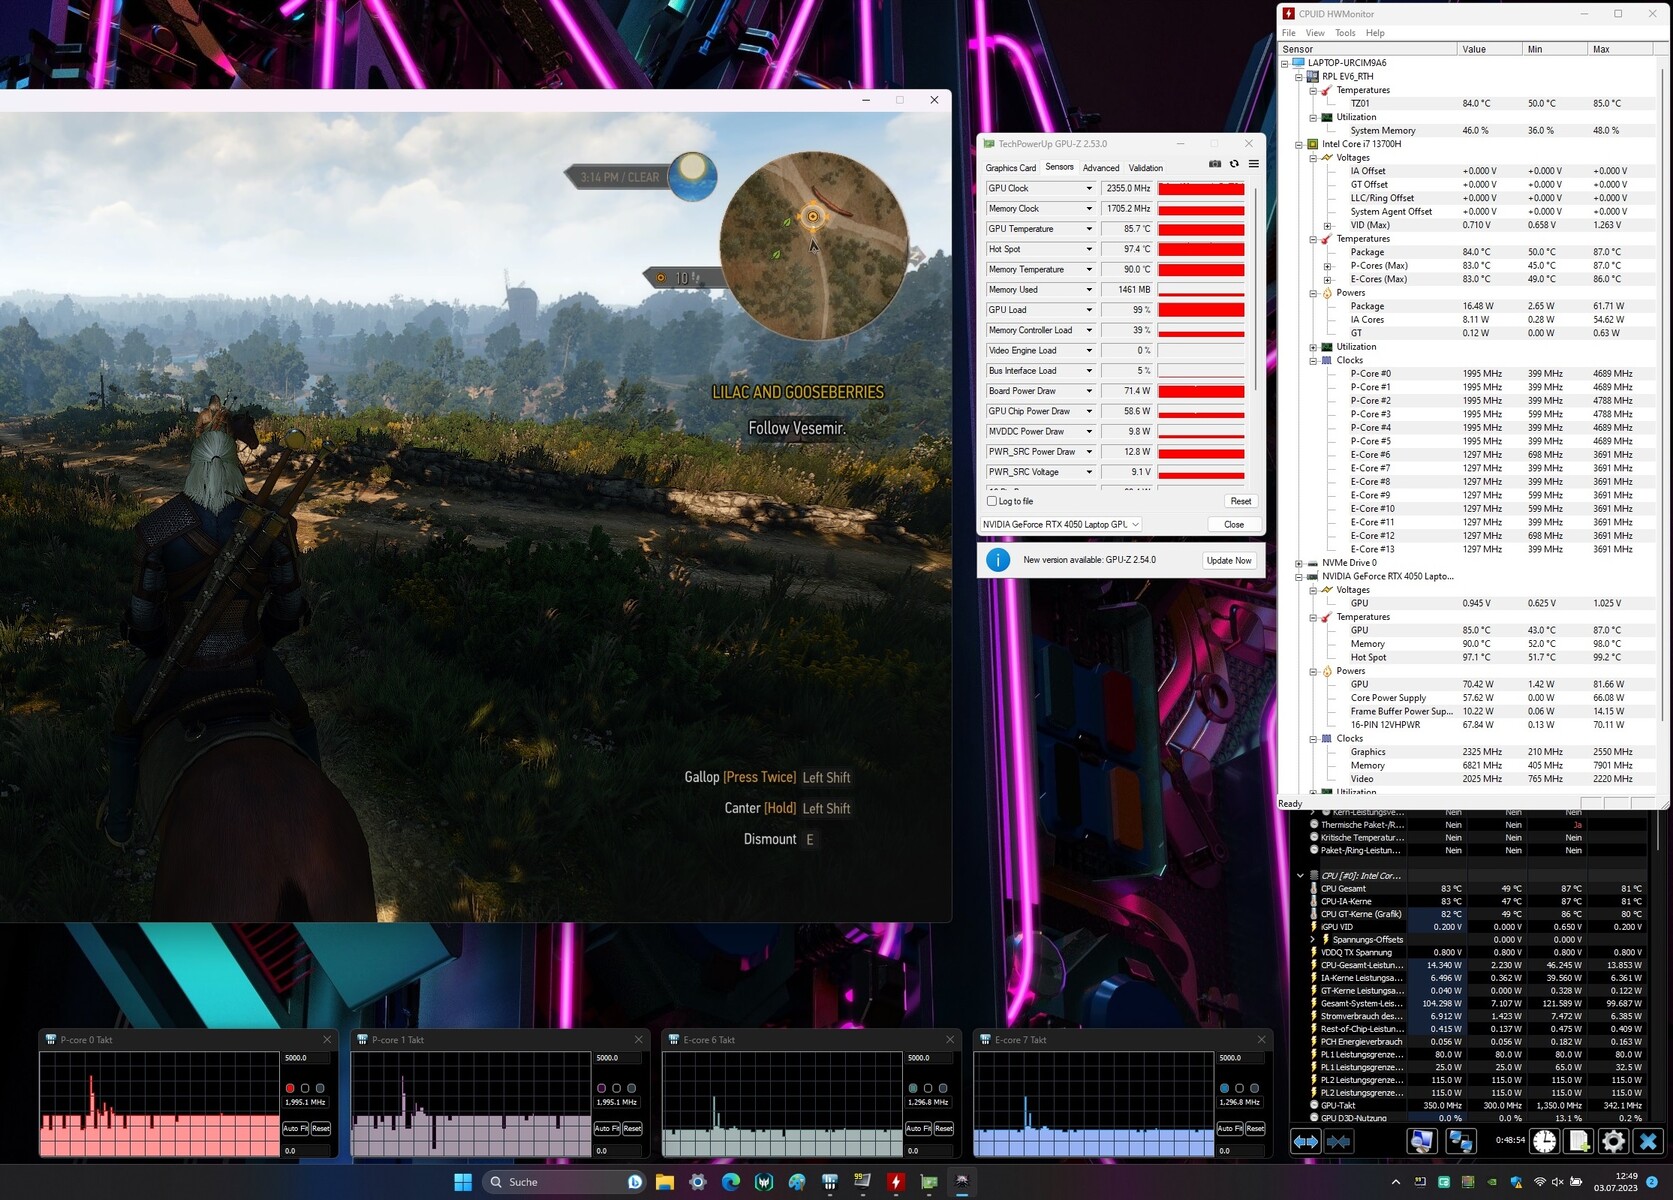
The GeForce RTX 4050 laptop GPU offers 2,560 shaders, a 96-bit wide bus and fast GDDR6 RAM (6,144 MB). Acer has set the maximum TGP to 95 watts. According to the Witcher 3 test, the TGP is not maxed out.
The benchmark results are above the RTX 4050 average. However, this doesn't apply when using the "Quiet" mode. The direct video output via the GeForce GPU doesn't provide an increase in performance and switching between the dGPU and Optimus doesn't require a reboot - Advanced Optimus is supported.


| 3DMark 11 - 1280x720 Performance GPU | |
| Razer Blade 14 RTX 4070 | |
| Average of class Gaming (1029 - 72070, n=236, last 2 years) | |
| Asus ROG Zephyrus G14 GA402RJ | |
| MSI Stealth 14 Studio A13V | |
| Acer Predator Triton 14 PT14-51 | |
| Average NVIDIA GeForce RTX 4050 Laptop GPU (19643 - 32642, n=28) | |
| Gigabyte Aero 14 OLED BMF | |
| 3DMark | |
| 1280x720 Cloud Gate Standard Graphics | |
| Asus ROG Zephyrus G14 GA402RJ | |
| Acer Predator Triton 14 PT14-51 | |
| Average of class Gaming (15902 - 193851, n=161, last 2 years) | |
| MSI Stealth 14 Studio A13V | |
| Average NVIDIA GeForce RTX 4050 Laptop GPU (51138 - 161152, n=20) | |
| Gigabyte Aero 14 OLED BMF | |
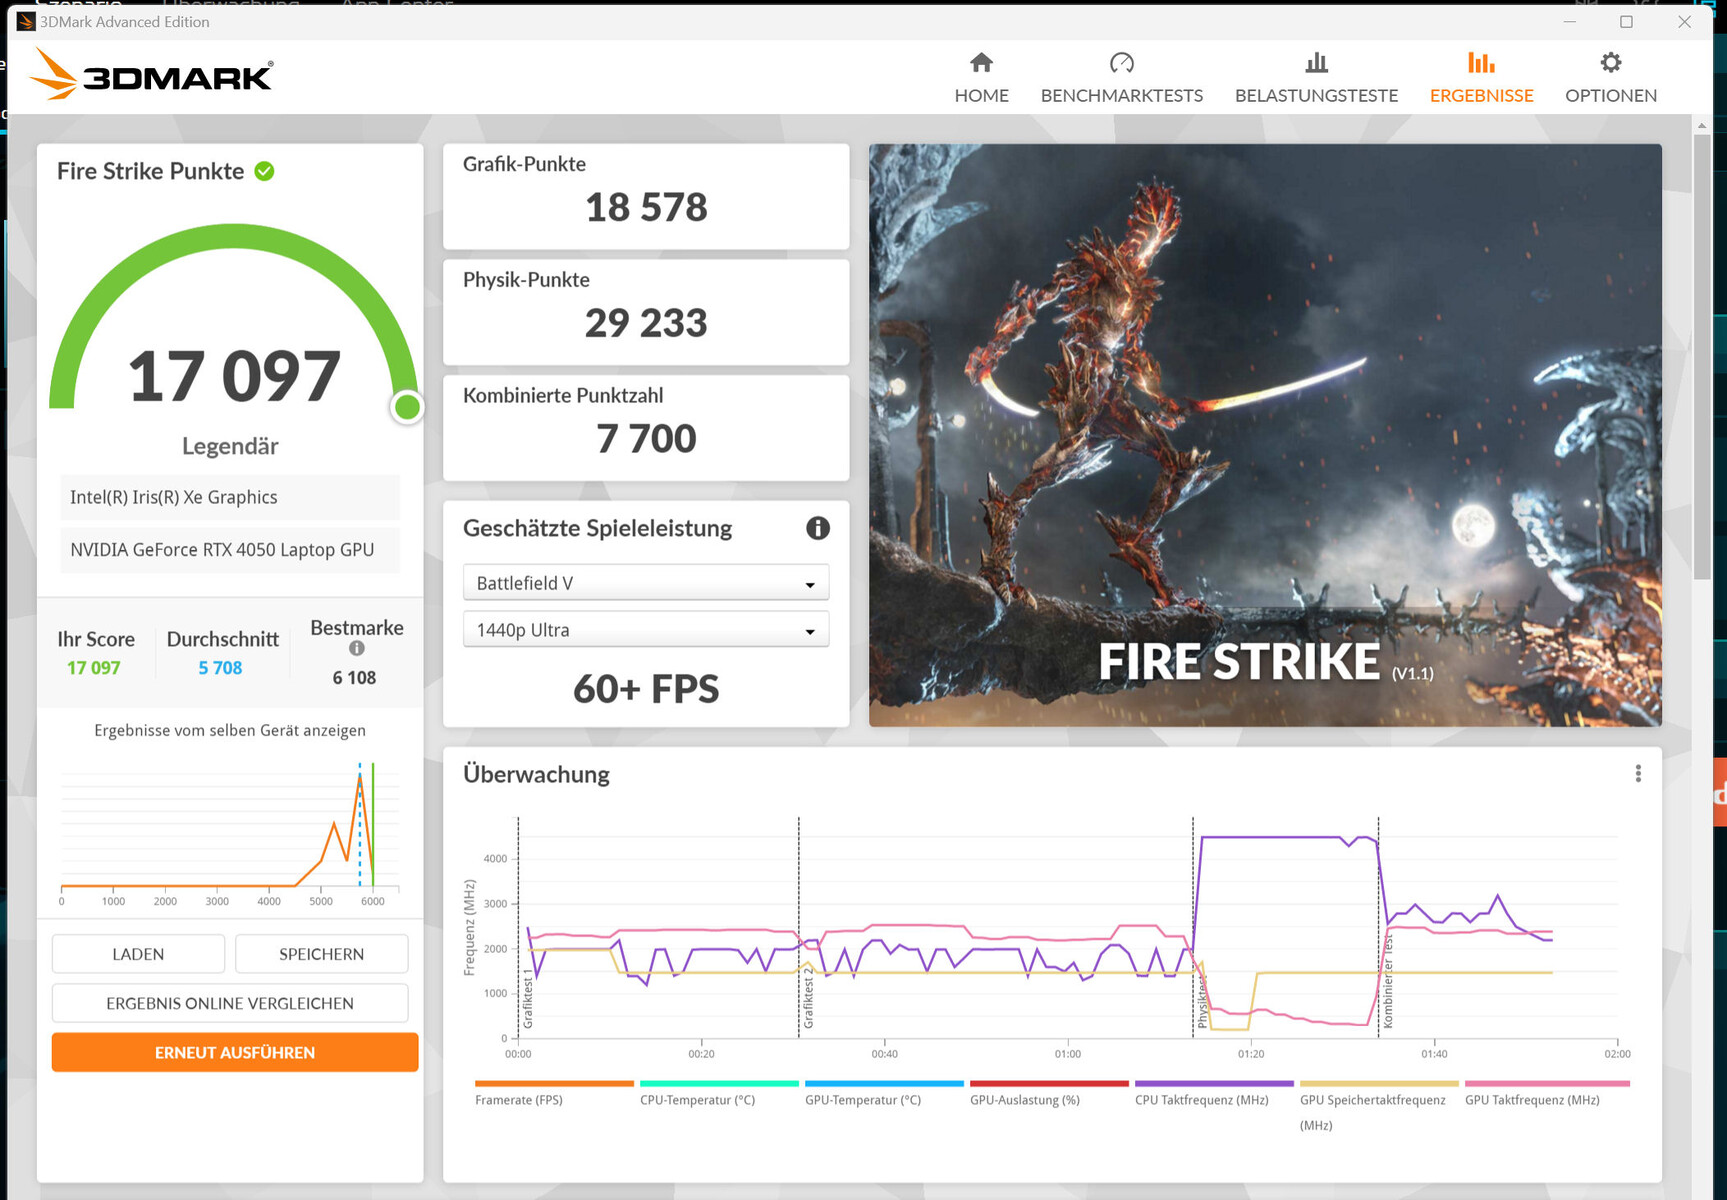
| 1920x1080 Fire Strike Graphics | |
| Razer Blade 14 RTX 4070 | |
| Average of class Gaming (781 - 53059, n=244, last 2 years) | |
| Asus ROG Zephyrus G14 GA402RJ | |
| Acer Predator Triton 14 PT14-51 | |
| MSI Stealth 14 Studio A13V | |
| Average NVIDIA GeForce RTX 4050 Laptop GPU (14121 - 24007, n=27) | |
| Gigabyte Aero 14 OLED BMF | |
| 2560x1440 Time Spy Graphics | |
| Razer Blade 14 RTX 4070 | |
| Average of class Gaming (224 - 22547, n=242, last 2 years) | |
| Asus ROG Zephyrus G14 GA402RJ | |
| Acer Predator Triton 14 PT14-51 | |
| Average NVIDIA GeForce RTX 4050 Laptop GPU (5123 - 9040, n=27) | |
| MSI Stealth 14 Studio A13V | |
| Gigabyte Aero 14 OLED BMF | |
| 3DMark 06 Standard Score | 52667 points | |
| 3DMark 11 Performance | 27364 points | |
| 3DMark Cloud Gate Standard Score | 61034 points | |
| 3DMark Fire Strike Score | 19711 points | |
| 3DMark Time Spy Score | 8580 points | |
Help | ||
| Blender | |
| v3.3 Classroom OPTIX/RTX | |
| Gigabyte Aero 14 OLED BMF | |
| Average NVIDIA GeForce RTX 4050 Laptop GPU (25 - 36, n=28) | |
| MSI Stealth 14 Studio A13V | |
| Acer Predator Triton 14 PT14-51 | |
| Average of class Gaming (9 - 142, n=140, last 2 years) | |
| Razer Blade 14 RTX 4070 | |
| v3.3 Classroom CUDA | |
| MSI Stealth 14 Studio A13V | |
| Gigabyte Aero 14 OLED BMF | |
| Average NVIDIA GeForce RTX 4050 Laptop GPU (47 - 175, n=29) | |
| Acer Predator Triton 14 PT14-51 | |
| Average of class Gaming (16 - 175, n=145, last 2 years) | |
| Razer Blade 14 RTX 4070 | |
| Geekbench 5.5 | |
| OpenCL Score | |
| Average of class Gaming (6841 - 226512, n=242, last 2 years) | |
| Razer Blade 14 RTX 4070 | |
| MSI Stealth 14 Studio A13V | |
| Average NVIDIA GeForce RTX 4050 Laptop GPU (69499 - 90075, n=27) | |
| Acer Predator Triton 14 PT14-51 | |
| Asus ROG Zephyrus G14 GA402RJ | |
| Gigabyte Aero 14 OLED BMF | |
| Apple MacBook Pro 14 2023 M2 Pro Entry | |
| Vulkan Score | |
| Razer Blade 14 RTX 4070 | |
| Average of class Gaming (1806 - 134644, n=241, last 2 years) | |
| Average NVIDIA GeForce RTX 4050 Laptop GPU (9849 - 59879, n=27) | |
| Asus ROG Zephyrus G14 GA402RJ | |
| Gigabyte Aero 14 OLED BMF | |
| MSI Stealth 14 Studio A13V | |
| Acer Predator Triton 14 PT14-51 | |
| Geekbench 6.2 | |
| GPU Vulkan | |
| Average NVIDIA GeForce RTX 4050 Laptop GPU (21143 - 82430, n=10) | |
| Average of class Gaming (4286 - 157614, n=31, last 2 years) | |
| Acer Predator Triton 14 PT14-51 | |
| GPU OpenCL | |
| Average of class Gaming (25579 - 205902, n=31, last 2 years) | |
| Average NVIDIA GeForce RTX 4050 Laptop GPU (75938 - 86892, n=10) | |
| Acer Predator Triton 14 PT14-51 | |
| V-Ray 5 Benchmark | |
| GPU RTX | |
| Average of class Gaming (171 - 3824, n=118, last 2 years) | |
| Razer Blade 14 RTX 4070 | |
| Acer Predator Triton 14 PT14-51 | |
| Average NVIDIA GeForce RTX 4050 Laptop GPU (1021 - 1588, n=19) | |
| MSI Stealth 14 Studio A13V | |
| GPU CUDA | |
| Average of class Gaming (120 - 2797, n=123, last 2 years) | |
| Razer Blade 14 RTX 4070 | |
| Acer Predator Triton 14 PT14-51 | |
| MSI Stealth 14 Studio A13V | |
| Average NVIDIA GeForce RTX 4050 Laptop GPU (735 - 1123, n=19) | |
| CPU | |
| Acer Predator Triton 14 PT14-51 | |
| Razer Blade 14 RTX 4070 | |
| Average of class Gaming (1690 - 25897, n=143, last 2 years) | |
| MSI Stealth 14 Studio A13V | |
| Average NVIDIA GeForce RTX 4050 Laptop GPU (3562 - 14401, n=19) | |
| V-Ray Benchmark Next 4.10 | |
| GPU | |
| Average of class Gaming (55 - 1334, n=198, last 2 years) | |
| Acer Predator Triton 14 PT14-51 | |
| MSI Stealth 14 Studio A13V | |
| Average NVIDIA GeForce RTX 4050 Laptop GPU (340 - 529, n=24) | |
| Gigabyte Aero 14 OLED BMF | |
| Asus ROG Zephyrus G14 GA402RJ | |
| CPU | |
| Acer Predator Triton 14 PT14-51 | |
| MSI Stealth 14 Studio A13V | |
| Average of class Gaming (2741 - 37629, n=198, last 2 years) | |
| Average NVIDIA GeForce RTX 4050 Laptop GPU (5413 - 24181, n=24) | |
| Gigabyte Aero 14 OLED BMF | |
| Asus ROG Zephyrus G14 GA402RJ | |
* ... smaller is better
Gaming performance
The Predator's hardware is intended for FHD gaming at high to maximum settings. Nevertheless, the screen's maximum resolution (2,560 x 1,600 pixels) can be taken advantage of - at sometimes lower settings. We measured frame rates above the RTX 4050 average.
| The Witcher 3 - 1920x1080 Ultra Graphics & Postprocessing (HBAO+) | |
| Average of class Gaming (8.61 - 216, n=236, last 2 years) | |
| Razer Blade 14 RTX 4070 | |
| Asus ROG Zephyrus G14 GA402RJ | |
| Acer Predator Triton 14 PT14-51 | |
| MSI Stealth 14 Studio A13V | |
| Average NVIDIA GeForce RTX 4050 Laptop GPU (18.5 - 94.7, n=31) | |
| Gigabyte Aero 14 OLED BMF | |
| Gigabyte Aero 14 OLED BMF | |
| Apple MacBook Pro 14 2023 M2 Pro Entry | |
| Final Fantasy XV Benchmark - 1920x1080 High Quality | |
| Razer Blade 14 RTX 4070 | |
| Average of class Gaming (9.13 - 194.9, n=234, last 2 years) | |
| MSI Stealth 14 Studio A13V | |
| Acer Predator Triton 14 PT14-51 | |
| Asus ROG Zephyrus G14 GA402RJ | |
| Average NVIDIA GeForce RTX 4050 Laptop GPU (15.5 - 122.3, n=27) | |
| Gigabyte Aero 14 OLED BMF | |
| Strange Brigade - 1920x1080 ultra AA:ultra AF:16 | |
| Razer Blade 14 RTX 4070 | |
| Average of class Gaming (14.6 - 421, n=233, last 2 years) | |
| Asus ROG Zephyrus G14 GA402RJ | |
| Acer Predator Triton 14 PT14-51 | |
| Average NVIDIA GeForce RTX 4050 Laptop GPU (21.2 - 156.6, n=26) | |
| MSI Stealth 14 Studio A13V | |
| Gigabyte Aero 14 OLED BMF | |
| Dota 2 Reborn - 1920x1080 ultra (3/3) best looking | |
| Average of class Gaming (26.9 - 220, n=248, last 2 years) | |
| Razer Blade 14 RTX 4070 | |
| MSI Stealth 14 Studio A13V | |
| Average NVIDIA GeForce RTX 4050 Laptop GPU (73.5 - 175.6, n=27) | |
| Gigabyte Aero 14 OLED BMF | |
| Acer Predator Triton 14 PT14-51 | |
| Asus ROG Zephyrus G14 GA402RJ | |
| X-Plane 11.11 - 1920x1080 high (fps_test=3) | |
| Acer Predator Triton 14 PT14-51 | |
| Gigabyte Aero 14 OLED BMF | |
| Gigabyte Aero 14 OLED BMF | |
| MSI Stealth 14 Studio A13V | |
| Average of class Gaming (12.4 - 166.2, n=252, last 2 years) | |
| Average NVIDIA GeForce RTX 4050 Laptop GPU (65 - 117, n=28) | |
| Razer Blade 14 RTX 4070 | |
| Asus ROG Zephyrus G14 GA402RJ | |
| The Last of Us - 1920x1080 Ultra Preset | |
| Razer Blade 14 RTX 4070 | |
| Average of class Gaming (42.8 - 105, n=12, last 2 years) | |
| Average NVIDIA GeForce RTX 4050 Laptop GPU (35.7 - 50.2, n=3) | |
| Acer Predator Triton 14 PT14-51 | |
| Gigabyte Aero 14 OLED BMF | |
| The Callisto Protocol | |
| 2560x1440 Ultra Preset (without FSR Upscaling) | |
| Average of class Gaming (35.6 - 126.7, n=17, last 2 years) | |
| Acer Predator Triton 14 PT14-51 | |
| Average NVIDIA GeForce RTX 4050 Laptop GPU (29.5 - 46.7, n=3) | |
| 1920x1080 Ultra Preset (without FSR Upscaling) | |
| Average of class Gaming (10.3 - 150.7, n=20, last 2 years) | |
| Acer Predator Triton 14 PT14-51 | |
| Average NVIDIA GeForce RTX 4050 Laptop GPU (41.4 - 63.1, n=3) | |
| 1920x1080 Ultra Preset (without FSR Upscaling) + Full Ray-Tracing | |
| Average of class Gaming (32 - 79.6, n=15, last 2 years) | |
| Acer Predator Triton 14 PT14-51 | |
| Average NVIDIA GeForce RTX 4050 Laptop GPU (31 - 49.9, n=3) | |
| Star Wars Jedi Survivor | |
| 1920x1080 Epic Preset | |
| Average of class Gaming (29.4 - 117.4, n=17, last 2 years) | |
| Average NVIDIA GeForce RTX 4050 Laptop GPU (48.4 - 56, n=7) | |
| Medion Erazer Scout E20 | |
| Acer Predator Triton 14 PT14-51 | |
| 2560x1440 Epic Preset | |
| Average of class Gaming (30.4 - 88.4, n=13, last 2 years) | |
| Average NVIDIA GeForce RTX 4050 Laptop GPU (30.4 - 35, n=4) | |
| Acer Predator Triton 14 PT14-51 | |
| 1920x1080 Epic Preset + Ray Tracing | |
| Average of class Gaming (38.6 - 85.3, n=7, last 2 years) | |
| Average NVIDIA GeForce RTX 4050 Laptop GPU (38.6 - 42, n=4) | |
| Medion Erazer Scout E20 | |
| Acer Predator Triton 14 PT14-51 | |
| F1 23 | |
| 1920x1080 Ultra High Preset AA:T AF:16x | |
| Average of class Gaming (12.9 - 132, n=24, last 2 years) | |
| Average NVIDIA GeForce RTX 4050 Laptop GPU (39.5 - 60.8, n=12) | |
| Acer Predator Triton 14 PT14-51 | |
| 2560x1440 Ultra High Preset AA:T AF:16x | |
| Average of class Gaming (31 - 85.1, n=16, last 2 years) | |
| Average NVIDIA GeForce RTX 4050 Laptop GPU (25.6 - 40.8, n=9) | |
| Acer Predator Triton 14 PT14-51 | |
| Dead Island 2 | |
| 2560x1440 Ultra Preset AA:High T | |
| Average of class Gaming (61.8 - 178.5, n=5, last 2 years) | |
| Average NVIDIA GeForce RTX 4050 Laptop GPU (61.8 - 76.5, n=2) | |
| Acer Predator Triton 14 PT14-51 | |
| 1920x1080 Ultra Preset AA:High T | |
| Medion Erazer Scout E20 | |
| Average NVIDIA GeForce RTX 4050 Laptop GPU (90.9 - 133.5, n=3) | |
| Average of class Gaming (14.6 - 181.7, n=9, last 2 years) | |
| Acer Predator Triton 14 PT14-51 | |
In order to check whether the frame rates remain stable over a longer period of time, we ran the Witcher 3 game for around 60 minutes at FullHD resolution and maximum quality settings. The game character was not moved and we did not detect a dip in the frame rate.
Witcher 3 FPS diagram


| low | med. | high | ultra | QHD | |
| The Witcher 3 (2015) | 393.7 | 253.3 | 149.7 | 80.1 | |
| Dota 2 Reborn (2015) | 159.4 | 141.8 | 132.6 | 127.2 | |
| Final Fantasy XV Benchmark (2018) | 183 | 110.5 | 79.2 | 58.2 | |
| X-Plane 11.11 (2018) | 138.1 | 128.6 | 100.2 | ||
| Far Cry 5 (2018) | 174 | 131 | 122 | 113 | 79 |
| Strange Brigade (2018) | 467 | 194.8 | 159.4 | 137 | 94.9 |
| F1 22 (2022) | 210 | 194.4 | 147.2 | 48.5 | 31 |
| The Callisto Protocol (2022) | 119 | 96 | 93.3 | 63.1 | 46.7 |
| The Last of Us (2023) | 82.2 | 67.4 | 56.2 | 42.8 | |
| Dead Island 2 (2023) | 201 | 171.8 | 125.9 | 90.9 | 61.8 |
| Star Wars Jedi Survivor (2023) | 60.6 | 54.6 | 51.6 | 48.4 | 30.4 |
| F1 23 (2023) | 197.9 | 194.8 | 139.8 | 40.5 | 31 |
Emissions - The Acer laptop can run quietly
Noise emissions
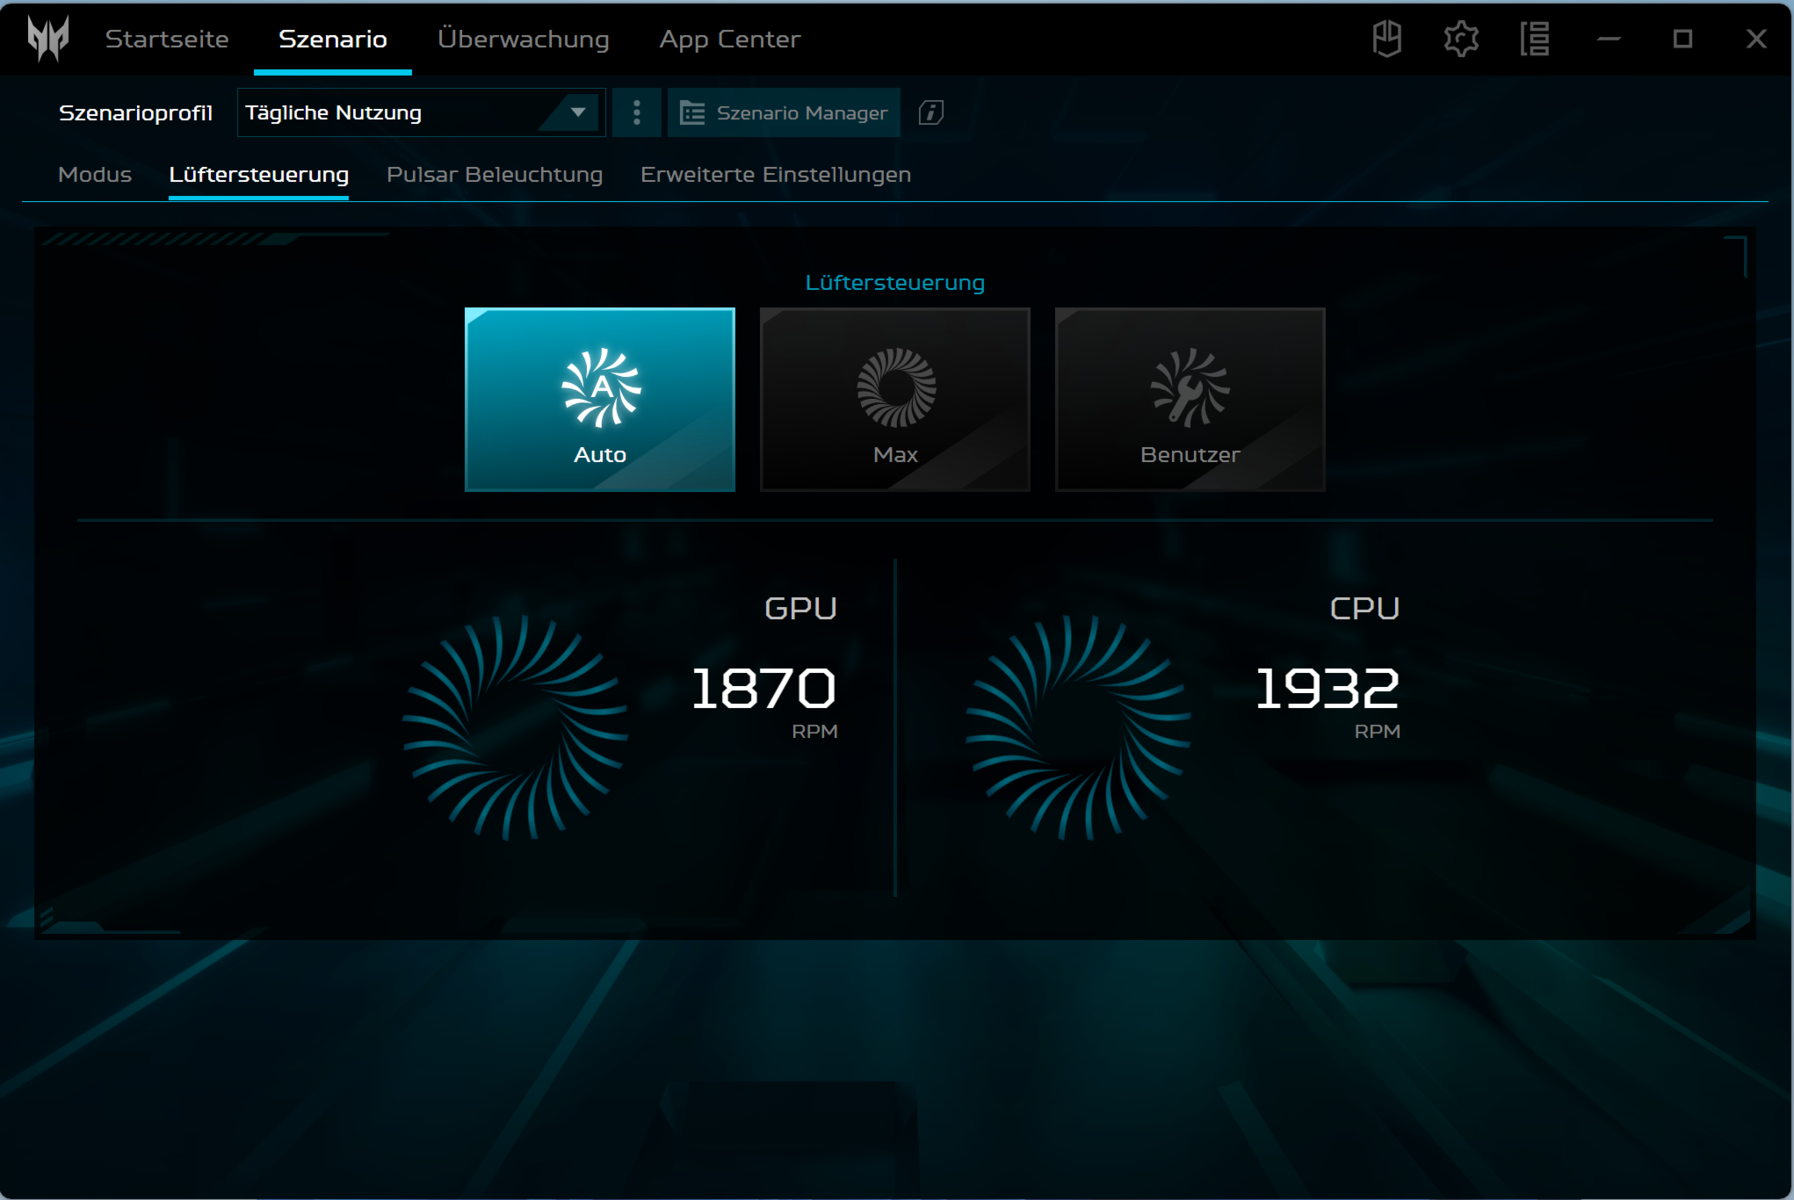
In everyday use (office, internet, ...) the Triton usually runs quietly - irrespective of the selected mode. The noise level can increase to up to 56 dB(A) ("Turbo") and 53 dB(A) ("Performance"), respectively. We used the "Balanced" and recorded a moderate 43 dB(A). Overall, lower noise production can be achieved by applying the "Quiet" mode - with a relatively small drop in performance.
Noise Level
| Idle |
| 27 / 29 / 31 dB(A) |
| Load |
| 42 / 45 dB(A) |
 | ||
30 dB silent 40 dB(A) audible 50 dB(A) loud |
||
min: | ||
| Acer Predator Triton 14 PT14-51 i7-13700H, NVIDIA GeForce RTX 4050 Laptop GPU | Razer Blade 14 RTX 4070 R9 7940HS, NVIDIA GeForce RTX 4070 Laptop GPU | Asus ROG Zephyrus G14 GA402RJ R7 6800HS, Radeon RX 6700S | MSI Stealth 14 Studio A13V i7-13700H, NVIDIA GeForce RTX 4050 Laptop GPU | Gigabyte Aero 14 OLED BMF i7-13700H, NVIDIA GeForce RTX 4050 Laptop GPU | Apple MacBook Pro 14 2023 M2 Pro Entry M2 Pro 10-Core, M2 Pro 16-Core GPU | |
|---|---|---|---|---|---|---|
| Noise | 6% | 2% | -3% | 1% | 16% | |
| off / environment * | 25 | 22.7 9% | 25 -0% | 25.3 -1% | 24 4% | 23.6 6% |
| Idle Minimum * | 27 | 23.4 13% | 25 7% | 25.3 6% | 24 11% | 23.6 13% |
| Idle Average * | 29 | 23.4 19% | 26 10% | 25 14% | 24 17% | 23.6 19% |
| Idle Maximum * | 31 | 23.4 25% | 29 6% | 33.7 -9% | 35.71 -15% | 23.6 24% |
| Load Average * | 42 | 33 21% | 45 -7% | 42.2 -0% | 24.2 42% | |
| Witcher 3 ultra * | 43 | 51.8 -20% | 43 -0% | 51 -19% | 40.22 6% | |
| Load Maximum * | 45 | 55.6 -24% | 45 -0% | 51 -13% | 51.93 -15% | 47.5 -6% |
* ... smaller is better
Temperature
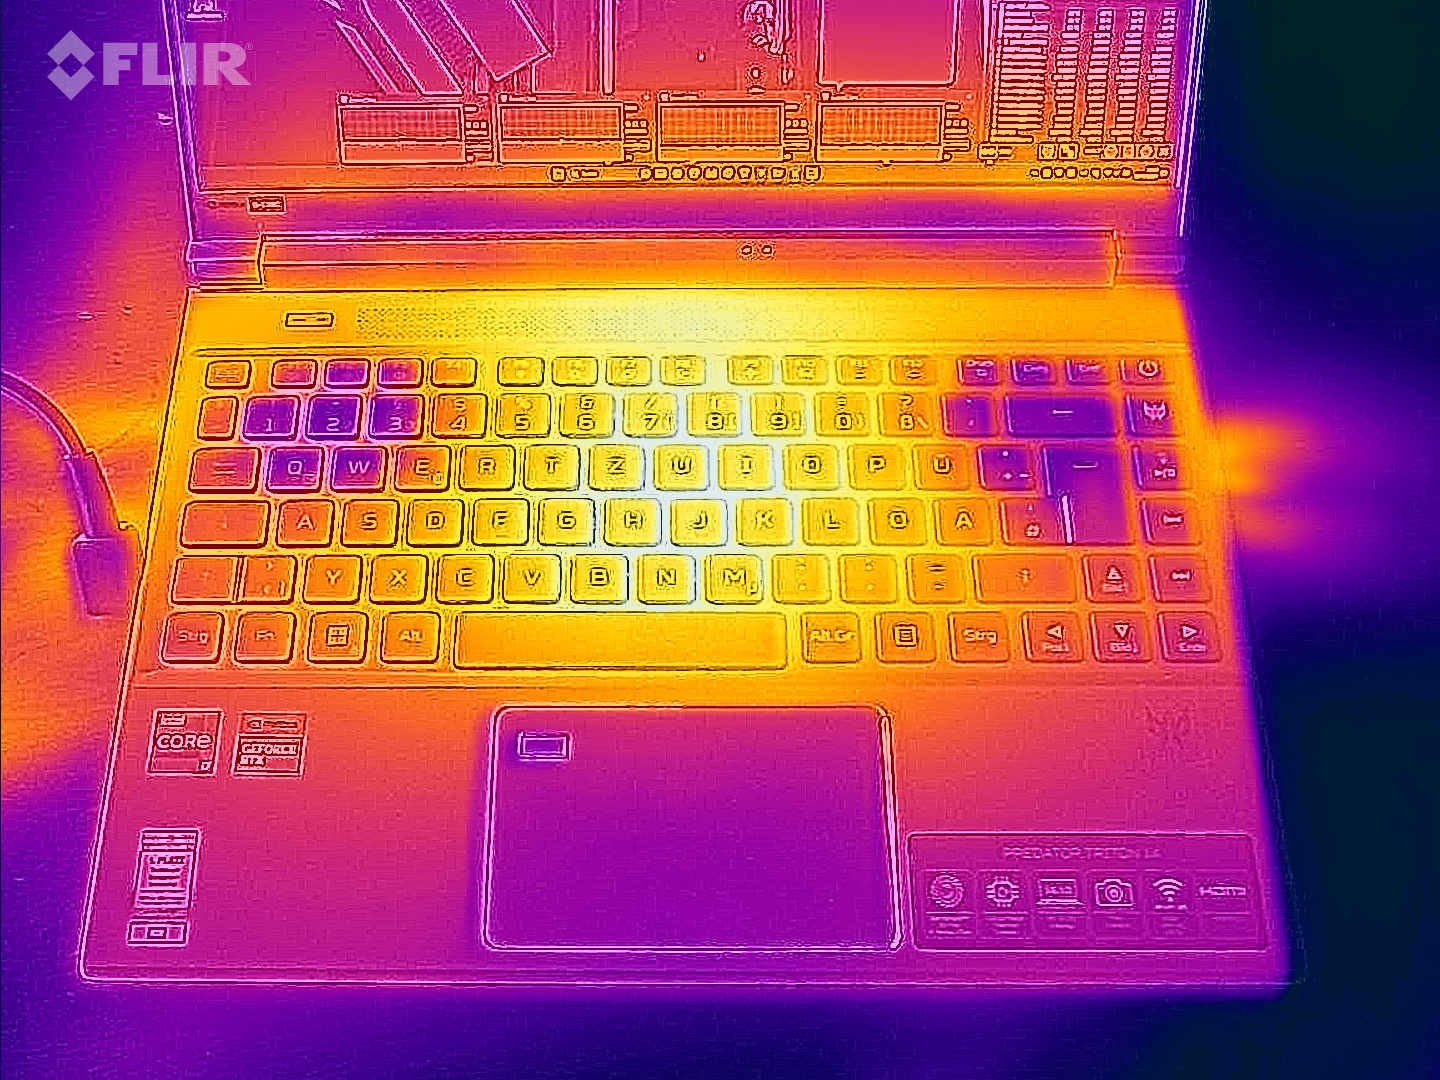
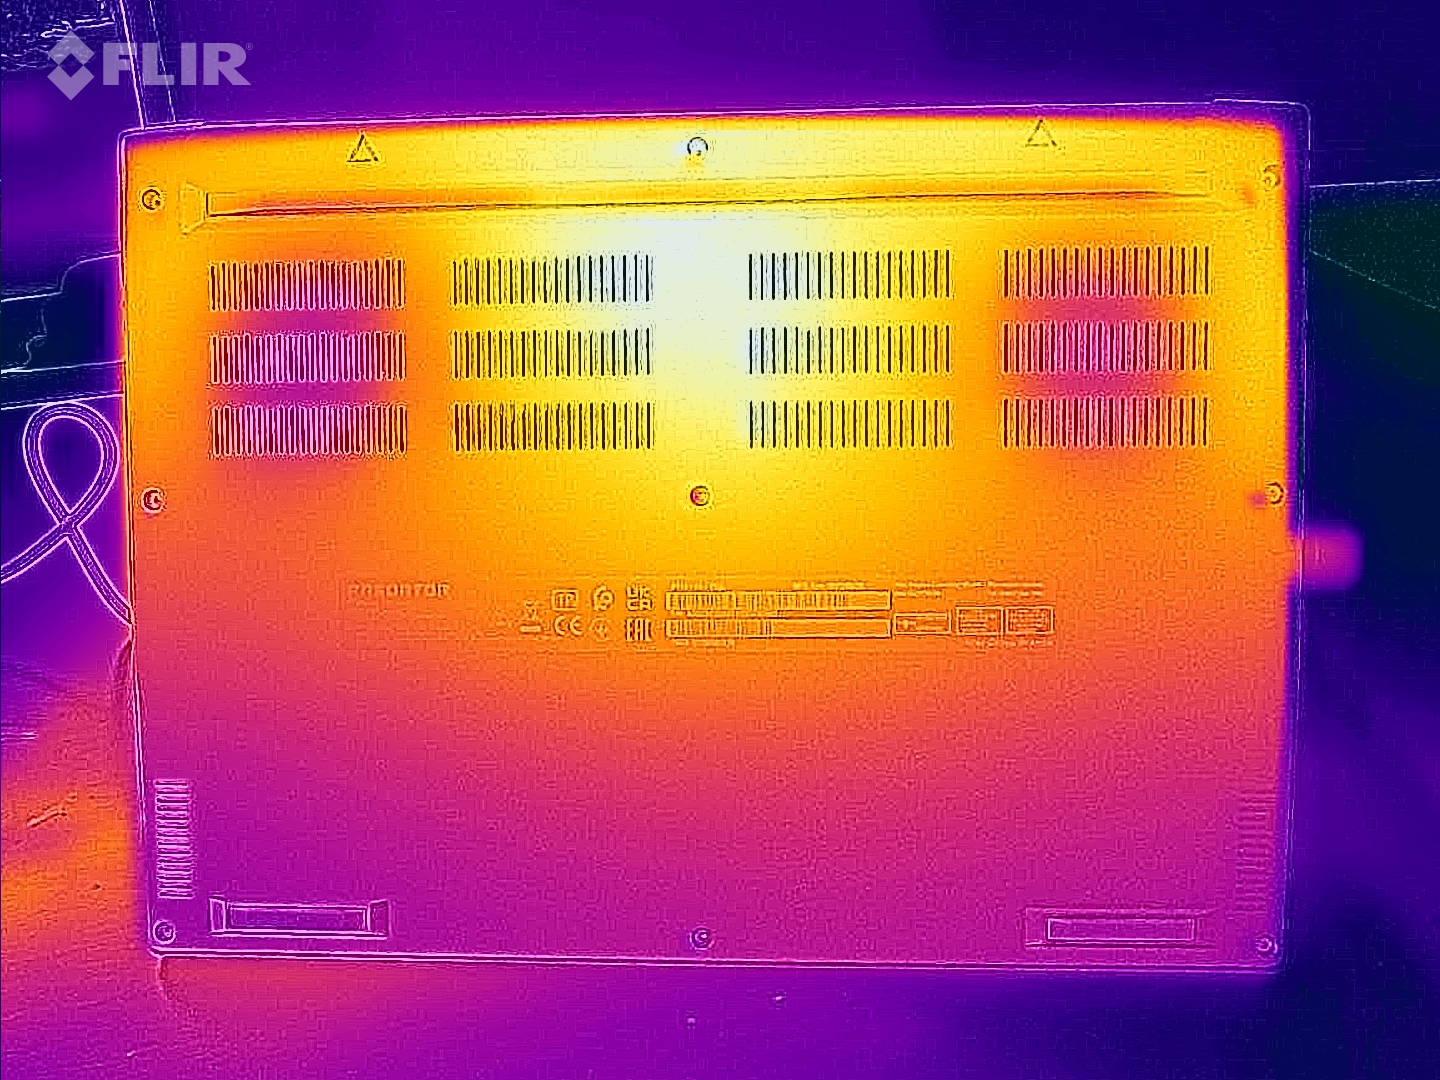
Under load, the laptop heats up noticeably. At several measuring points, we recorded temperatures between 50 and 56 °C. When it comes to everyday use, these figures are in the green zone.
(-) The maximum temperature on the upper side is 54 °C / 129 F, compared to the average of 40.4 °C / 105 F, ranging from 21.2 to 68.8 °C for the class Gaming.
(-) The bottom heats up to a maximum of 56 °C / 133 F, compared to the average of 43.3 °C / 110 F
(+) In idle usage, the average temperature for the upper side is 29.1 °C / 84 F, compared to the device average of 33.9 °C / 93 F.
(-) Playing The Witcher 3, the average temperature for the upper side is 46.7 °C / 116 F, compared to the device average of 33.9 °C / 93 F.
(-) The palmrests and touchpad can get very hot to the touch with a maximum of 41 °C / 105.8 F.
(-) The average temperature of the palmrest area of similar devices was 29 °C / 84.2 F (-12 °C / -21.6 F).
| Acer Predator Triton 14 PT14-51 Intel Core i7-13700H, NVIDIA GeForce RTX 4050 Laptop GPU | Razer Blade 14 RTX 4070 AMD Ryzen 9 7940HS, NVIDIA GeForce RTX 4070 Laptop GPU | Asus ROG Zephyrus G14 GA402RJ AMD Ryzen 7 6800HS, AMD Radeon RX 6700S | MSI Stealth 14 Studio A13V Intel Core i7-13700H, NVIDIA GeForce RTX 4050 Laptop GPU | Gigabyte Aero 14 OLED BMF Intel Core i7-13700H, NVIDIA GeForce RTX 4050 Laptop GPU | Apple MacBook Pro 14 2023 M2 Pro Entry Apple M2 Pro 10-Core, Apple M2 Pro 16-Core GPU | |
|---|---|---|---|---|---|---|
| Heat | 11% | -7% | -5% | 15% | 24% | |
| Maximum Upper Side * | 54 | 37.4 31% | 53 2% | 46.9 13% | 42 22% | 47 13% |
| Maximum Bottom * | 56 | 35.2 37% | 54 4% | 56.1 -0% | 52 7% | 42.8 24% |
| Idle Upper Side * | 31 | 33.2 -7% | 34 -10% | 33.8 -9% | 26 16% | 22.3 28% |
| Idle Bottom * | 31 | 36.2 -17% | 38 -23% | 37.9 -22% | 27 13% | 21.7 30% |
* ... smaller is better
Stress test
The stress test (Prime95 and Furmark in continuous operation) is an extreme scenario which examines the system stability under full load. The CPU clock speed drops initially from 4.4 to 4.5 GHz (P) and 3.1 GHz (E) and then gradually from 2.1 to 2.2 GHz (P) and 1.3 GHz (E). The GPU clock speed levels off at 1,750 at 1,800 MHz.

Speakers
The stereo speakers produce decent sound which is mostly free of any bass. A better audio experience could be achieved by using headphones or an external speaker.
Acer Predator Triton 14 PT14-51 audio analysis
(±) | speaker loudness is average but good (80 dB)
Bass 100 - 315 Hz
(-) | nearly no bass - on average 18% lower than median
(±) | linearity of bass is average (11.8% delta to prev. frequency)
Mids 400 - 2000 Hz
(+) | balanced mids - only 3.7% away from median
(+) | mids are linear (4% delta to prev. frequency)
Highs 2 - 16 kHz
(+) | balanced highs - only 2.9% away from median
(±) | linearity of highs is average (7.2% delta to prev. frequency)
Overall 100 - 16.000 Hz
(±) | linearity of overall sound is average (15.4% difference to median)
Compared to same class
» 30% of all tested devices in this class were better, 7% similar, 63% worse
» The best had a delta of 7%, average was 19%, worst was 132%
Compared to all devices tested
» 17% of all tested devices were better, 4% similar, 79% worse
» The best had a delta of 4%, average was 26%, worst was 134%
Razer Blade 14 RTX 4070 audio analysis
(+) | speakers can play relatively loud (82.7 dB)
Bass 100 - 315 Hz
(-) | nearly no bass - on average 15.9% lower than median
(±) | linearity of bass is average (12.3% delta to prev. frequency)
Mids 400 - 2000 Hz
(+) | balanced mids - only 4.3% away from median
(+) | mids are linear (3.1% delta to prev. frequency)
Highs 2 - 16 kHz
(±) | higher highs - on average 6.2% higher than median
(+) | highs are linear (5.5% delta to prev. frequency)
Overall 100 - 16.000 Hz
(±) | linearity of overall sound is average (16.7% difference to median)
Compared to same class
» 39% of all tested devices in this class were better, 10% similar, 51% worse
» The best had a delta of 7%, average was 19%, worst was 132%
Compared to all devices tested
» 23% of all tested devices were better, 7% similar, 71% worse
» The best had a delta of 4%, average was 26%, worst was 134%
Energy management - The Acer computer achieves decent stamina levels
Power consumption
Nothing abnormal can be said regarding the computer's power consumption. The results find themselves in a normal range for the installed hardware. The stress test and Witcher 3 test were run with either dropping or constant power consumption. The PSU (230-watt) is more than adequately-sized.
| Off / Standby | |
| Idle | |
| Load |
|
| Acer Predator Triton 14 PT14-51 i7-13700H, NVIDIA GeForce RTX 4050 Laptop GPU | Razer Blade 14 RTX 4070 R9 7940HS, NVIDIA GeForce RTX 4070 Laptop GPU | Asus ROG Zephyrus G14 GA402RJ R7 6800HS, Radeon RX 6700S | MSI Stealth 14 Studio A13V i7-13700H, NVIDIA GeForce RTX 4050 Laptop GPU | Gigabyte Aero 14 OLED BMF i7-13700H, NVIDIA GeForce RTX 4050 Laptop GPU | Apple MacBook Pro 14 2023 M2 Pro Entry M2 Pro 10-Core, M2 Pro 16-Core GPU | Average NVIDIA GeForce RTX 4050 Laptop GPU | Average of class Gaming | |
|---|---|---|---|---|---|---|---|---|
| Power Consumption | -30% | -10% | -4% | 40% | 52% | 5% | -19% | |
| Idle Minimum * | 12 | 19.5 -63% | 12 -0% | 10.4 13% | 7.4 38% | 2.5 79% | 11.3 ? 6% | 14 ? -17% |
| Idle Average * | 14 | 24.7 -76% | 18 -29% | 19.1 -36% | 8.3 41% | 12.1 14% | 16.5 ? -18% | 19.1 ? -36% |
| Idle Maximum * | 26 | 27 -4% | 26 -0% | 19.4 25% | 8.7 67% | 12.3 53% | 19.1 ? 27% | 26 ? -0% |
| Load Average * | 88 | 83.2 5% | 88 -0% | 95.9 -9% | 76 14% | 49.8 43% | 89.3 ? -1% | 111.8 ? -27% |
| Witcher 3 ultra * | 114.9 | 165.8 -44% | 157.7 -37% | 141.6 -23% | 70 39% | 46.6 59% | ||
| Load Maximum * | 213 | 204.5 4% | 194 9% | 203 5% | 132 38% | 71.4 66% | 185.9 ? 13% | 246 ? -15% |
* ... smaller is better
Power consumption Witcher 3 / stress test
Power consumption with an external monitor
Battery life
In the Wi-Fi test (loading websites with the help of a script) and video test (the Big Buck Bunny short film (H.264 coding, FHD) in a loop), the 14-inch device achieved runtimes of 5 hours 2 minutes and 8 hours 59 minutes, respectively. During both tests, the laptop's energy-saving functions were deactivated and the display brightness was set to around 150 cd/m². In addition, the video test was carried out with the radio module switched off.

| Acer Predator Triton 14 PT14-51 i7-13700H, NVIDIA GeForce RTX 4050 Laptop GPU, 76.3 Wh | Razer Blade 14 RTX 4070 R9 7940HS, NVIDIA GeForce RTX 4070 Laptop GPU, 68 Wh | Asus ROG Zephyrus G14 GA402RJ R7 6800HS, Radeon RX 6700S, 76 Wh | MSI Stealth 14 Studio A13V i7-13700H, NVIDIA GeForce RTX 4050 Laptop GPU, 72 Wh | Gigabyte Aero 14 OLED BMF i7-13700H, NVIDIA GeForce RTX 4050 Laptop GPU, 63 Wh | Apple MacBook Pro 14 2023 M2 Pro Entry M2 Pro 10-Core, M2 Pro 16-Core GPU, 70 Wh | Average of class Gaming | |
|---|---|---|---|---|---|---|---|
| Battery Runtime | -15% | 103% | -13% | 12% | 119% | -12% | |
| Reader / Idle | 669 | 513 -23% | 678 1% | 535 ? -20% | |||
| H.264 | 539 | 396 -27% | 982 82% | 383 ? -29% | |||
| WiFi v1.3 | 302 | 374 24% | 612 103% | 378 25% | 457 51% | 774 156% | 361 ? 20% |
| Load | 109 | 59 -46% | 69 -37% | 92 -16% | 87 ? -20% |
Pros
Cons
Verdict - A compact powerhouse

The 14-inch laptop's main applications ought to be in the areas of rendering and gaming. The Core i7-13700H and the GeForce RTX 4050 provide the necessary power with both chips running at a consistently high clock speed. If more graphics power is required, Acer also has GeForce RTX 4070 variants on offer.
A ton of computational power in a 14-inch frame: With the Predator Triton 14, Acer has delivered a potent laptop.
The laptop gets noticeably warm and can produce a considerable amount of noise. We primarily used the "Balanced" system mode and it ensured only moderate background noise with relatively small performance loss.
Overall, the 16:10 display (2,560 x 1,600 pixels, IPS, 165 Hz, G-Sync) is impressive. Stand-out points include its high brightness and DCI P3 coverage. These are joined by real-life battery runtimes of 5 to 9 hours. Positive: The battery can be charged via the USB-C mains adapter (min. 65-watt, 20 V). Power Delivery is supported. This means you don't have to be accompanied by the proprietary PSU (230-watt) wherever you go.
The Predator's weaknesses lie mainly in its storage: A meagre SSD capacity (512 GB), no space for additional SSDs, soldered RAM with no expansion possibilities and a very slow-running memory card reader. All in all, more should be expected of a laptop in this price category.
An alternative could come in the shape of the MSI Stealth 14 Studio A13V. It is equipped with the same CPU and GPU, offering a little more power than the Predator and scores extra points for its two RAM banks. However, at a price of around $2,000, it's not one of the cheapest devices.
Price and availability
The review spec variant of Acer's laptop can be currently had on Amazon for $1,440.
Acer Predator Triton 14 PT14-51
-
07/24/2023 v7
Sascha Mölck
More articles related to this device
Acer Predator Triton 14 PT14-51 (Predator Triton 14 Series)Related Articles


Transparency
The present review sample was made available to the author as a loan by the manufacturer or a shop for the purposes of review. The lender had no influence on this review, nor did the manufacturer receive a copy of this review before publication. There was no obligation to publish this review.
Pricecompare

