 Deutsch
 English
 Español
 Français
 Italiano
 Nederlands
 Polski
 Português
 Русский
 Türkçe
 Svenska
 Chinese
 Magyar
Acer Swift Edge 16 Ryzen 7 7840U laptop review: Zen 4 CPU and 3.2K 120 Hz OLED boost

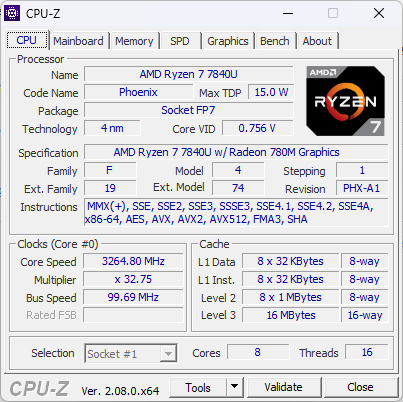
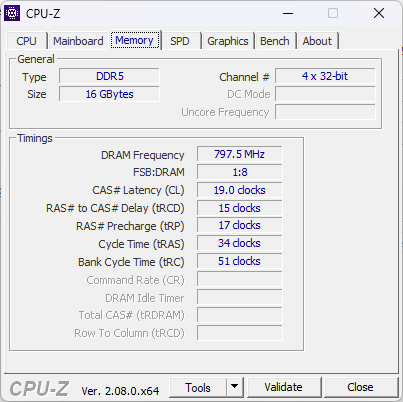
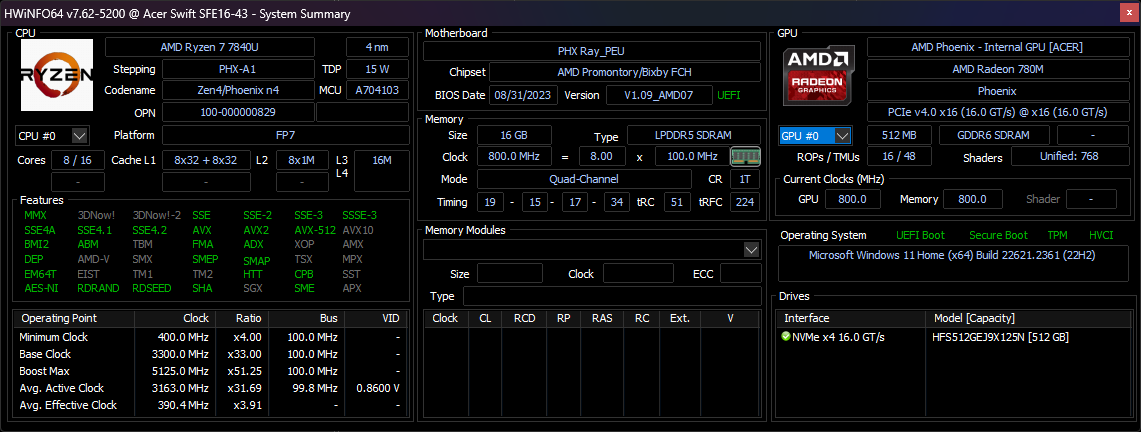
The Acer Swift Edge SFE16 has been refreshed this season to support the new Zen 4 Ryzen 7 7840U CPU up from the Zen 3+ Ryzen 7 7735U released just a few months prior. The updated model also gets a new 120 Hz 3.2K Samsung OLED panel instead of the 4K 60 Hz one on the Zen 3+ configuration.
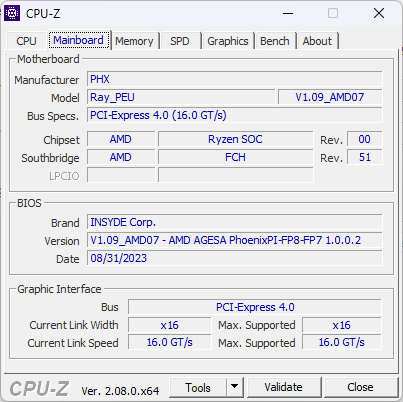
Other than the CPU and GPU differences above, both the Swift Edge SFE16 Zen 4 and Swift Edge SFE16 Zen 3+ use similar chassis designs with a few differences which we will note in this review. Internally, however, many aspects of the motherboard have changed. We recommend checking out our review on the Swift Edge SFE16 Zen 3+ to learn more about the physical features of the model.
Alternatives to the Swift Edge include other lightweight 16-inch Ultrabooks like the LG Gram 16, Samsung Galaxy Book3 Pro 16, Asus VivoBook 16, or the Huawei MateBook 16s.
The Swift Edge 16 should not be confused with the Swift X 16 which is a thicker laptop with faster H-series CPUs and dedicated GeForce RTX graphics.
More Acer reviews:
Potential Competitors in Comparison
Rating | Date | Model | Weight | Height | Size | Resolution | Best Price |
|---|---|---|---|---|---|---|---|
| 88.6 % | 10/2023 | Acer Swift Edge SFE16 Ryzen 7 7840U R7 7840U, Radeon 780M | 1.2 kg | 13 mm | 16.00" | 3200x2000 | |
| 87.5 % | 06/2023 | Acer Swift Edge SFE16-42-R1GM R7 7735U, Radeon 680M | 1.2 kg | 13.95 mm | 16.00" | 3840x2400 | |
| 88 % | 08/2023 | Lenovo Slim Pro 9i 16IRP8 i9-13905H, NVIDIA GeForce RTX 4050 Laptop GPU | 2.2 kg | 18.2 mm | 16.00" | 3200x2000 | |
| 86.3 % | 05/2023 | Asus VivoBook Pro 16 i7-12700H, GeForce RTX 3050 Ti Laptop GPU | 1.9 kg | 20 mm | 16.00" | 2560x1600 | |
| 89.4 % | 04/2023 | Samsung Galaxy Book3 Ultra 16 i7-13700H, NVIDIA GeForce RTX 4050 Laptop GPU | 1.8 kg | 16.5 mm | 16.00" | 2880x1800 | |
| 86.4 % | 07/2022 | Huawei MateBook 16s i7 i7-12700H, Iris Xe G7 96EUs | 2 kg | 17.8 mm | 16.00" | 2520x1680 |
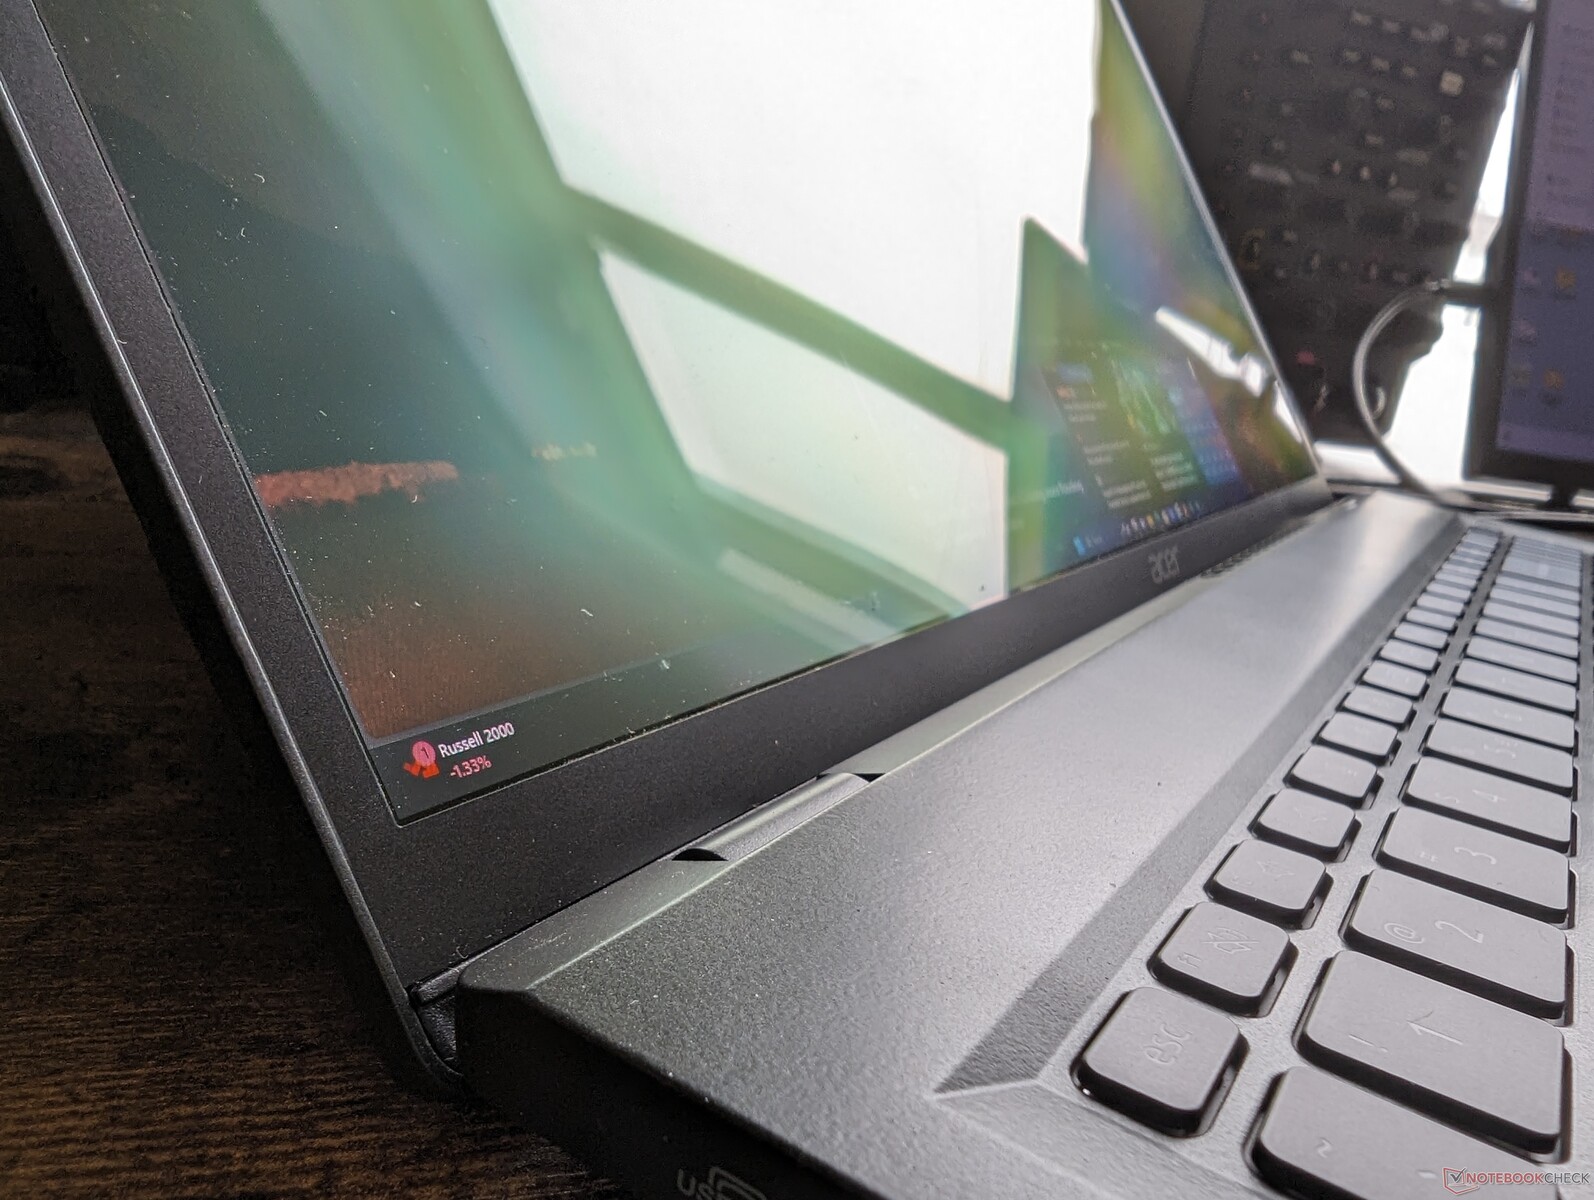
Case
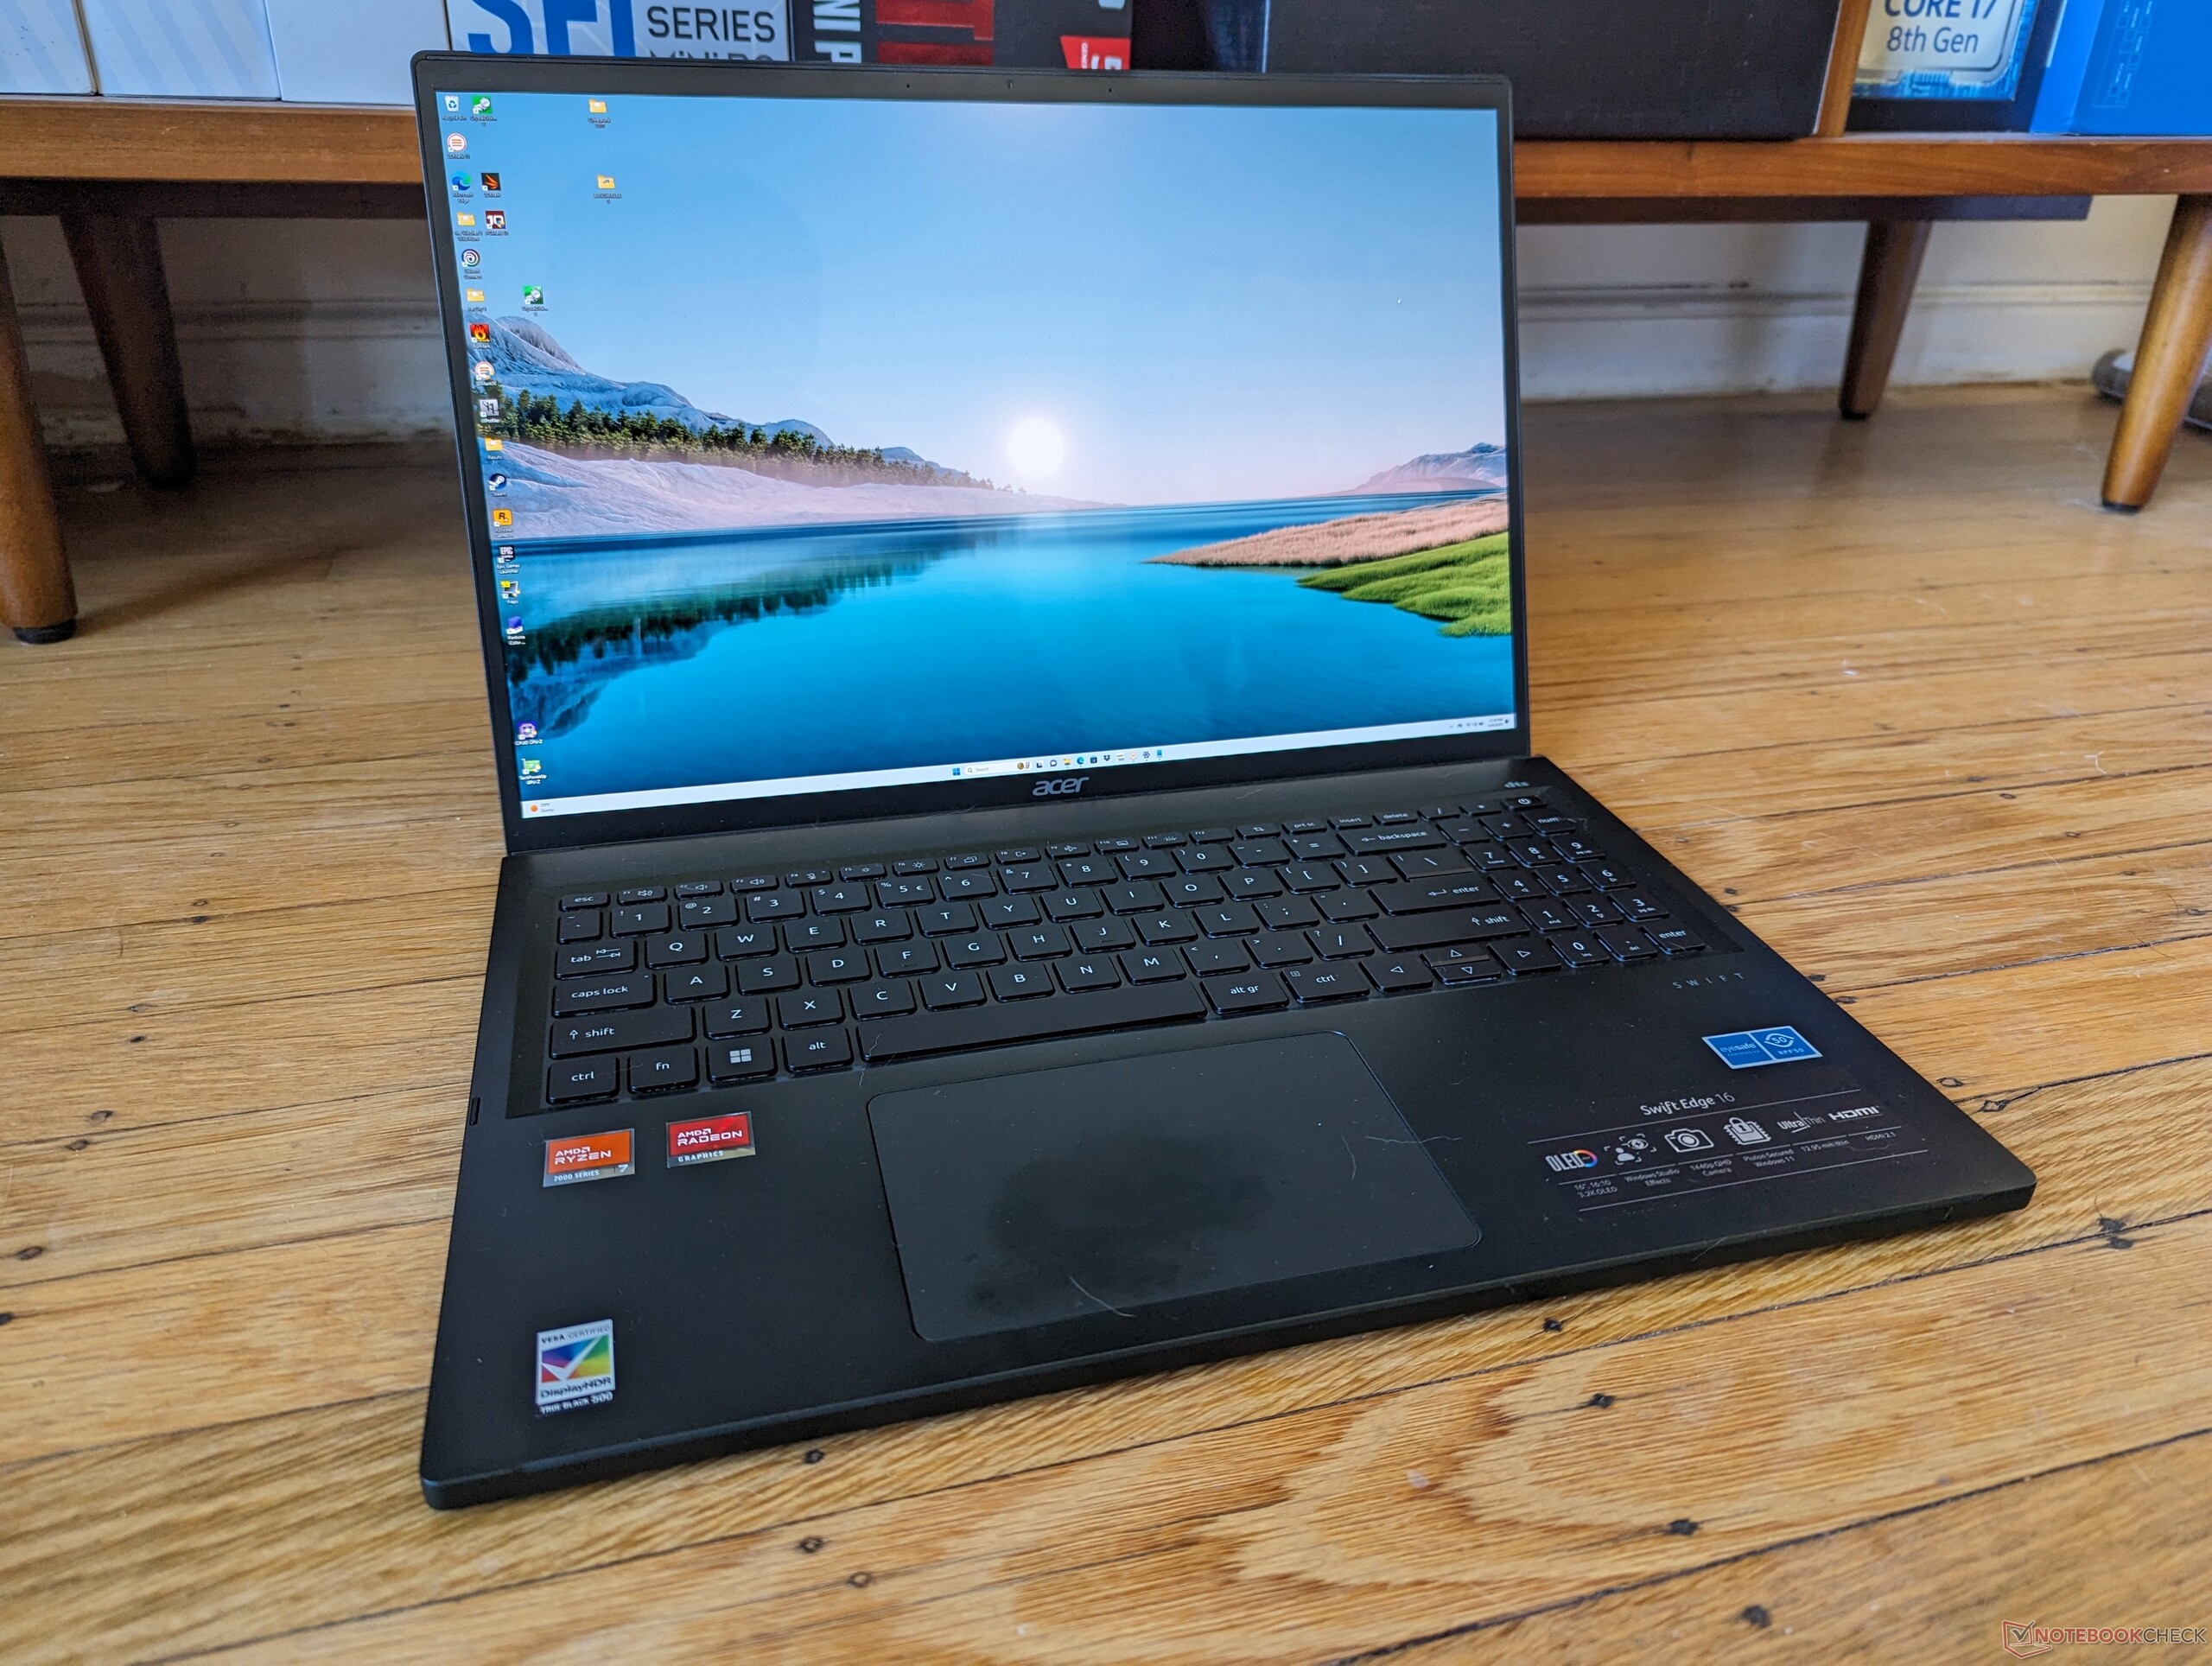
The Swift Edge 16 Zen 4 may look identical to the Swift Edge 16 Zen 3+ at first glance, but exterior changes are noticeable upon closer inspection. Firstly, the newer version integrates a numpad whereas this was missing on the Zen 3+ version. Secondly, the ventilation grilles above the first row of keyboard keys are now gone and the front edge is now continuous with no cuts. The latter is a strange change as it makes the lid harder to open as a result.
Other than that, the model utilizes the same smooth magnesium and aluminum chassis materials, the same ports and positioning, and the same size clickpad as before. Dimensions are just slightly wider and even thinner this time around, but the differences are difficult to notice in practice.
SD Card Reader
Acer has added a MicroSD reader whereas the feature was missing on the Ryzen 7 7735U configuration. However, transfer rates are about 3x slower than the SD card readers on competing models like the Asus VivoBook Pro 16 or Samsung Galaxy Book3 Ultra 16.
| SD Card Reader | |
| average JPG Copy Test (av. of 3 runs) | |
| Lenovo Slim Pro 9i 16IRP8 (PNY EliteX-Pro60 V60 256 GB) | |
| Samsung Galaxy Book3 Ultra 16 (AV PRO microSD 128 GB V60) | |
| Asus VivoBook Pro 16 (AV Pro SD microSD 128 GB V60) | |
| Acer Swift Edge SFE16 Ryzen 7 7840U (AV Pro V60) | |
| maximum AS SSD Seq Read Test (1GB) | |
| Lenovo Slim Pro 9i 16IRP8 (PNY EliteX-Pro60 V60 256 GB) | |
| Samsung Galaxy Book3 Ultra 16 (AV PRO microSD 128 GB V60) | |
| Asus VivoBook Pro 16 (AV Pro SD microSD 128 GB V60) | |
| Acer Swift Edge SFE16 Ryzen 7 7840U (AV Pro V60) | |
Communication
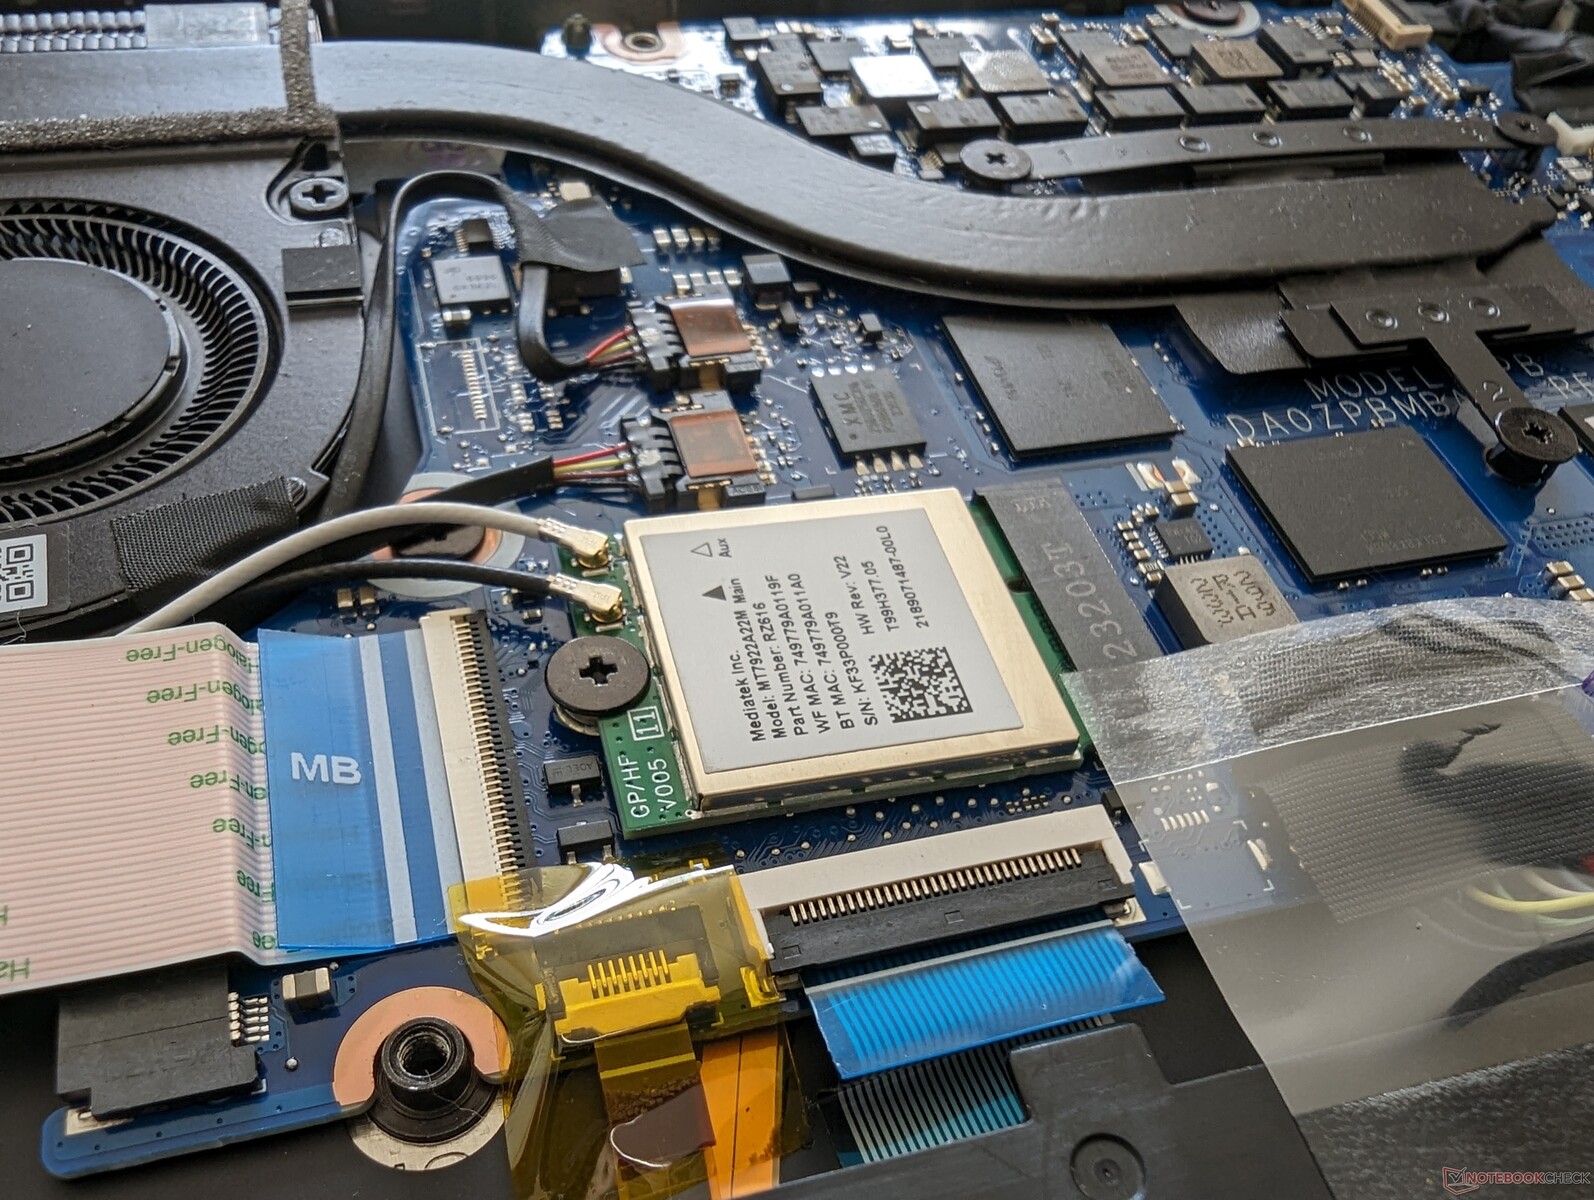
The MediaTek module has unusually slow transmit speeds when on Wi-Fi 6 similar to what we observed on the Zen 3+ configuration. Wi-Fi 6E speeds are otherwise excellent when paired to our Asus AXE11000 6 GHz network.
Webcam
The webcam is an effective 3.7 MP with recording up to 1440p30 up from the 2.1 MP and 1080p30 recording on the Zen 3+ configuration for a slightly sharper picture.
There is still no built-in webcam privacy shutter or IR support.


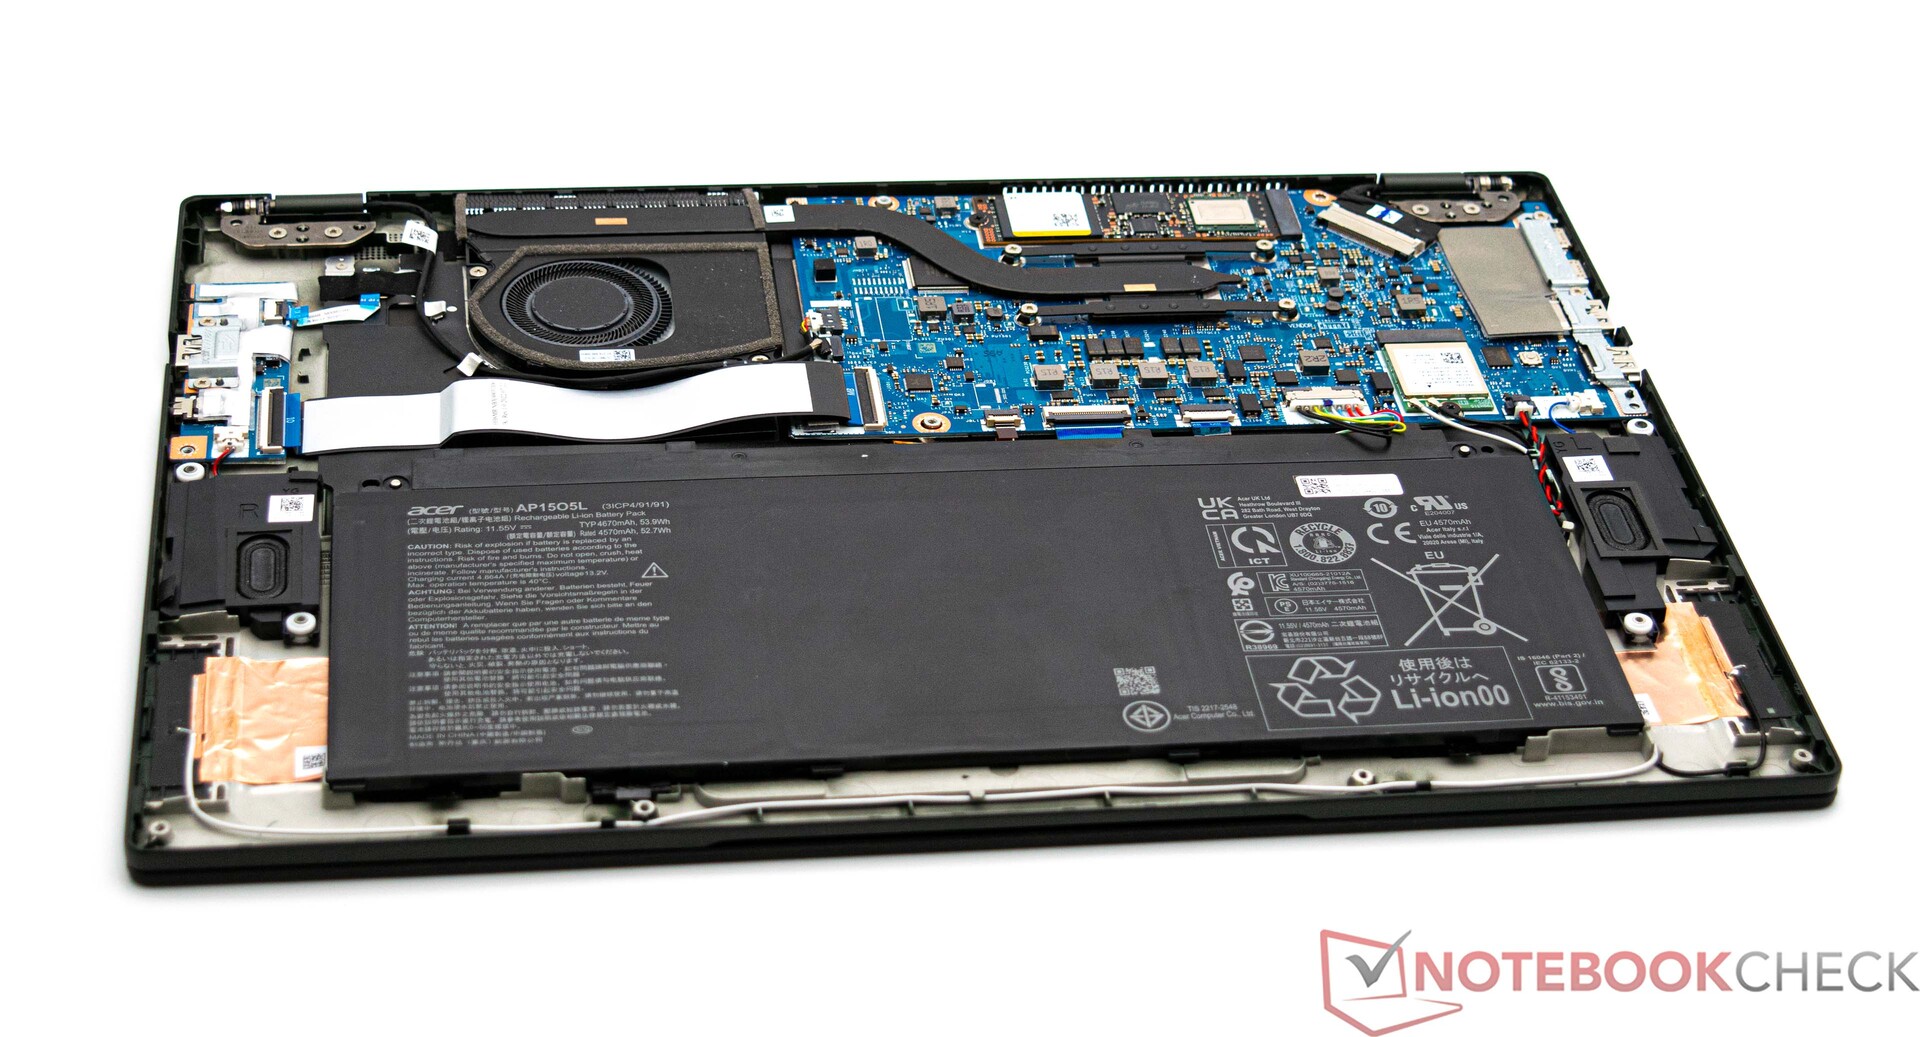
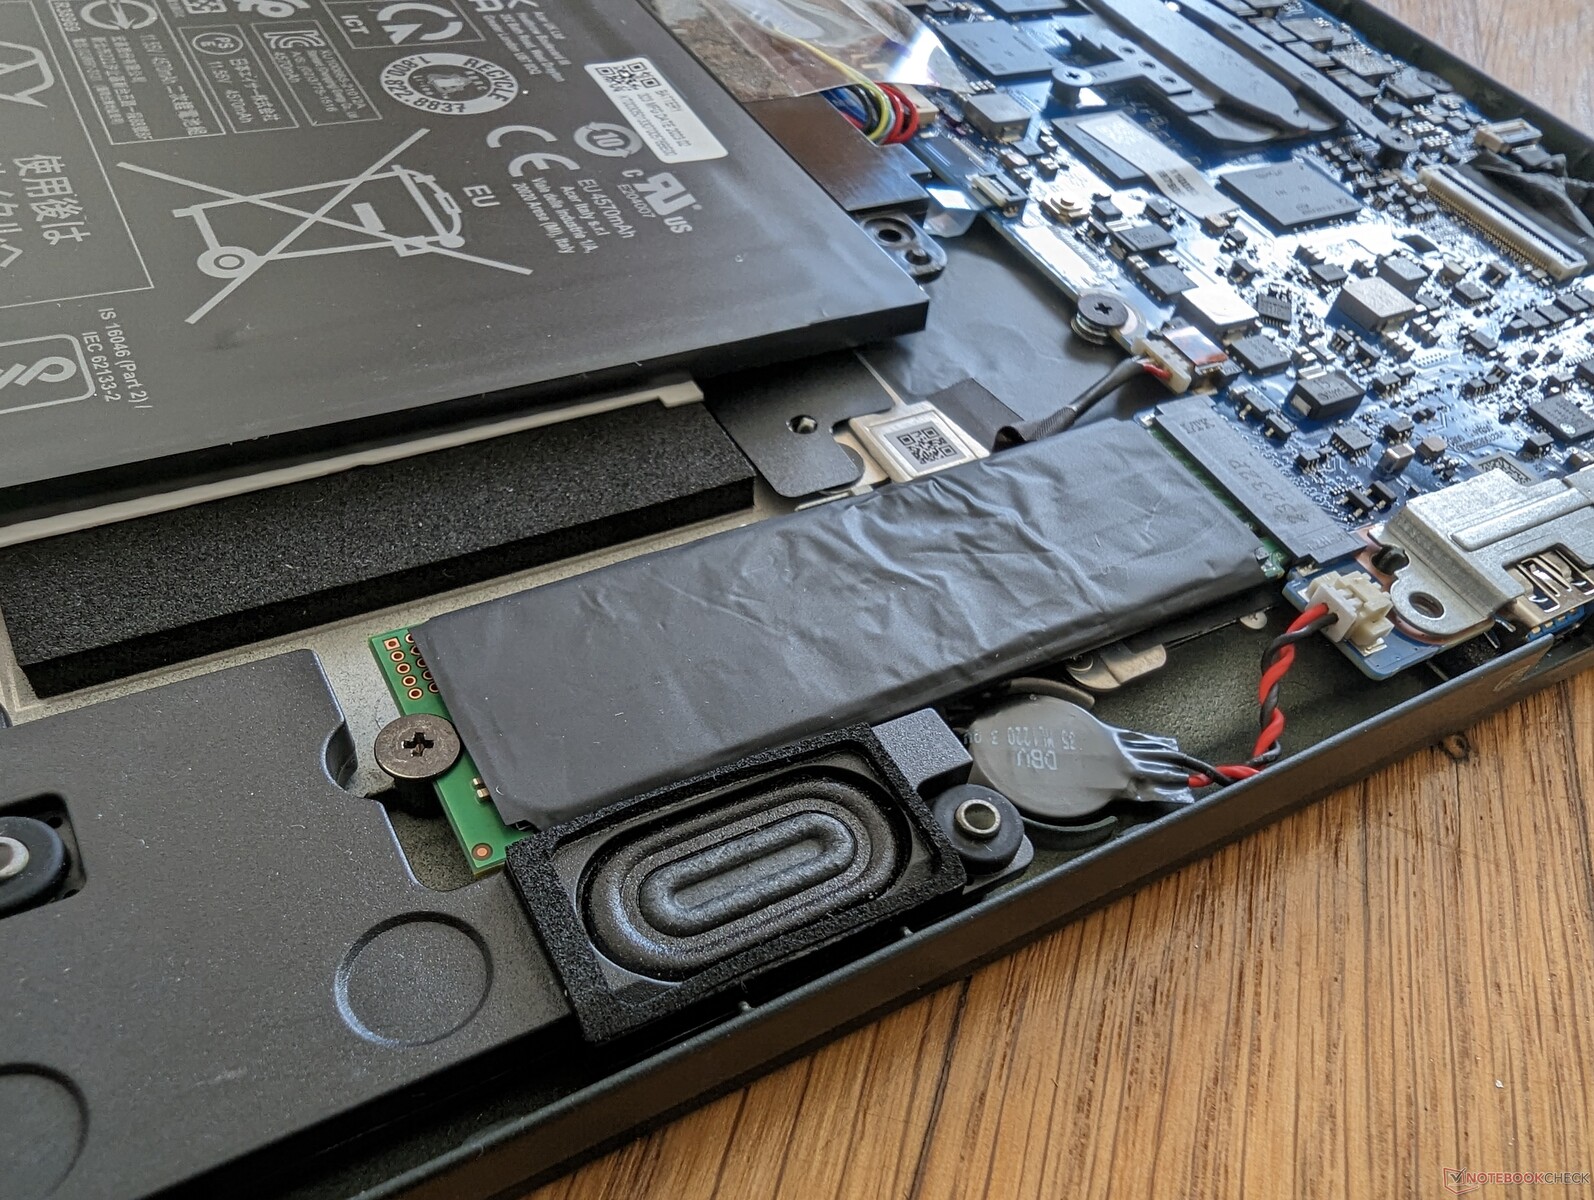
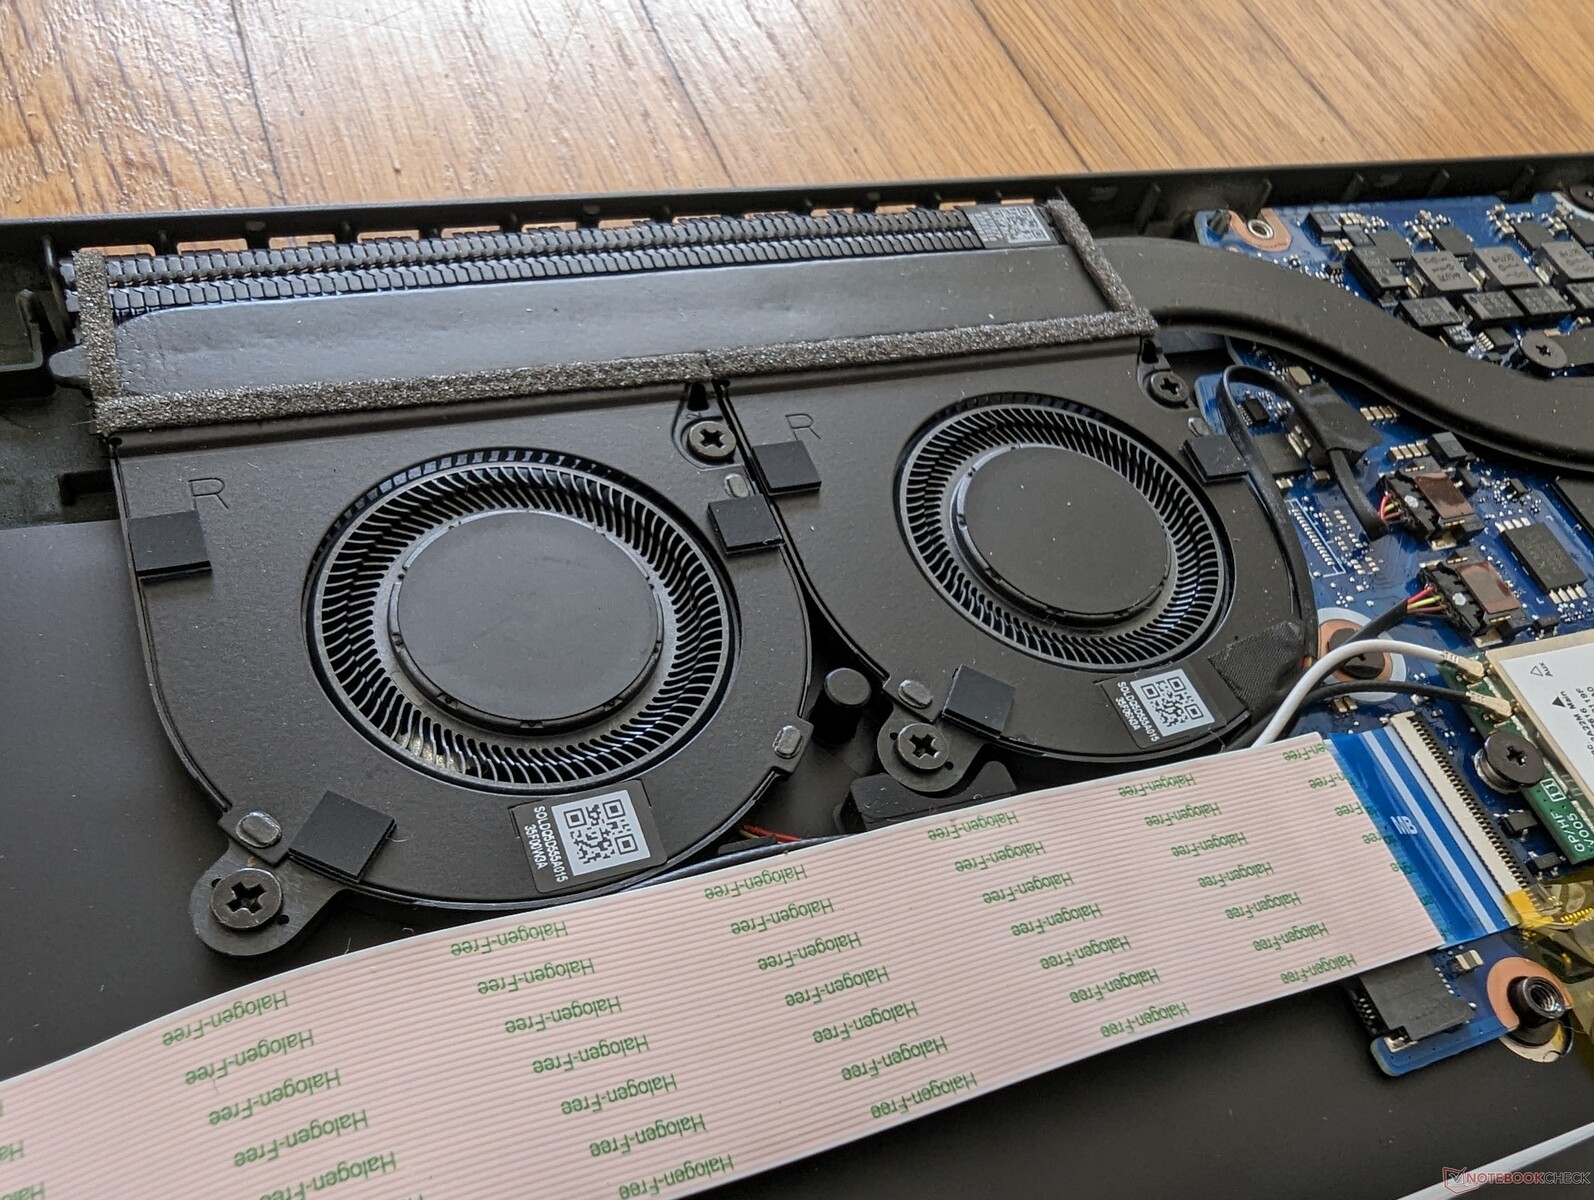
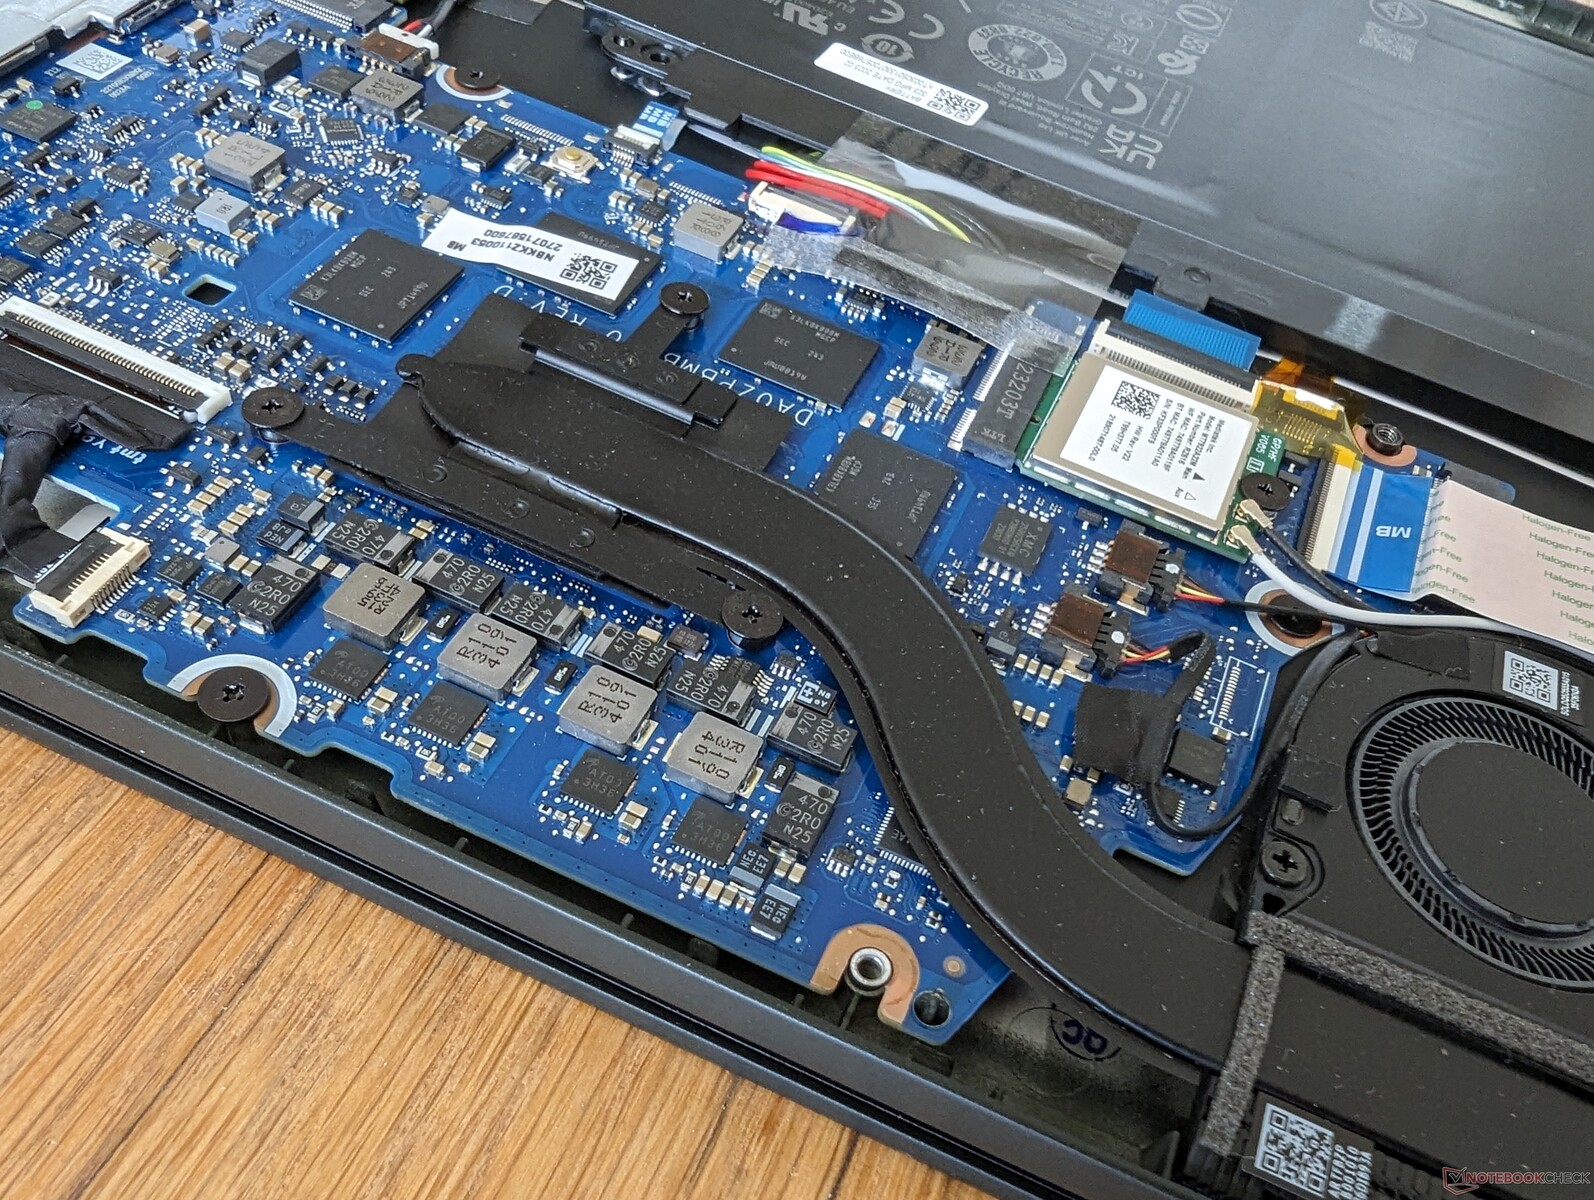
Maintenance
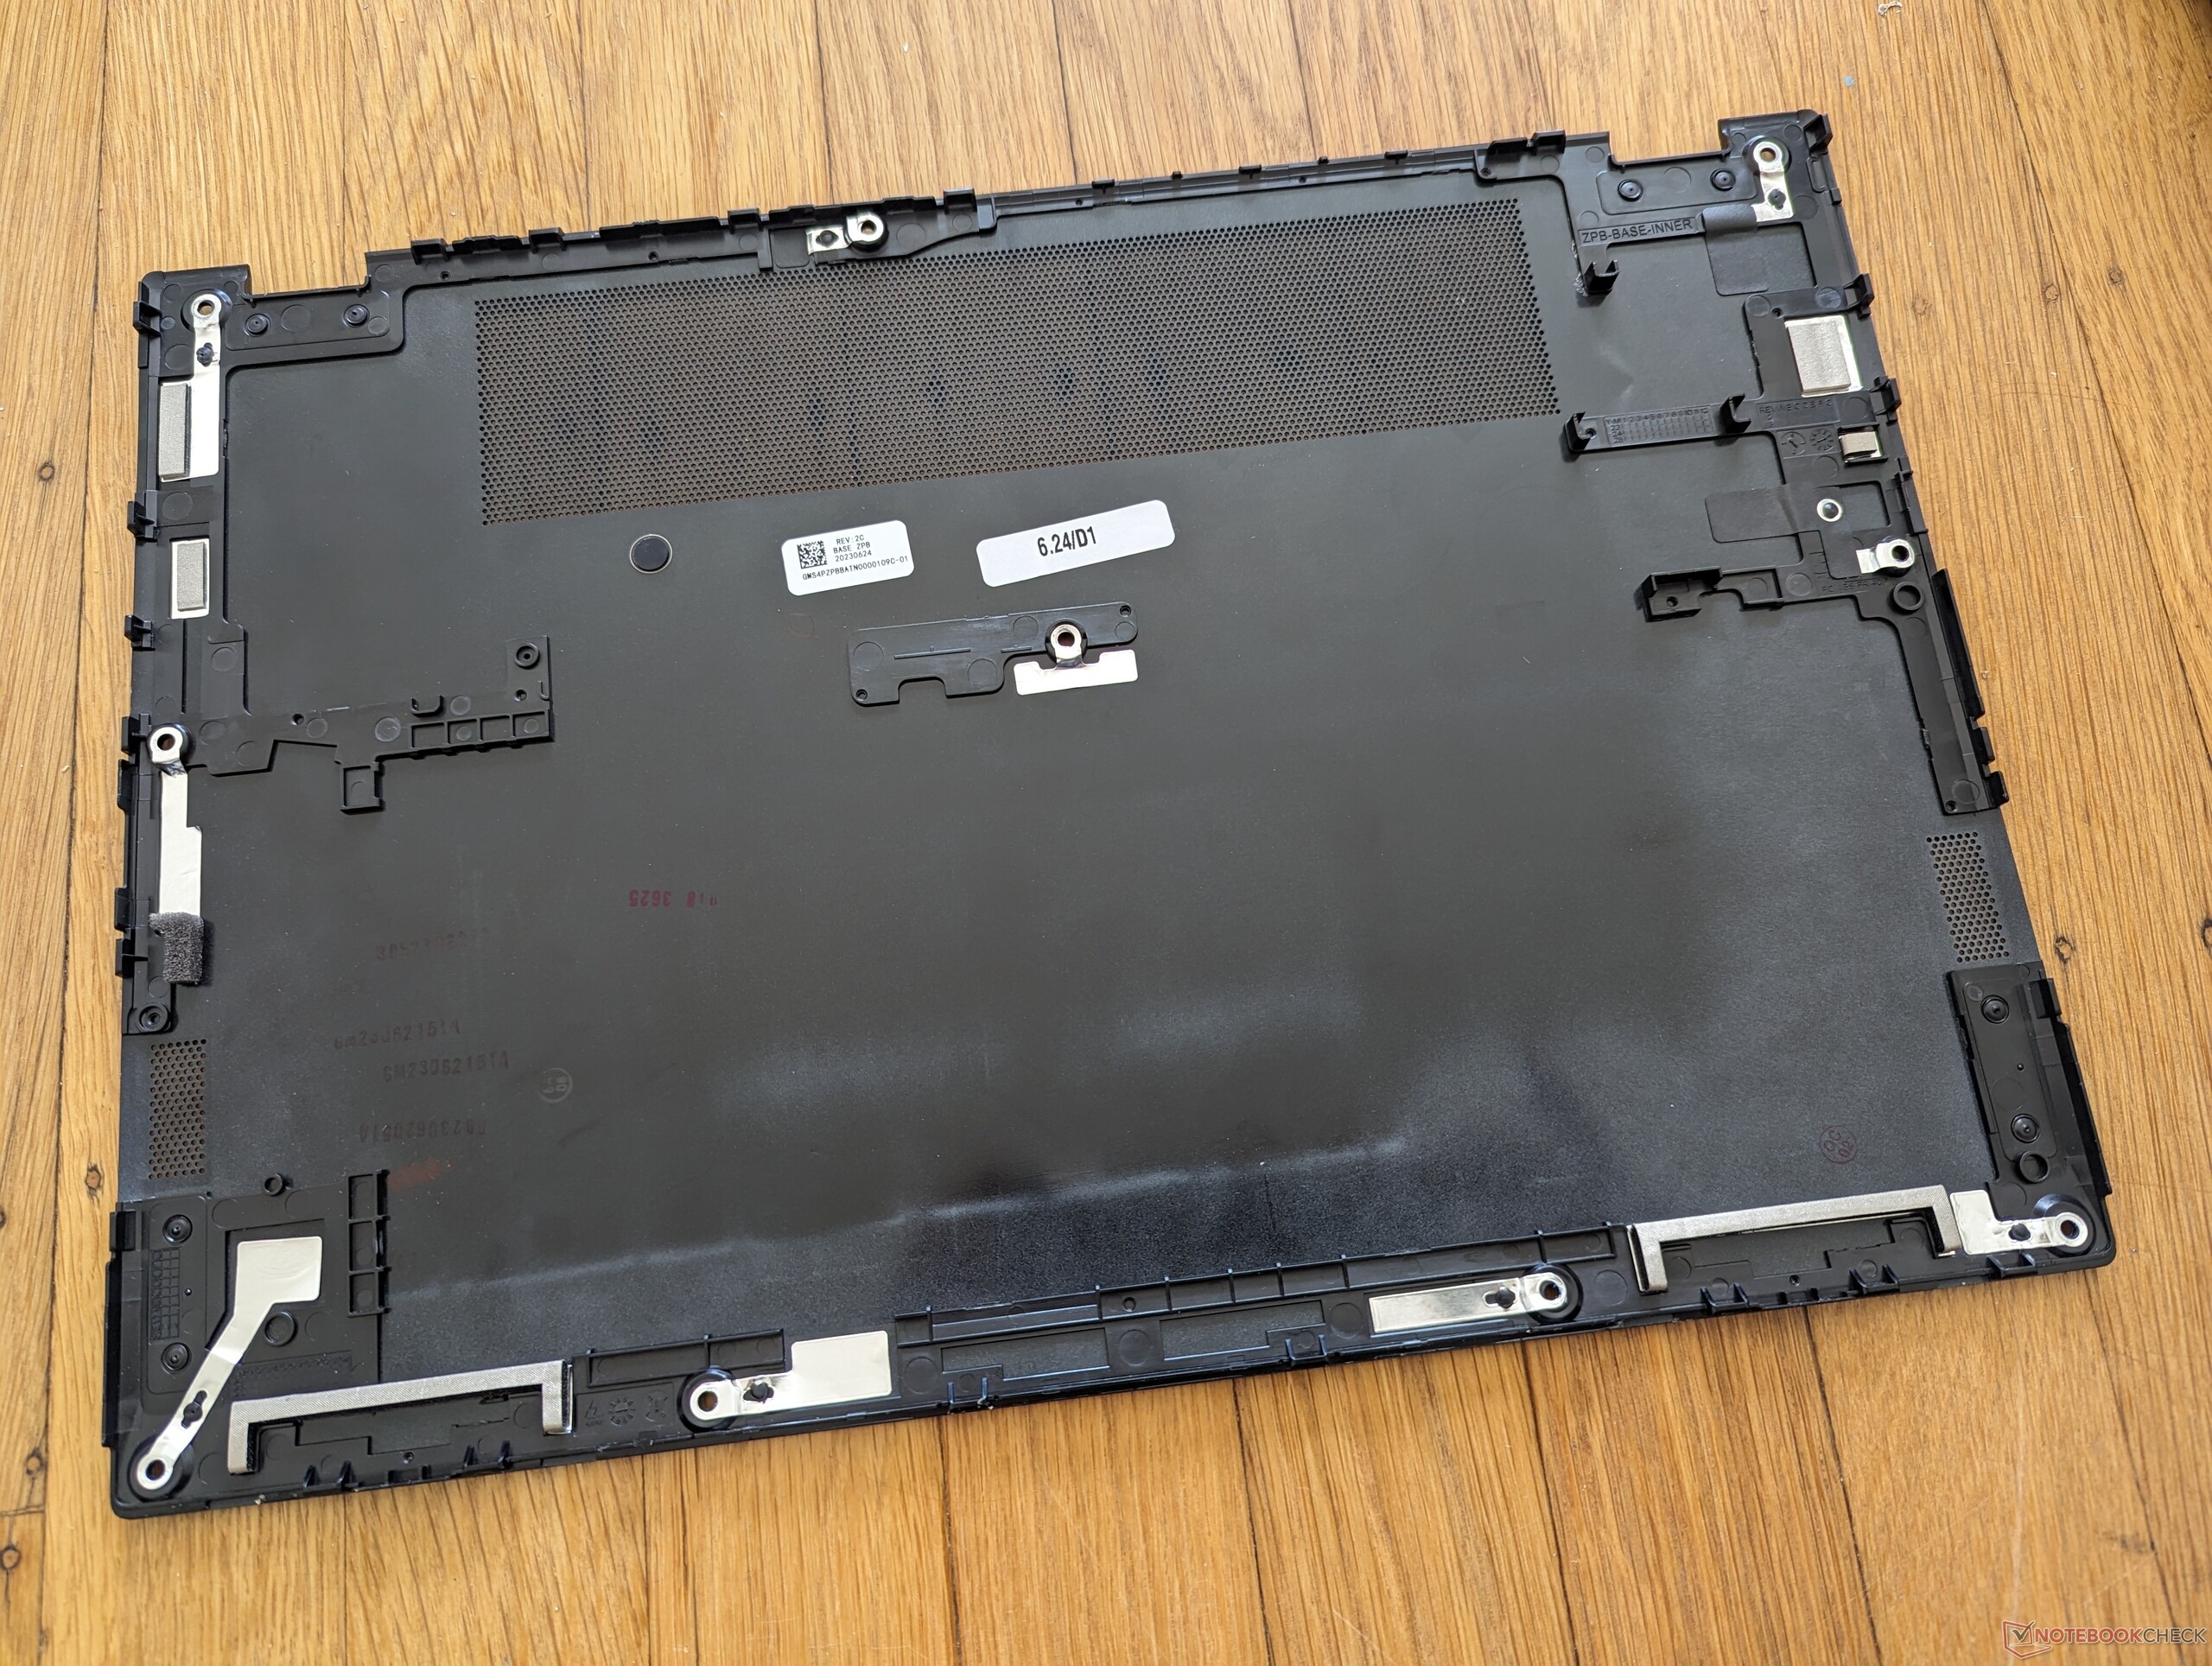
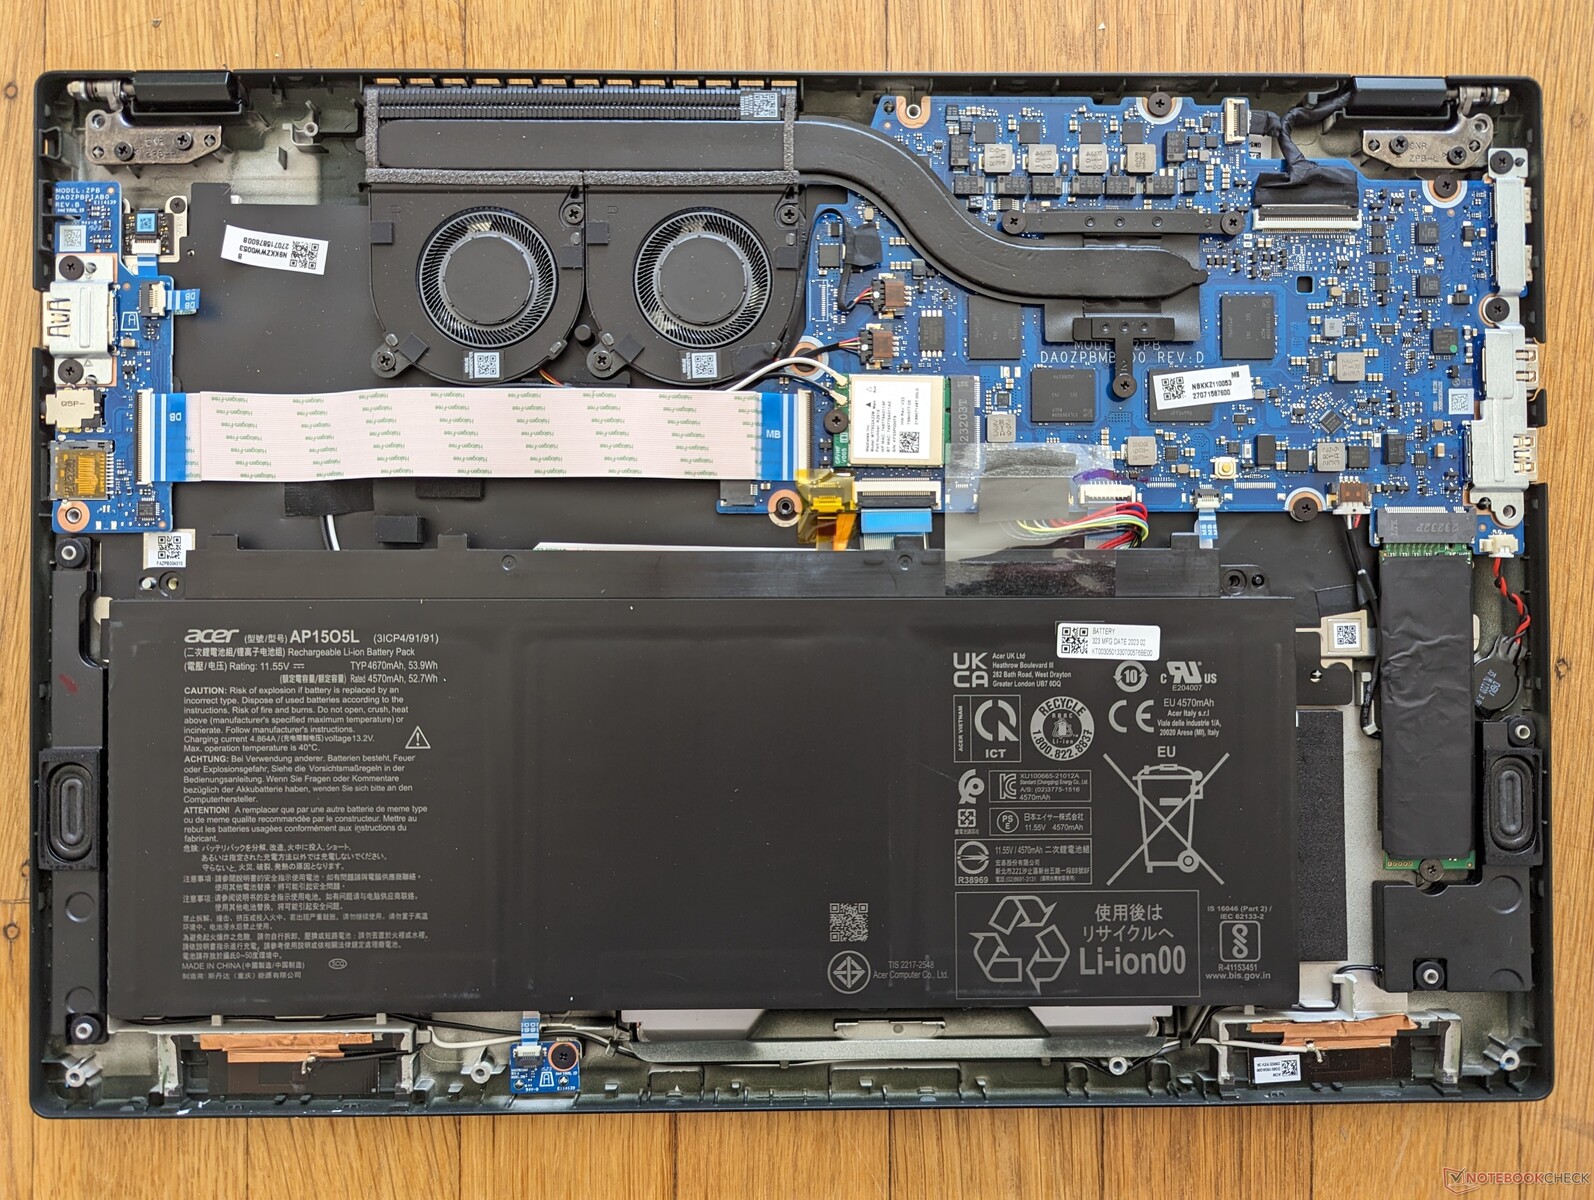
The bottom panel is easy to open with a Torx wrench. The fans and motherboard have changed quite substantially between the Zen 3+ and Zen 4 models as shown by the pictures below. The SSD, for example, now lies next to the battery pack.
Accessories And Warranty
There are no extras in the box other than the paperwork and AC adapter. A one-year limited manufacturer warranty applies if purchased in the US.
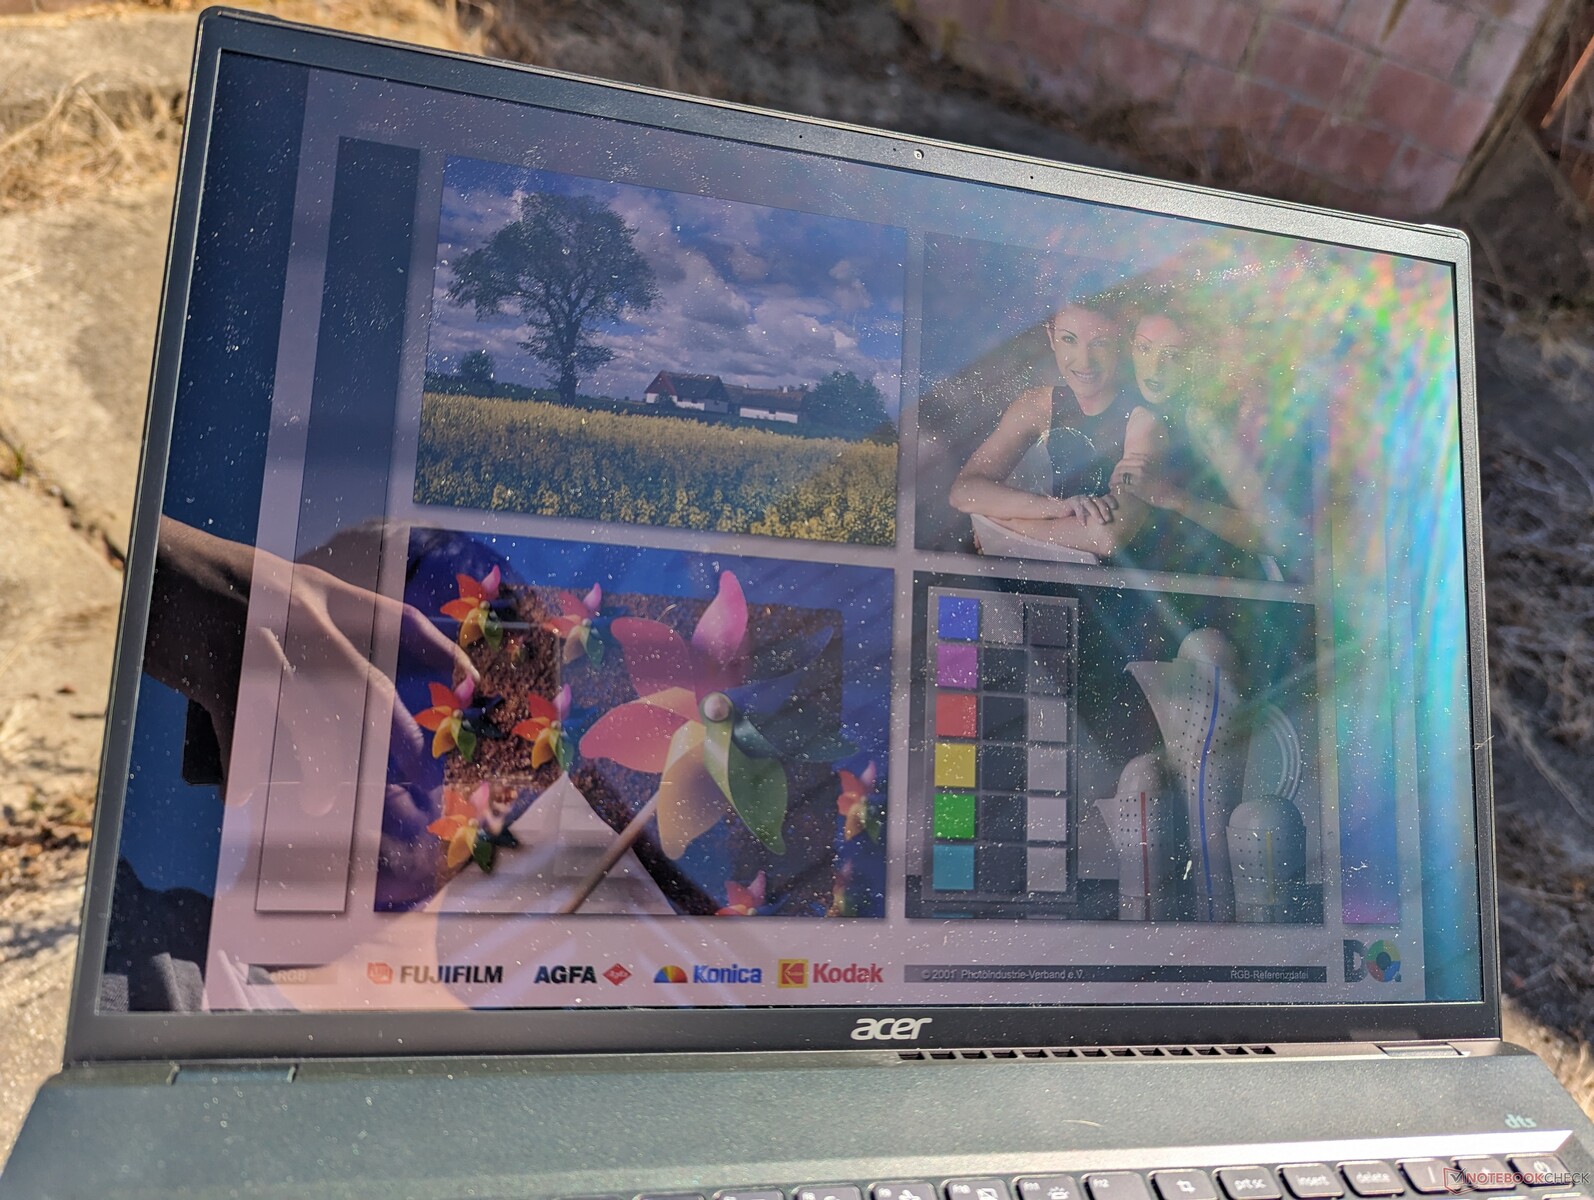
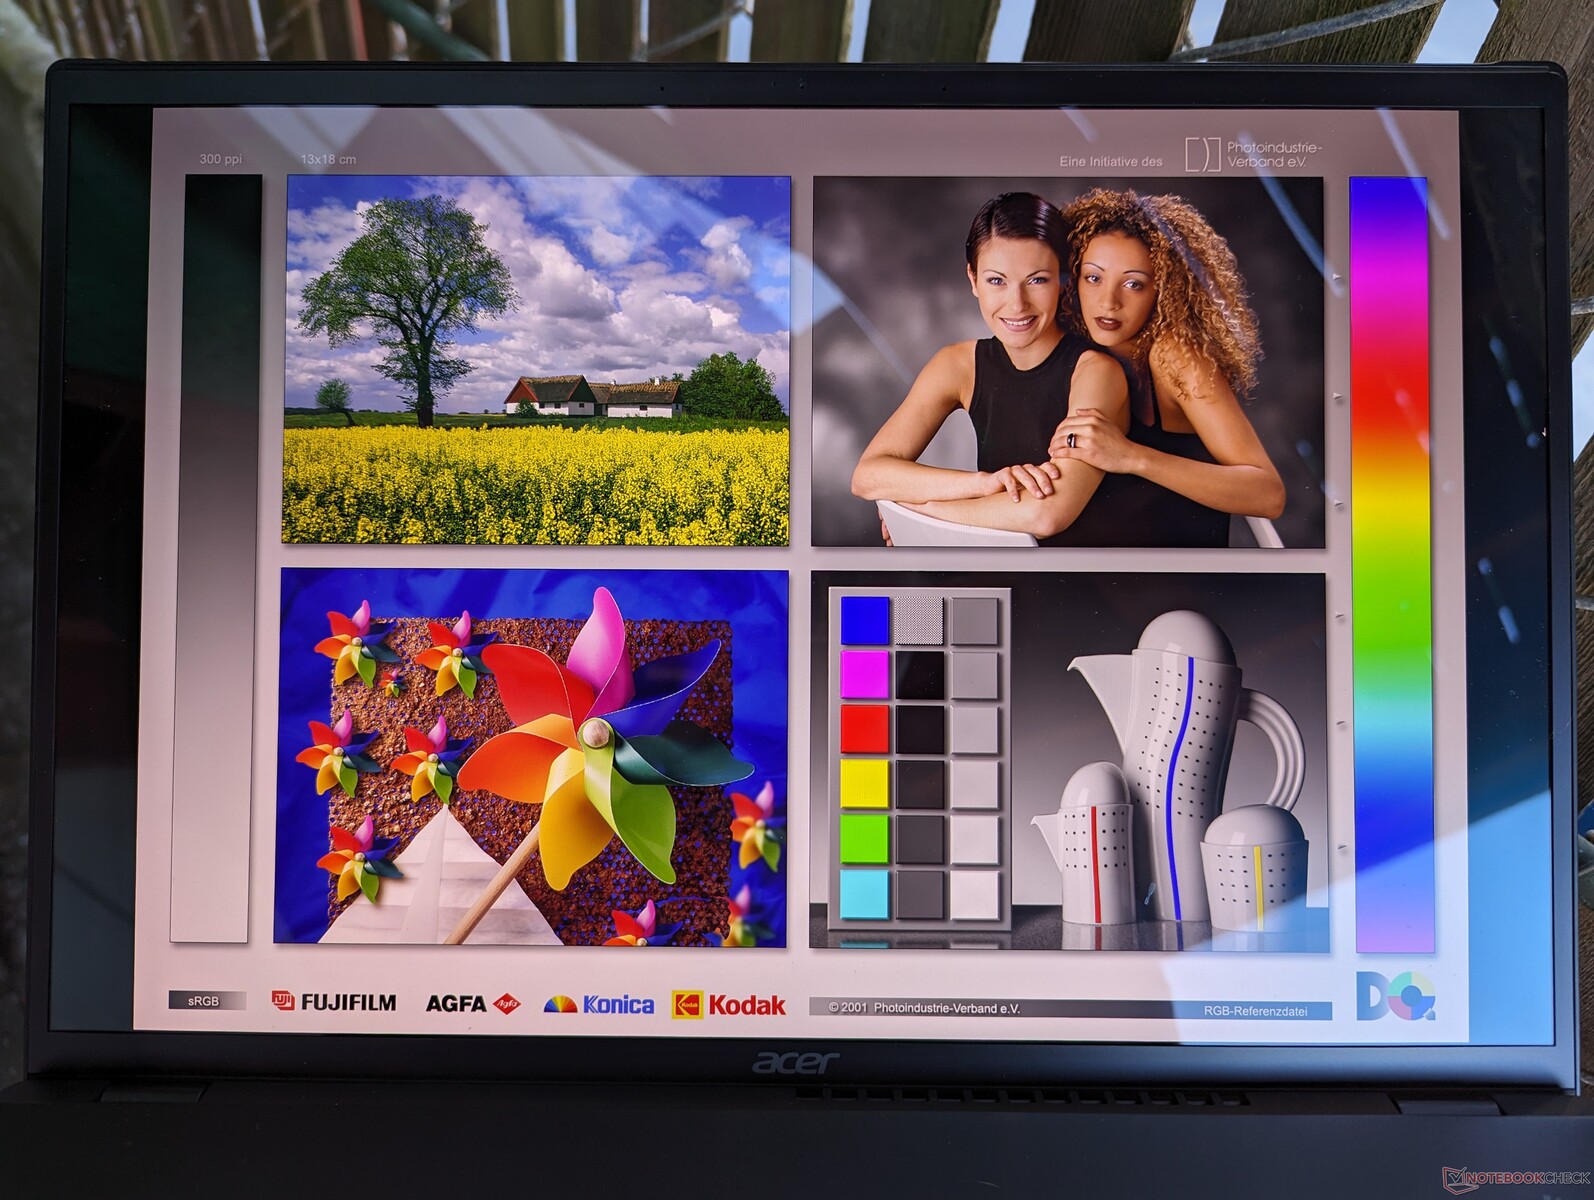
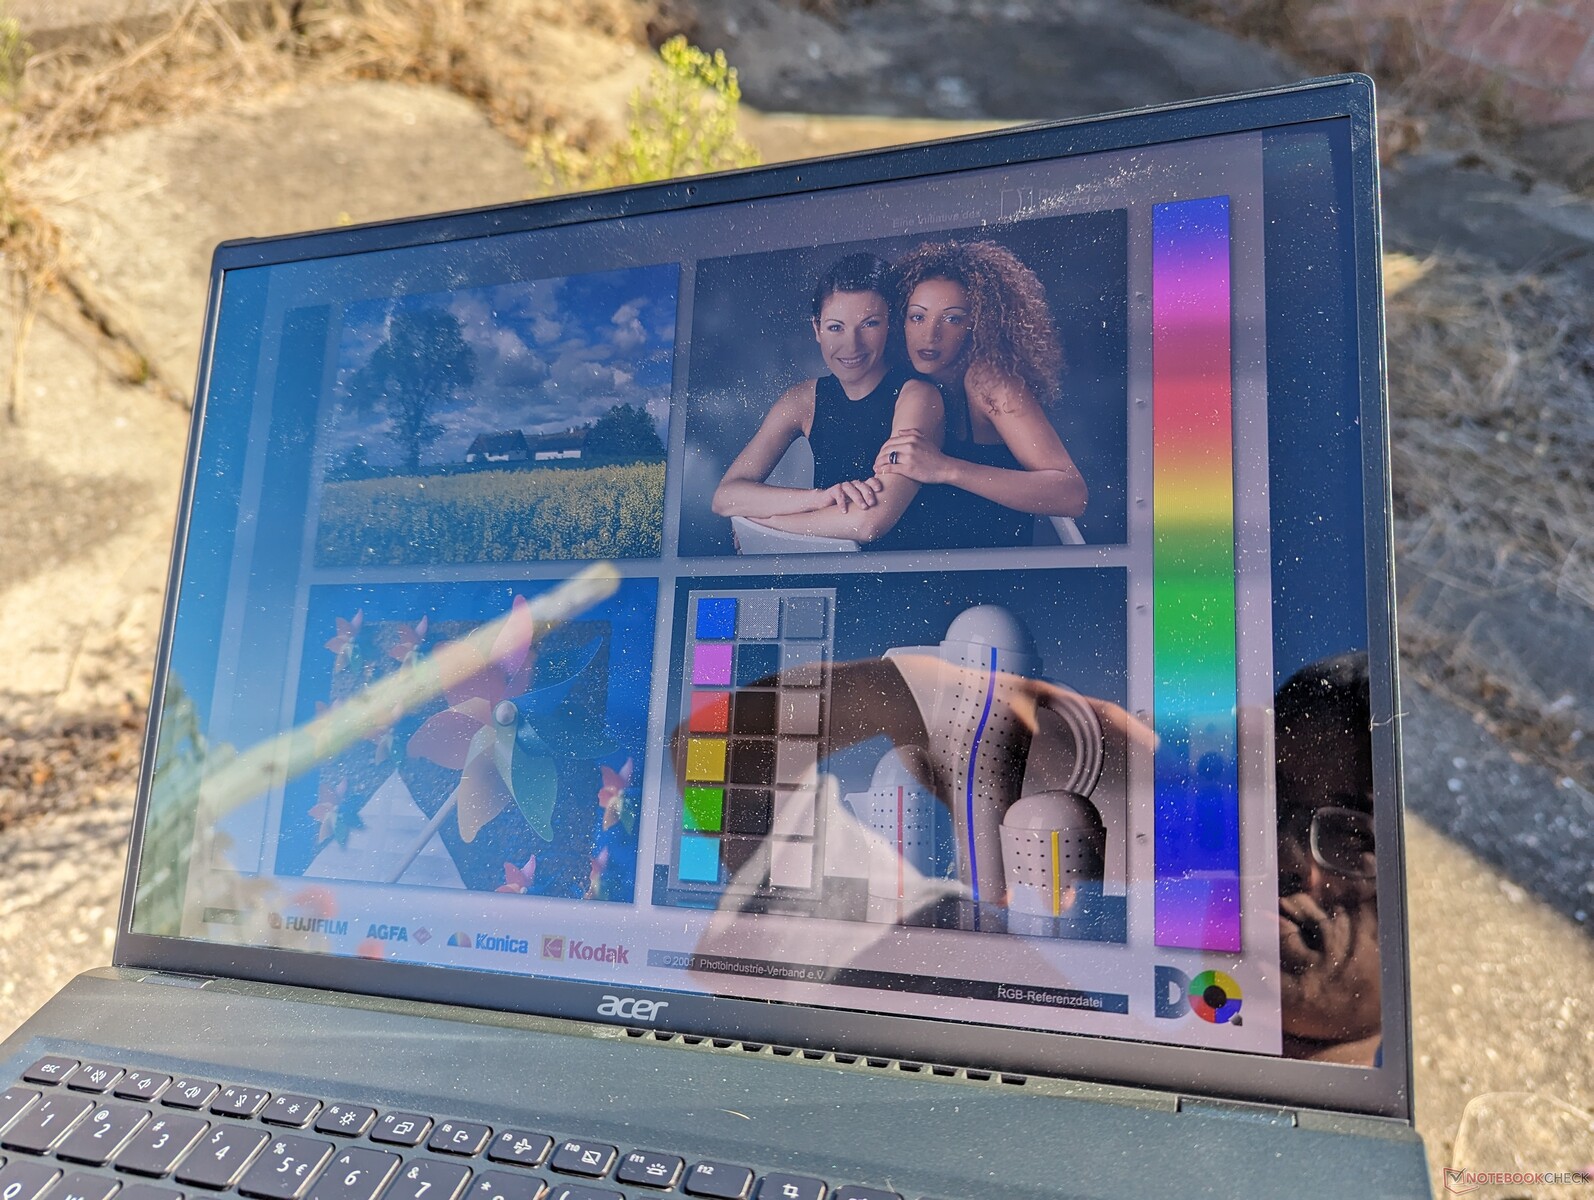
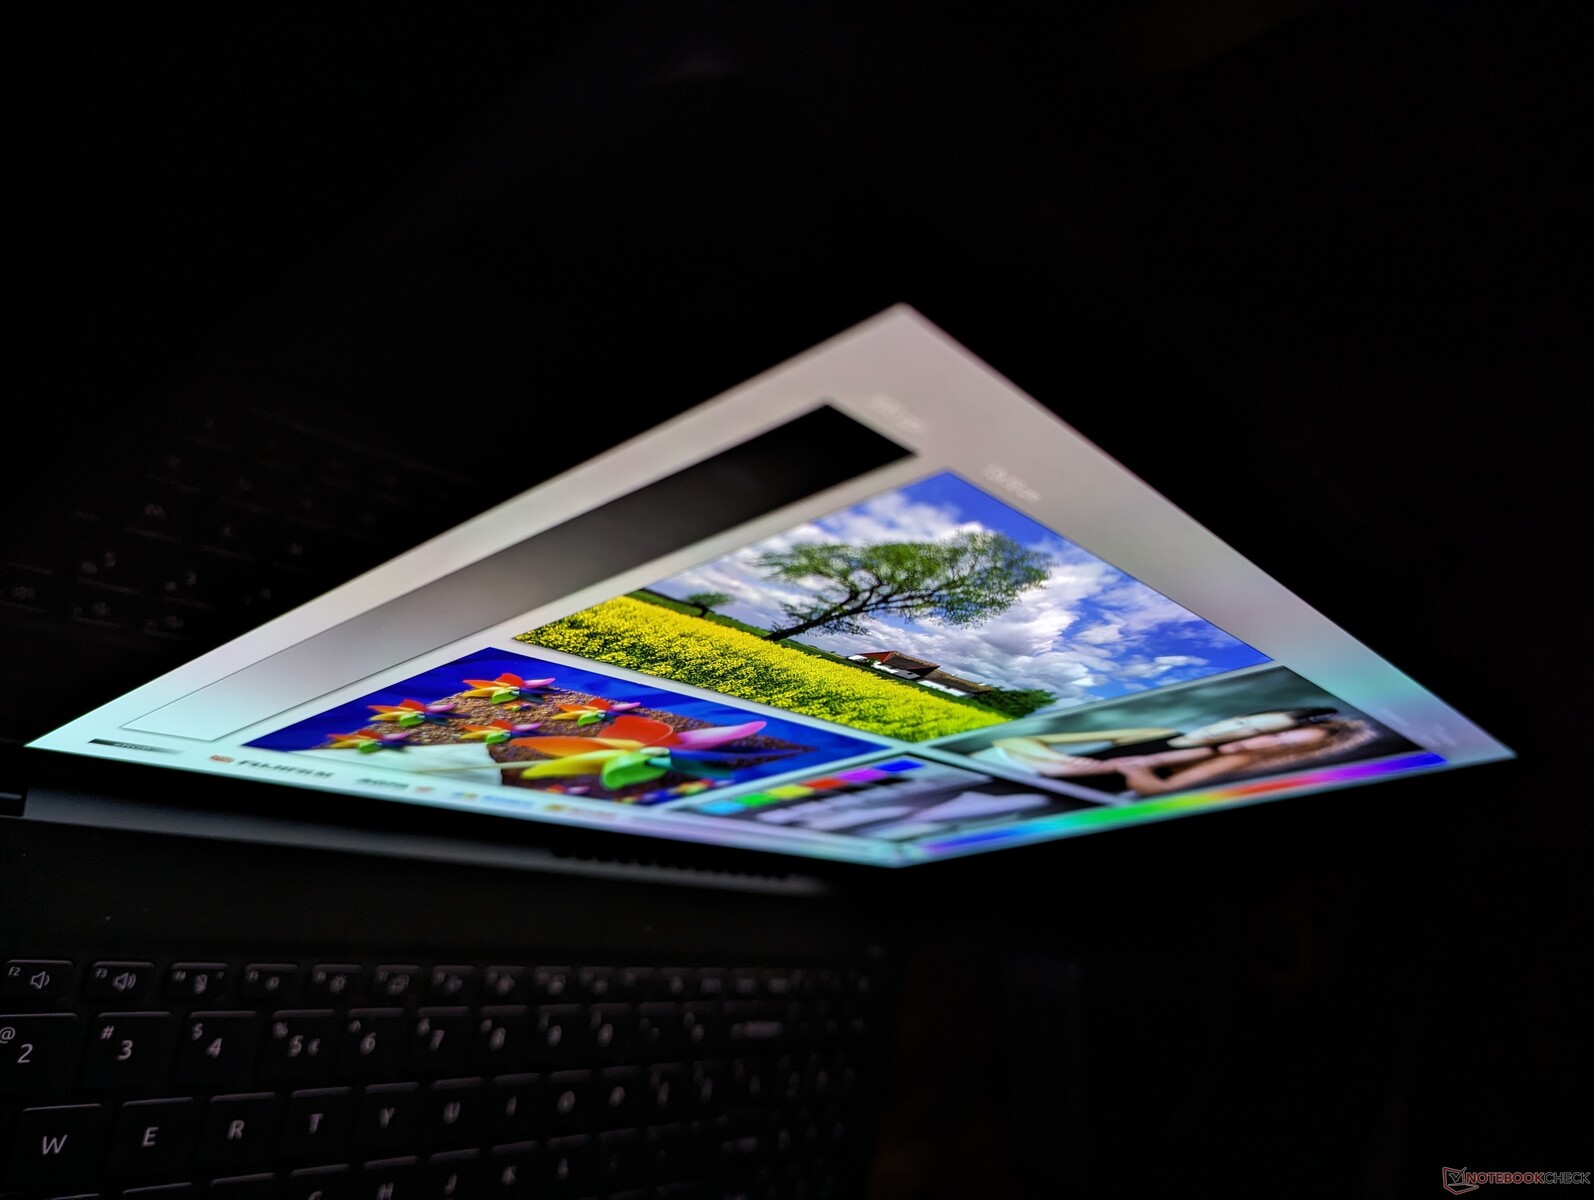
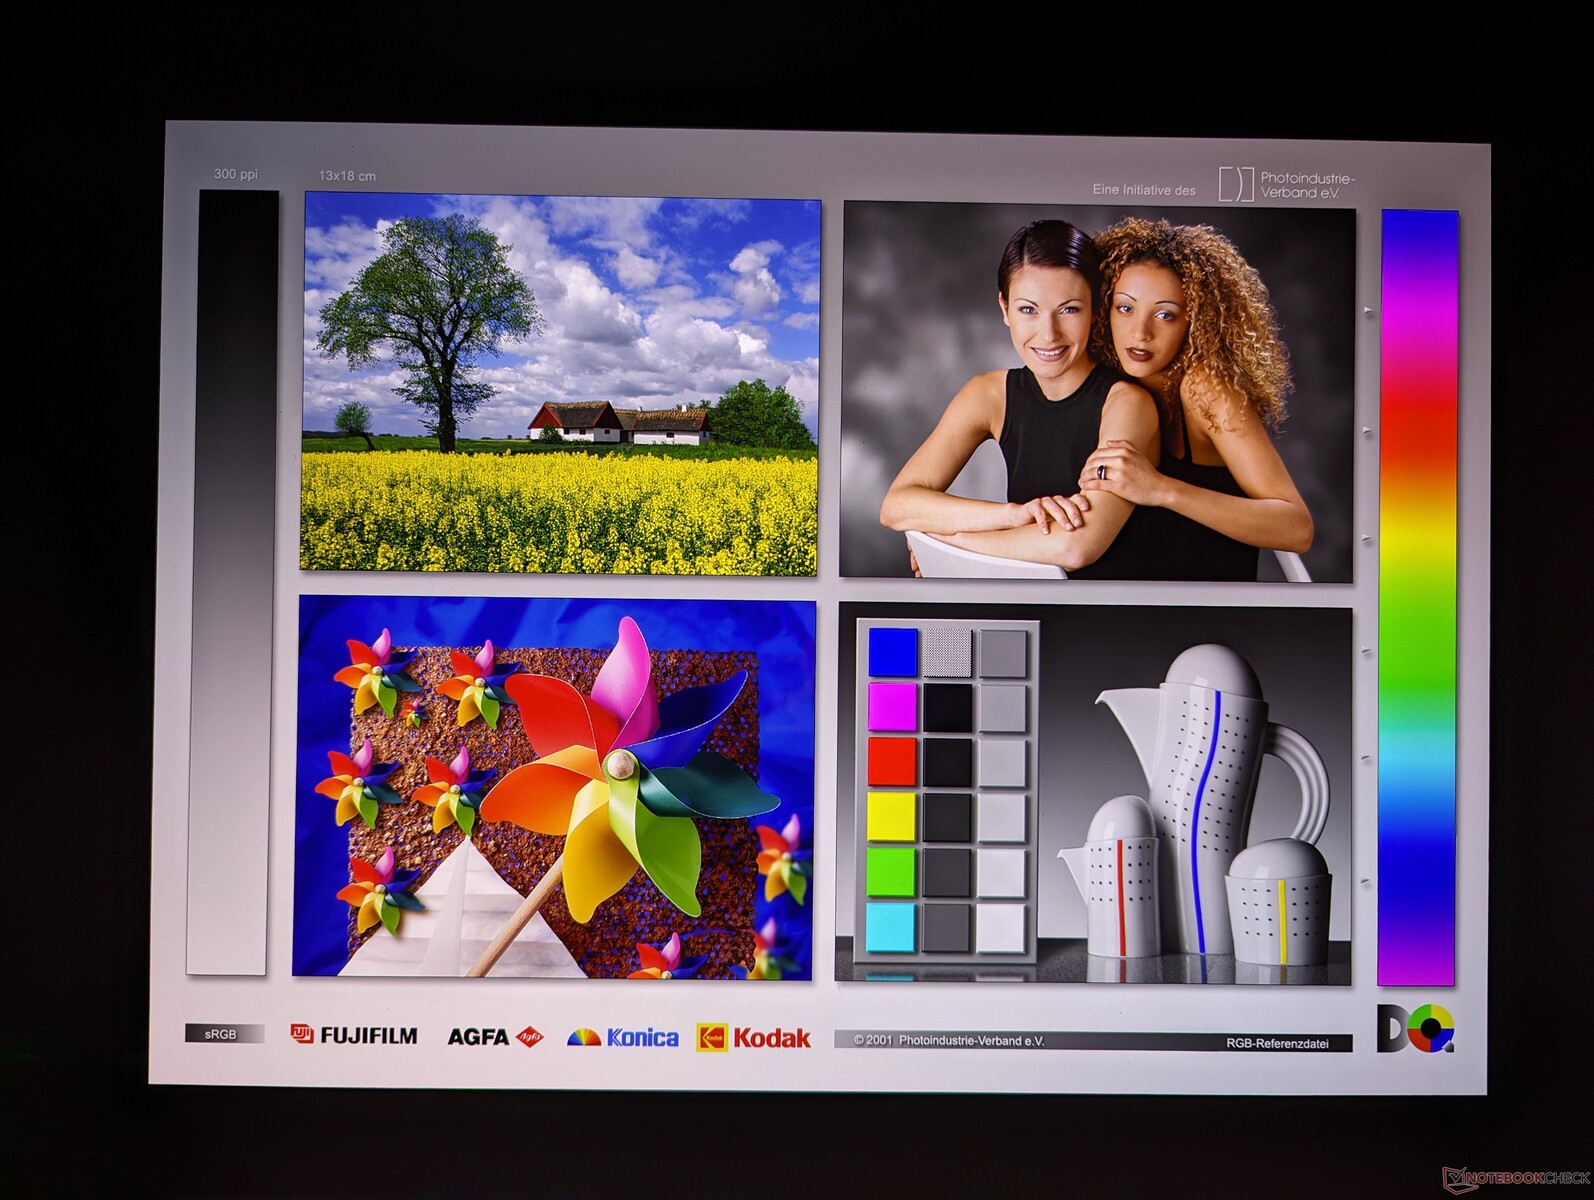
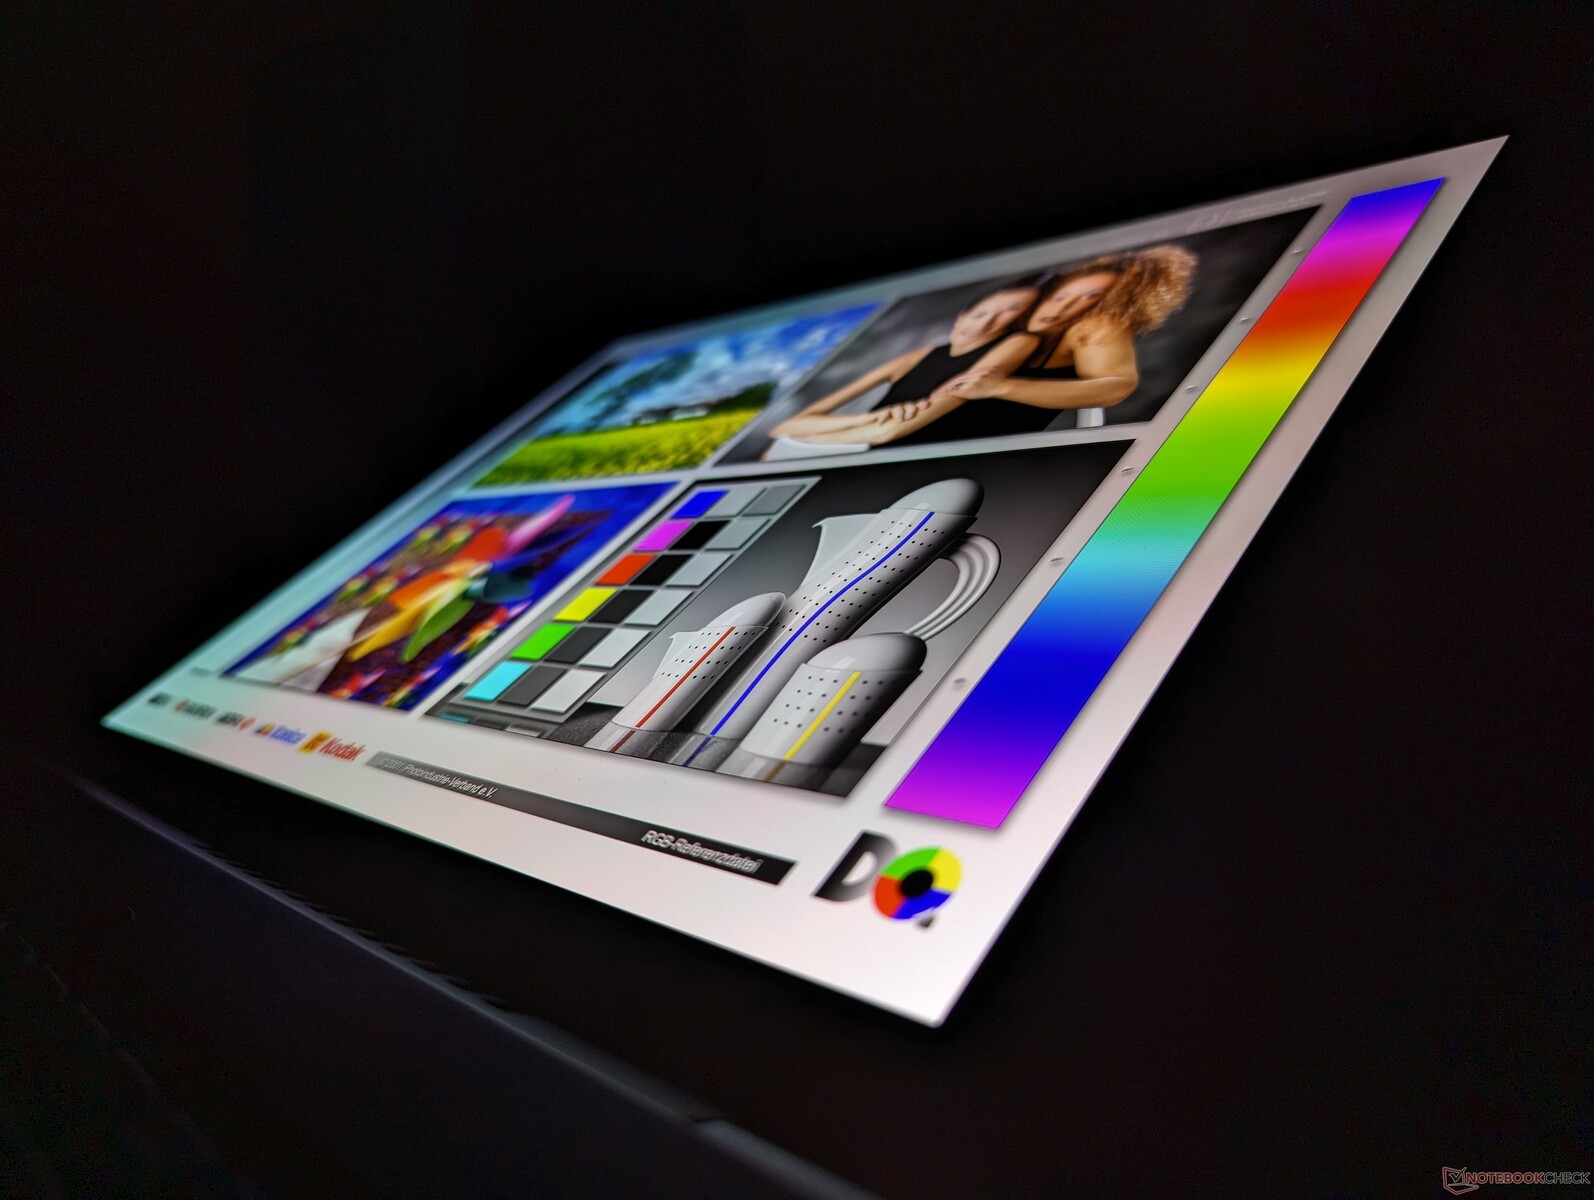
Display
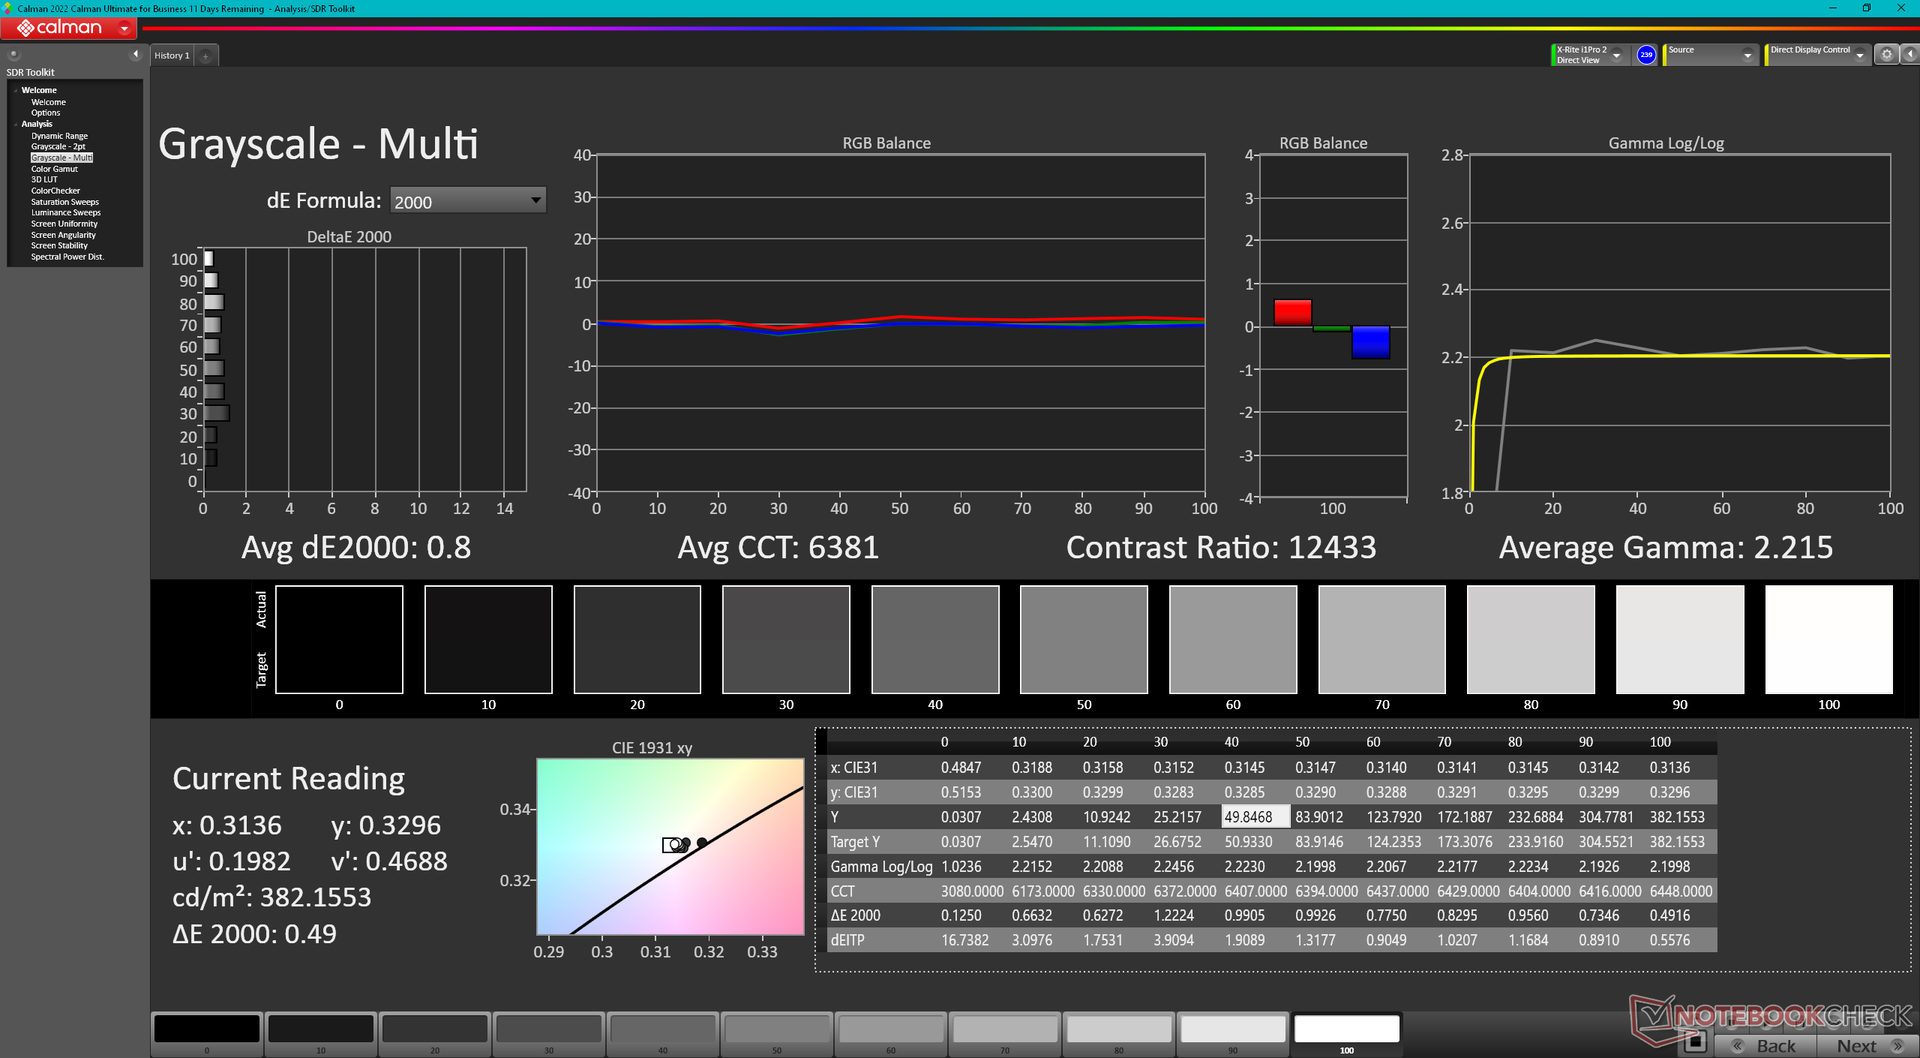
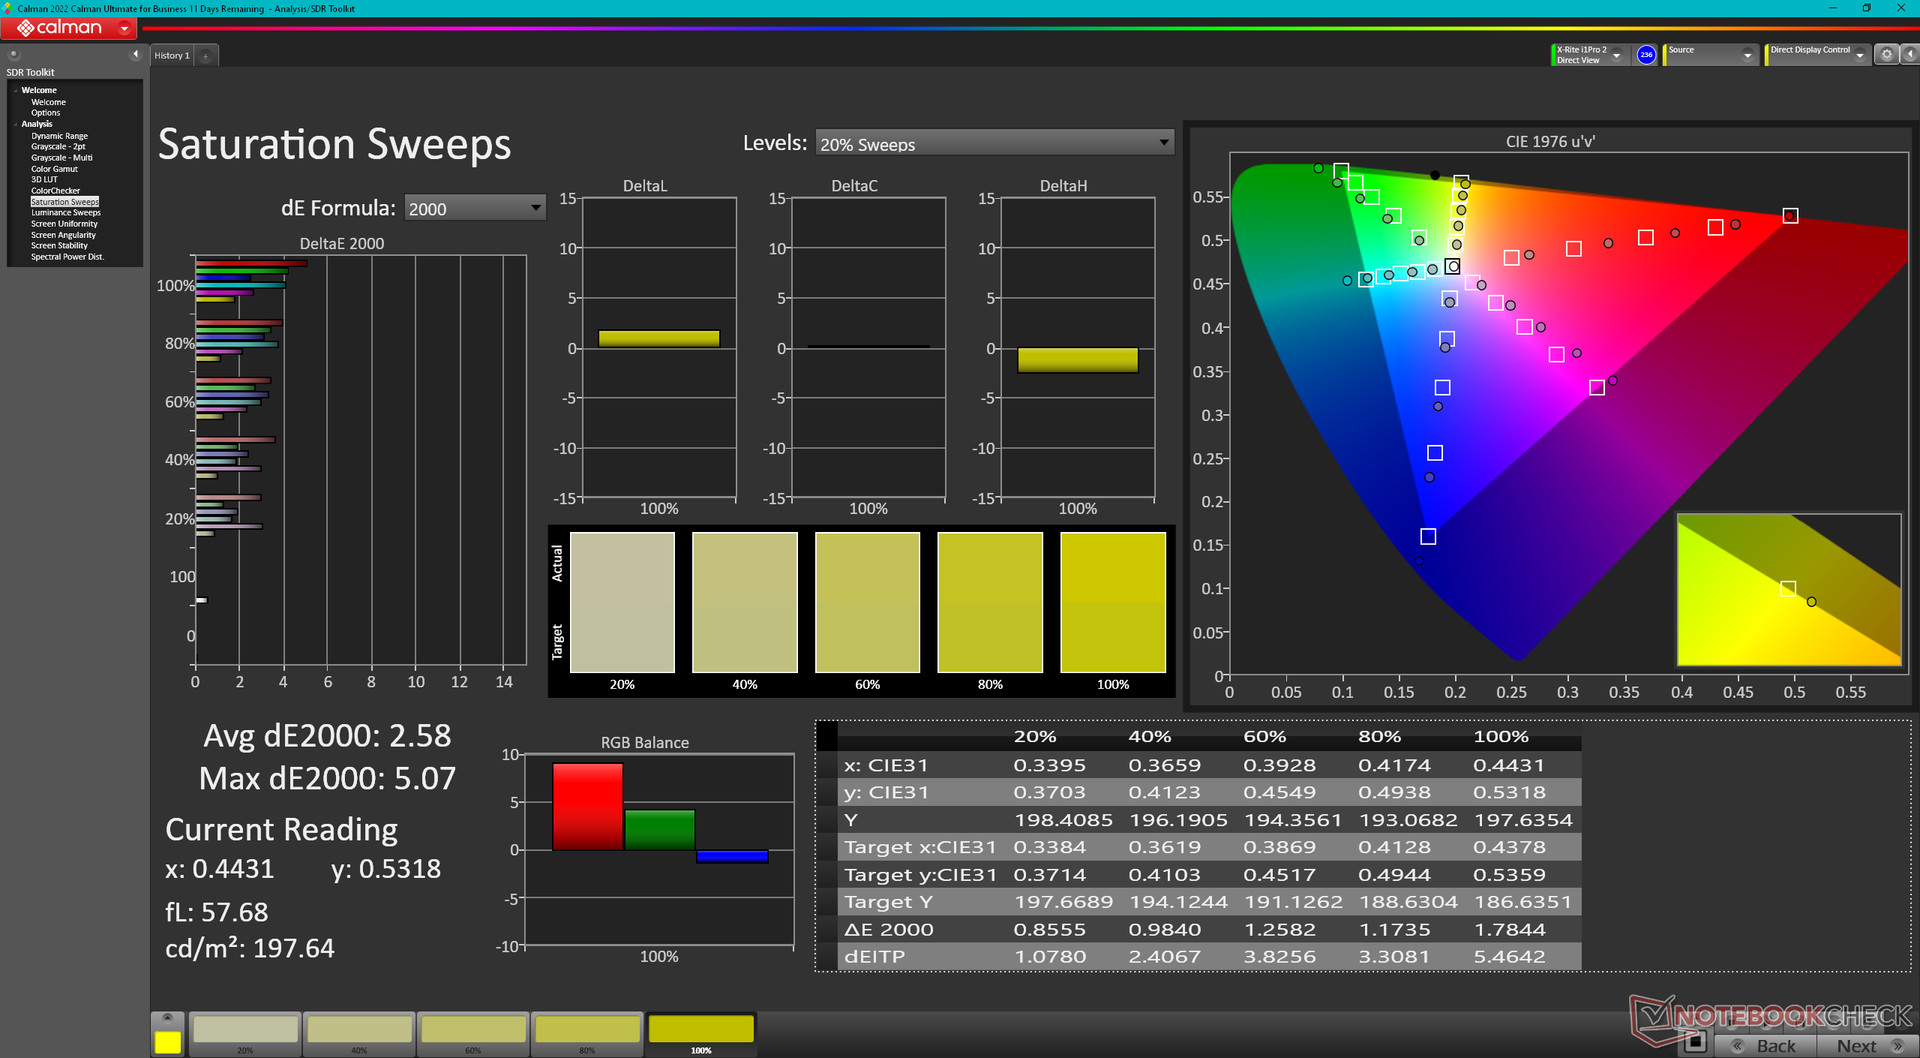
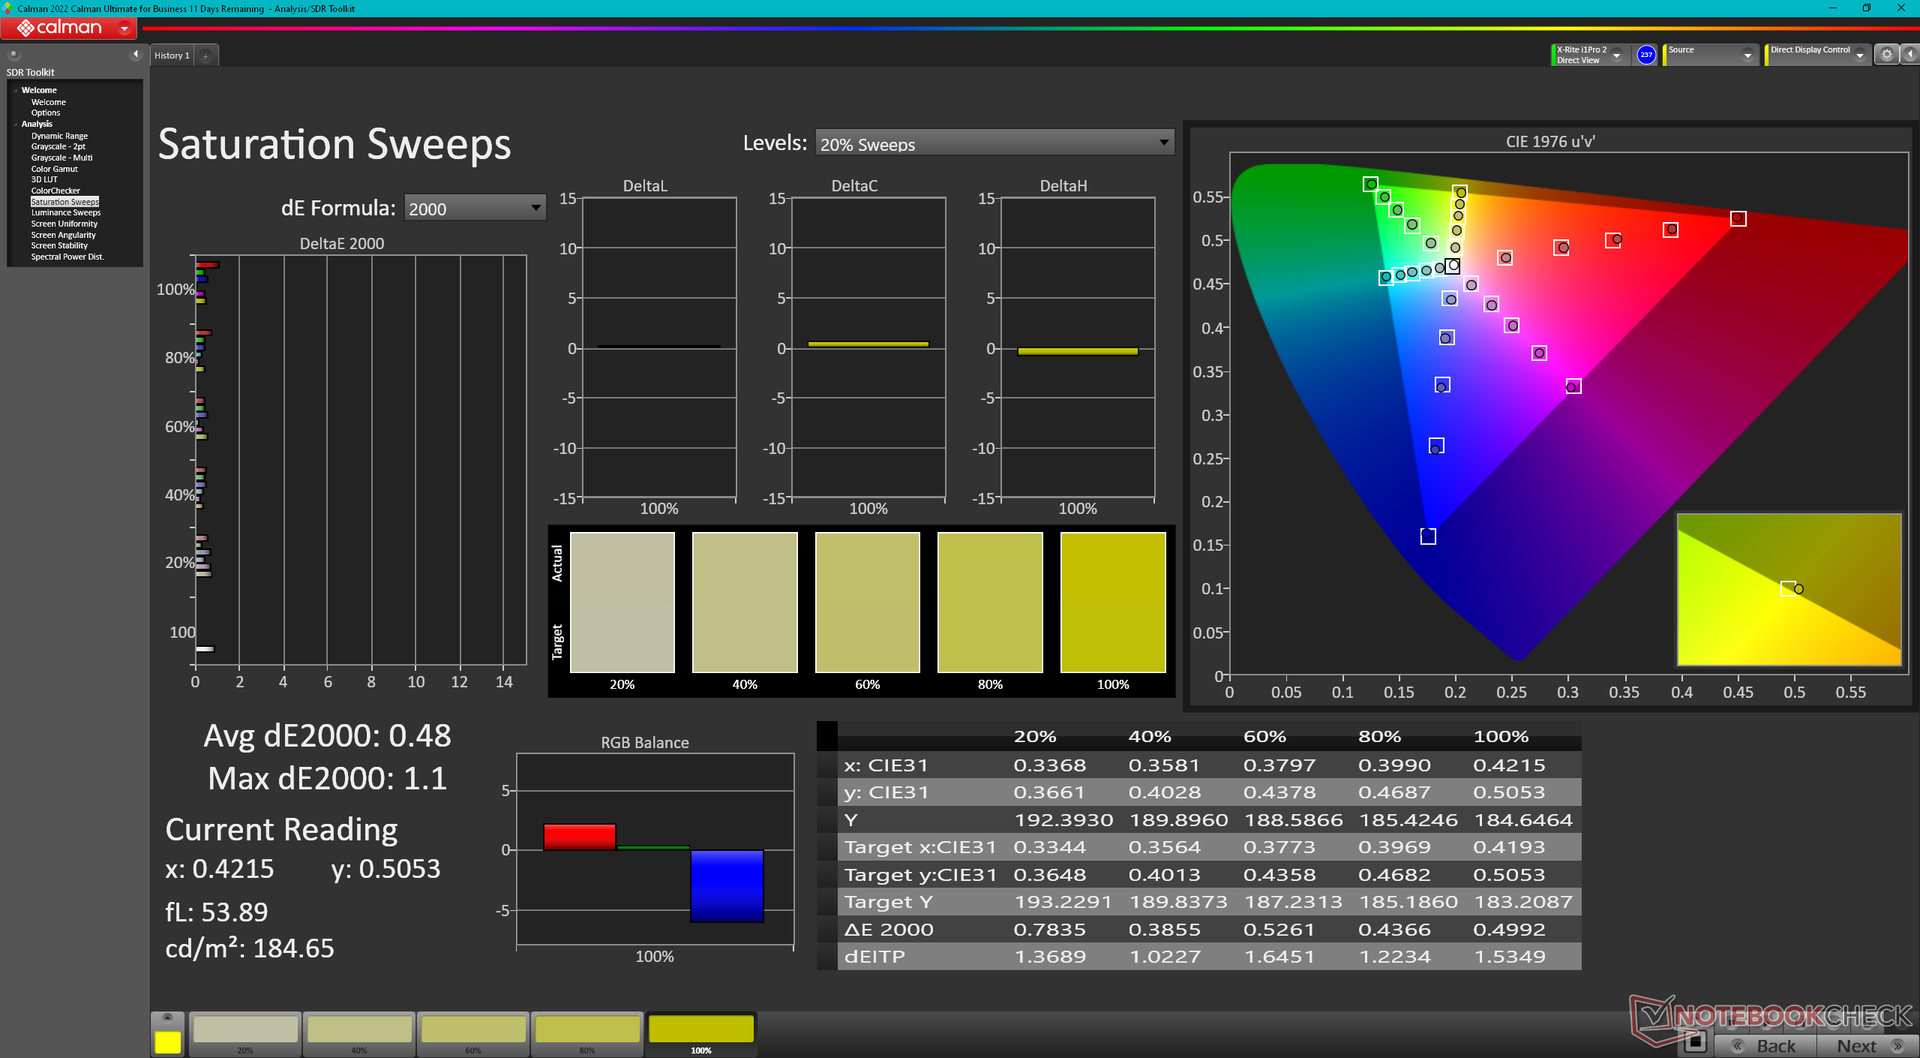
Our unit ships with a 3200 x 2000 120 Hz OLED display instead of the 3840 x 2400 60 Hz OLED display on our earlier Zen 3+ Swift Edge 16 review unit. The two Samsung panels otherwise offer similar color coverages, brightness levels, black levels, and very fast response times. The higher resolution option may be more useful for certain applications like Excel or side-by-side multitasking windows, but it's tough to go back to 60 Hz once you grow accustomed to the faster 120 Hz refresh rate of our lower resolution 3.2K option. For gaming purposes, the 120 Hz display means you can target 40 FPS instead of 30 FPS without needing to worry about screen tearing.

| |||||||||||||||||||||||||
Brightness Distribution: 98 %
Center on Battery: 379.8 cd/m²
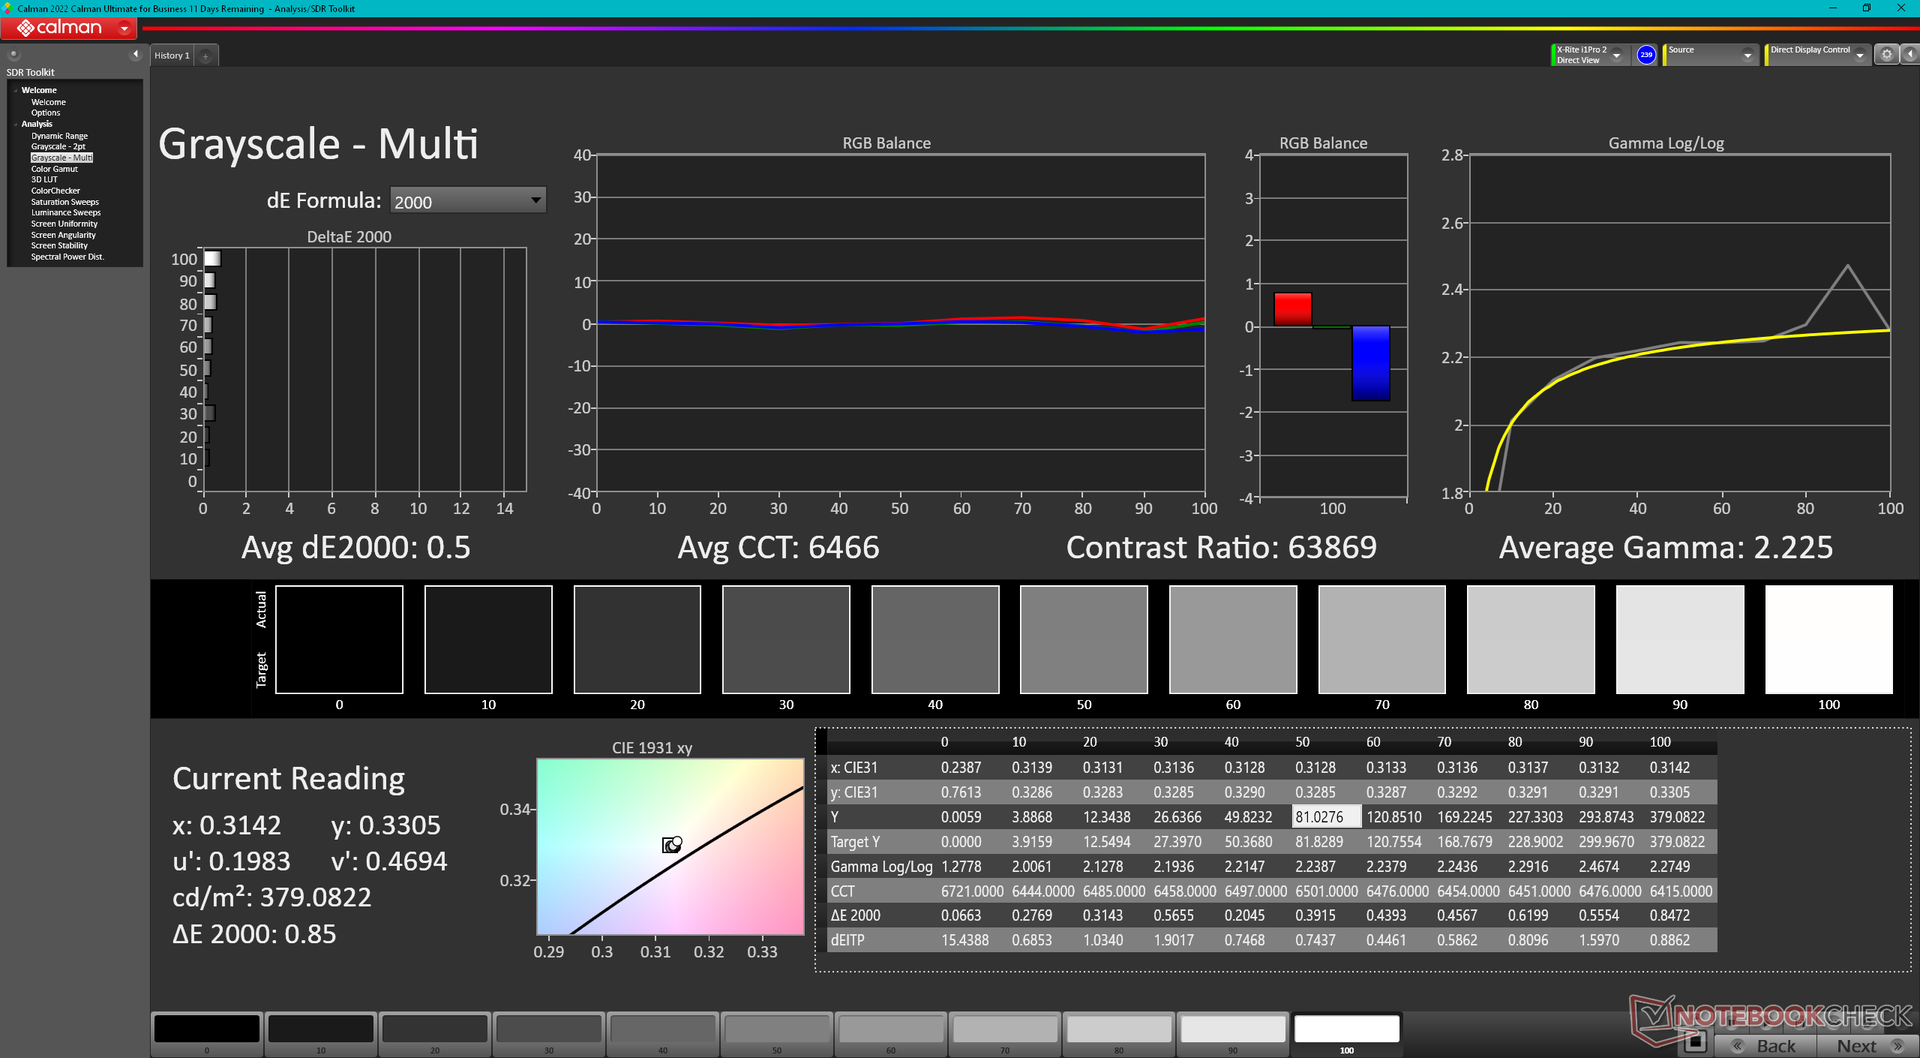
Contrast: ∞:1 (Black: 0 cd/m²)
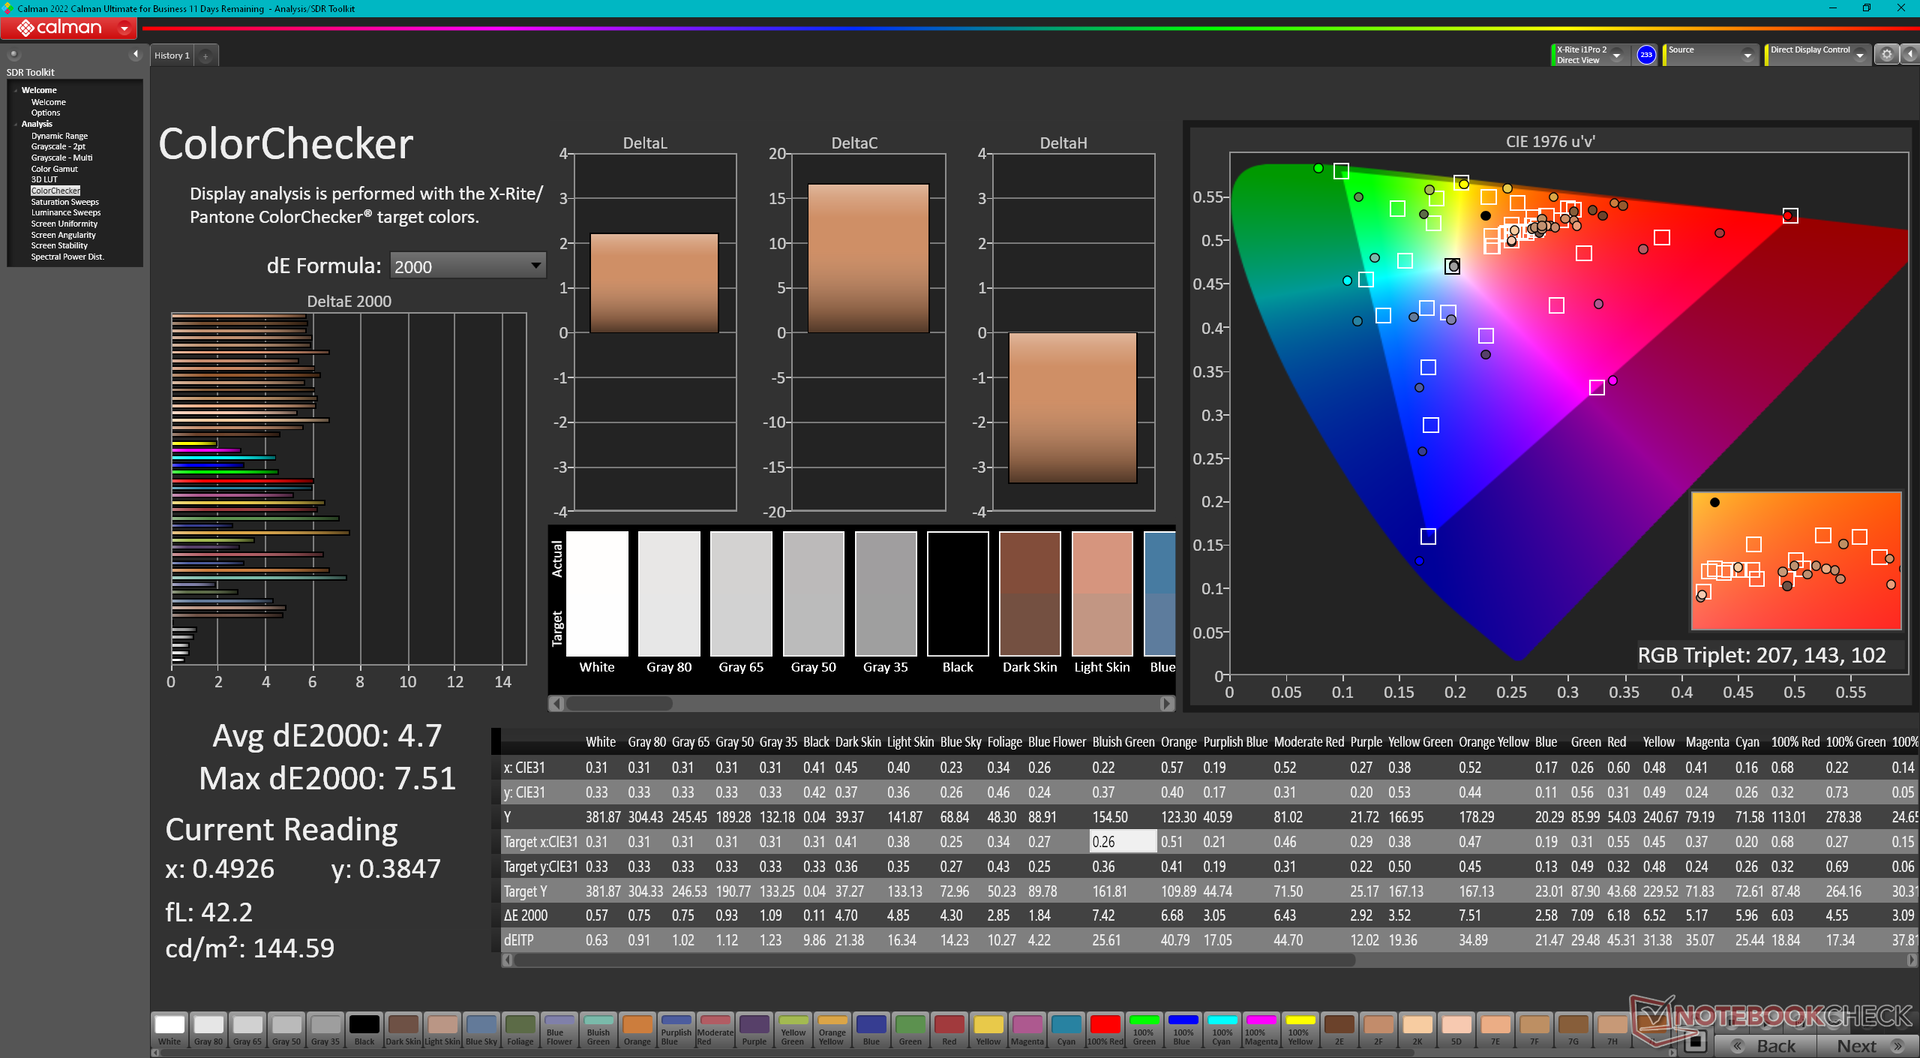
ΔE Color 4.7 | 0.5-29.43 Ø5.1, calibrated: 0.55
ΔE Greyscale 0.8 | 0.57-98 Ø5.3
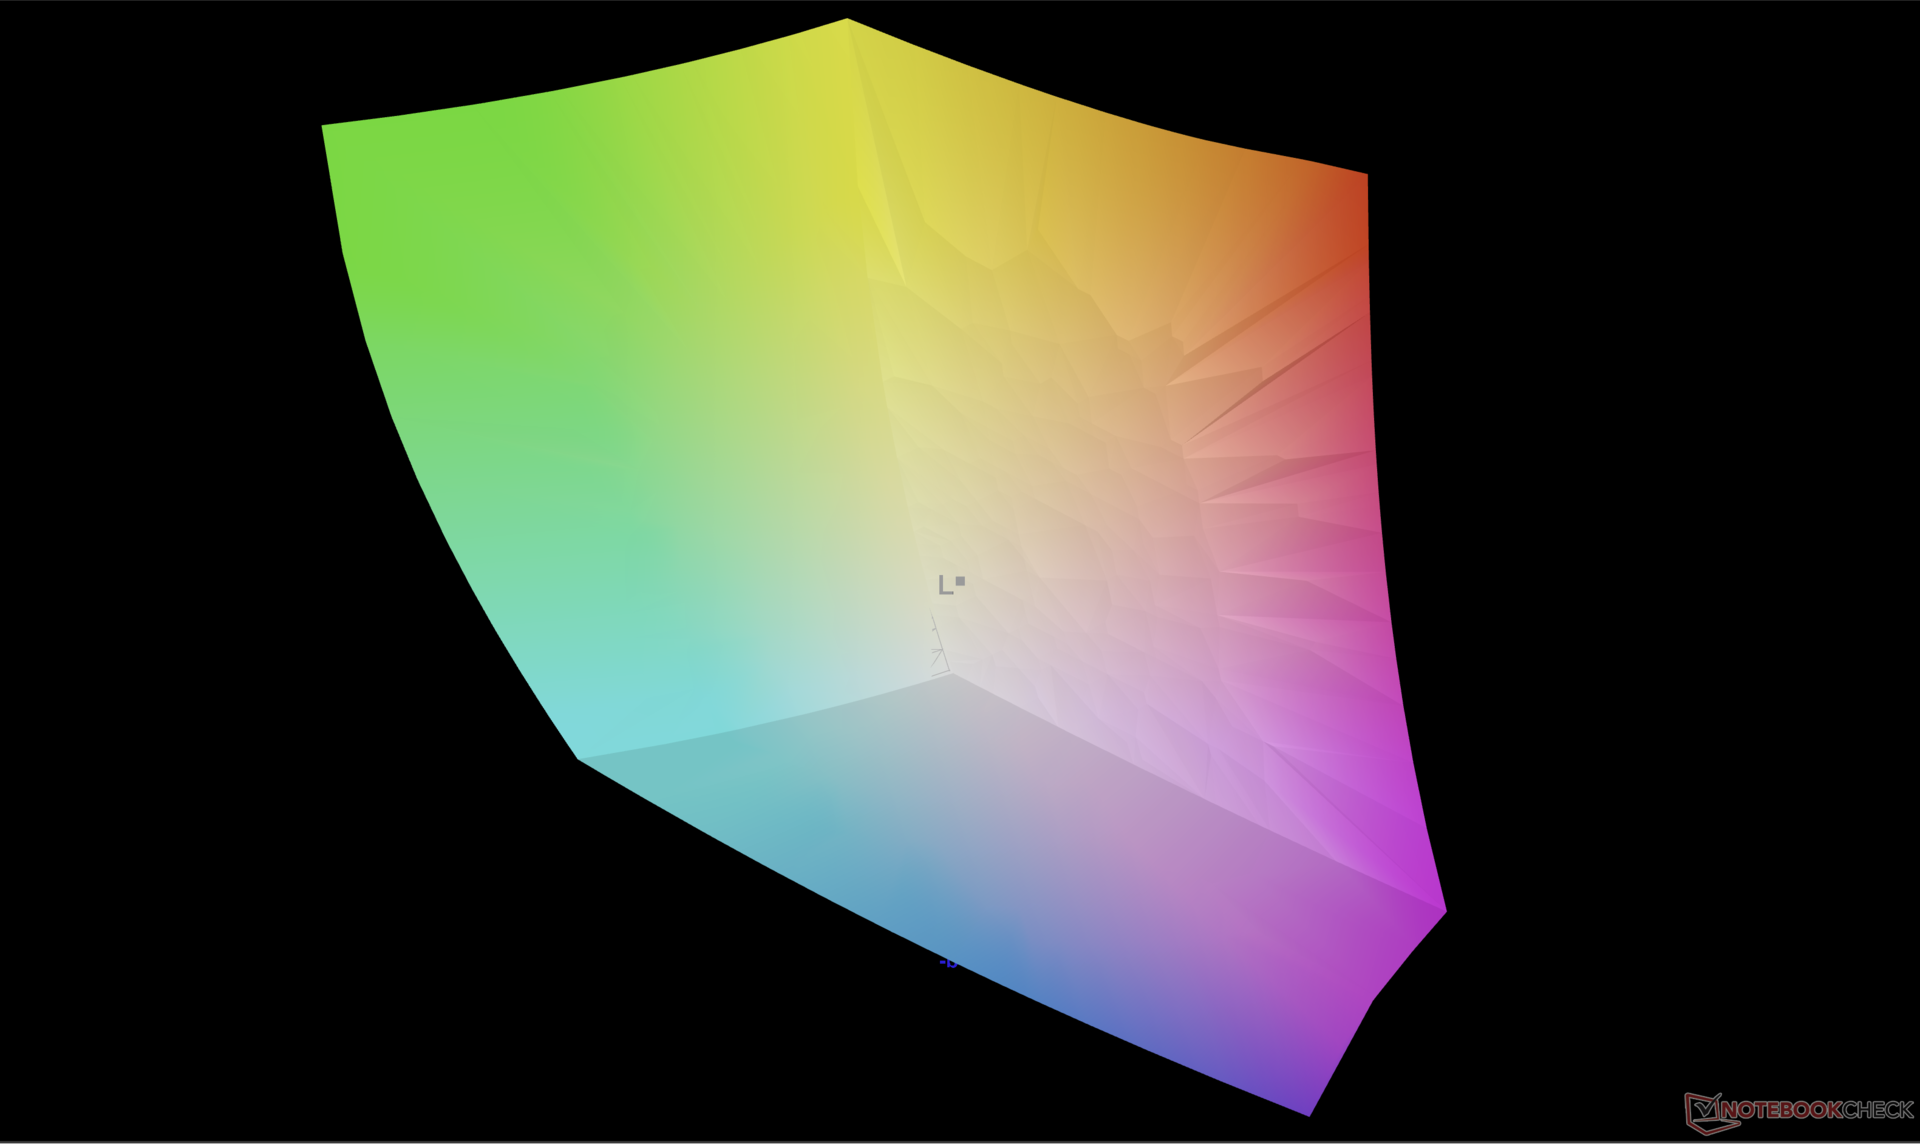
100% AdobeRGB 1998 (Argyll 2.2.0 3D)
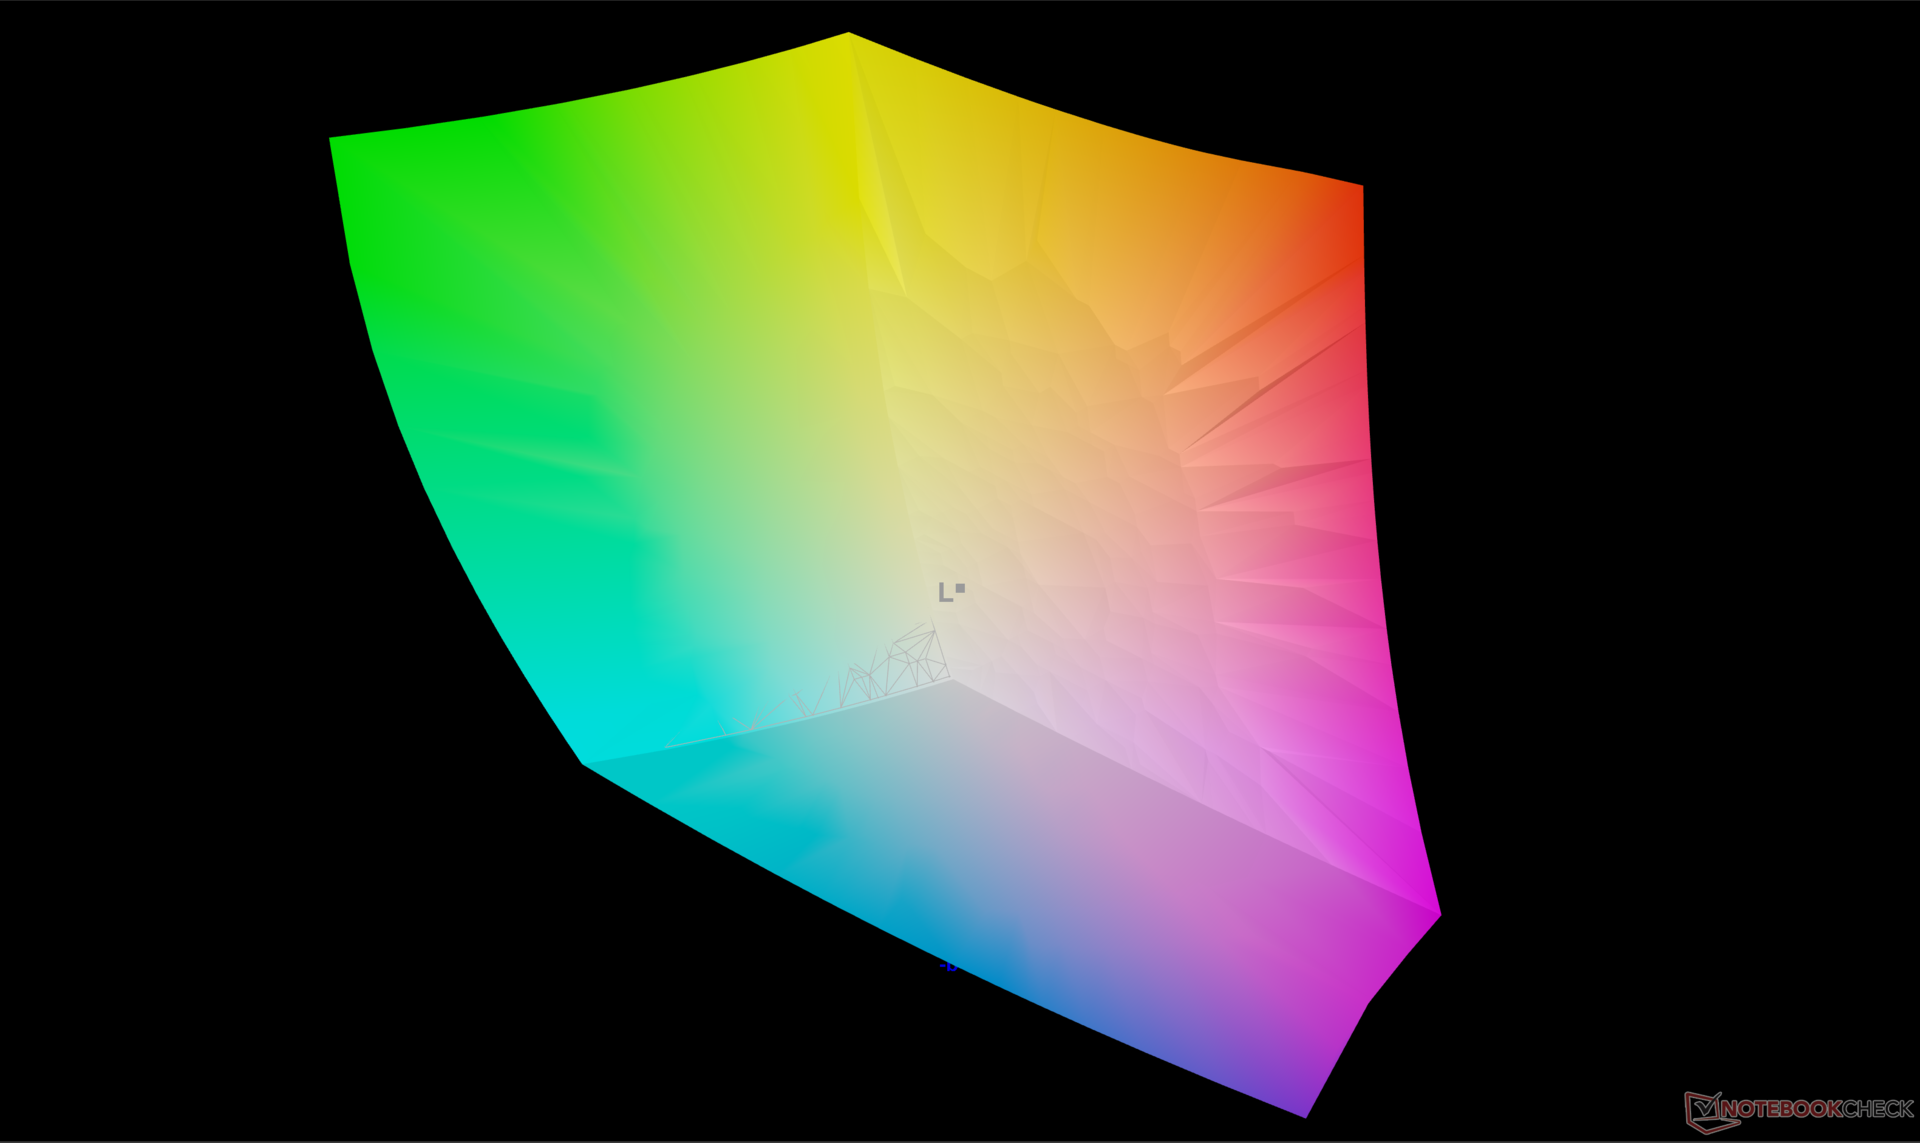
100% sRGB (Argyll 2.2.0 3D)
99.9% Display P3 (Argyll 2.2.0 3D)
Gamma: 2.22
| Acer Swift Edge SFE16 Ryzen 7 7840U Samsung ATNA60BX03-0, OLED, 3200x2000, 16.00 | Acer Swift Edge SFE16-42-R1GM Samsung SDC4168, OLED, 3840x2400, 16.00 | Lenovo Slim Pro 9i 16IRP8 LEN160-3.2K, Mini-LED, 3200x2000, 16.00 | Asus VivoBook Pro 16 Au Optronics B160QAN02.L, IPS, 2560x1600, 16.00 | Samsung Galaxy Book3 Ultra 16 Samsung ATNA60CL03-0, AMOLED, 2880x1800, 16.00 | Huawei MateBook 16s i7 BOE XS TV160DKT-NH0, IPS, 2520x1680, 16.00 | |
|---|---|---|---|---|---|---|
| Display | -1% | -7% | -5% | -1% | -24% | |
| Display P3 Coverage | 99.9 | 99.7 0% | 95.1 -5% | 98.5 -1% | 99.9 0% | 64.5 -35% |
| sRGB Coverage | 100 | 100 0% | 99.9 0% | 99.9 0% | 100 0% | 96.7 -3% |
| AdobeRGB 1998 Coverage | 100 | 97.2 -3% | 84.6 -15% | 86.1 -14% | 96.3 -4% | 66.6 -33% |
| Response Times | -150% | -285% | -476% | 17% | -4192% | |
| Response Time Grey 50% / Grey 80% * | 0.57 ? | 2 ? -251% | 14 ? -2356% | 2 ? -251% | 0.49 ? 14% | 35.7 ? -6163% |
| Response Time Black / White * | 1 ? | 3 ? -200% | 9.2 ? -820% | 8 ? -700% | 0.65 ? 35% | 23.2 ? -2220% |
| PWM Frequency | 238.8 | 239 ? 0% | 5784 ? 2322% | 240 ? 1% | ||
| Screen | -66% | -198% | -42% | -49% | -3% | |
| Brightness middle | 379.8 | 369 -3% | 627.4 65% | 504 33% | 400 5% | 311 -18% |
| Brightness | 383 | 371 -3% | 618 61% | 465 21% | 399 4% | 319 -17% |
| Brightness Distribution | 98 | 97 -1% | 95 -3% | 87 -11% | 93 -5% | 91 -7% |
| Black Level * | 0.19 | 0.35 | 0.03 | 0.17 | ||
| Colorchecker dE 2000 * | 4.7 | 2.3 51% | 5.84 -24% | 1.83 61% | 2.3 51% | 1 79% |
| Colorchecker dE 2000 max. * | 7.51 | 4.37 42% | 10.22 -36% | 5.51 27% | 4.15 45% | 1.7 77% |
| Colorchecker dE 2000 calibrated * | 0.55 | 2.87 -422% | 4.45 -709% | 1.34 -144% | 1.66 -202% | 0.8 -45% |
| Greyscale dE 2000 * | 0.8 | 1.83 -129% | 6.7 -738% | 3.02 -278% | 2.7 -238% | 1.5 -88% |
| Gamma | 2.22 99% | 2.39 92% | 2.77 79% | 2.39 92% | 2.266 97% | 2.15 102% |
| CCT | 6381 102% | 6392 102% | 5795 112% | 6688 97% | 7047 92% | 6432 101% |
| Contrast | 3302 | 1440 | 13333 | 1829 | ||
| Total Average (Program / Settings) | -72% /
-71% | -163% /
-174% | -174% /
-105% | -11% /
-23% | -1406% /
-706% |
* ... smaller is better

Display Response Times
| ↔ Response Time Black to White | ||
|---|---|---|
| 1 ms ... rise ↗ and fall ↘ combined | ↗ 0.55 ms rise | 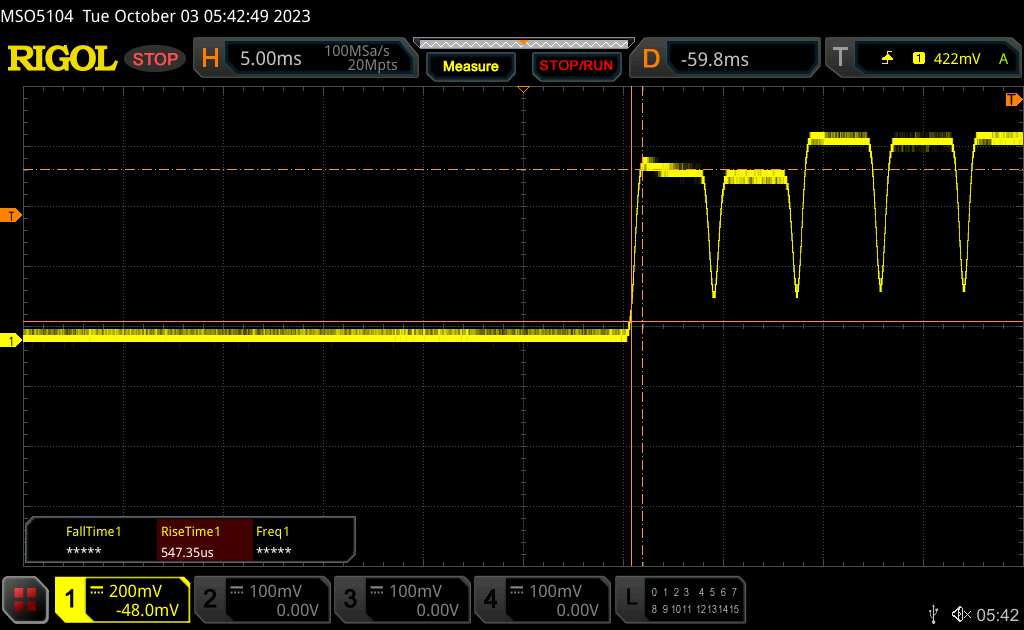 |
| ↘ 0.45 ms fall | ||
| The screen shows very fast response rates in our tests and should be very well suited for fast-paced gaming. In comparison, all tested devices range from 0.1 (minimum) to 240 (maximum) ms. » 1 % of all devices are better. This means that the measured response time is better than the average of all tested devices (21.8 ms). | ||
| ↔ Response Time 50% Grey to 80% Grey | ||
| 0.57 ms ... rise ↗ and fall ↘ combined | ↗ 0.28 ms rise | 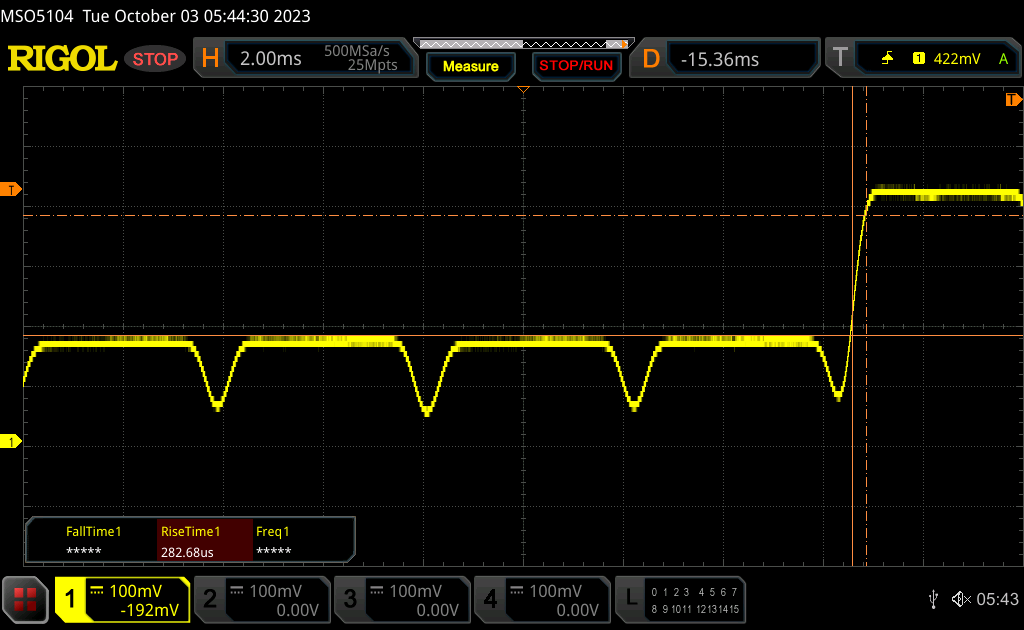 |
| ↘ 0.29 ms fall | ||
| The screen shows very fast response rates in our tests and should be very well suited for fast-paced gaming. In comparison, all tested devices range from 0.2 (minimum) to 636 (maximum) ms. » 0 % of all devices are better. This means that the measured response time is better than the average of all tested devices (34.3 ms). | ||
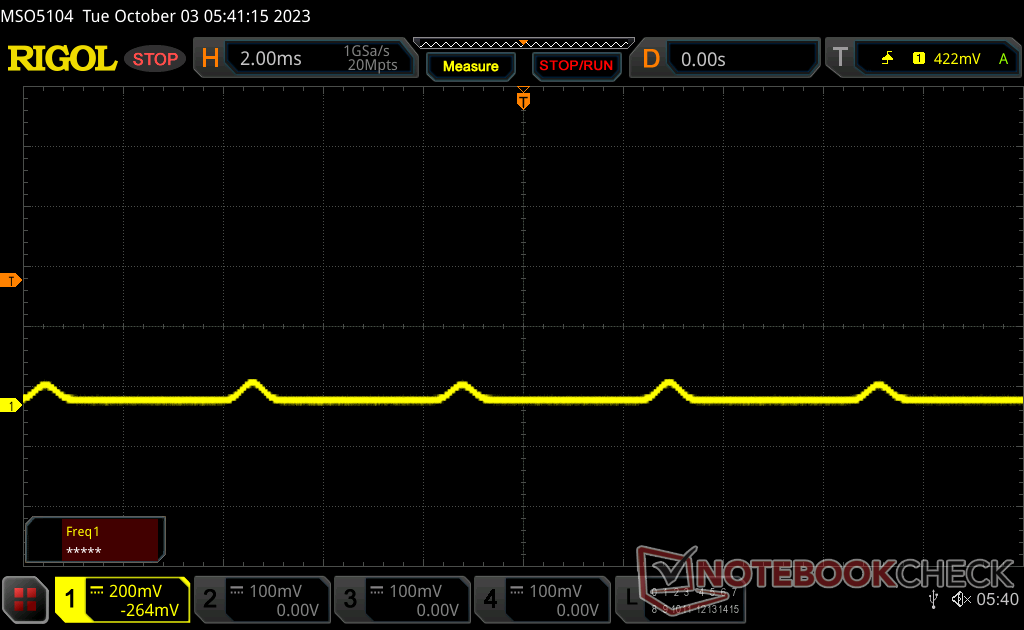
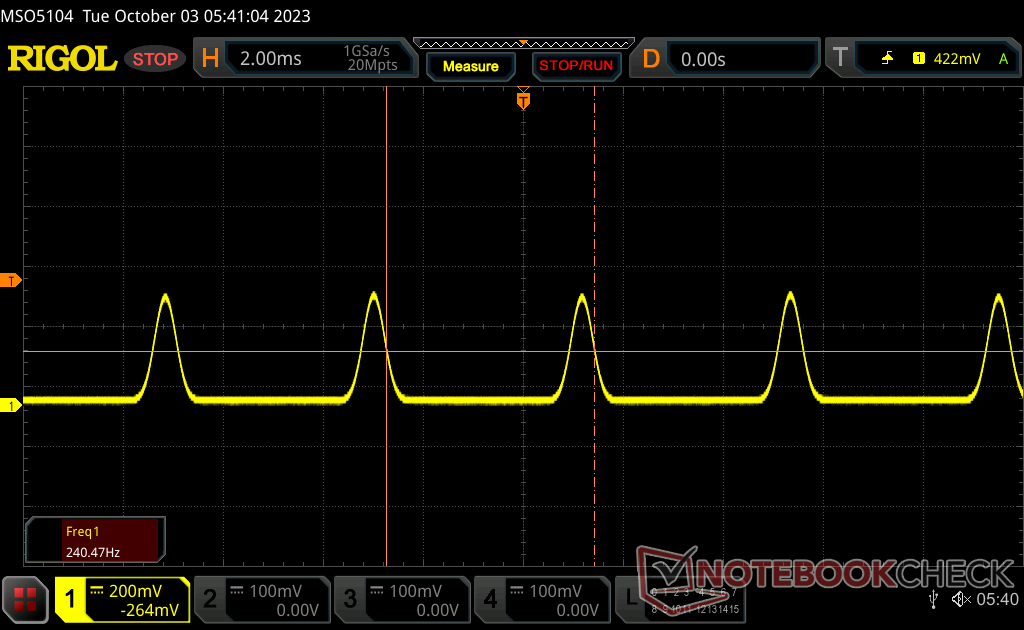
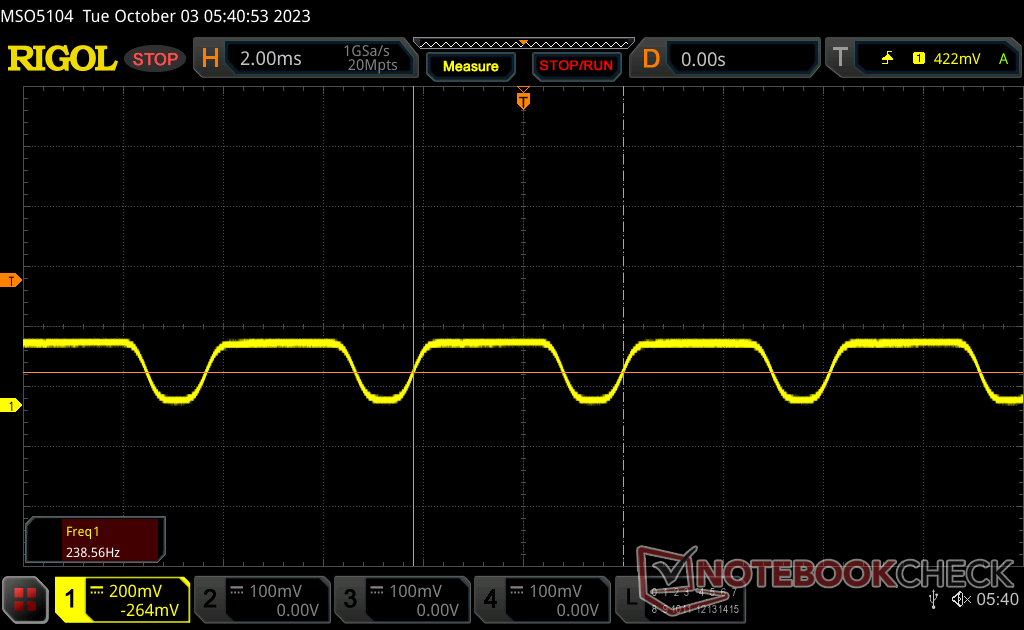
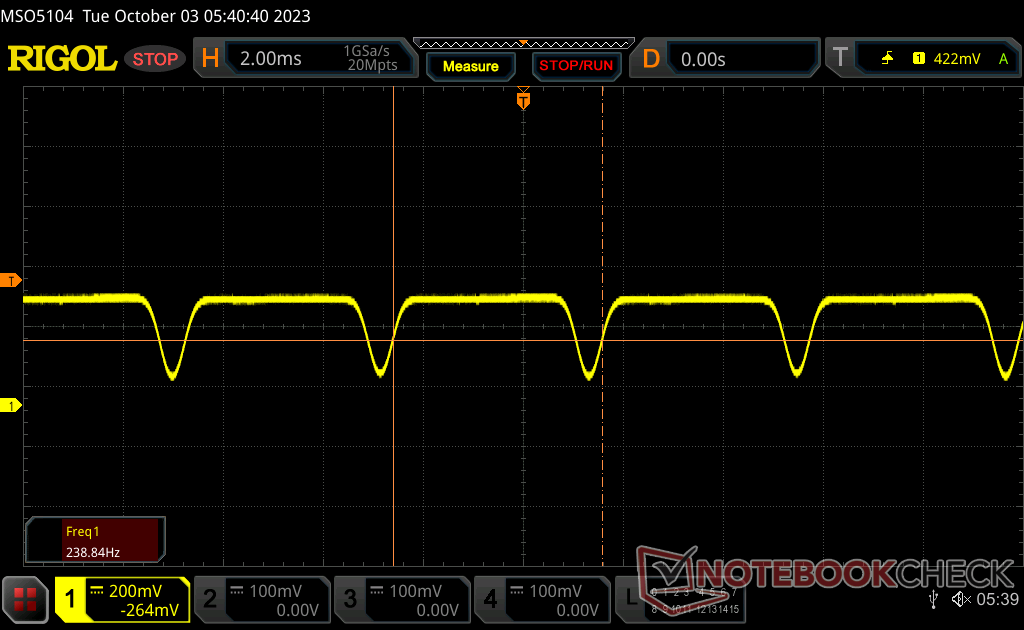
Screen Flickering / PWM (Pulse-Width Modulation)
| Screen flickering / PWM detected | 238.8 Hz | 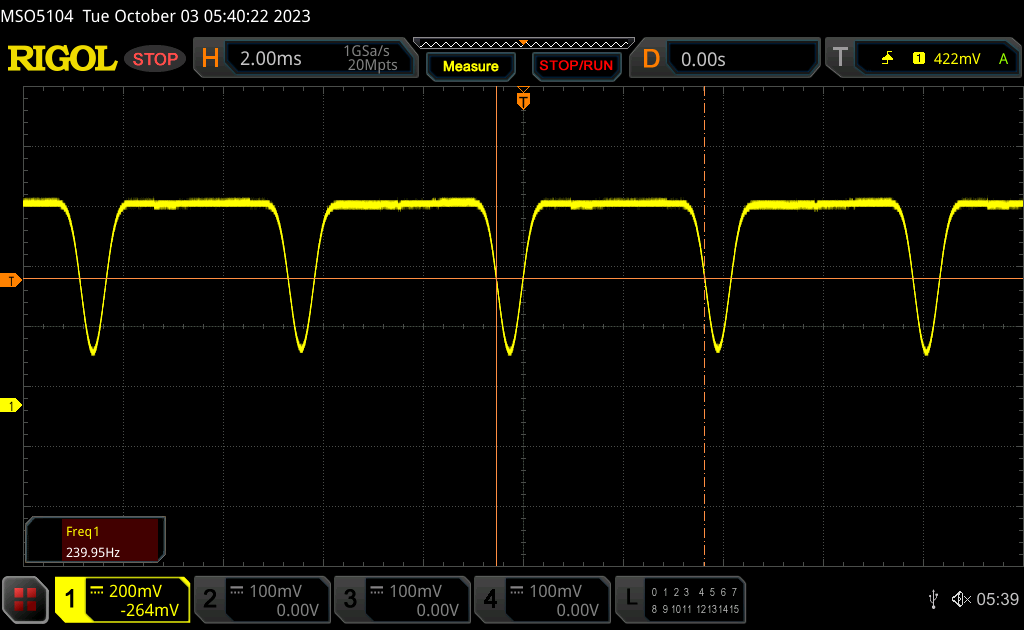 | |
The display backlight flickers at 238.8 Hz (Likely utilizing PWM) . The frequency of 238.8 Hz is relatively low, so sensitive users will likely notice flickering and experience eyestrain at the stated brightness setting and below. In comparison: 53 % of all tested devices do not use PWM to dim the display. If PWM was detected, an average of 18732 (minimum: 5 - maximum: 3846000) Hz was measured. | |||
A constant pulse-width modulation of 238 Hz is present on all brightness levels including even the maximum setting. Such a behavior is common on OLED displays ranging from smartphones to laptops.
Performance
Testing Conditions
We set Windows to Performance mode prior to running the benchmarks below. Acer includes no specialized software for performance or display adjustments unlike on the Asus VivoBook series.
FreeSync is not supported on the internal display.
Processor
Multi-thread performance is slightly but consistently behind most other laptops with the same Ryzen 7 7840U. The recent AMD Framework Laptop 13.5, for example, would run 15 percent faster. The discrepancy is due to the weaker Turbo Core potential of the CPU in the Acer stemming from its small cooling solution relative to the large 16-inch screen size. CineBench R15 xT scores would drop by as much as 21 percent over time as shown by our comparison graph below.
Overall performance is still faster than the Zen 3+ Ryzen 7 7735U in the older Acer Swift Edge SFE16-42-R1GM by about 15 percent in both single- and multi-threaded loads despite the throttling.
Cinebench R15 Multi Loop
Cinebench R23: Multi Core | Single Core
Cinebench R20: CPU (Multi Core) | CPU (Single Core)
Cinebench R15: CPU Multi 64Bit | CPU Single 64Bit
Blender: v2.79 BMW27 CPU
7-Zip 18.03: 7z b 4 | 7z b 4 -mmt1
Geekbench 5.5: Multi-Core | Single-Core
HWBOT x265 Benchmark v2.2: 4k Preset
LibreOffice : 20 Documents To PDF
R Benchmark 2.5: Overall mean
* ... smaller is better
AIDA64: FP32 Ray-Trace | FPU Julia | CPU SHA3 | CPU Queen | FPU SinJulia | FPU Mandel | CPU AES | CPU ZLib | FP64 Ray-Trace | CPU PhotoWorxx
System Performance

CrossMark: Overall | Productivity | Creativity | Responsiveness
| PCMark 10 / Digital Content Creation | |
| Lenovo Slim Pro 9i 16IRP8 | |
| Samsung Galaxy Book3 Ultra 16 | |
| Asus VivoBook Pro 16 | |
| Acer Swift Edge SFE16 Ryzen 7 7840U | |
| Average AMD Ryzen 7 7840U, AMD Radeon 780M (7204 - 8987, n=5) | |
| Acer Swift Edge SFE16-42-R1GM | |
| Huawei MateBook 16s i7 | |
| PCMark 10 Score | 6952 points | |
Help | ||
* ... smaller is better
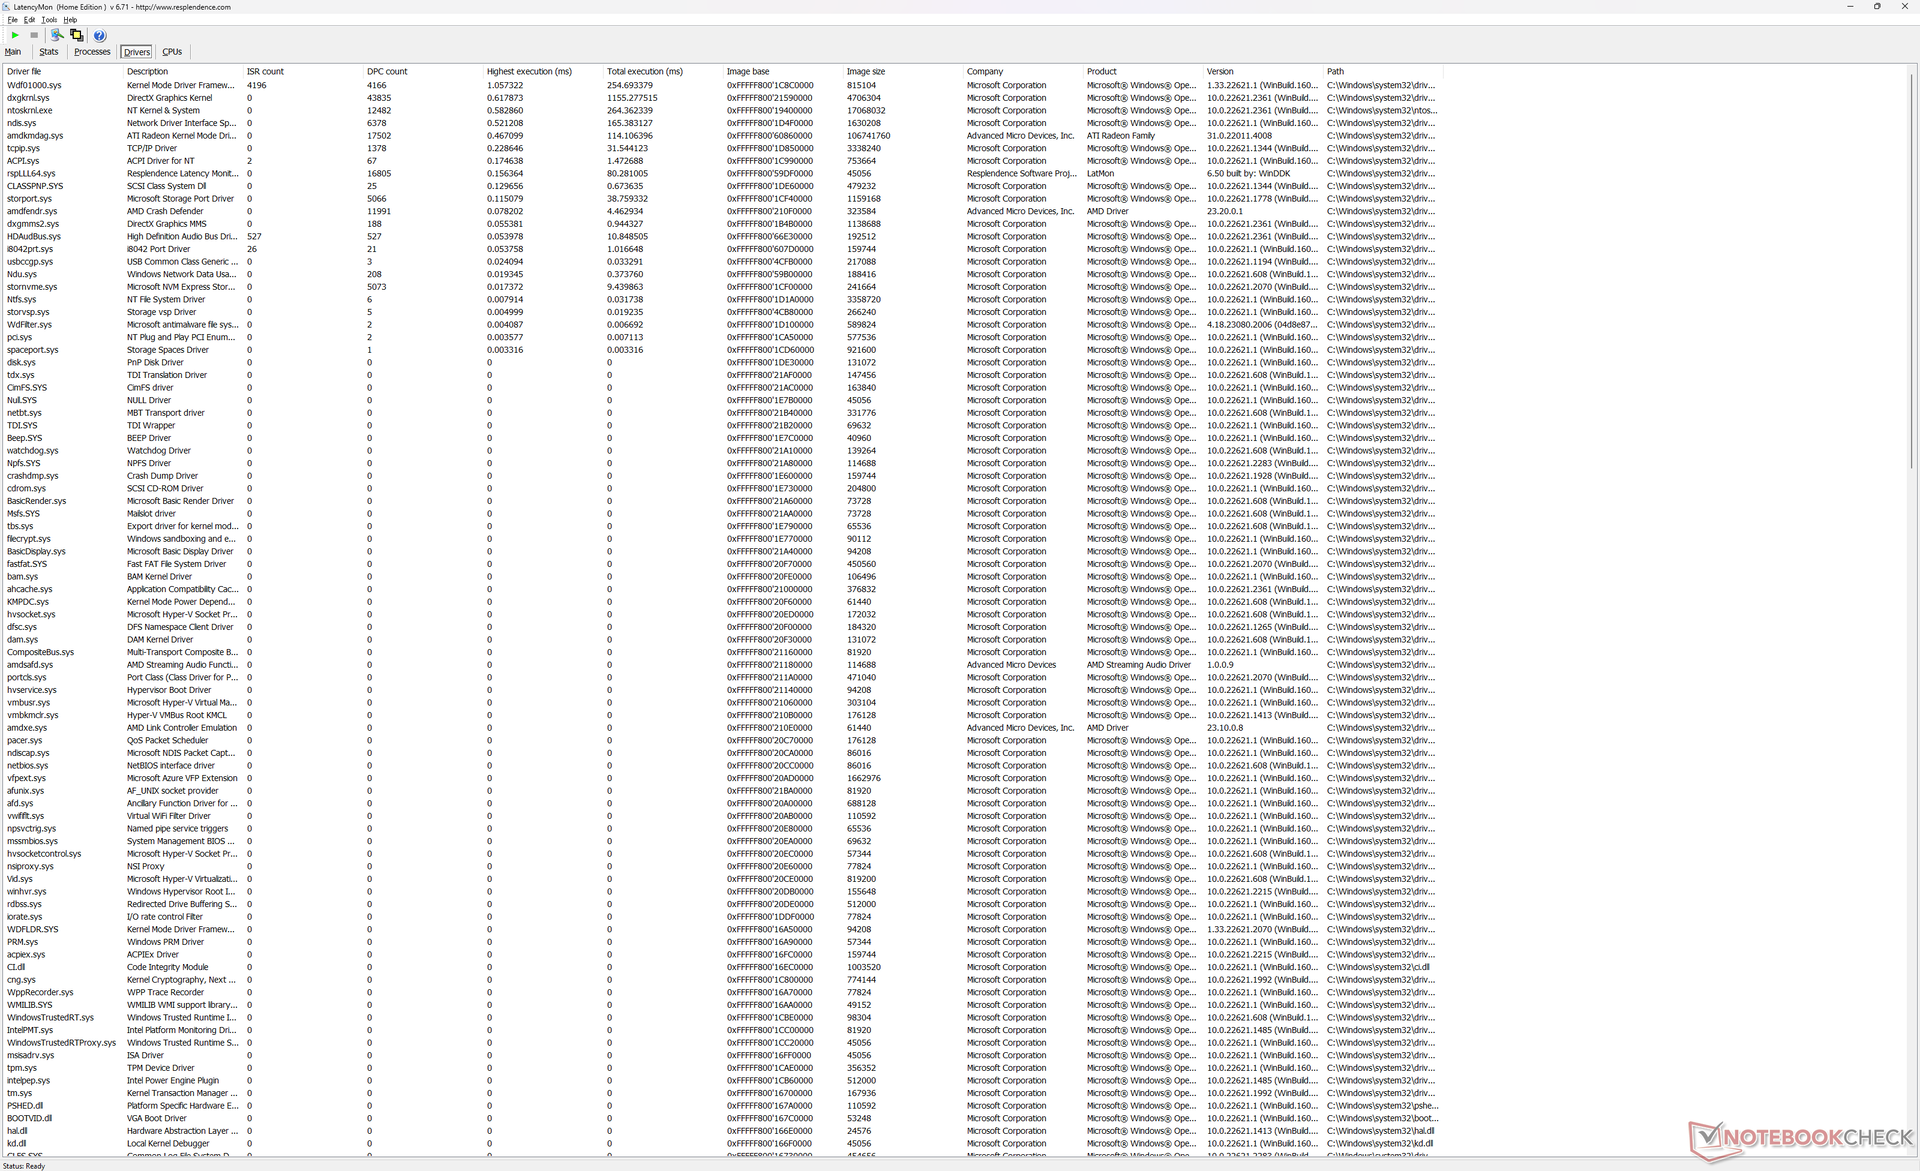
DPC Latency
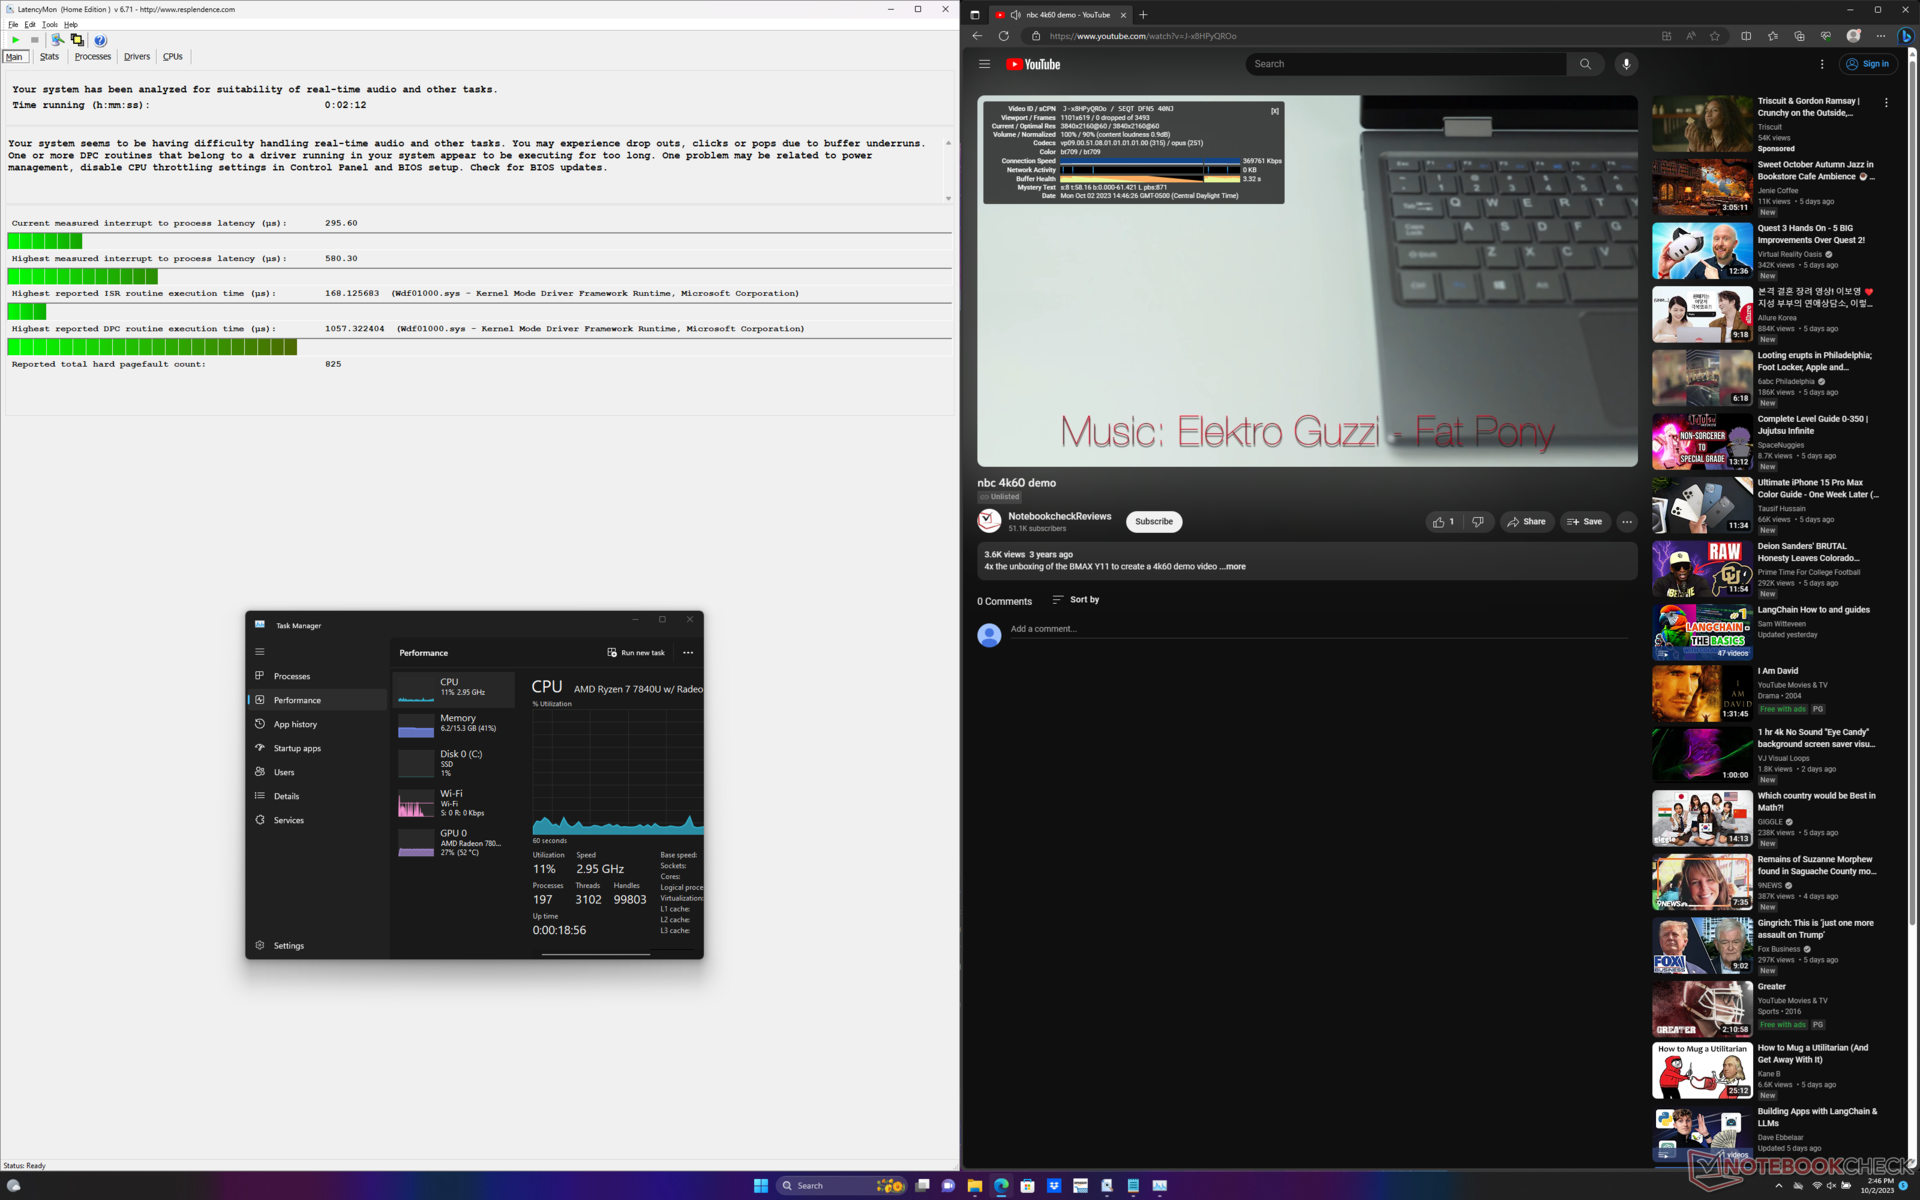
LatencyMon reveals no major DPC issues when opening multiple browser tabs of our homepage. 4K video playback at 60 FPS is also perfect with no dropped frames recorded.
| DPC Latencies / LatencyMon - interrupt to process latency (max), Web, Youtube, Prime95 | |
| Samsung Galaxy Book3 Ultra 16 | |
| Acer Swift Edge SFE16-42-R1GM | |
| Asus VivoBook Pro 16 | |
| Lenovo Slim Pro 9i 16IRP8 | |
| Acer Swift Edge SFE16 Ryzen 7 7840U | |
* ... smaller is better
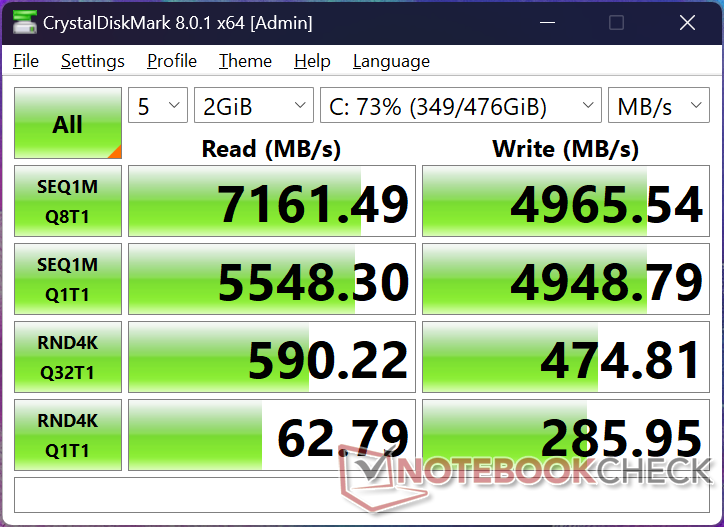
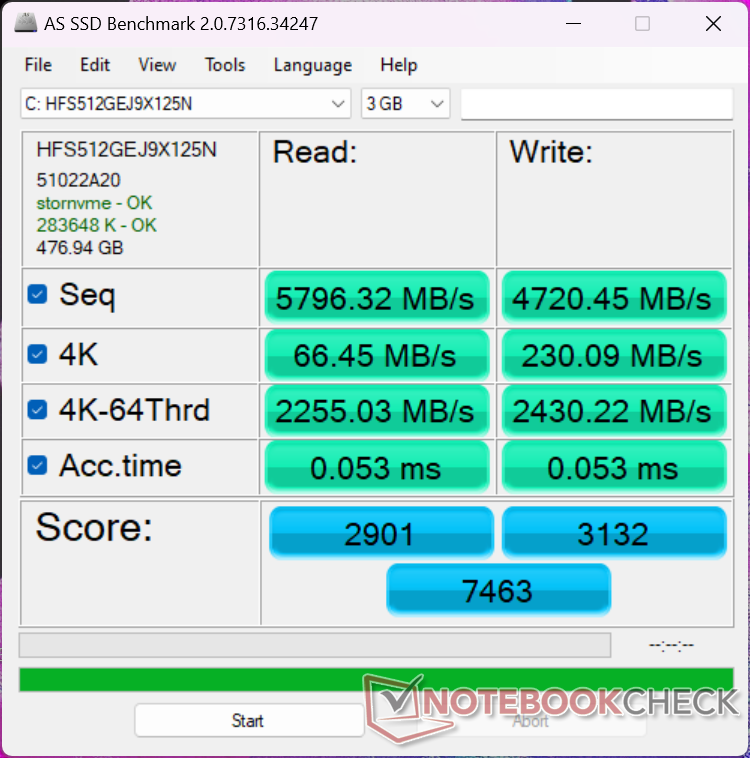
Storage Devices
Our test unit ships with an SK hynix HFS512GEJ9X125N which rivals the Samsung PM9A1 on paper. In reality, however, the drive on our unit would throttle to as low as 3500 MB/s after just a couple of minutes of stress as shown by the graph below. This behavior was observed on our older Swift Edge 16 as well to suggest that the drives suffer from inadequate cooling or heat dissipation.

| Drive Performance Rating - Percent | |
| Acer Swift Edge SFE16 Ryzen 7 7840U | |
| Samsung Galaxy Book3 Ultra 16 | |
| Acer Swift Edge SFE16-42-R1GM | |
| Lenovo Slim Pro 9i 16IRP8 | |
| Huawei MateBook 16s i7 | |
| Asus VivoBook Pro 16 | |
* ... smaller is better
Disk Throttling: DiskSpd Read Loop, Queue Depth 8
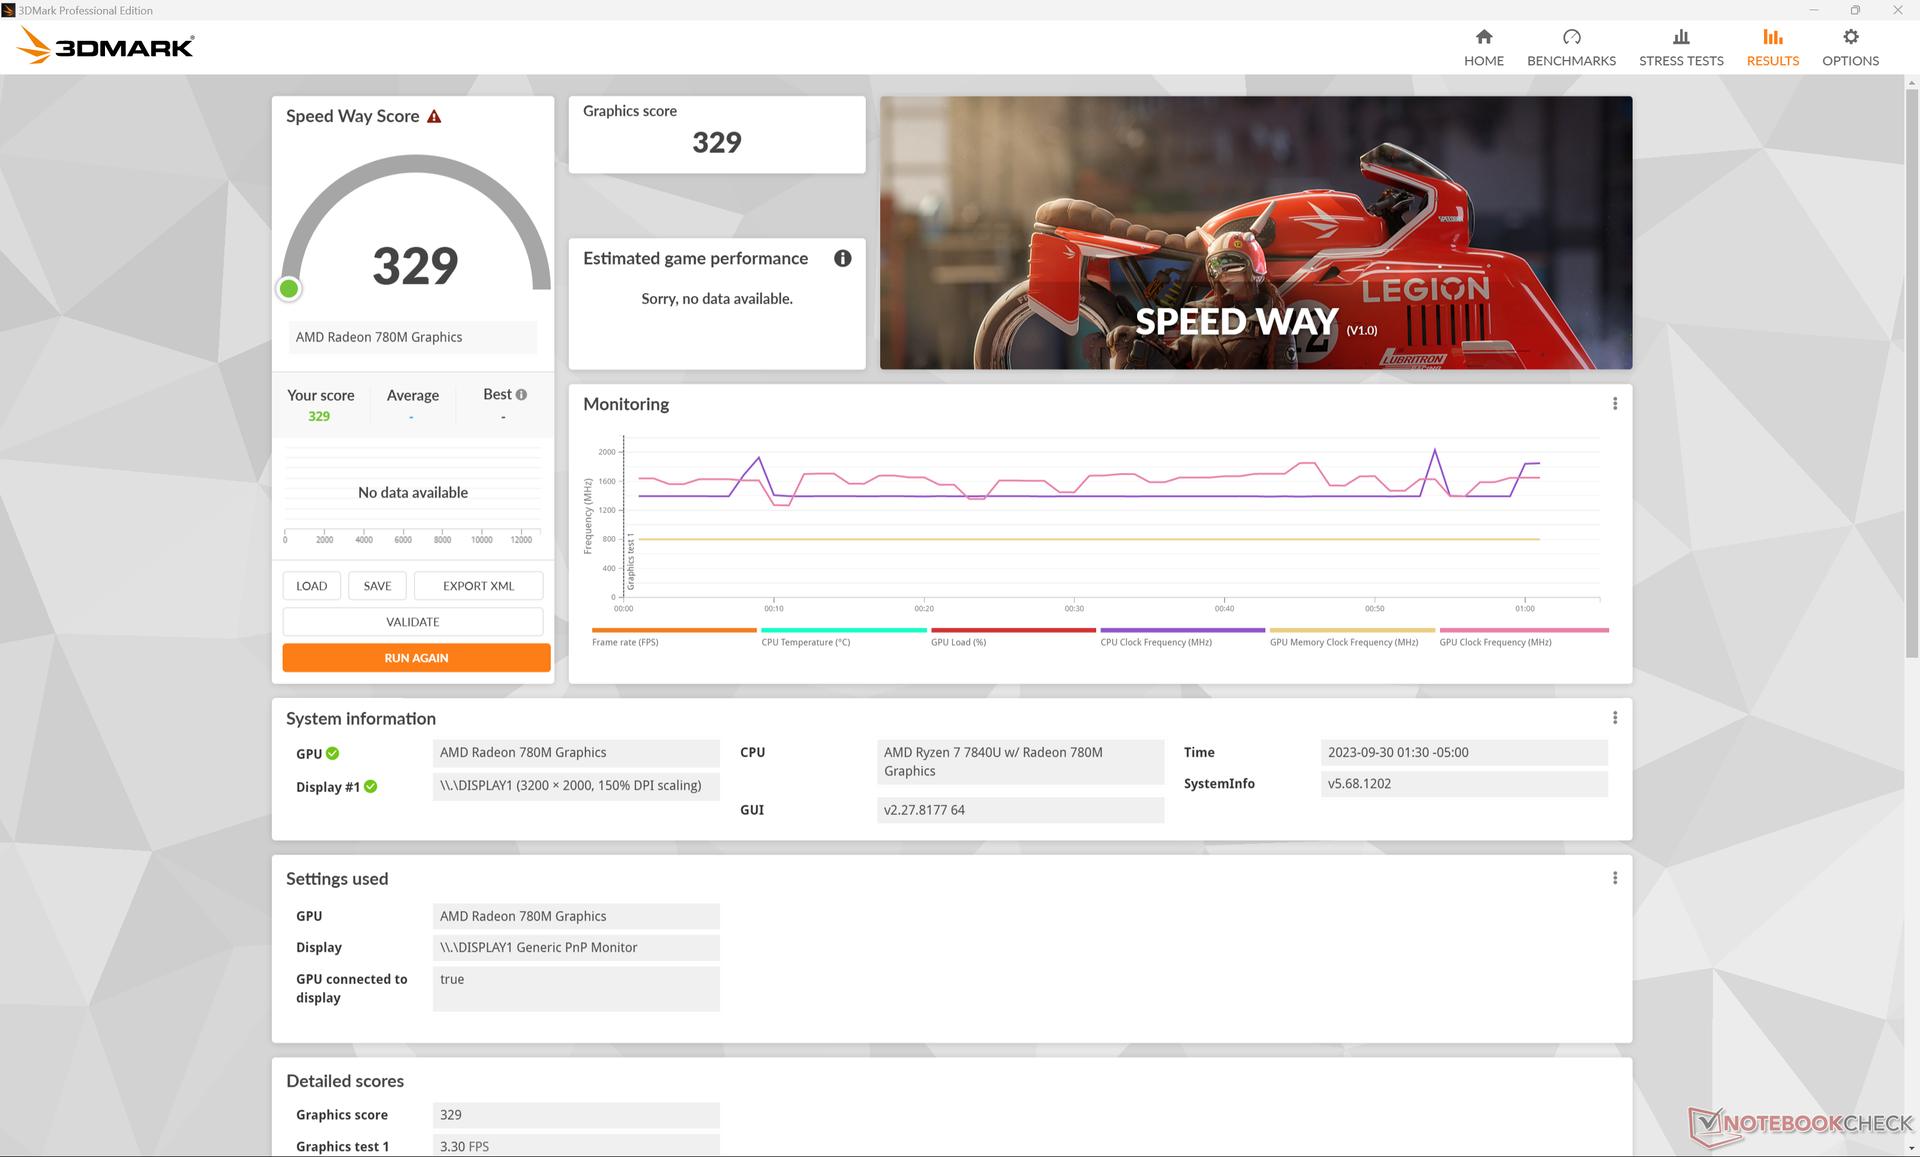
GPU Performance
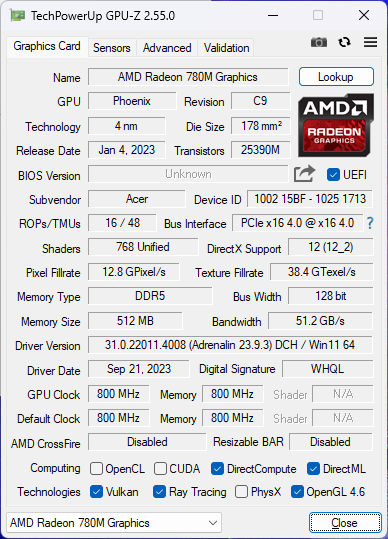
The 2022 Radeon 680M was already a massive boost over the earlier RX Vega series and so the 2023 Radeon 780M is more of a minor refresh with just marginal improvements. In this case, the Radeon 780M in our Acer is just a few percentage points faster than the 680M in the Zen 3+ configuration.
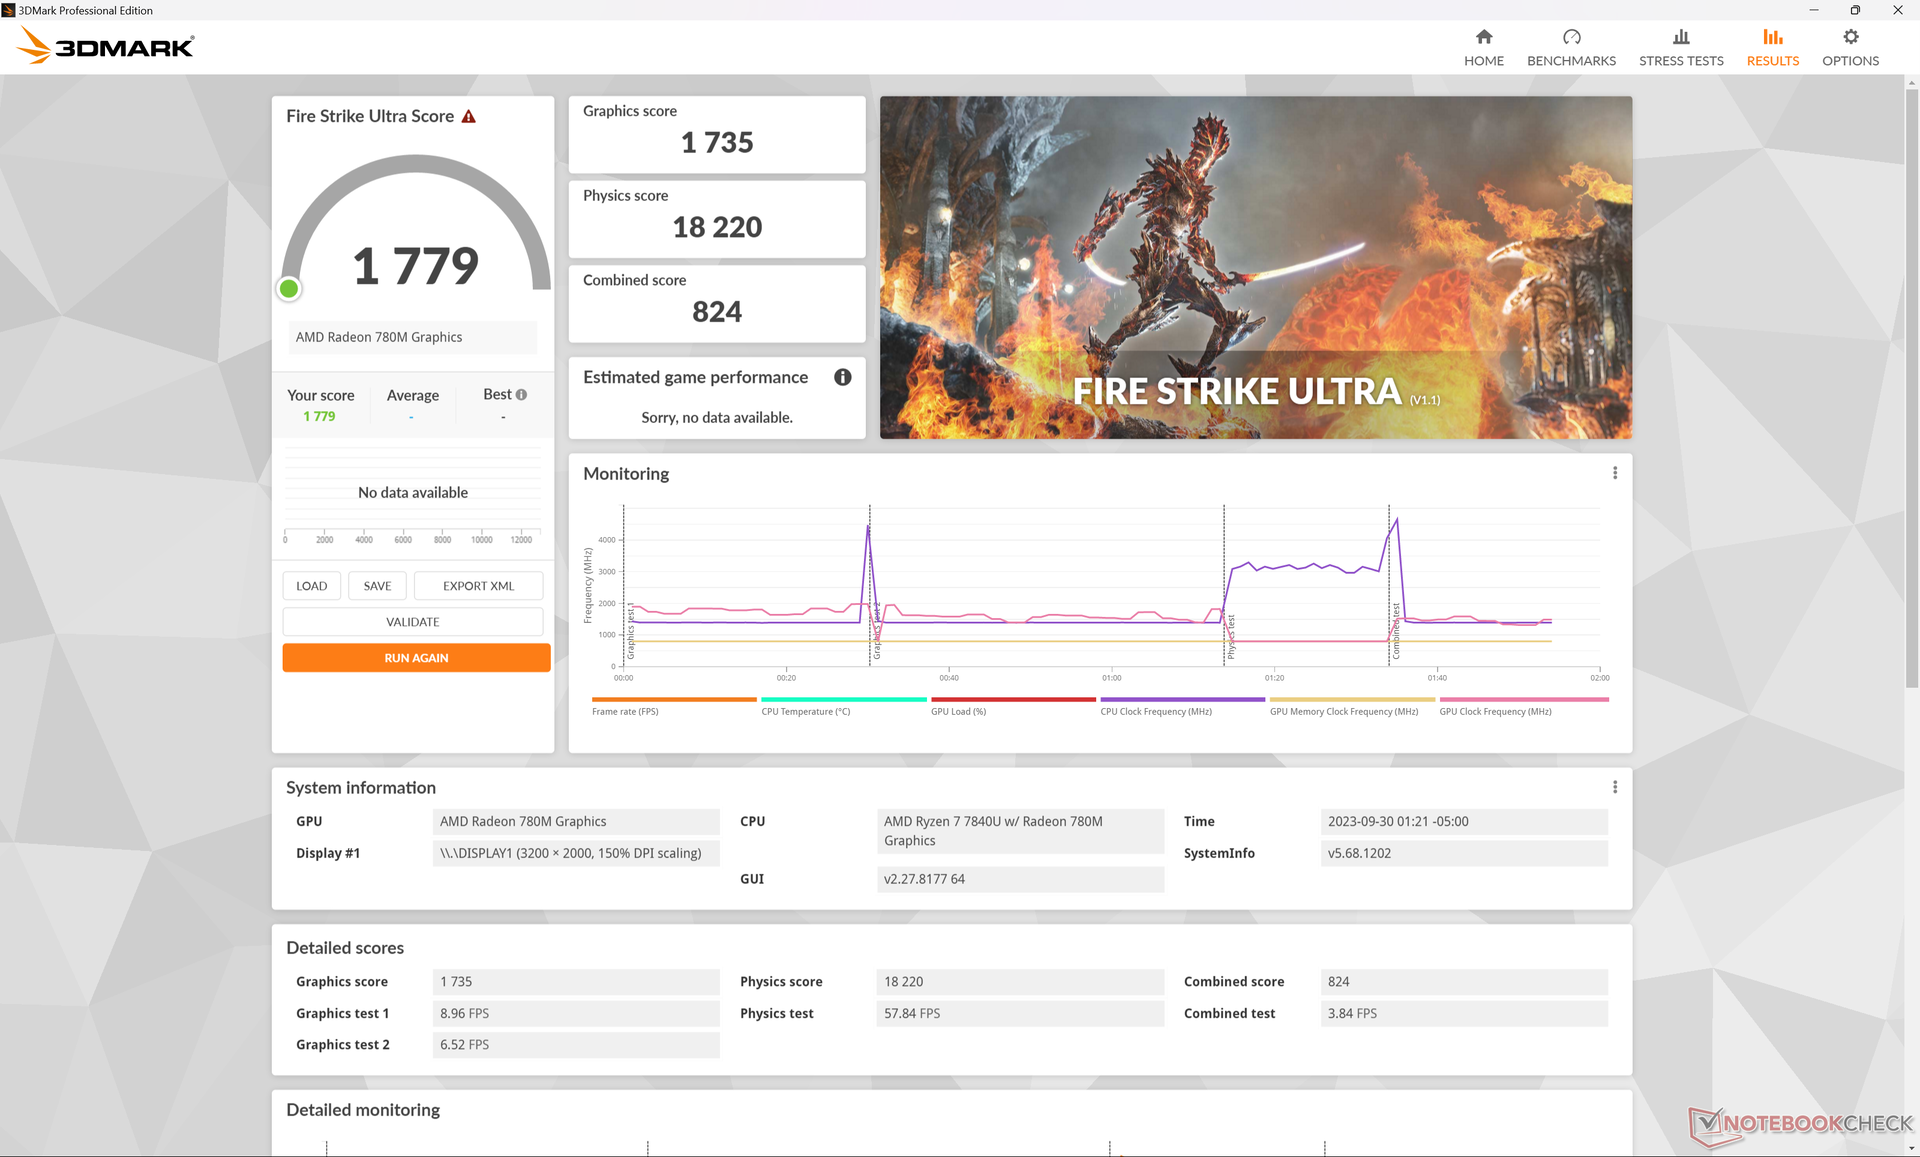
Setting the system to Balanced mode instead of Performance mode or running on battery power will impact overall performance as shown by our Fire Strike results table below.
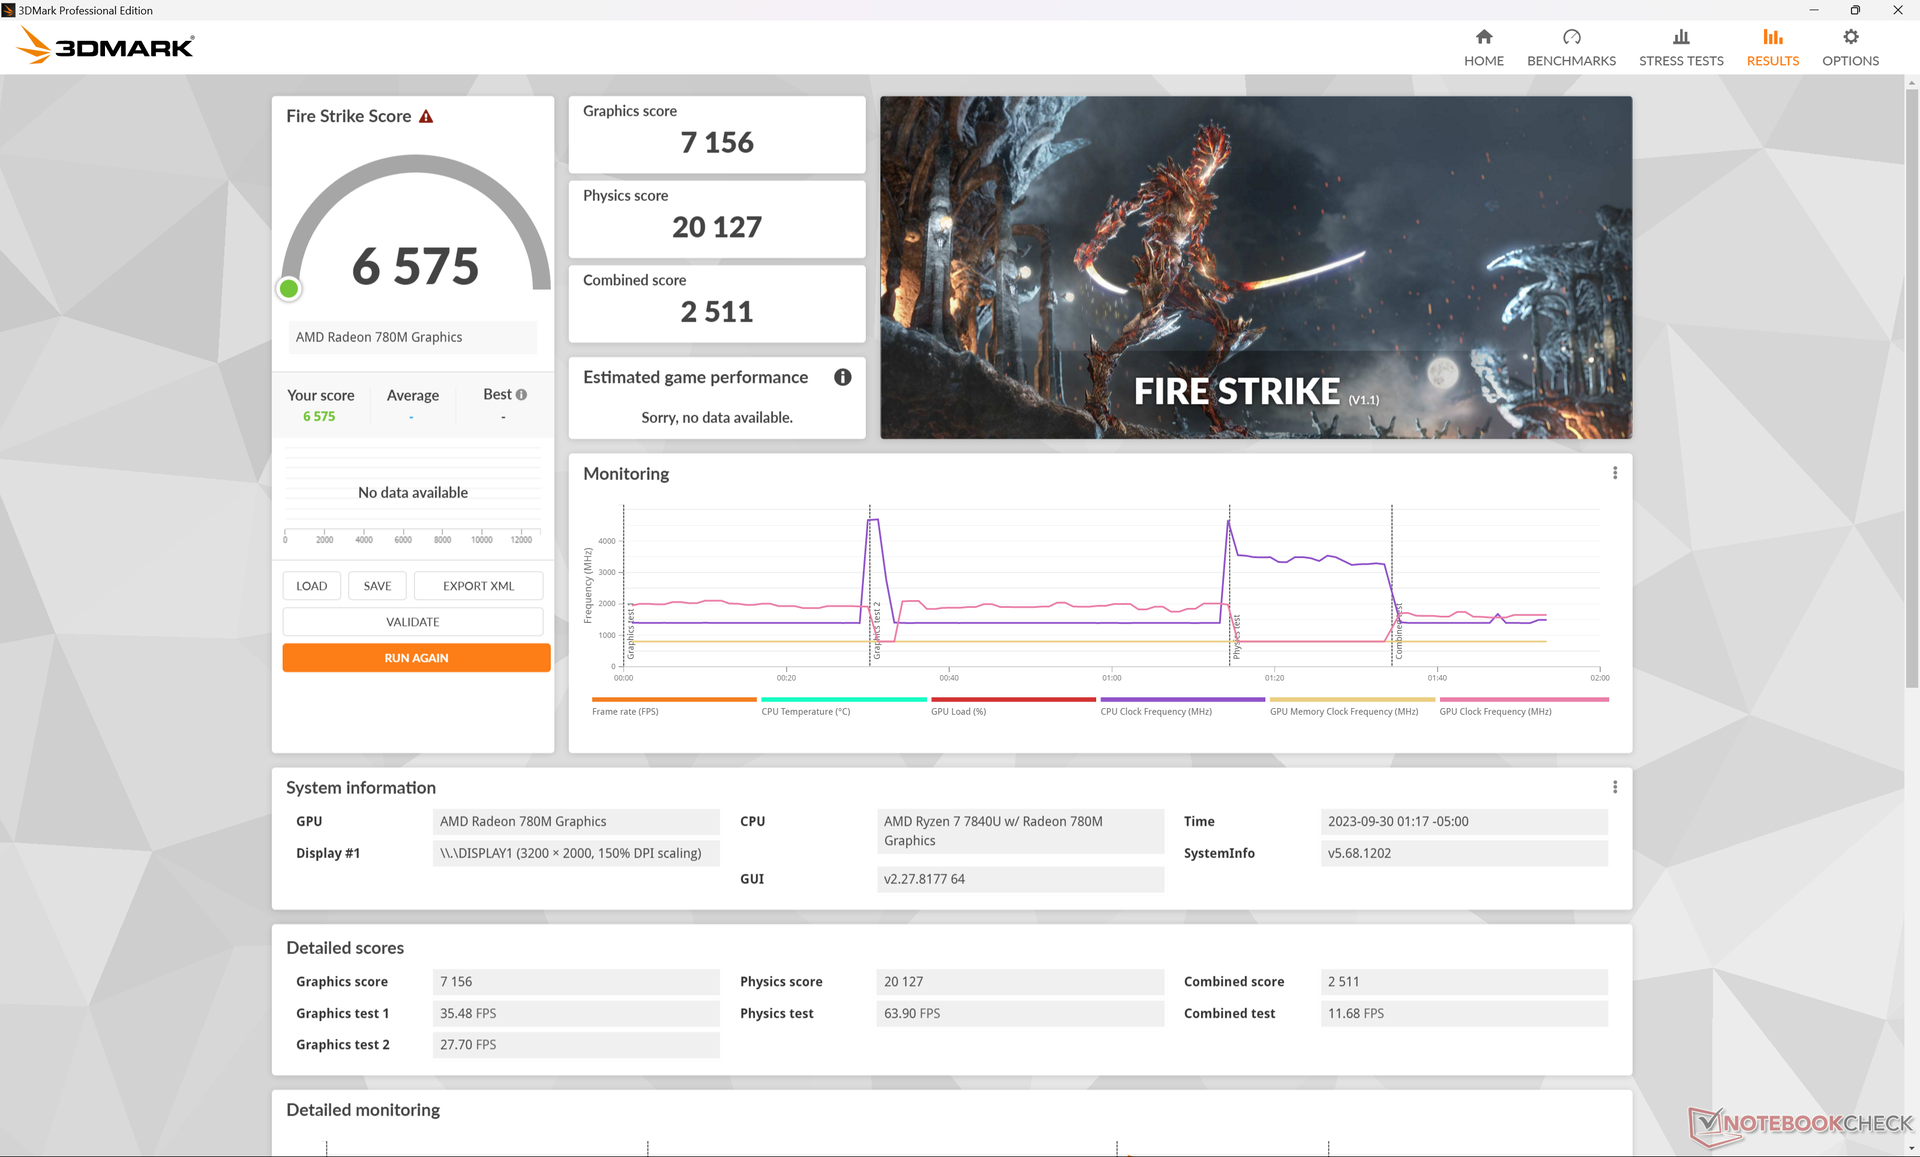
| Power Profile | Graphics Score | Physics Score | Combined Score |
| Performance Mode | 7156 | 20127 | 2511 |
| Balanced Mode | 4682 (-37%) | 15022 (-25%) | 1726 (-31%) |
| Battery Power | 4982 (-33%) | 14856 (-26%) | 1734 (-31%) |
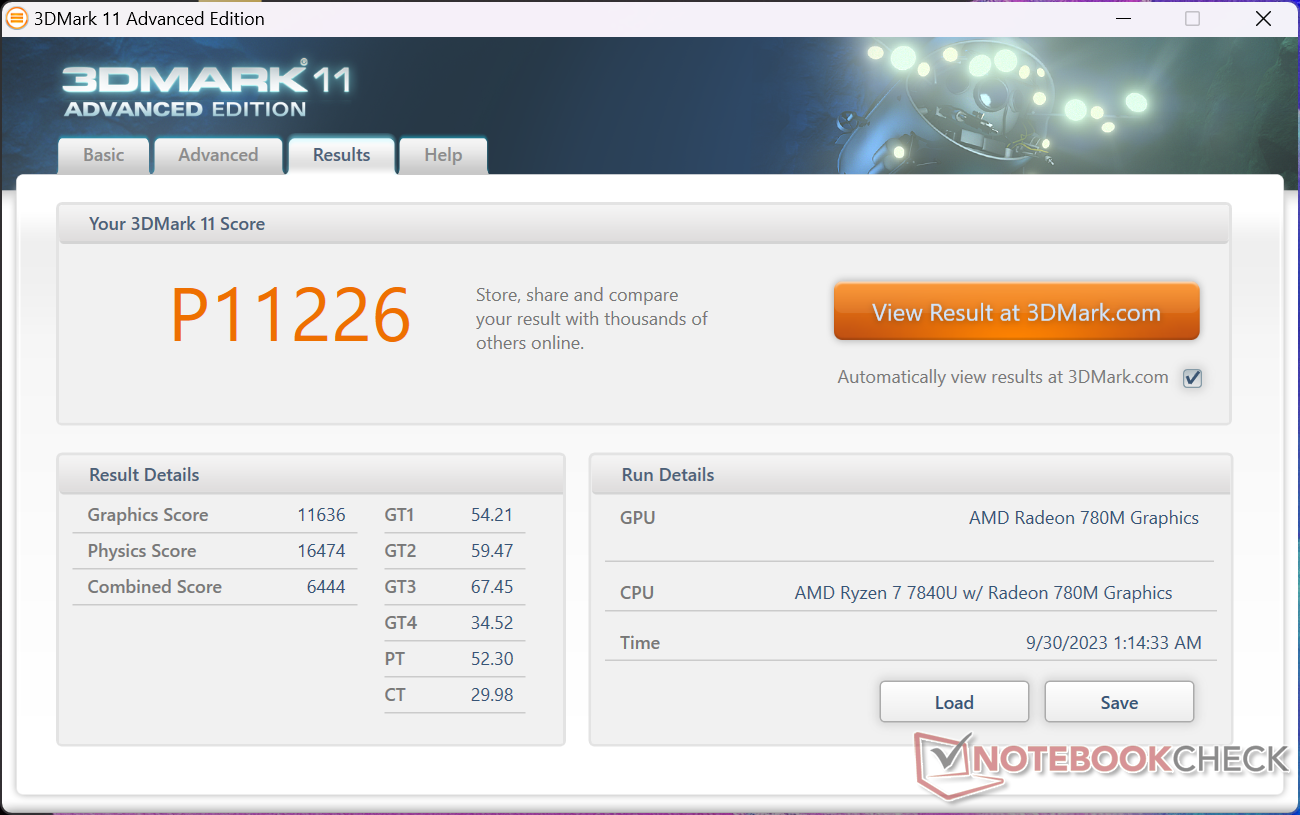
| 3DMark 11 Performance | 11226 points | |
| 3DMark Fire Strike Score | 6575 points | |
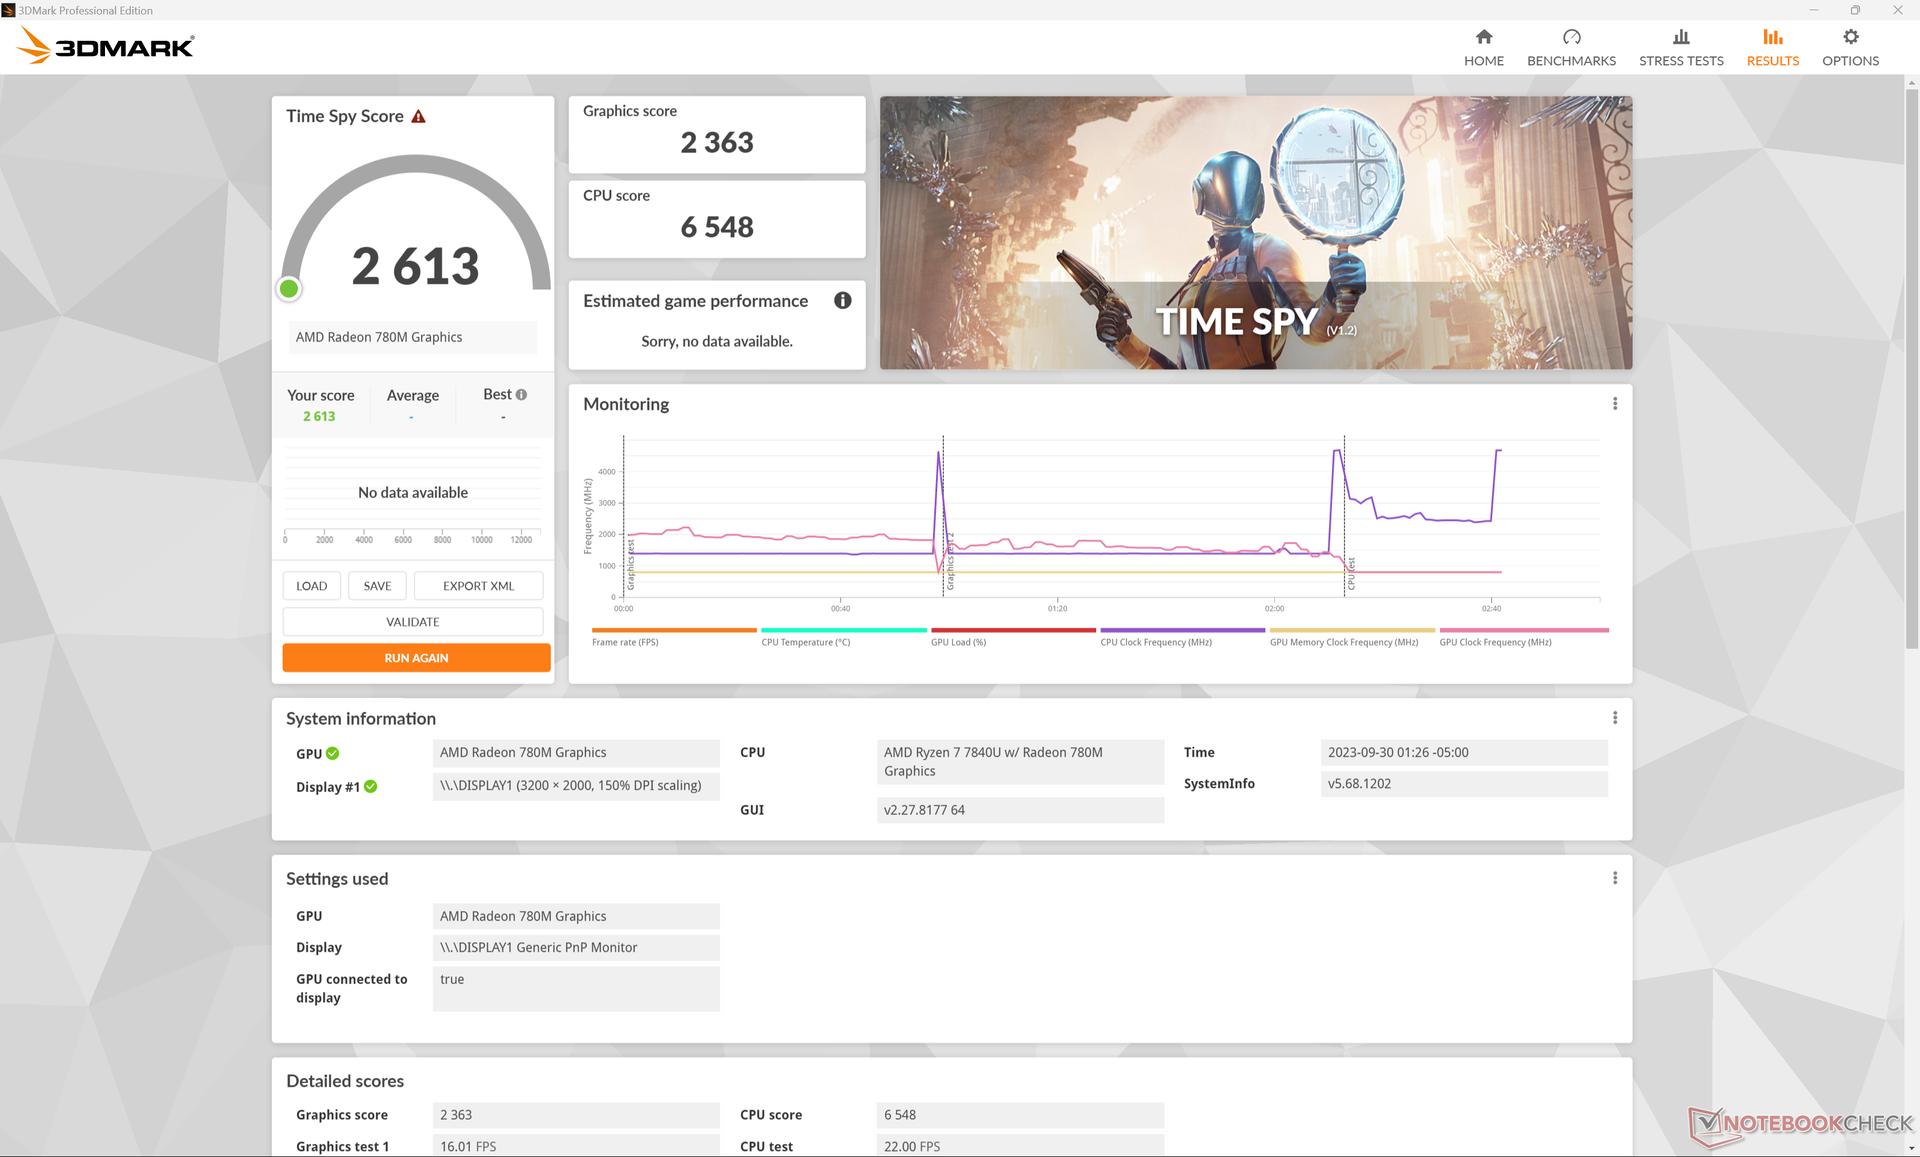
| 3DMark Time Spy Score | 2613 points | |
Help | ||
* ... smaller is better
| Cyberpunk 2077 1.6 | |
| 1280x720 Low Preset | |
| Samsung Galaxy Book3 Ultra 16 | |
| Average AMD Radeon 780M (43.1 - 88.6, n=5) | |
| Acer Swift Edge SFE16 Ryzen 7 7840U | |
| 1920x1080 Low Preset | |
| Lenovo Slim Pro 9i 16IRP8 | |
| Samsung Galaxy Book3 Ultra 16 | |
| Average AMD Radeon 780M (22 - 53.3, n=10) | |
| Acer Swift Edge SFE16 Ryzen 7 7840U | |
| 1920x1080 Medium Preset | |
| Lenovo Slim Pro 9i 16IRP8 | |
| Samsung Galaxy Book3 Ultra 16 | |
| Average AMD Radeon 780M (16 - 42, n=10) | |
| Acer Swift Edge SFE16 Ryzen 7 7840U | |
| 1920x1080 High Preset | |
| Lenovo Slim Pro 9i 16IRP8 | |
| Samsung Galaxy Book3 Ultra 16 | |
| Average AMD Radeon 780M (12 - 30.5, n=10) | |
| Acer Swift Edge SFE16 Ryzen 7 7840U | |
| 1920x1080 Ultra Preset | |
| Lenovo Slim Pro 9i 16IRP8 | |
| Samsung Galaxy Book3 Ultra 16 | |
| Average AMD Radeon 780M (15.9 - 25.2, n=6) | |
| Acer Swift Edge SFE16 Ryzen 7 7840U | |
GPU performance would also throttle over time similar to what we observed when running the CineBench R15 xT loop test above. When idling on Witcher 3, for example, frame rates would start high at 45 FPS before eventually slowing and stabilizing in the low 30 FPS range.
Witcher 3 FPS Chart
| low | med. | high | ultra | |
| GTA V (2015) | 139.3 | 53.9 | 21 | |
| The Witcher 3 (2015) | 109.8 | 36.1 | 20.4 | |
| Dota 2 Reborn (2015) | 128.1 | 101.5 | 66.8 | 61.4 |
| Final Fantasy XV Benchmark (2018) | 50.5 | 27.4 | 21.2 | |
| X-Plane 11.11 (2018) | 49.1 | 37 | 30.3 | |
| Far Cry 5 (2018) | 53 | 28 | 26 | 24 |
| Strange Brigade (2018) | 139.8 | 60.6 | 49.5 | 41.3 |
| Cyberpunk 2077 1.6 (2022) | 26.7 | 20.8 | 17.3 | 15.9 |
| Tiny Tina's Wonderlands (2022) | 34.3 | 28.4 | 18.6 | 16.5 |
| F1 22 (2022) | 65.4 | 62.1 | 42.6 | 9.92 |
Emissions
System Noise
Fan noise has not really changed from the Zen 3+ configuration even though the number of fans has changed. This is unfortunate as the fan in our Zen 3+ test unit would pulse frequently and loudly as soon as heavier loads are introduced and our Zen 4 unit would be no different. Fan noise regularly hovers around 28 dB(A) against a silent background of 24 dB(A) when web browsing or streaming while heavier loads would stabilize at 41 dB(A) similar to before.
Noise Level
| Idle |
| 24.1 / 24.3 / 28 dB(A) |
| Load |
| 41 / 40.9 dB(A) |
 | ||
30 dB silent 40 dB(A) audible 50 dB(A) loud |
||
min: | ||
| Acer Swift Edge SFE16 Ryzen 7 7840U Radeon 780M, R7 7840U, SK hynix HFS512GEJ9X125N | Acer Swift Edge SFE16-42-R1GM Radeon 680M, R7 7735U, Micron 3400 1TB MTFDKBA1T0TFH | Lenovo Slim Pro 9i 16IRP8 NVIDIA GeForce RTX 4050 Laptop GPU, i9-13905H, Samsung PM9A1 MZVL21T0HCLR | Asus VivoBook Pro 16 GeForce RTX 3050 Ti Laptop GPU, i7-12700H, Intel SSD 670p SSDPEKNU010TZ | Samsung Galaxy Book3 Ultra 16 NVIDIA GeForce RTX 4050 Laptop GPU, i7-13700H, Samsung PM9A1 MZVL2512HCJQ | Huawei MateBook 16s i7 Iris Xe G7 96EUs, i7-12700H, Silicon Motion PCIe-8 SSD | |
|---|---|---|---|---|---|---|
| Noise | -7% | -1% | -15% | -3% | 4% | |
| off / environment * | 23.4 | 25.7 -10% | 22.7 3% | 25.2 -8% | 25 -7% | 24 -3% |
| Idle Minimum * | 24.1 | 25.7 -7% | 22.7 6% | 25.2 -5% | 26 -8% | 24 -0% |
| Idle Average * | 24.3 | 27 -11% | 22.7 7% | 25.2 -4% | 27 -11% | 25.2 -4% |
| Idle Maximum * | 28 | 29.3 -5% | 27.5 2% | 25.2 10% | 28 -0% | 27.2 3% |
| Load Average * | 41 | 42.3 -3% | 28.9 30% | 55.1 -34% | 40 2% | 34.8 15% |
| Witcher 3 ultra * | 40.9 | 52.6 -29% | 39 5% | 34.8 15% | ||
| Load Maximum * | 40.9 | 42.7 -4% | 52.5 -28% | 61.5 -50% | 41 -0% | 39 5% |
* ... smaller is better
Temperature
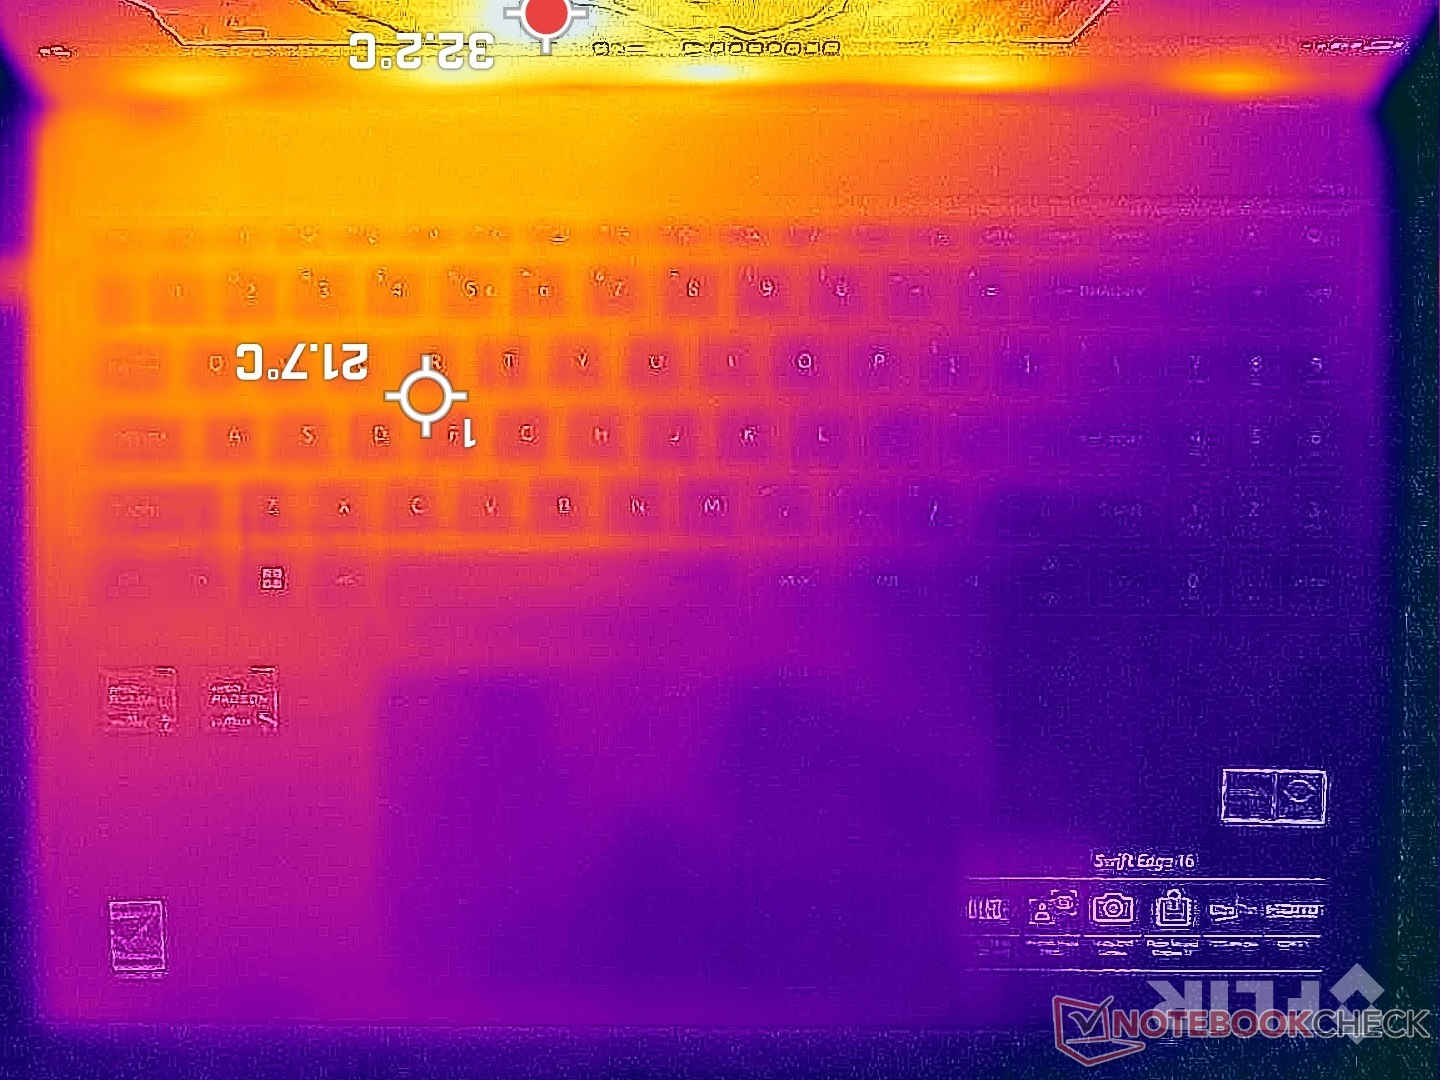
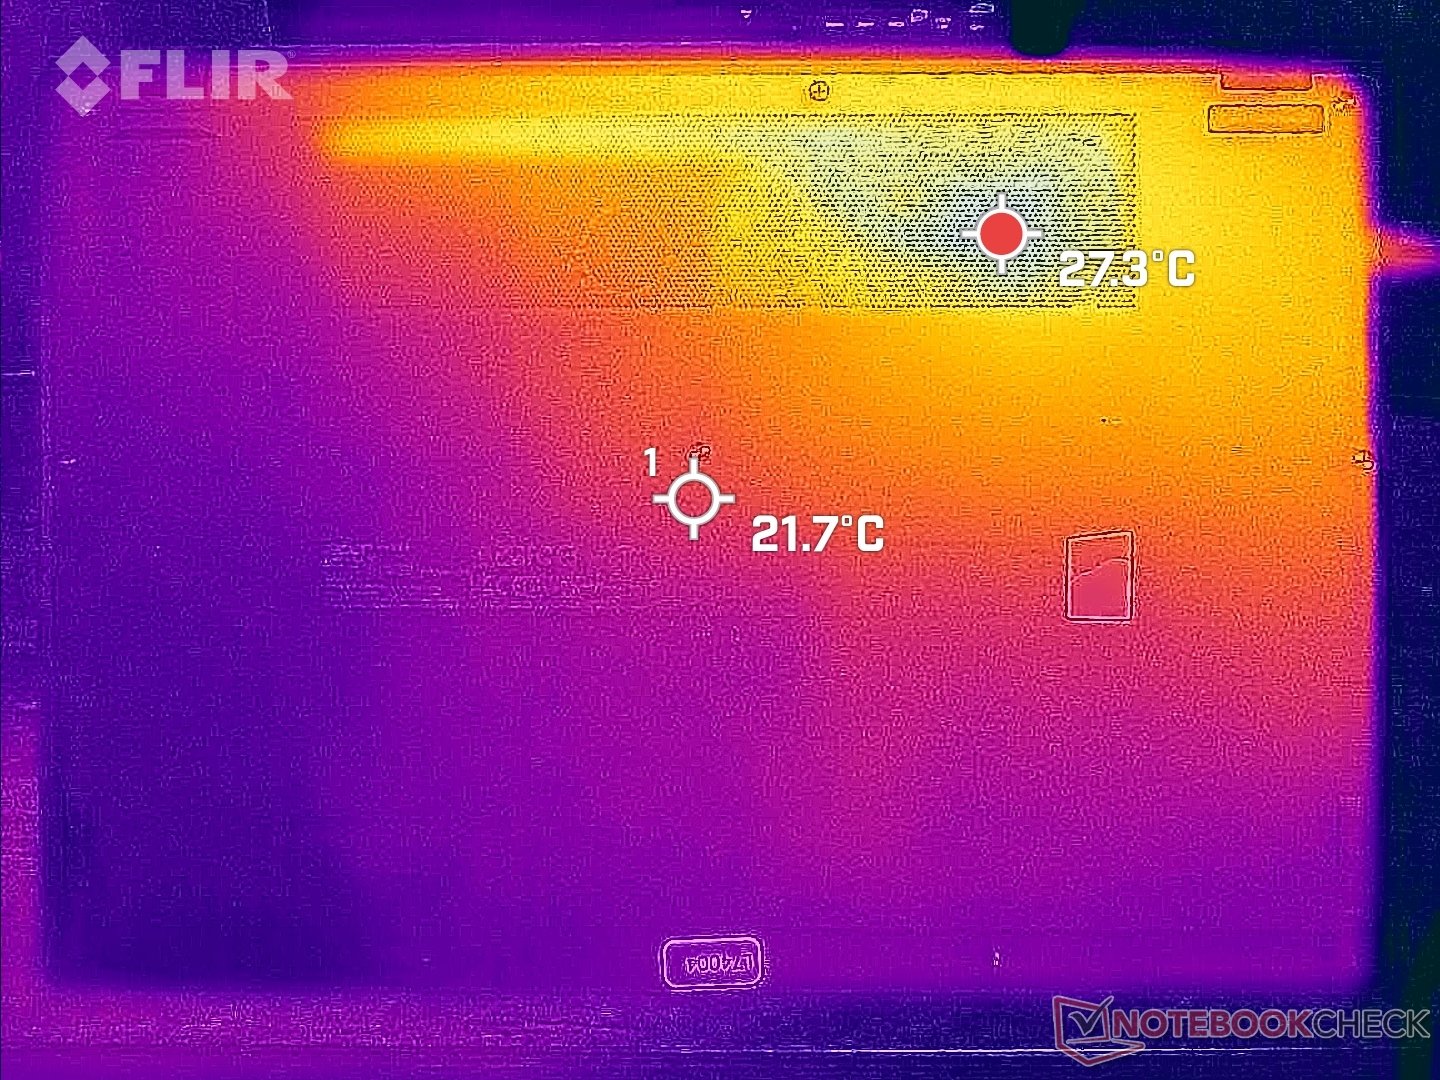
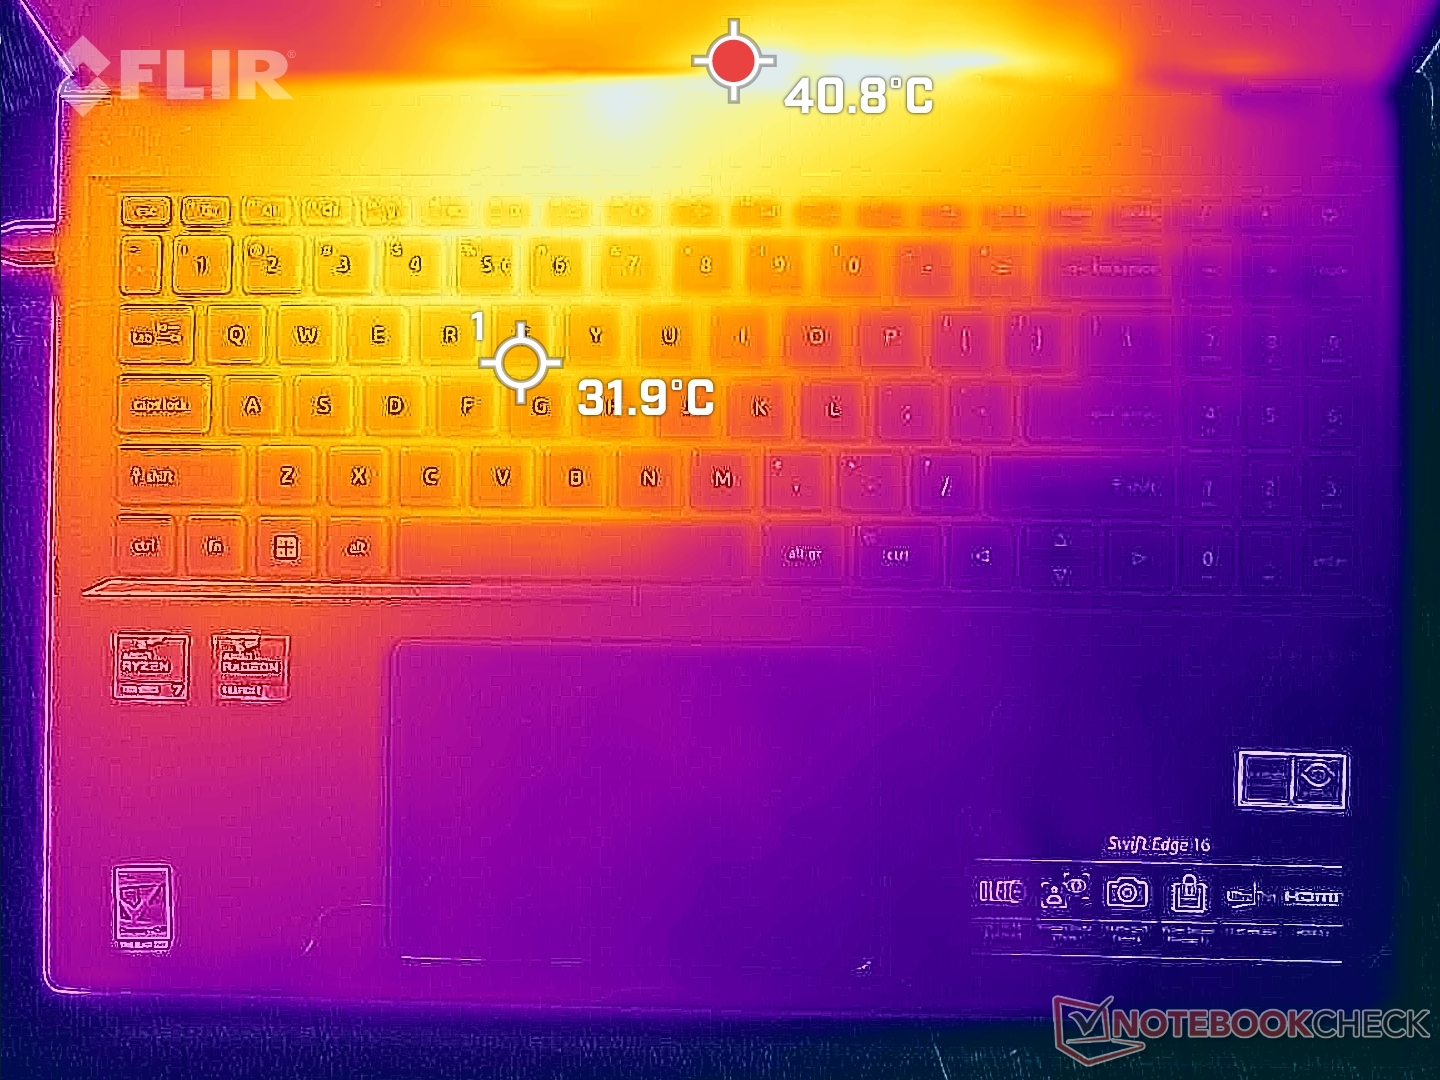
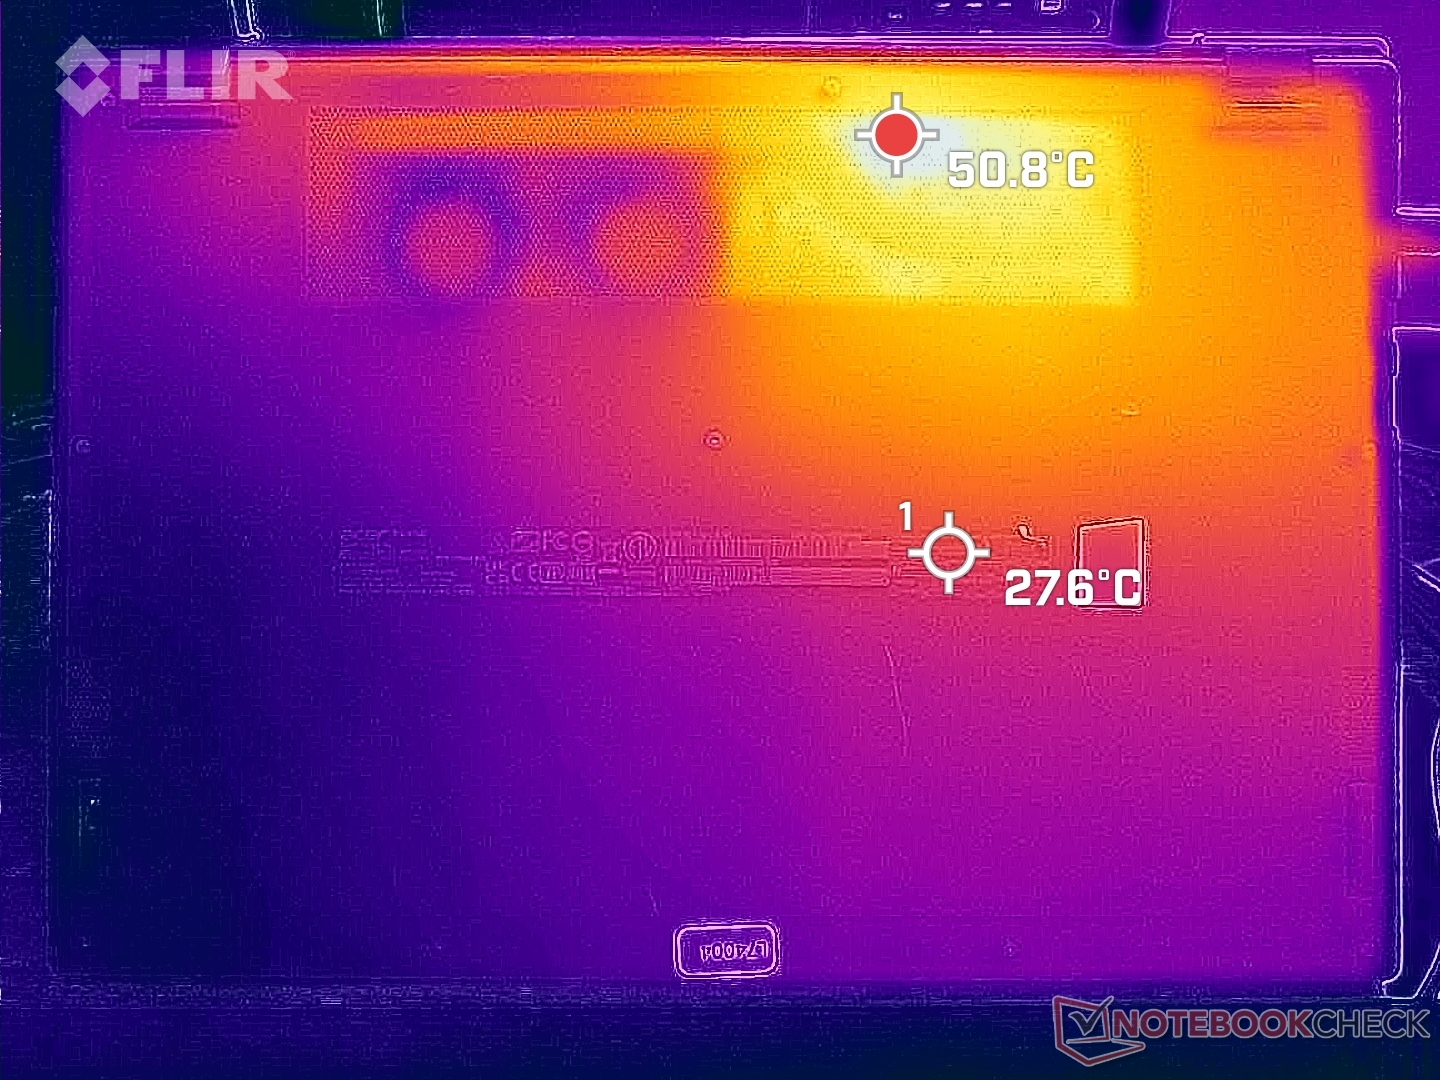
Surface temperatures are not significantly cooler or warmer than we recorded on the Ryzen 7 7735U configuration. Hot spots on the bottom still reach over 50 C near the vents while the top surface near the hinges can range from 40 C to 50 C depending on the angle of the lid. Hands are unlikely to touch these hot areas for long periods when gaming.
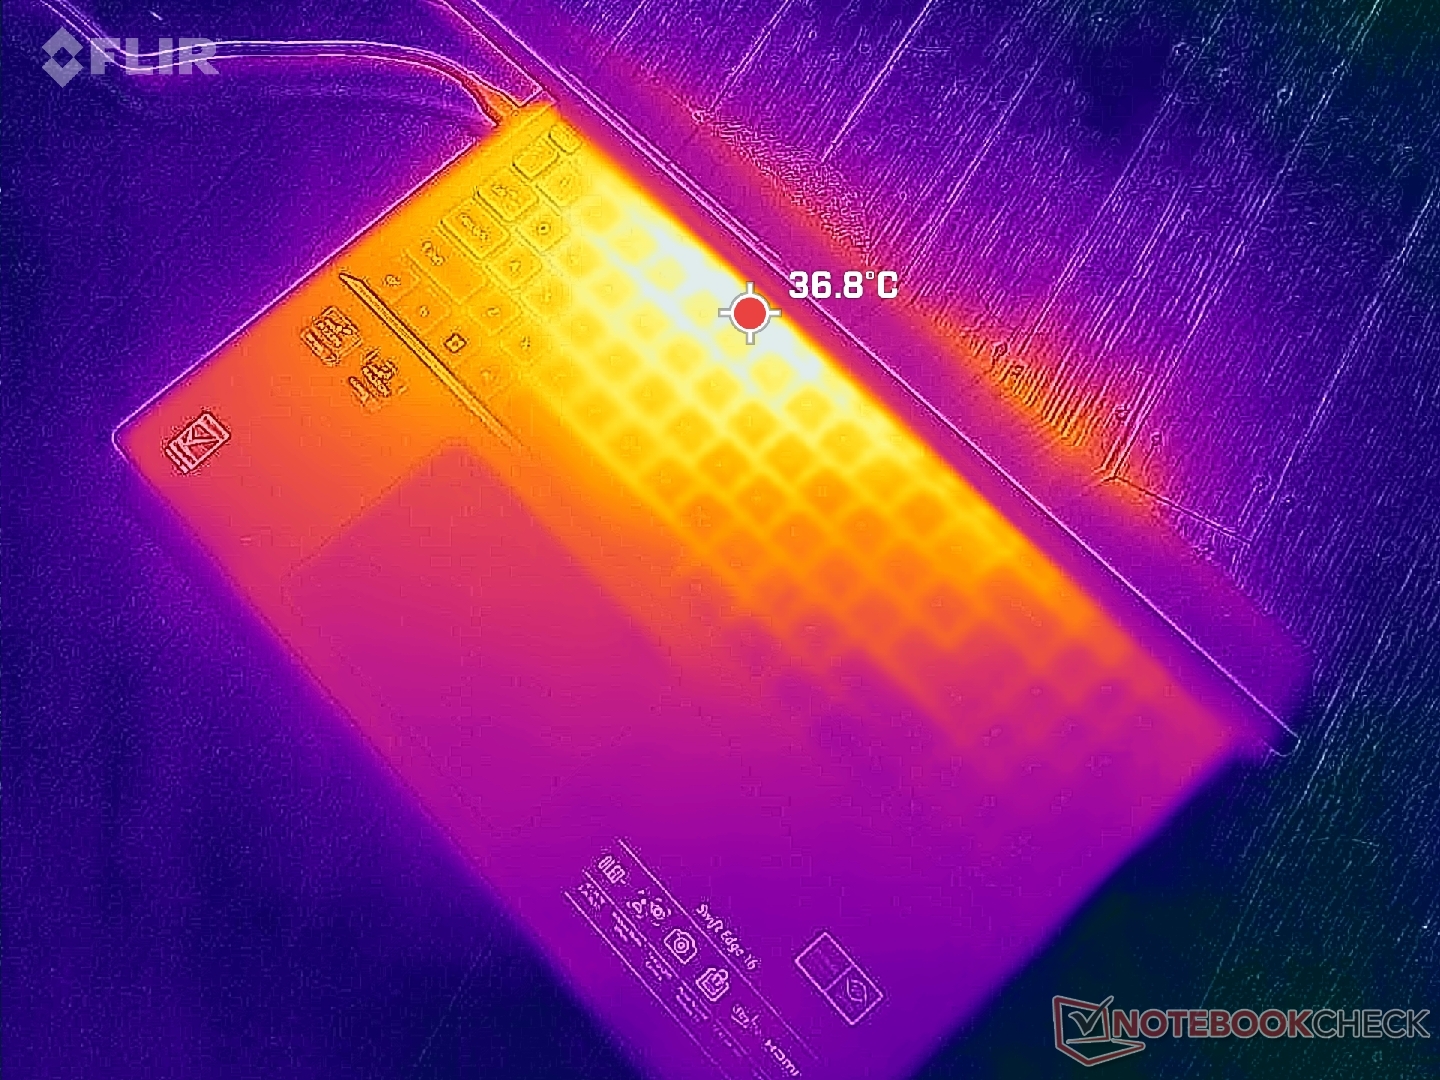
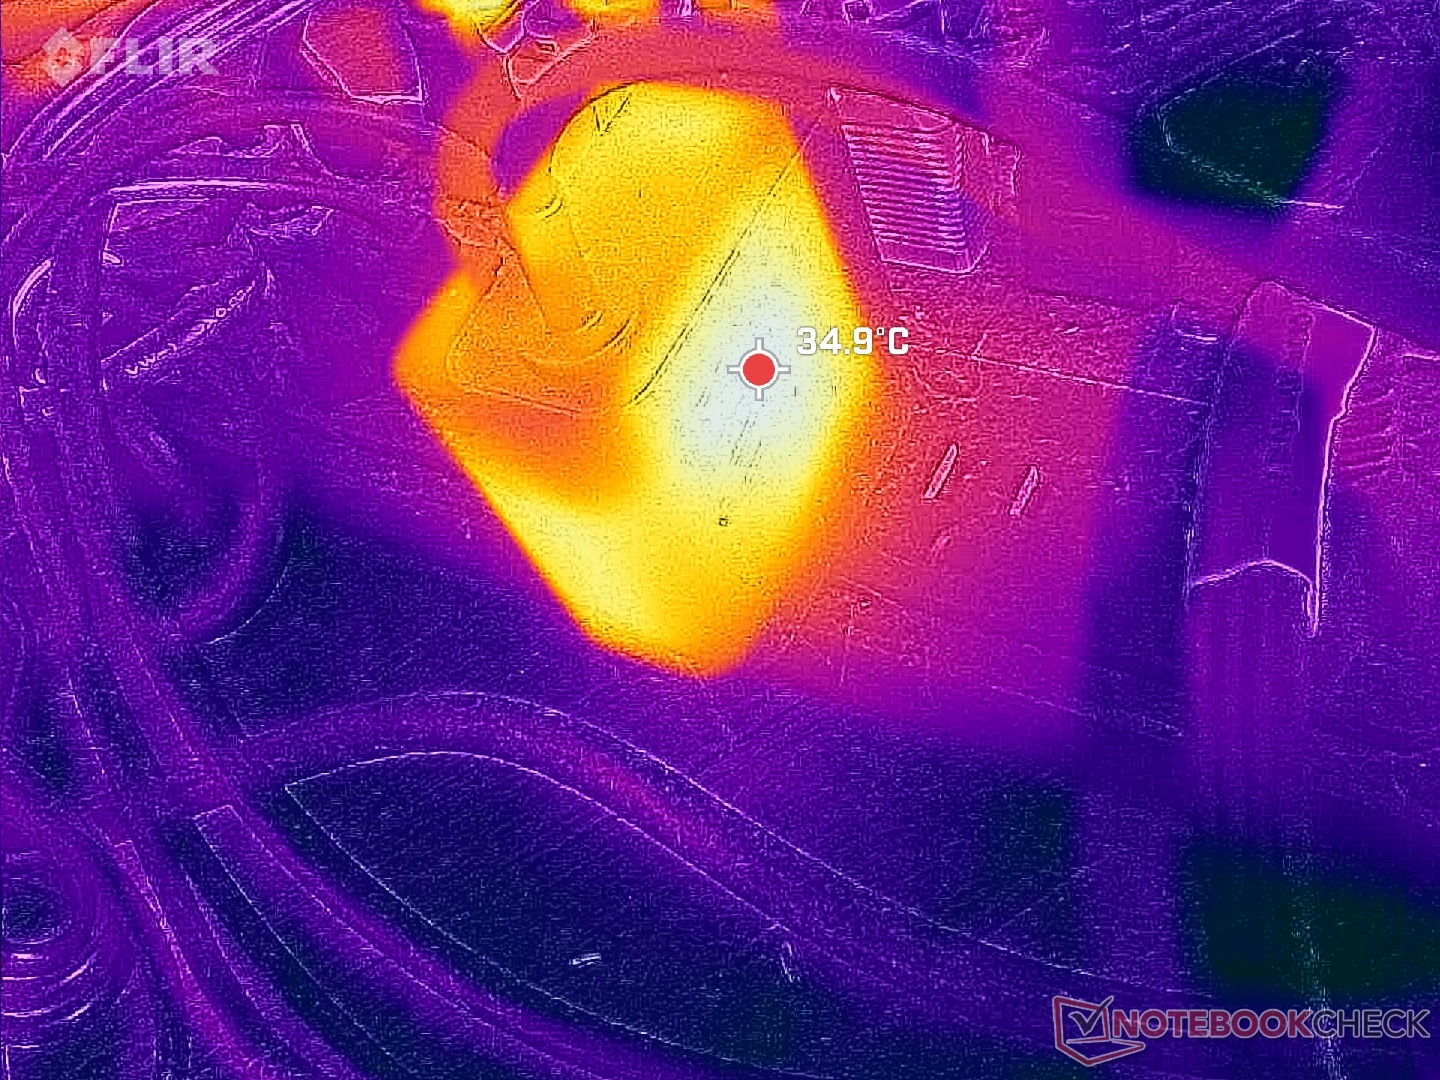
(±) The maximum temperature on the upper side is 41.6 °C / 107 F, compared to the average of 34.2 °C / 94 F, ranging from 21.2 to 62.5 °C for the class Office.
(-) The bottom heats up to a maximum of 46.6 °C / 116 F, compared to the average of 36.7 °C / 98 F
(+) In idle usage, the average temperature for the upper side is 27 °C / 81 F, compared to the device average of 29.5 °C / 85 F.
(+) The palmrests and touchpad are cooler than skin temperature with a maximum of 26.6 °C / 79.9 F and are therefore cool to the touch.
(±) The average temperature of the palmrest area of similar devices was 27.8 °C / 82 F (+1.2 °C / 2.1 F).
| Acer Swift Edge SFE16 Ryzen 7 7840U AMD Ryzen 7 7840U, AMD Radeon 780M | Acer Swift Edge SFE16-42-R1GM AMD Ryzen 7 7735U, AMD Radeon 680M | Lenovo Slim Pro 9i 16IRP8 Intel Core i9-13905H, NVIDIA GeForce RTX 4050 Laptop GPU | Asus VivoBook Pro 16 Intel Core i7-12700H, NVIDIA GeForce RTX 3050 Ti Laptop GPU | Samsung Galaxy Book3 Ultra 16 Intel Core i7-13700H, NVIDIA GeForce RTX 4050 Laptop GPU | Huawei MateBook 16s i7 Intel Core i7-12700H, Intel Iris Xe Graphics G7 96EUs | |
|---|---|---|---|---|---|---|
| Heat | -7% | 3% | -13% | 12% | 1% | |
| Maximum Upper Side * | 41.6 | 49.4 -19% | 37.8 9% | 44.2 -6% | 41 1% | 40.9 2% |
| Maximum Bottom * | 46.6 | 44.7 4% | 44.8 4% | 53 -14% | 44 6% | 48.3 -4% |
| Idle Upper Side * | 30.4 | 34 -12% | 30.6 -1% | 32.1 -6% | 23 24% | 29.2 4% |
| Idle Bottom * | 31 | 31.6 -2% | 31 -0% | 38.4 -24% | 26 16% | 30.4 2% |
* ... smaller is better
Stress Test
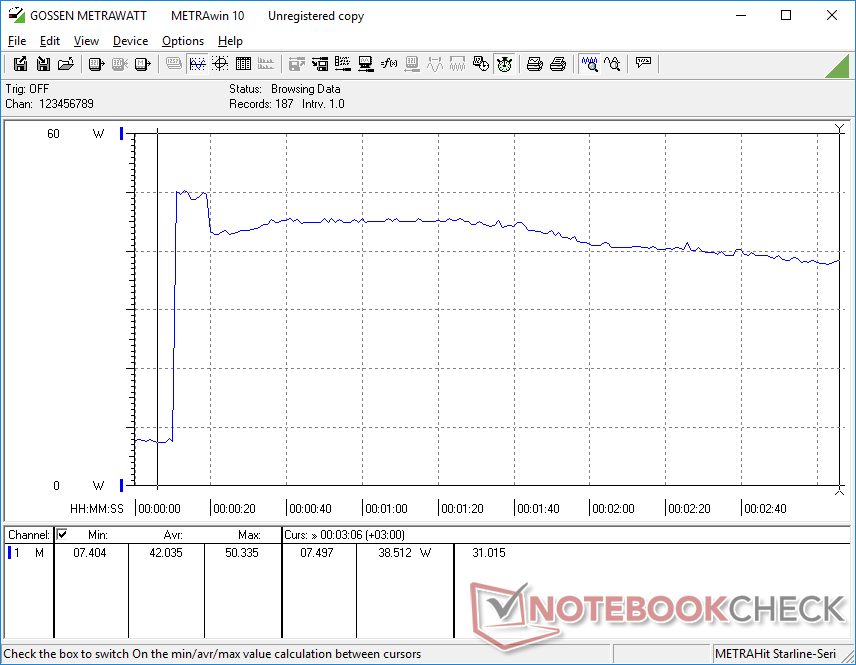
The limited Turbo Core potential of the Acer can be observed when stress testing with benchmarks. Clock rates and board power draw when initiating Prime95 stress would boost to 3.5 GHz and 30 W, respectively, before steadily falling to just 2.3 GHz and 18 W over the next minute. Core temperature would also stabilize at a relatively low 64 C. Repeating this test on the AMD Framework Laptop 13.5 with the same CPU would result in higher values all around at 3.2 GHz, 35 W, and 85 C in comparison.
Core temperature when running Witcher 3 would stabilize at just 56 C or around 15 C cooler than on the Framework mentioned above. It's clear that the system prioritizes lower surface temperatures over higher performance.
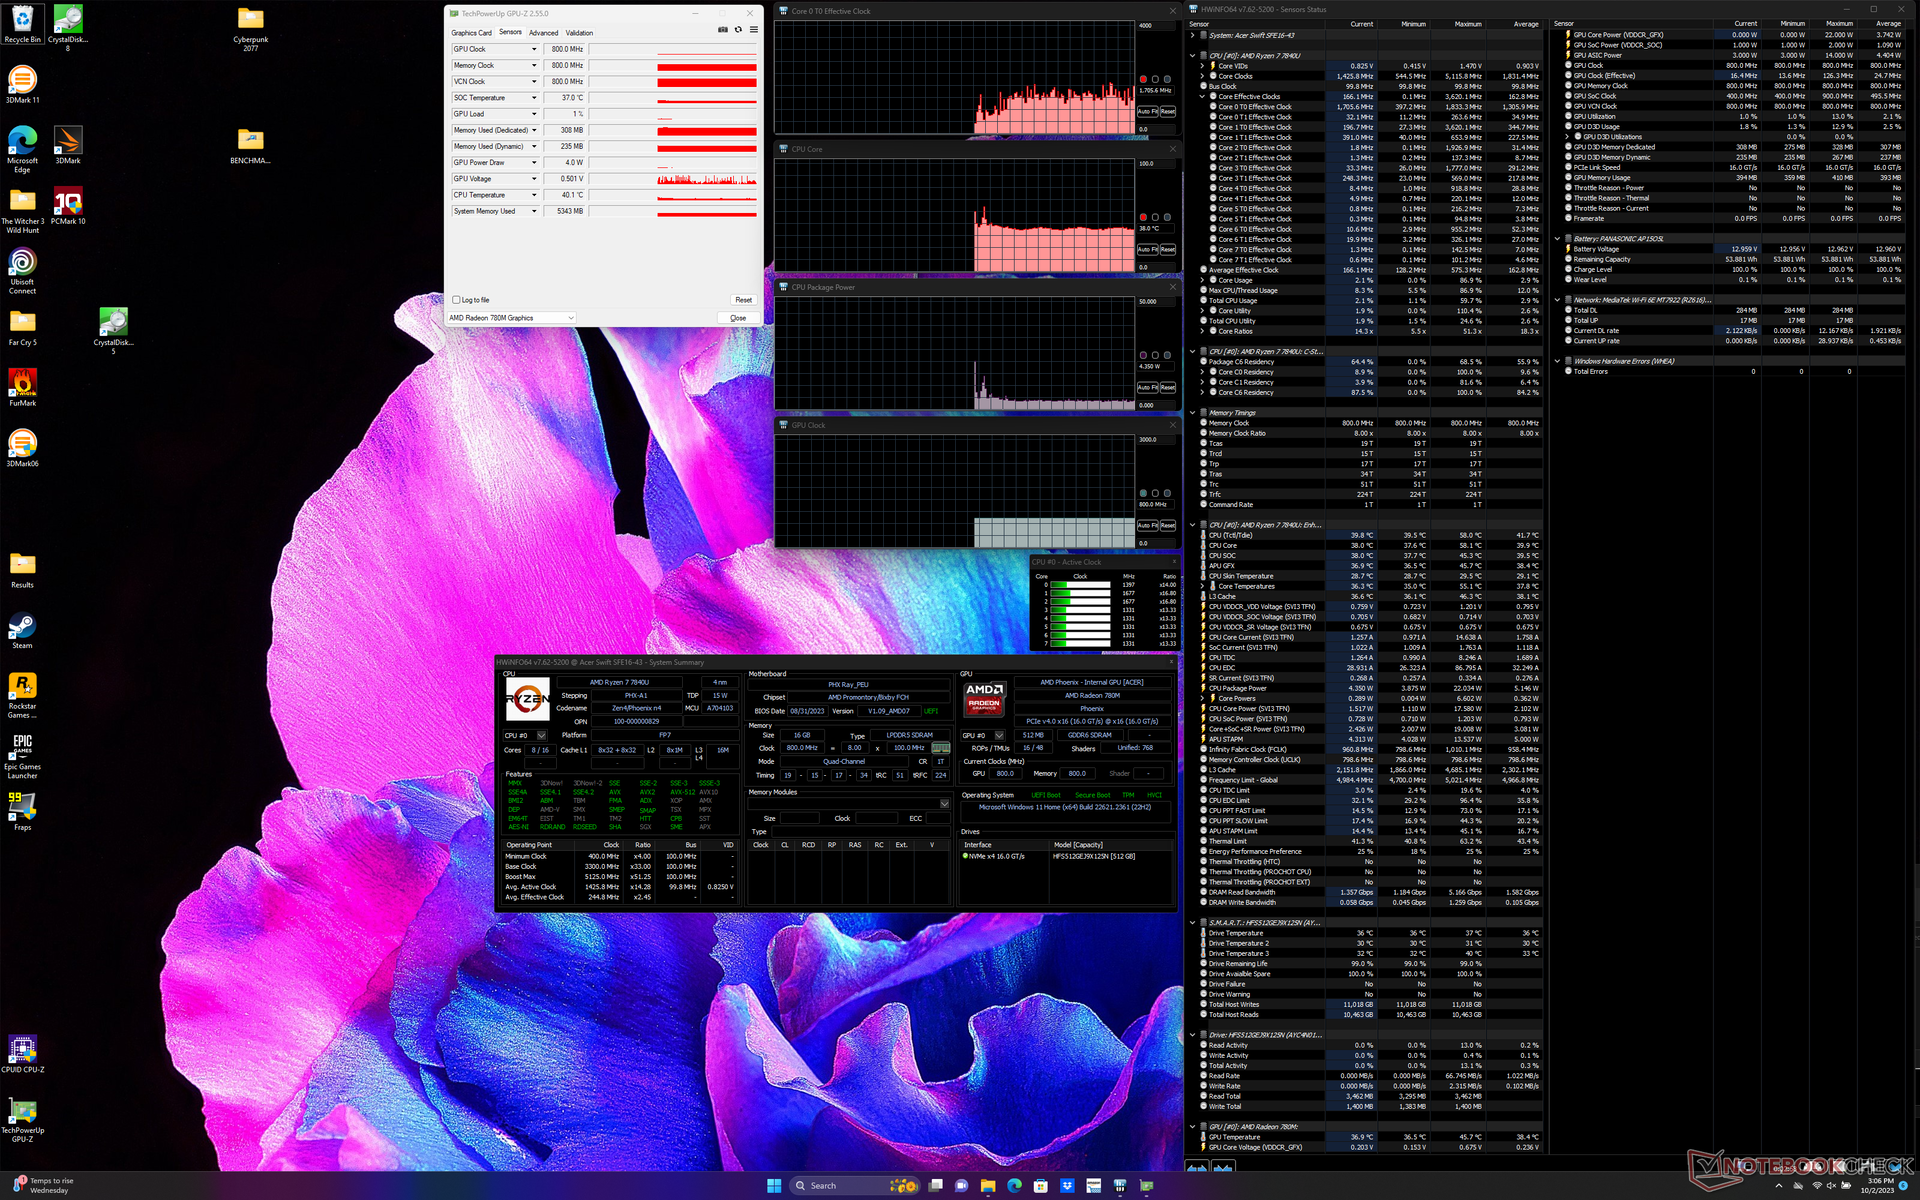
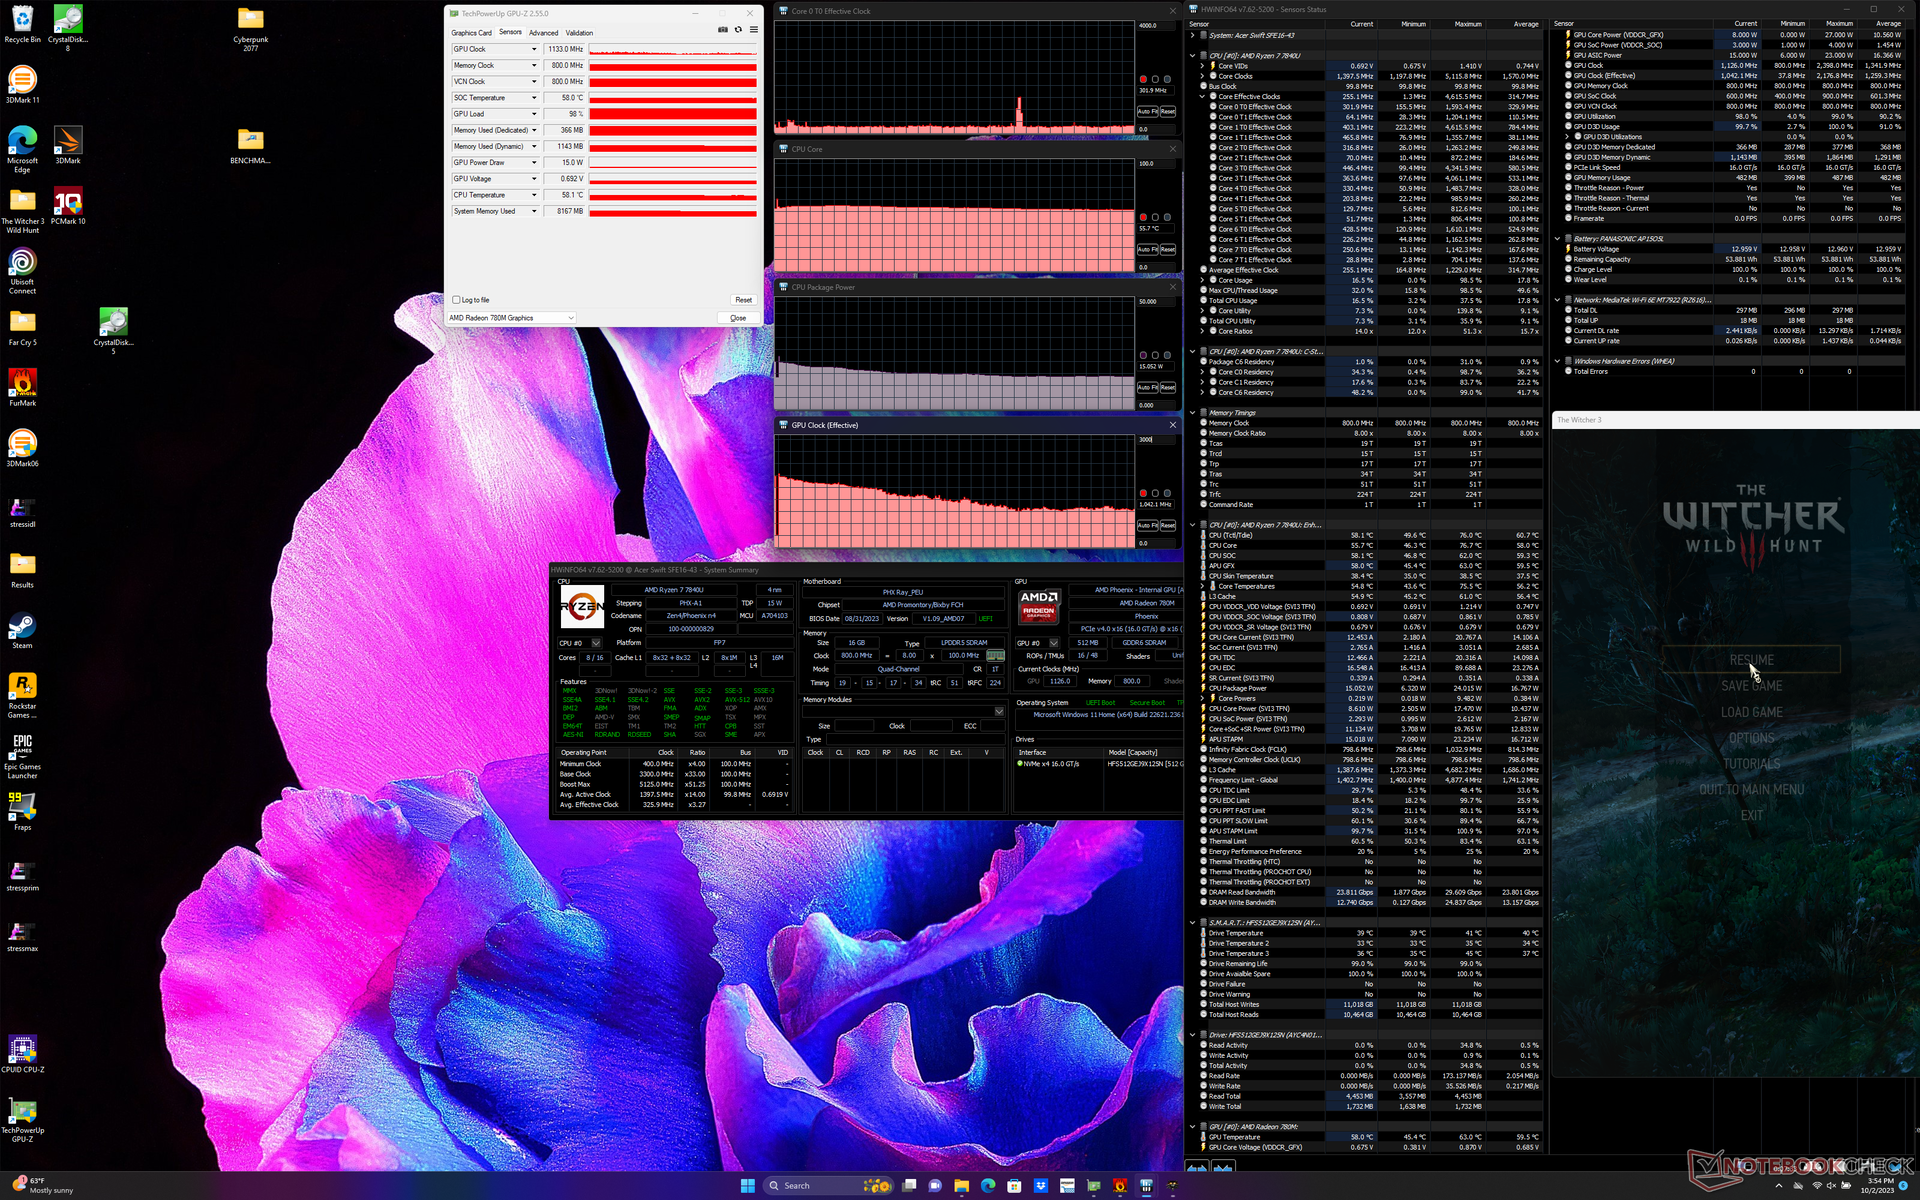
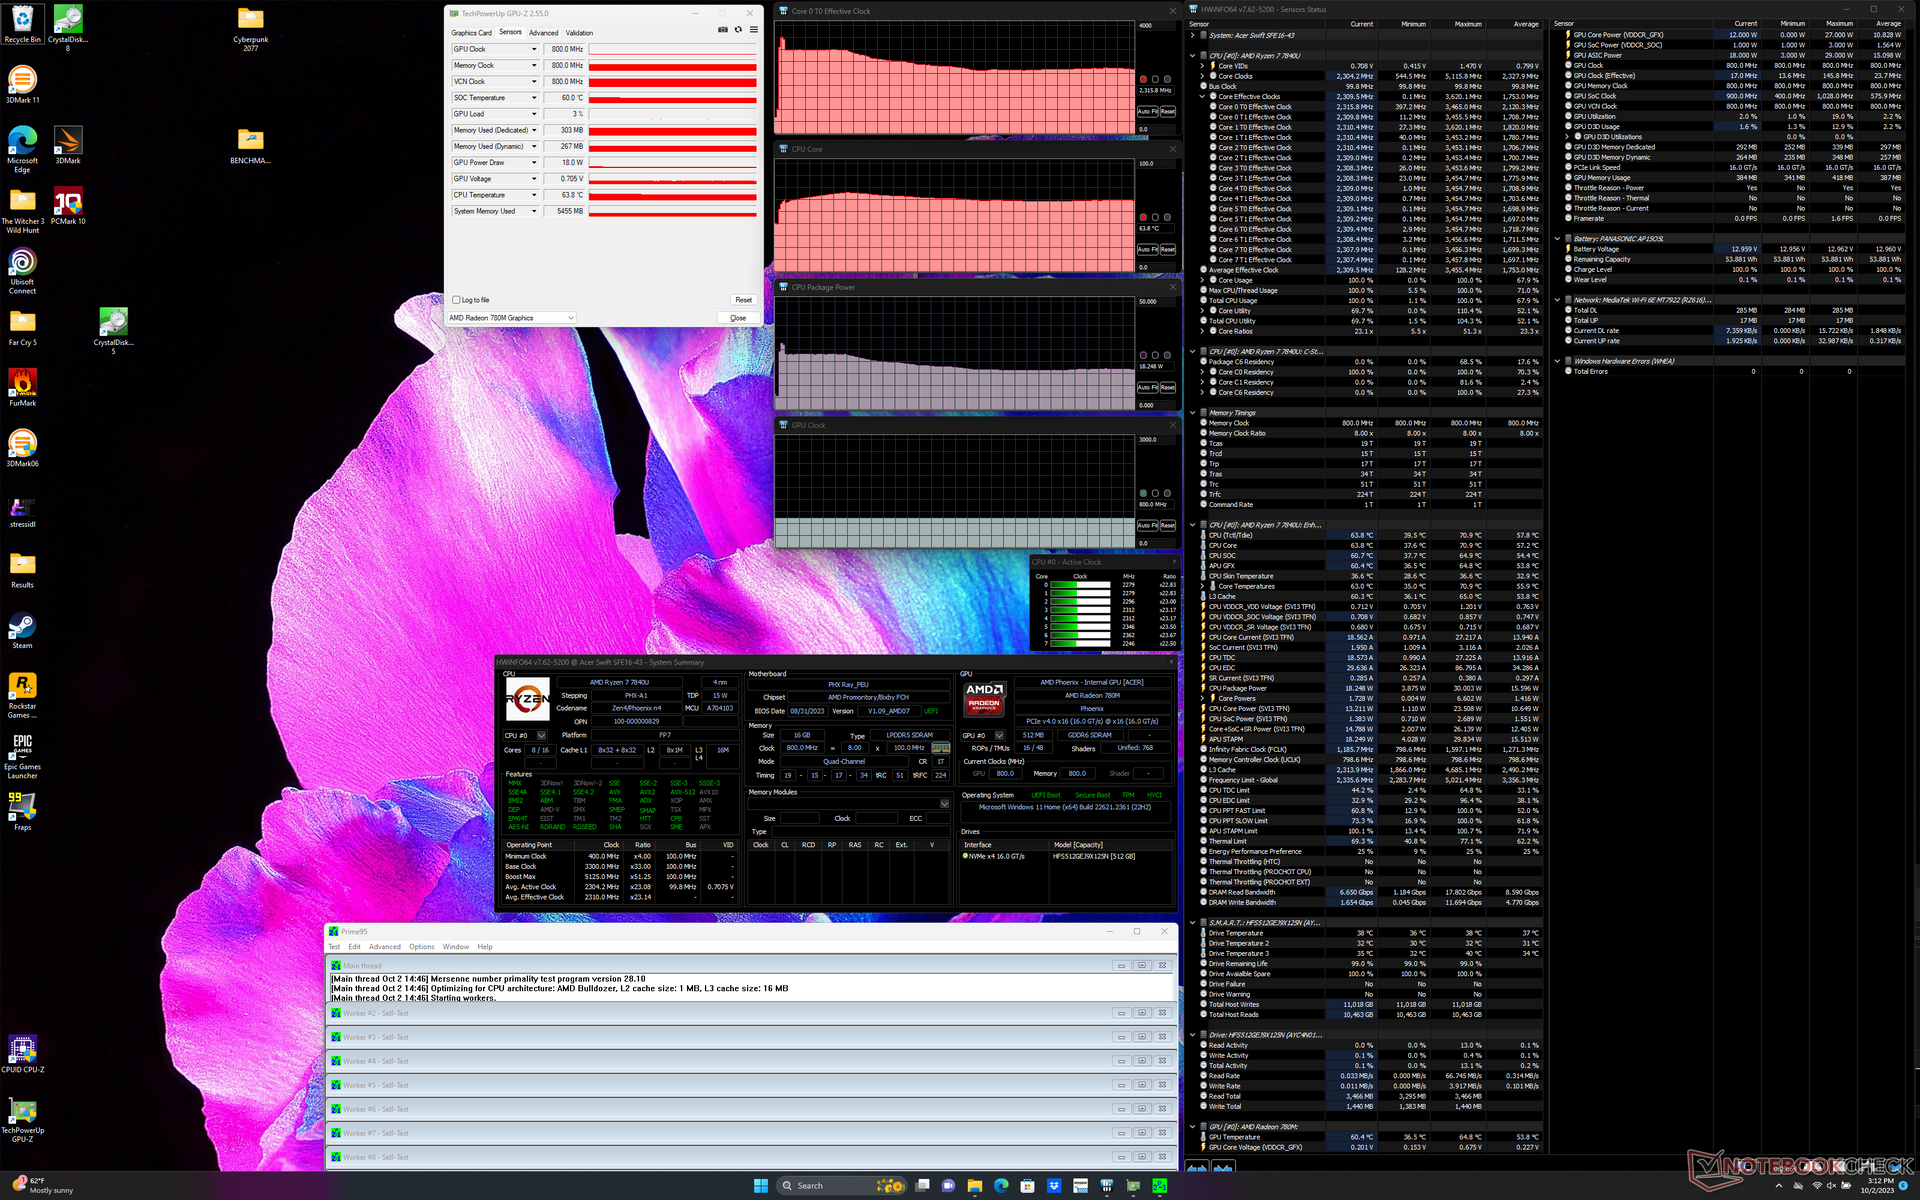
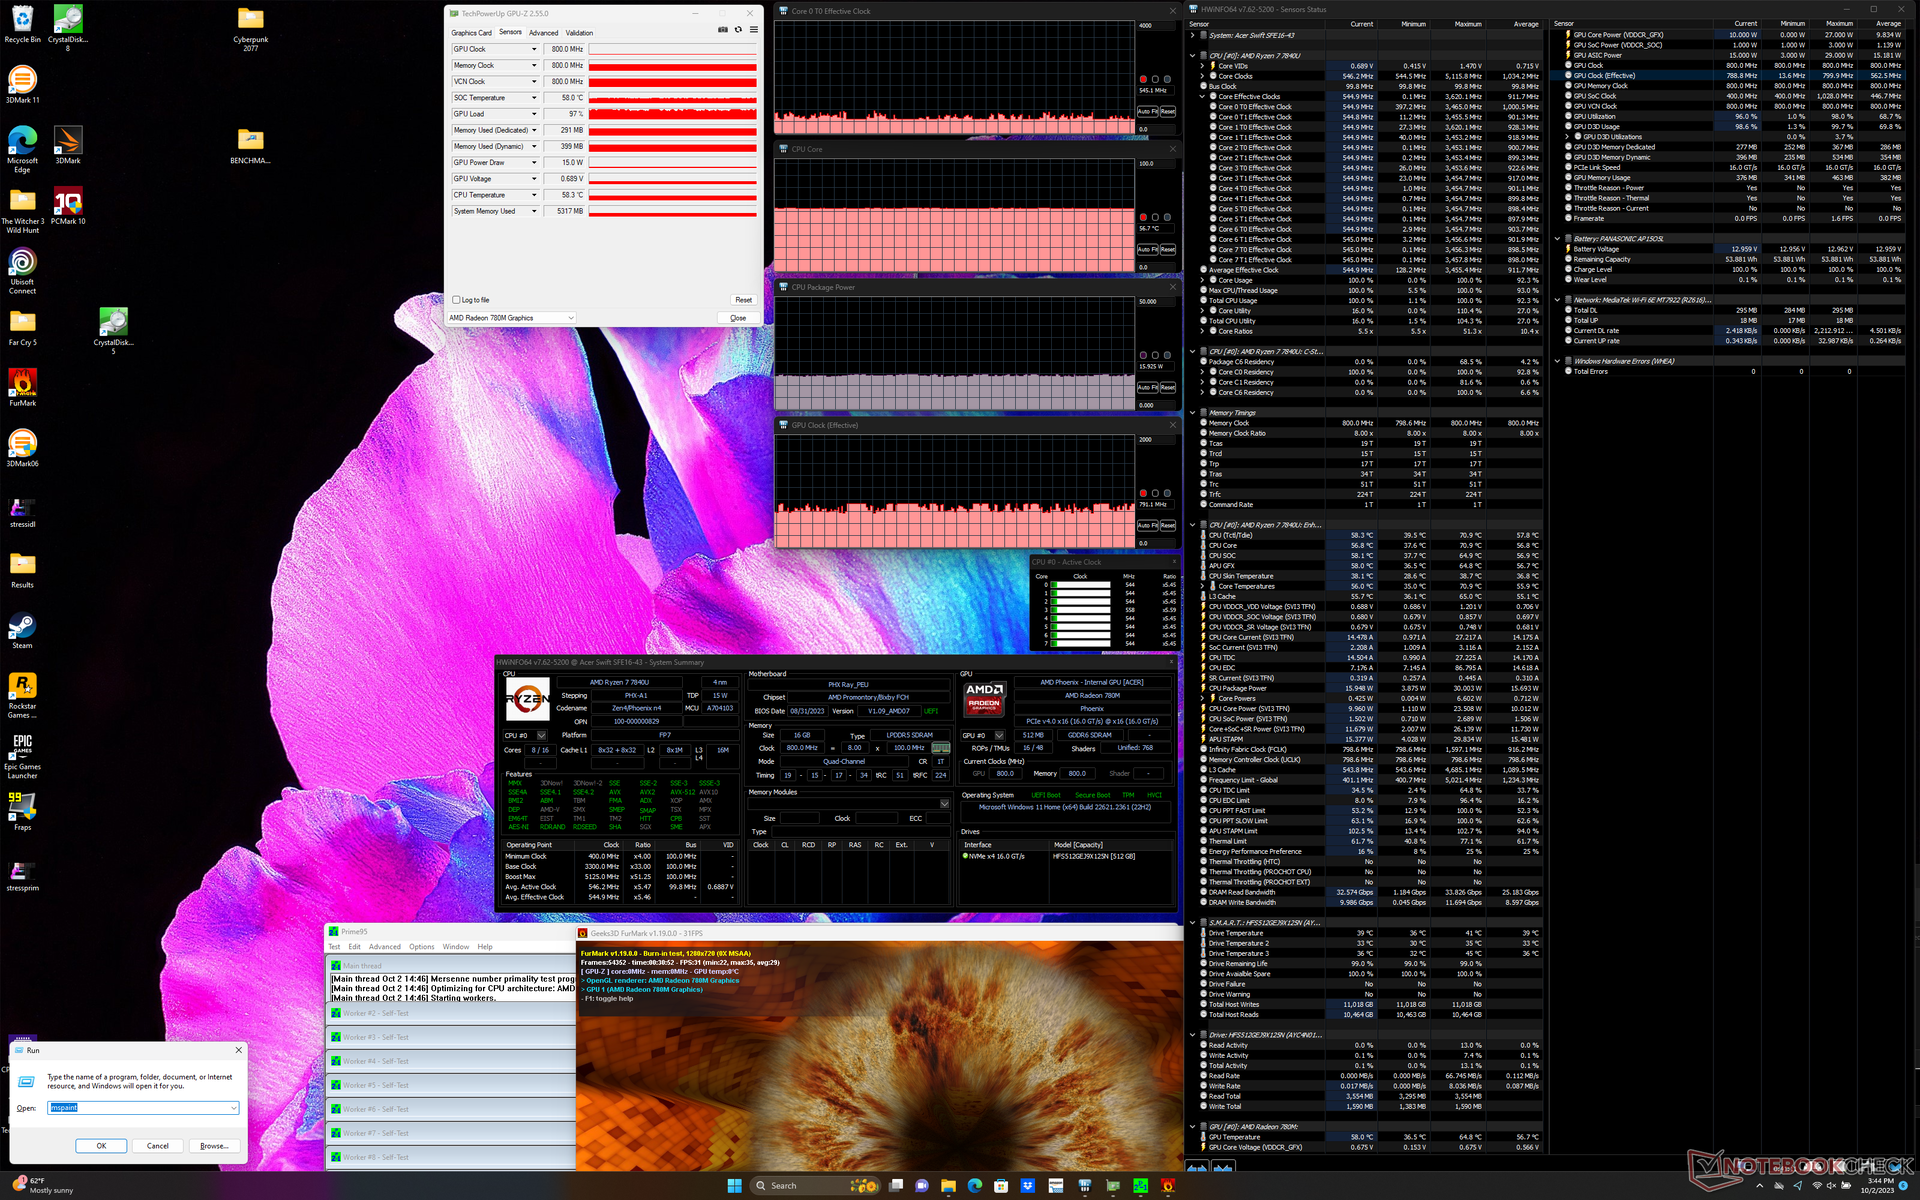
| CPU Clock (GHz) | GPU Clock (MHz) | Average CPU Temperature (°C) | |
| System Idle | -- | -- | 38 |
| Prime95 Stress | 2.3 | -- | 64 |
| Prime95 + FurMark Stress | 0.5 | 791 | 57 |
| Witcher 3 Stress | 0.3 | 1042 | 56 |
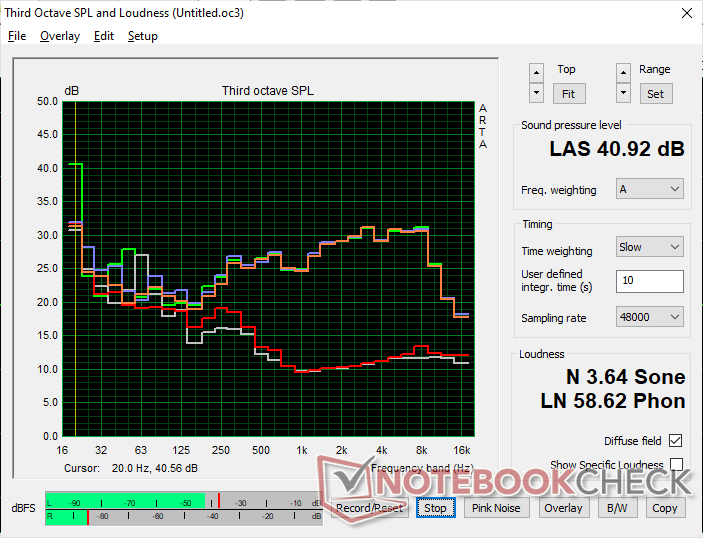
Speakers
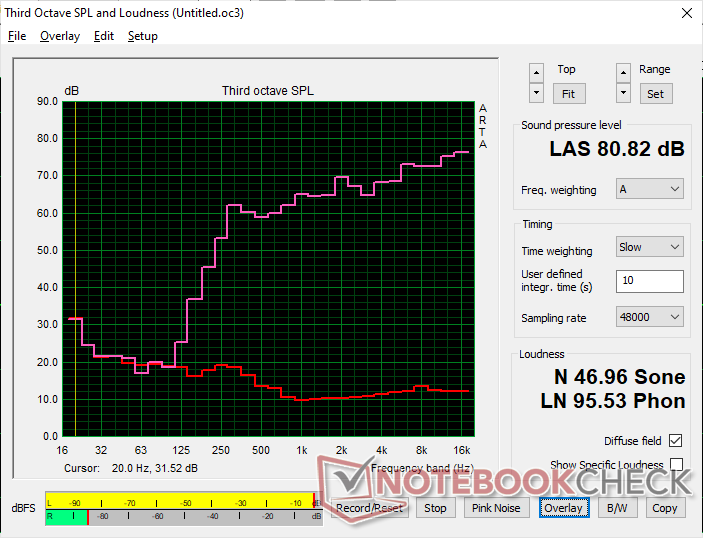
Acer Swift Edge SFE16 Ryzen 7 7840U audio analysis
(±) | speaker loudness is average but good (80.8 dB)
Bass 100 - 315 Hz
(-) | nearly no bass - on average 24.5% lower than median
(±) | linearity of bass is average (14.2% delta to prev. frequency)
Mids 400 - 2000 Hz
(+) | balanced mids - only 2.9% away from median
(+) | mids are linear (3.5% delta to prev. frequency)
Highs 2 - 16 kHz
(+) | balanced highs - only 4.8% away from median
(+) | highs are linear (3.7% delta to prev. frequency)
Overall 100 - 16.000 Hz
(±) | linearity of overall sound is average (19.8% difference to median)
Compared to same class
» 34% of all tested devices in this class were better, 9% similar, 58% worse
» The best had a delta of 7%, average was 22%, worst was 53%
Compared to all devices tested
» 44% of all tested devices were better, 7% similar, 49% worse
» The best had a delta of 4%, average was 26%, worst was 134%
Apple MacBook Pro 16 2021 M1 Pro audio analysis
(+) | speakers can play relatively loud (84.7 dB)
Bass 100 - 315 Hz
(+) | good bass - only 3.8% away from median
(+) | bass is linear (5.2% delta to prev. frequency)
Mids 400 - 2000 Hz
(+) | balanced mids - only 1.3% away from median
(+) | mids are linear (2.1% delta to prev. frequency)
Highs 2 - 16 kHz
(+) | balanced highs - only 1.9% away from median
(+) | highs are linear (2.7% delta to prev. frequency)
Overall 100 - 16.000 Hz
(+) | overall sound is linear (4.6% difference to median)
Compared to same class
» 0% of all tested devices in this class were better, 0% similar, 100% worse
» The best had a delta of 5%, average was 18%, worst was 45%
Compared to all devices tested
» 0% of all tested devices were better, 0% similar, 100% worse
» The best had a delta of 4%, average was 26%, worst was 134%
Energy Management
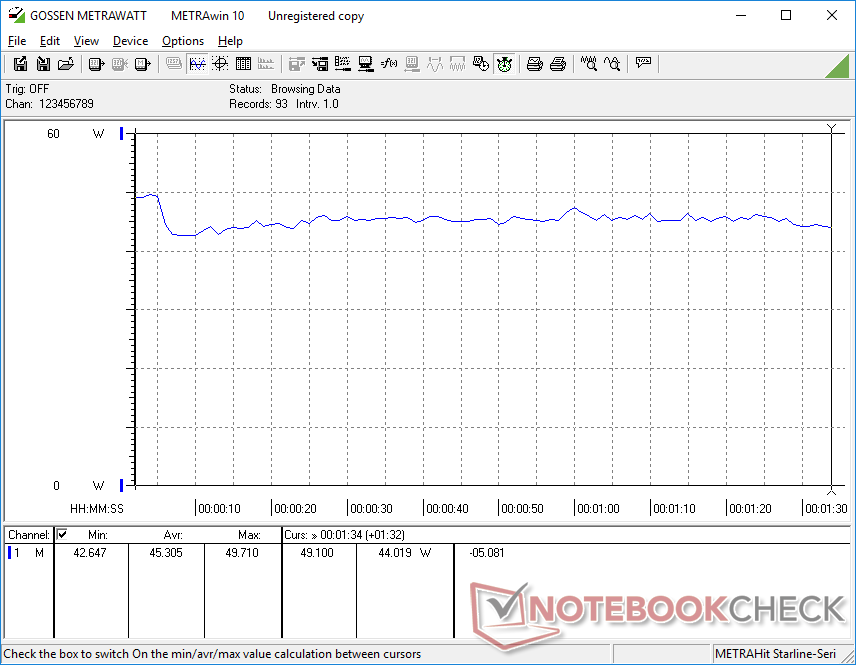
Power Consumption
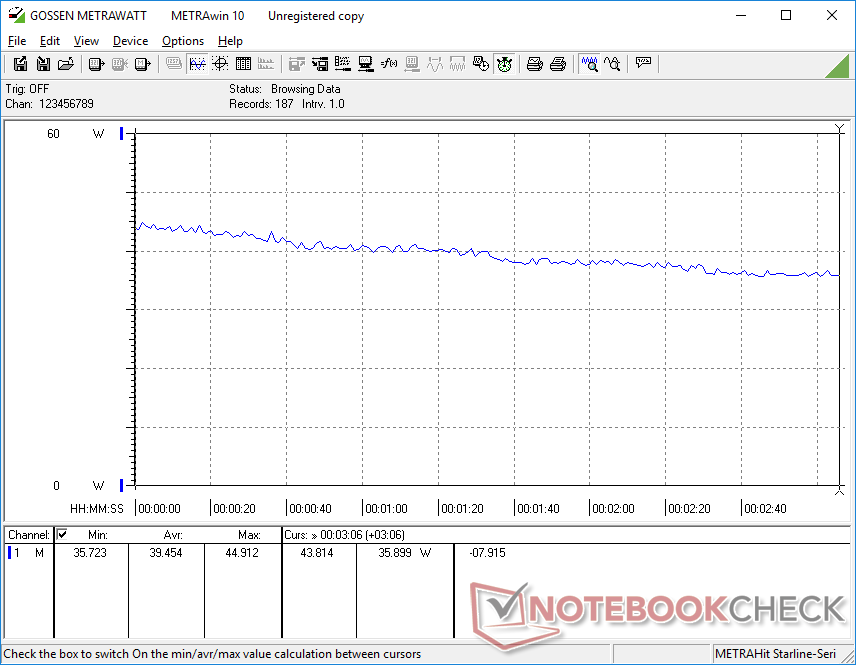
Power consumption when idling is higher than on most other laptops with integrated GPUs due to the high 120 Hz refresh rate and OLED panel of our Acer configuration which are known to be more power demanding than the usual 60 Hz IPS. Displaying an all-white image at 120 Hz would consume as much as 19 W compared to less than half on the Framework Laptop 13.5.
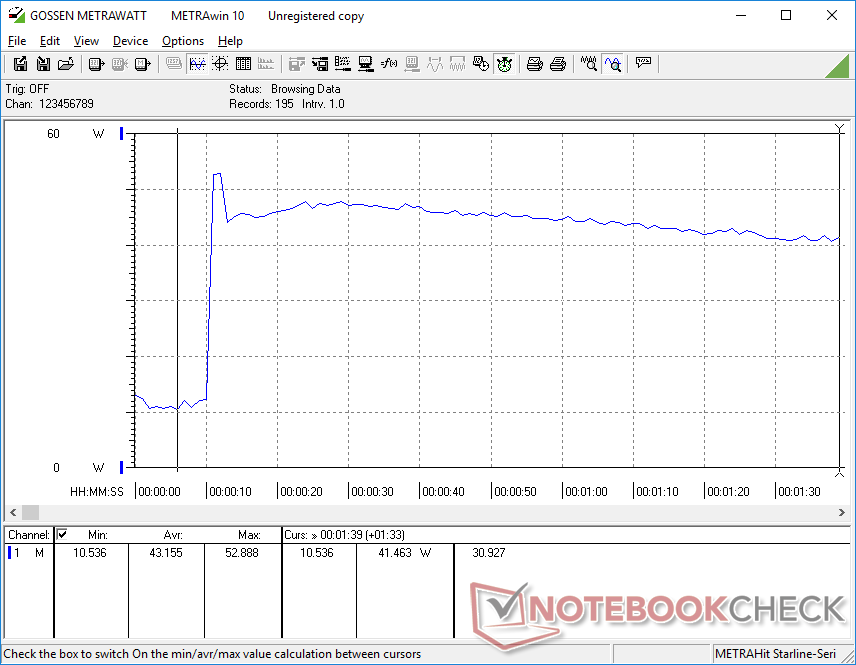
Conversely, power consumption when gaming would be lower than expected due to the throttling tendencies of the processor. Consumption would start out high during the start of the test before steadily falling over time as shown by our graphs below to suggest performance throttling.
| Off / Standby | |
| Idle | |
| Load |
|
| Acer Swift Edge SFE16 Ryzen 7 7840U R7 7840U, Radeon 780M, SK hynix HFS512GEJ9X125N, OLED, 3200x2000, 16.00 | Acer Swift Edge SFE16-42-R1GM R7 7735U, Radeon 680M, Micron 3400 1TB MTFDKBA1T0TFH, OLED, 3840x2400, 16.00 | Lenovo Slim Pro 9i 16IRP8 i9-13905H, NVIDIA GeForce RTX 4050 Laptop GPU, Samsung PM9A1 MZVL21T0HCLR, Mini-LED, 3200x2000, 16.00 | Asus VivoBook Pro 16 i7-12700H, GeForce RTX 3050 Ti Laptop GPU, Intel SSD 670p SSDPEKNU010TZ, IPS, 2560x1600, 16.00 | Samsung Galaxy Book3 Ultra 16 i7-13700H, NVIDIA GeForce RTX 4050 Laptop GPU, Samsung PM9A1 MZVL2512HCJQ, AMOLED, 2880x1800, 16.00 | Huawei MateBook 16s i7 i7-12700H, Iris Xe G7 96EUs, Silicon Motion PCIe-8 SSD, IPS, 2520x1680, 16.00 | |
|---|---|---|---|---|---|---|
| Power Consumption | 4% | -166% | -102% | -15% | -30% | |
| Idle Minimum * | 7.1 | 8.6 -21% | 16 -125% | 8.7 -23% | 3 58% | 6.8 4% |
| Idle Average * | 10.1 | 7.7 24% | 30 -197% | 13.1 -30% | 5 50% | 13.2 -31% |
| Idle Maximum * | 18.6 | 9.3 50% | 30.4 -63% | 18.3 2% | 11 41% | 13.8 26% |
| Load Average * | 45.3 | 47.9 -6% | 78.9 -74% | 116 -156% | 72 -59% | 75.2 -66% |
| Witcher 3 ultra * | 39.5 | 46.3 -17% | 155.3 -293% | 117.6 -198% | 69.7 -76% | 56.1 -42% |
| Load Maximum * | 52.9 | 56 -6% | 180.4 -241% | 162 -206% | 108 -104% | 90.6 -71% |
* ... smaller is better
Power Consumption Witcher 3 / Stresstest
Power Consumption external Monitor
Battery Life
WLAN runtime is shorter than what we recorded on our previous unit by almost two whole hours even when both are set to the same power profile settings and browser conditions. The 120 Hz refresh rate is likely a contributing factor to the battery life differences.
| Acer Swift Edge SFE16 Ryzen 7 7840U R7 7840U, Radeon 780M, 54 Wh | Acer Swift Edge SFE16-42-R1GM R7 7735U, Radeon 680M, 54 Wh | Lenovo Slim Pro 9i 16IRP8 i9-13905H, NVIDIA GeForce RTX 4050 Laptop GPU, 75 Wh | Asus VivoBook Pro 16 i7-12700H, GeForce RTX 3050 Ti Laptop GPU, 70 Wh | Samsung Galaxy Book3 Ultra 16 i7-13700H, NVIDIA GeForce RTX 4050 Laptop GPU, 76 Wh | Huawei MateBook 16s i7 i7-12700H, Iris Xe G7 96EUs, 84 Wh | |
|---|---|---|---|---|---|---|
| Battery Runtime | 30% | 18% | 29% | 71% | 44% | |
| WiFi v1.3 | 336 | 437 30% | 395 18% | 435 29% | 576 71% | 483 44% |
| Reader / Idle | 653 | 1093 | ||||
| H.264 | 518 | 803 | 555 | |||
| Load | 89 | 106 | 116 |
Pros
Cons
Verdict — Minor But Notable Upgrades
The Zen 3+ Swift Edge 16 was already one of our favorite 16-inch laptops and the updated Zen 4 configuration only solidifies our stance. The level of CPU power and especially GPU power available is high considering the low weight and thin profile. Meanwhile, the 3.2K 120 Hz OLED display is one of the best we've seen on any multimedia laptop for word processing, editing, browsing, video, and even gaming. If you want to maximize performance and display quality while minimizing weight as much as possible, then the Swift Edge 16 really hits the mark.
The Ryzen 7 7840U offers a decent boost to performance over the already great Ryzen 7 7735U Swift Edge 16 configuration. Users will love the 120 Hz OLED and low weight, but the average battery life and performance throttling may irk power users.
Cutbacks arise when looking beyond the CPU and display. Since the laptop is extremely light for its size, certain features had to be removed or reduced such as the smaller cooling solution, smaller battery capacity, and lack of Gorilla Glass or touchscreen to keep weight low. As a result, the CPU runs a little slower than expected, battery life is only average, the SSD throttles under stress, and the display is more susceptible to twisting and wobbling than we would like. Expansion is also limited since RAM is soldered and only one internal SSD is supported.
If you absolutely need the horsepower of H-series CPUs and GeForce RTX GPUs, then you might want to consider the heavier Swift X 16, Asus VivoBook Pro 16, or Galaxy Book3 Ultra 16 instead. Constant travelers will have more to like about the Swift Edge 16 as they can more regularly exploit the low weight of the system without sacrificing display quality or too much performance.
Price and Availability
The Acer Swift Edge SFE16 as reviewed with the Ryzen 7 7840U is now widely available at Best Buy for $1300 USD.
Acer Swift Edge SFE16 Ryzen 7 7840U
-
10/06/2023 v7
Allen Ngo
More articles related to this device
Acer Swift Edge SFE16 Ryzen 7 7840U (Swift Edge SFE16 Series)Related Articles


Transparency
The present review sample was made available to the author as a loan by the manufacturer or a shop for the purposes of review. The lender had no influence on this review, nor did the manufacturer receive a copy of this review before publication. There was no obligation to publish this review.
Pricecompare
