 Deutsch
 English
 Español
 Français
 Italiano
 Nederlands
 Polski
 Português
 Русский
 Türkçe
 Svenska
 Chinese
 Magyar
Apple MacBook Pro 14 2023 M3 Review - The base model now comes without a Pro SoC
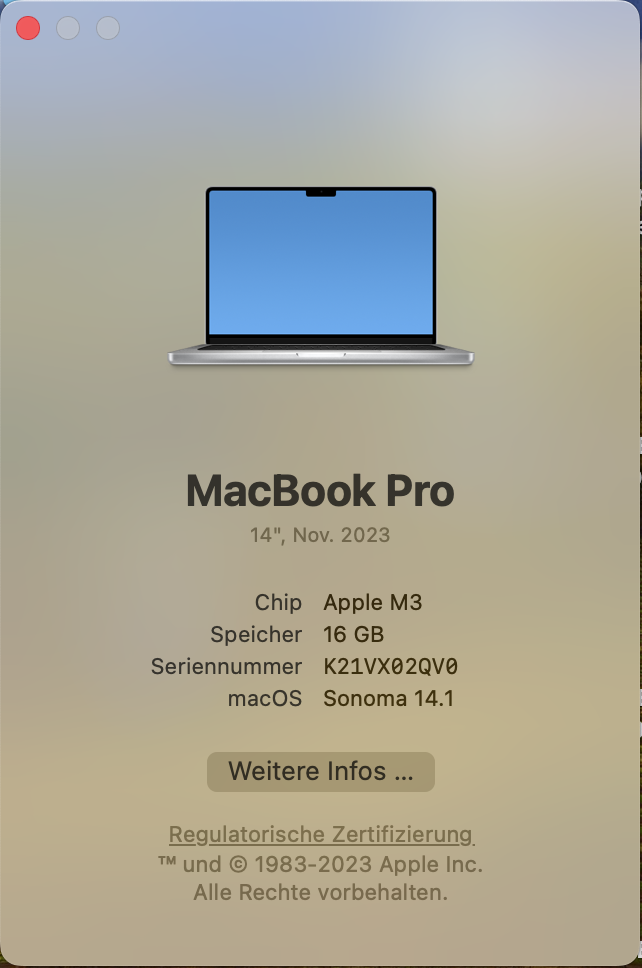
Around 9 months after the launch of the MacBook Pro models with the M2 Pro as well as M2 Max processors, Apple just announced new versions of its Pro laptops including their new 3 nm SoCs M3, M3 Pro and M3 Max. The outdated 13-inch MacBook Pro with the Touch Bar is finally cancelled and instead we get a new entry-level model of the MacBook Pro 14 with the base M3 SoC. The starting price is also lower at $1599, but you only get 8 GB RAM by default. An upgrade to 16 GB RAM increases the price to $1799, which is not far away from the previous entry-level MacBook Pro 14 with the M2 Pro. Our review unit with the M3 SoC, 16 GB RAM and 1 TB SSD storage is priced at $1999.
The MacBook Pro 14 with the new M3 Pro starts at $1999 (18 GB RAM, 512 GB SSD with a slimmed-down M3 Pro chip (11 CPU cores, 14 GPU cores) and the full M3 Pro version with all performance cores and the faster 19-core GPU starts at $2399 (18 GB RAM, 1 TB SSD). The MacBook Pro 14 with the M3 Max starts at $3199 (14 CPU cores, 30 GPU cores, 36 GB RAM) and the fastest M3 Max (16 CPU cores, 40 GPU cores, 48 GB RAM) starts at $3699. If you check all the option boxes (128 GB RAM, 8 TB SSD), you can raise the price to $6899. It is also the first time that the Max versions offer higher CPU performance compared to the Pro SoCs.
| MBP 14 M3 | MBP 14 M3 Pro | MBP 14 M3 Pro | MBP 14 M3 Max | MBP 14 M3 Max | |
|---|---|---|---|---|---|
| CPU | Apple M3 8-core CPU (4P & 4E) |
Apple M3 Pro 11-core CPU (5P & 6E) |
Apple M3 Pro 12-core (6P & 6 E) |
Apple M3 Max 14-core CPU (10P & 4E) |
Apple M3 Max 16-core (12P & 4E) |
| GPU | 10-core GPU | 14-core GPU | 18-core | 30-core | 40-core |
| RAM | 8 GB (16/24 GB) | 18 GB (36 GB) | 18 GB (36 GB) | 36 GB (96 GB) | 48 GB (64/128 GB) |
| SSD | 512 GB (1/2 TB) | 512 GB (1/2/4 TB) | 1 TB (2/4 TB) | 1 TB (2/4/8 TB) | 1 TB (2/4/8 TB) |
| Memory Bandwidth | 100 GB/s | 150 GB/s | 150 GB/s | 300 GB/s | 400 GB/s |
| Ports | 2x USB-C 4.0 w/ Thunderbolt 3 HDMI, SD card reader |
3x USB-C 4.0 w/ Thunderbolt 4 HDMI, SD card reader |
3x USB-C 4.0 w/ Thunderbolt 4 HDMI, SD card reader |
3x USB-C 4.0 w/ Thunderbolt 4 HDMI, SD card reader |
3x USB-C 4.0 w/ Thunderbolt 4 HDMI, SD card reader |
| Price | from $1599 | from $1999 | from $2399 | from 3199 | from $3699 |
We will also review the other versions of the new MacBook Pro 14 & 16 soon and also have a closer look at the performance as well as the efficiency of the new M3 processor in our analysis article, which will be published soon. It will also include a preview of the new MacBook Air models, which will also be updated with the M3 SoC.
Right now, the main rival for the new entry-level MacBook Pro 14 is the MacBook Pro 14 with the M2 Pro, which is actually similarly priced with the same memory (16 GB). There are also Windows rivals like the Huawei MateBook X Pro or the Schenker Vision 14, but also multimedia devices like the Gigabyte 14 Aero OLED or the Lenovo Yoga Pro 9i 14 with a Mini-LED screen, and both of them are equipped with discrete GeForce RTX 4050 Laptop GPUs.
Potential Rivals
Rating | Date | Model | Weight | Height | Size | Resolution | Best Price |
|---|---|---|---|---|---|---|---|
| 90.4 % | 11/2023 | Apple MacBook Pro 14 2023 M3 M3, M3 10-Core GPU | 1.5 kg | 15.5 mm | 14.20" | 3024x1964 | |
| 93.4 % | 03/2023 | Apple MacBook Pro 14 2023 M2 Pro Entry M2 Pro 10-Core, M2 Pro 16-Core GPU | 1.6 kg | 15.5 mm | 14.20" | 3024x1964 | |
| 91.9 % | 06/2022 | Apple MacBook Pro 13 2022 M2 M2, M2 10-Core GPU | 1.4 kg | 15.6 mm | 13.30" | 2560x1600 | |
| 89.6 % | 06/2023 | Huawei MateBook X Pro 2023 i7-1360P, Iris Xe G7 96EUs | 1.3 kg | 15.6 mm | 14.20" | 3120x2080 | |
| 89.8 % | 07/2023 | Lenovo Yoga Pro 9-14IRP G8 i7-13705H, NVIDIA GeForce RTX 4050 Laptop GPU | 1.7 kg | 17.6 mm | 14.50" | 3072x1920 | |
| 89.4 % | 05/2023 | Gigabyte Aero 14 OLED BMF i7-13700H, NVIDIA GeForce RTX 4050 Laptop GPU | 1.4 kg | 17 mm | 14.00" | 2880x1800 | |
| 88.9 % | 10/2023 | SCHENKER Vision 14 2023 i7-13700H, Iris Xe G7 96EUs | 1.3 kg | 16.6 mm | 14.00" | 2880x1800 |
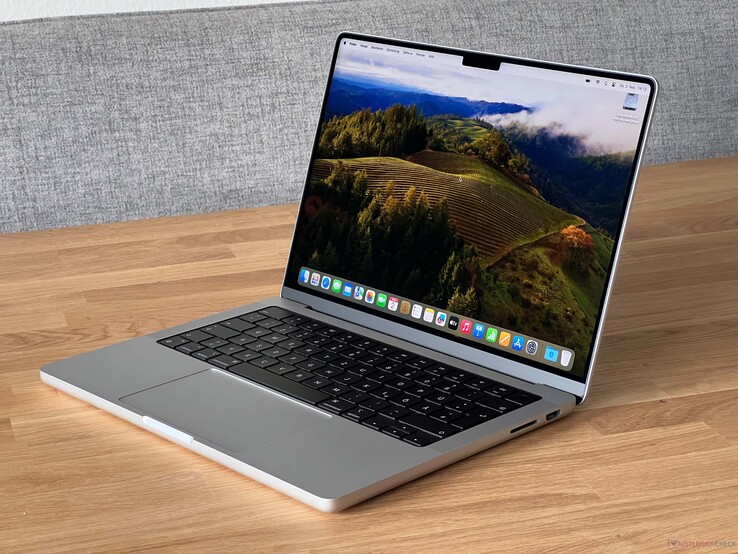
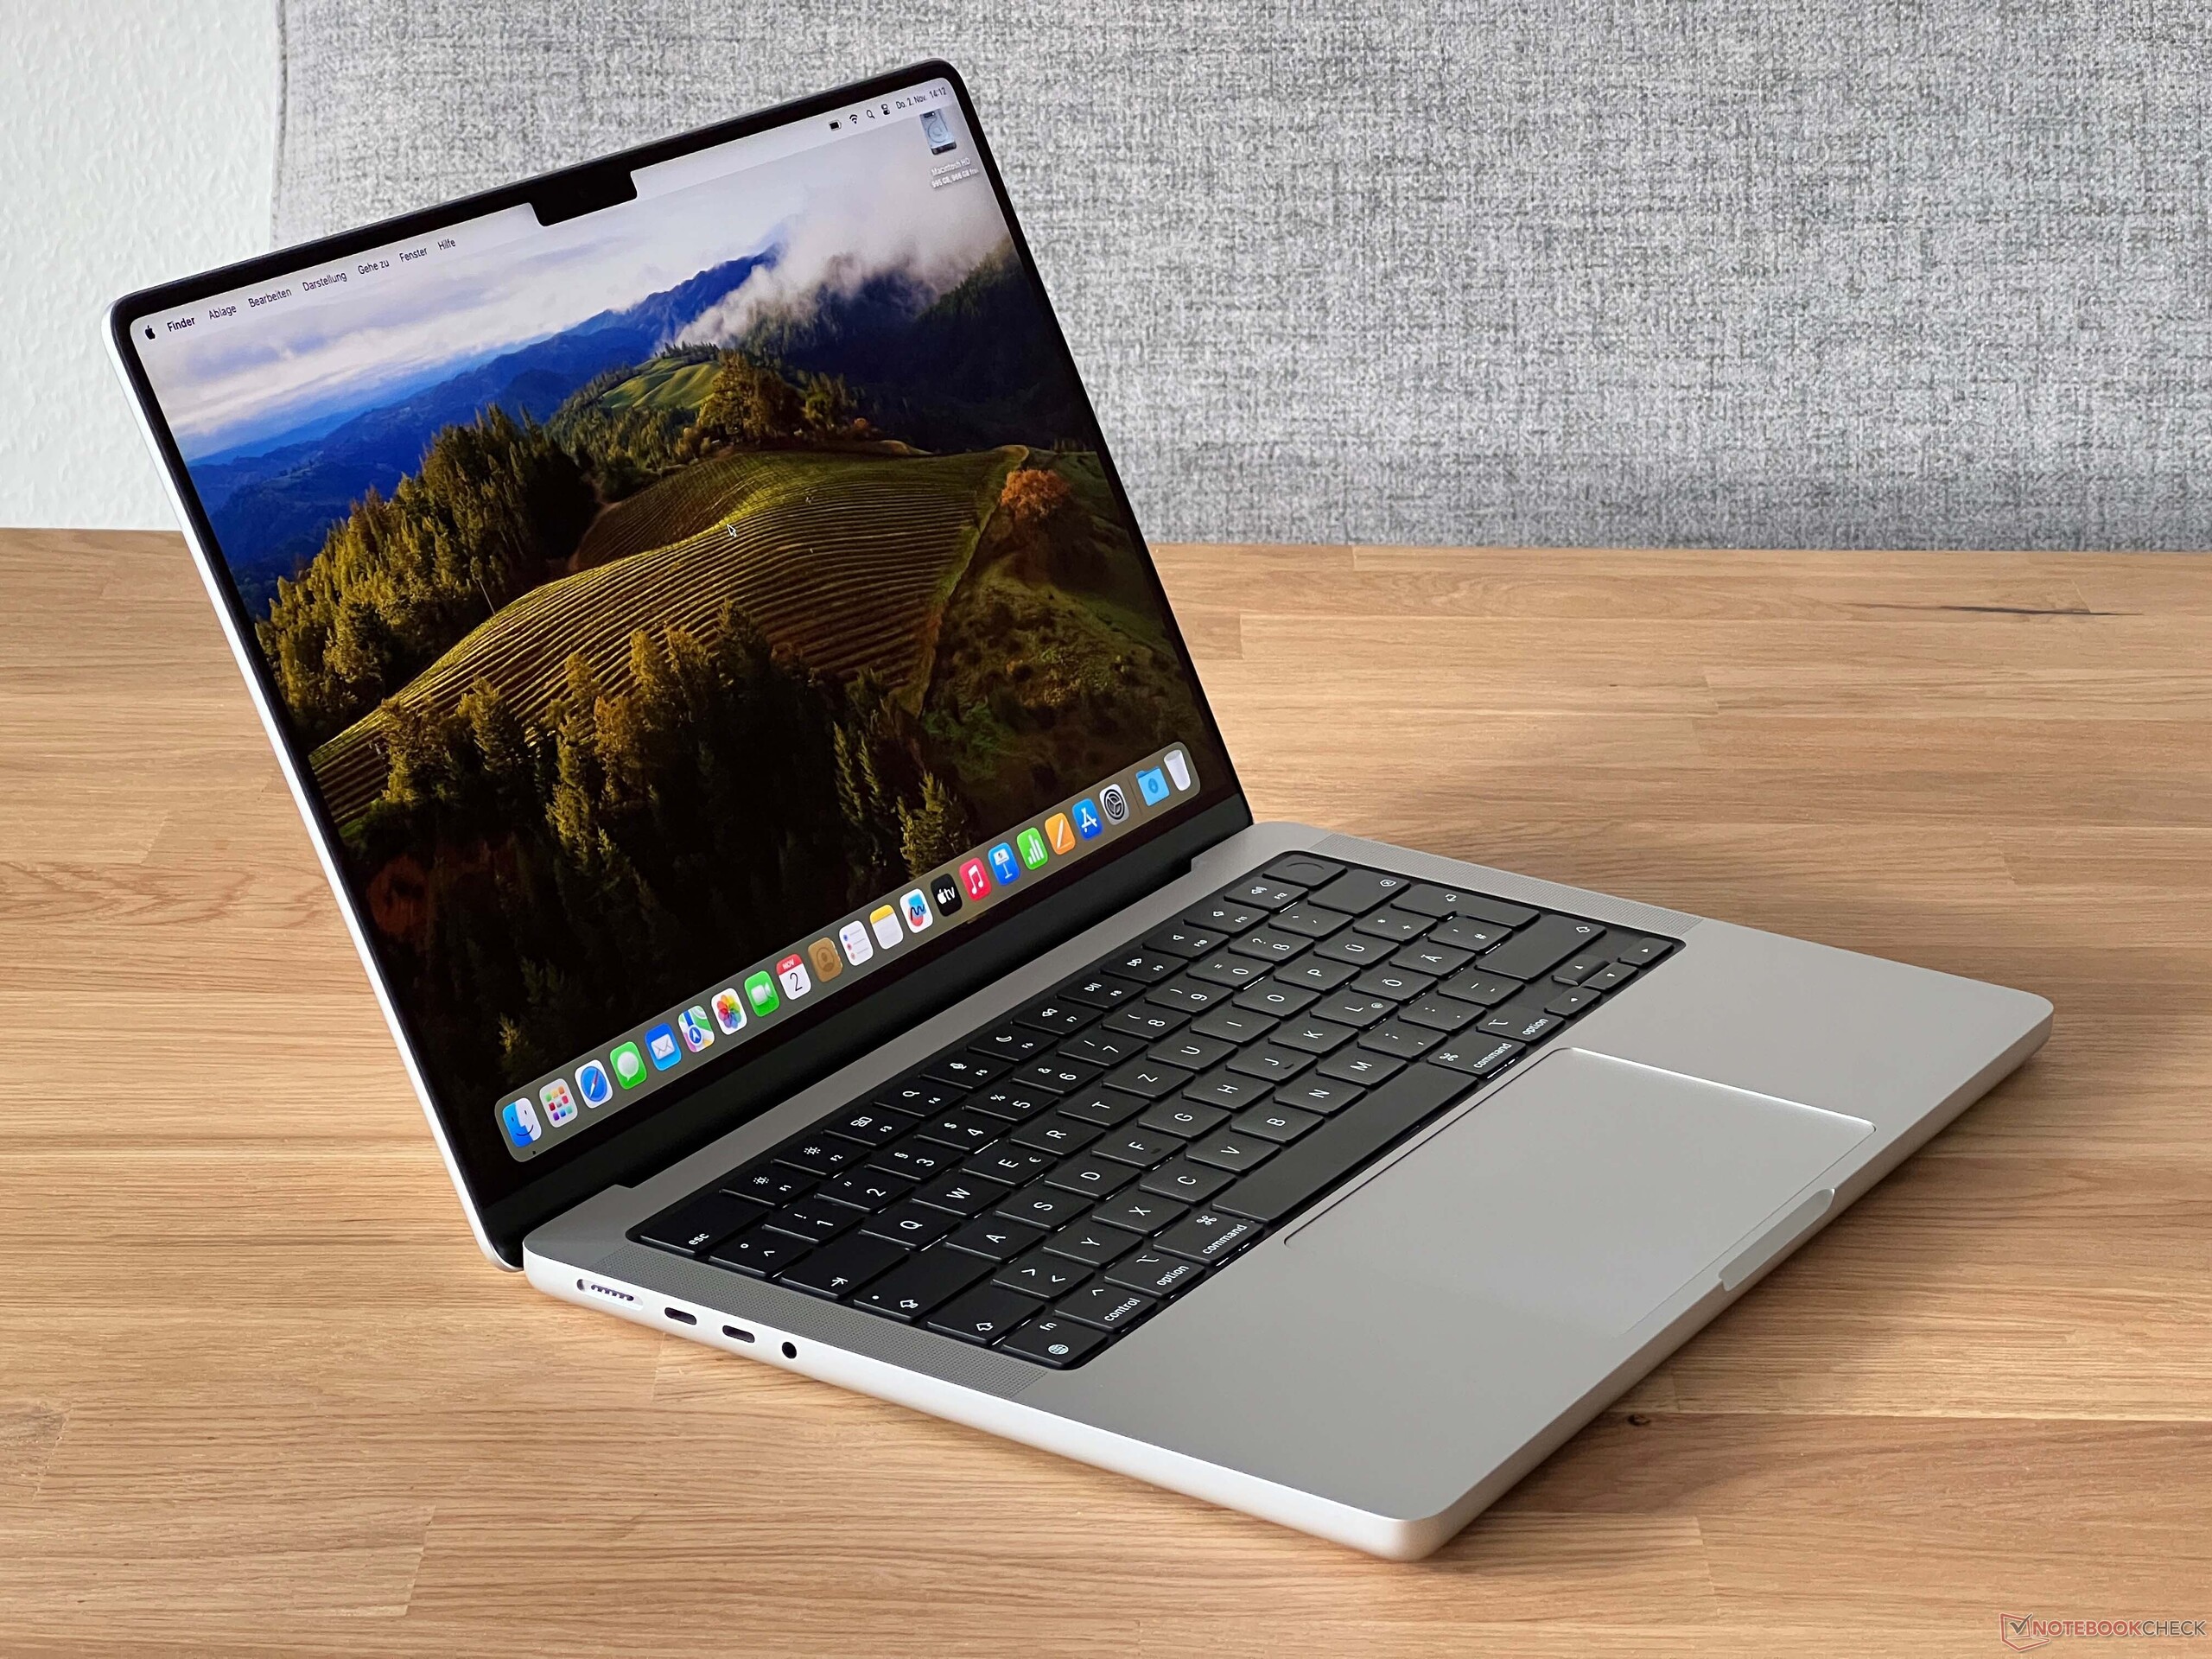
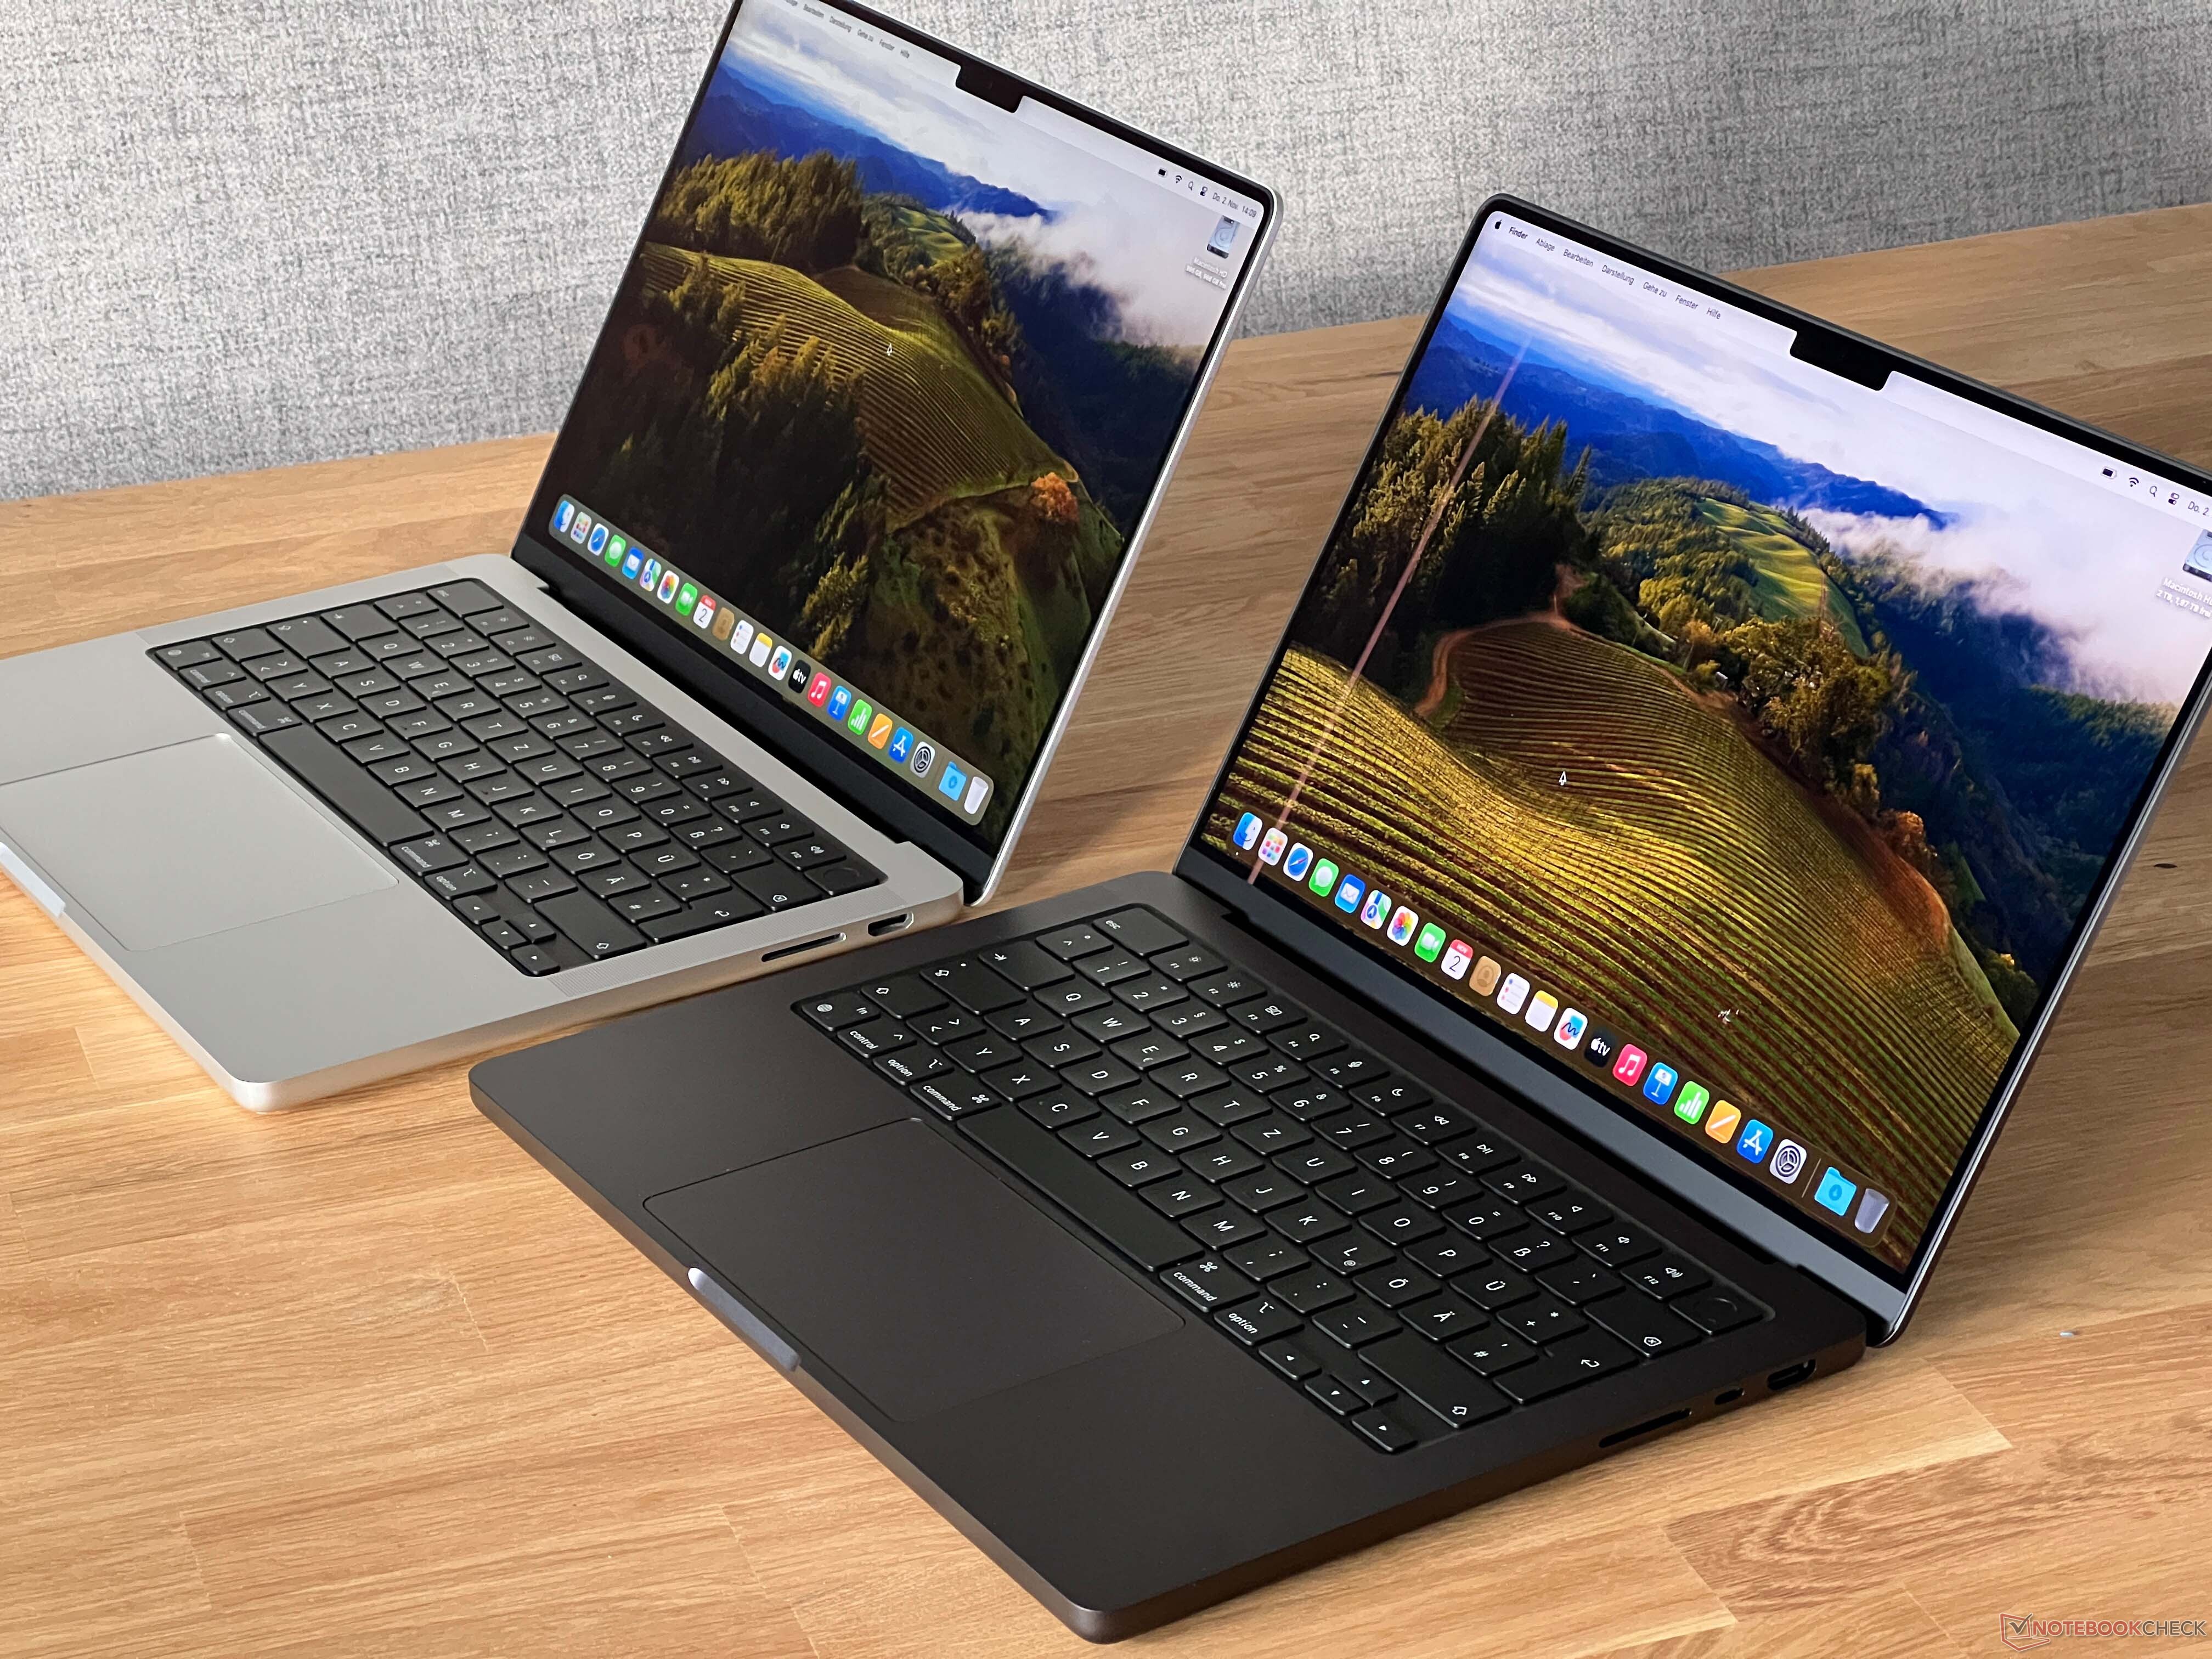
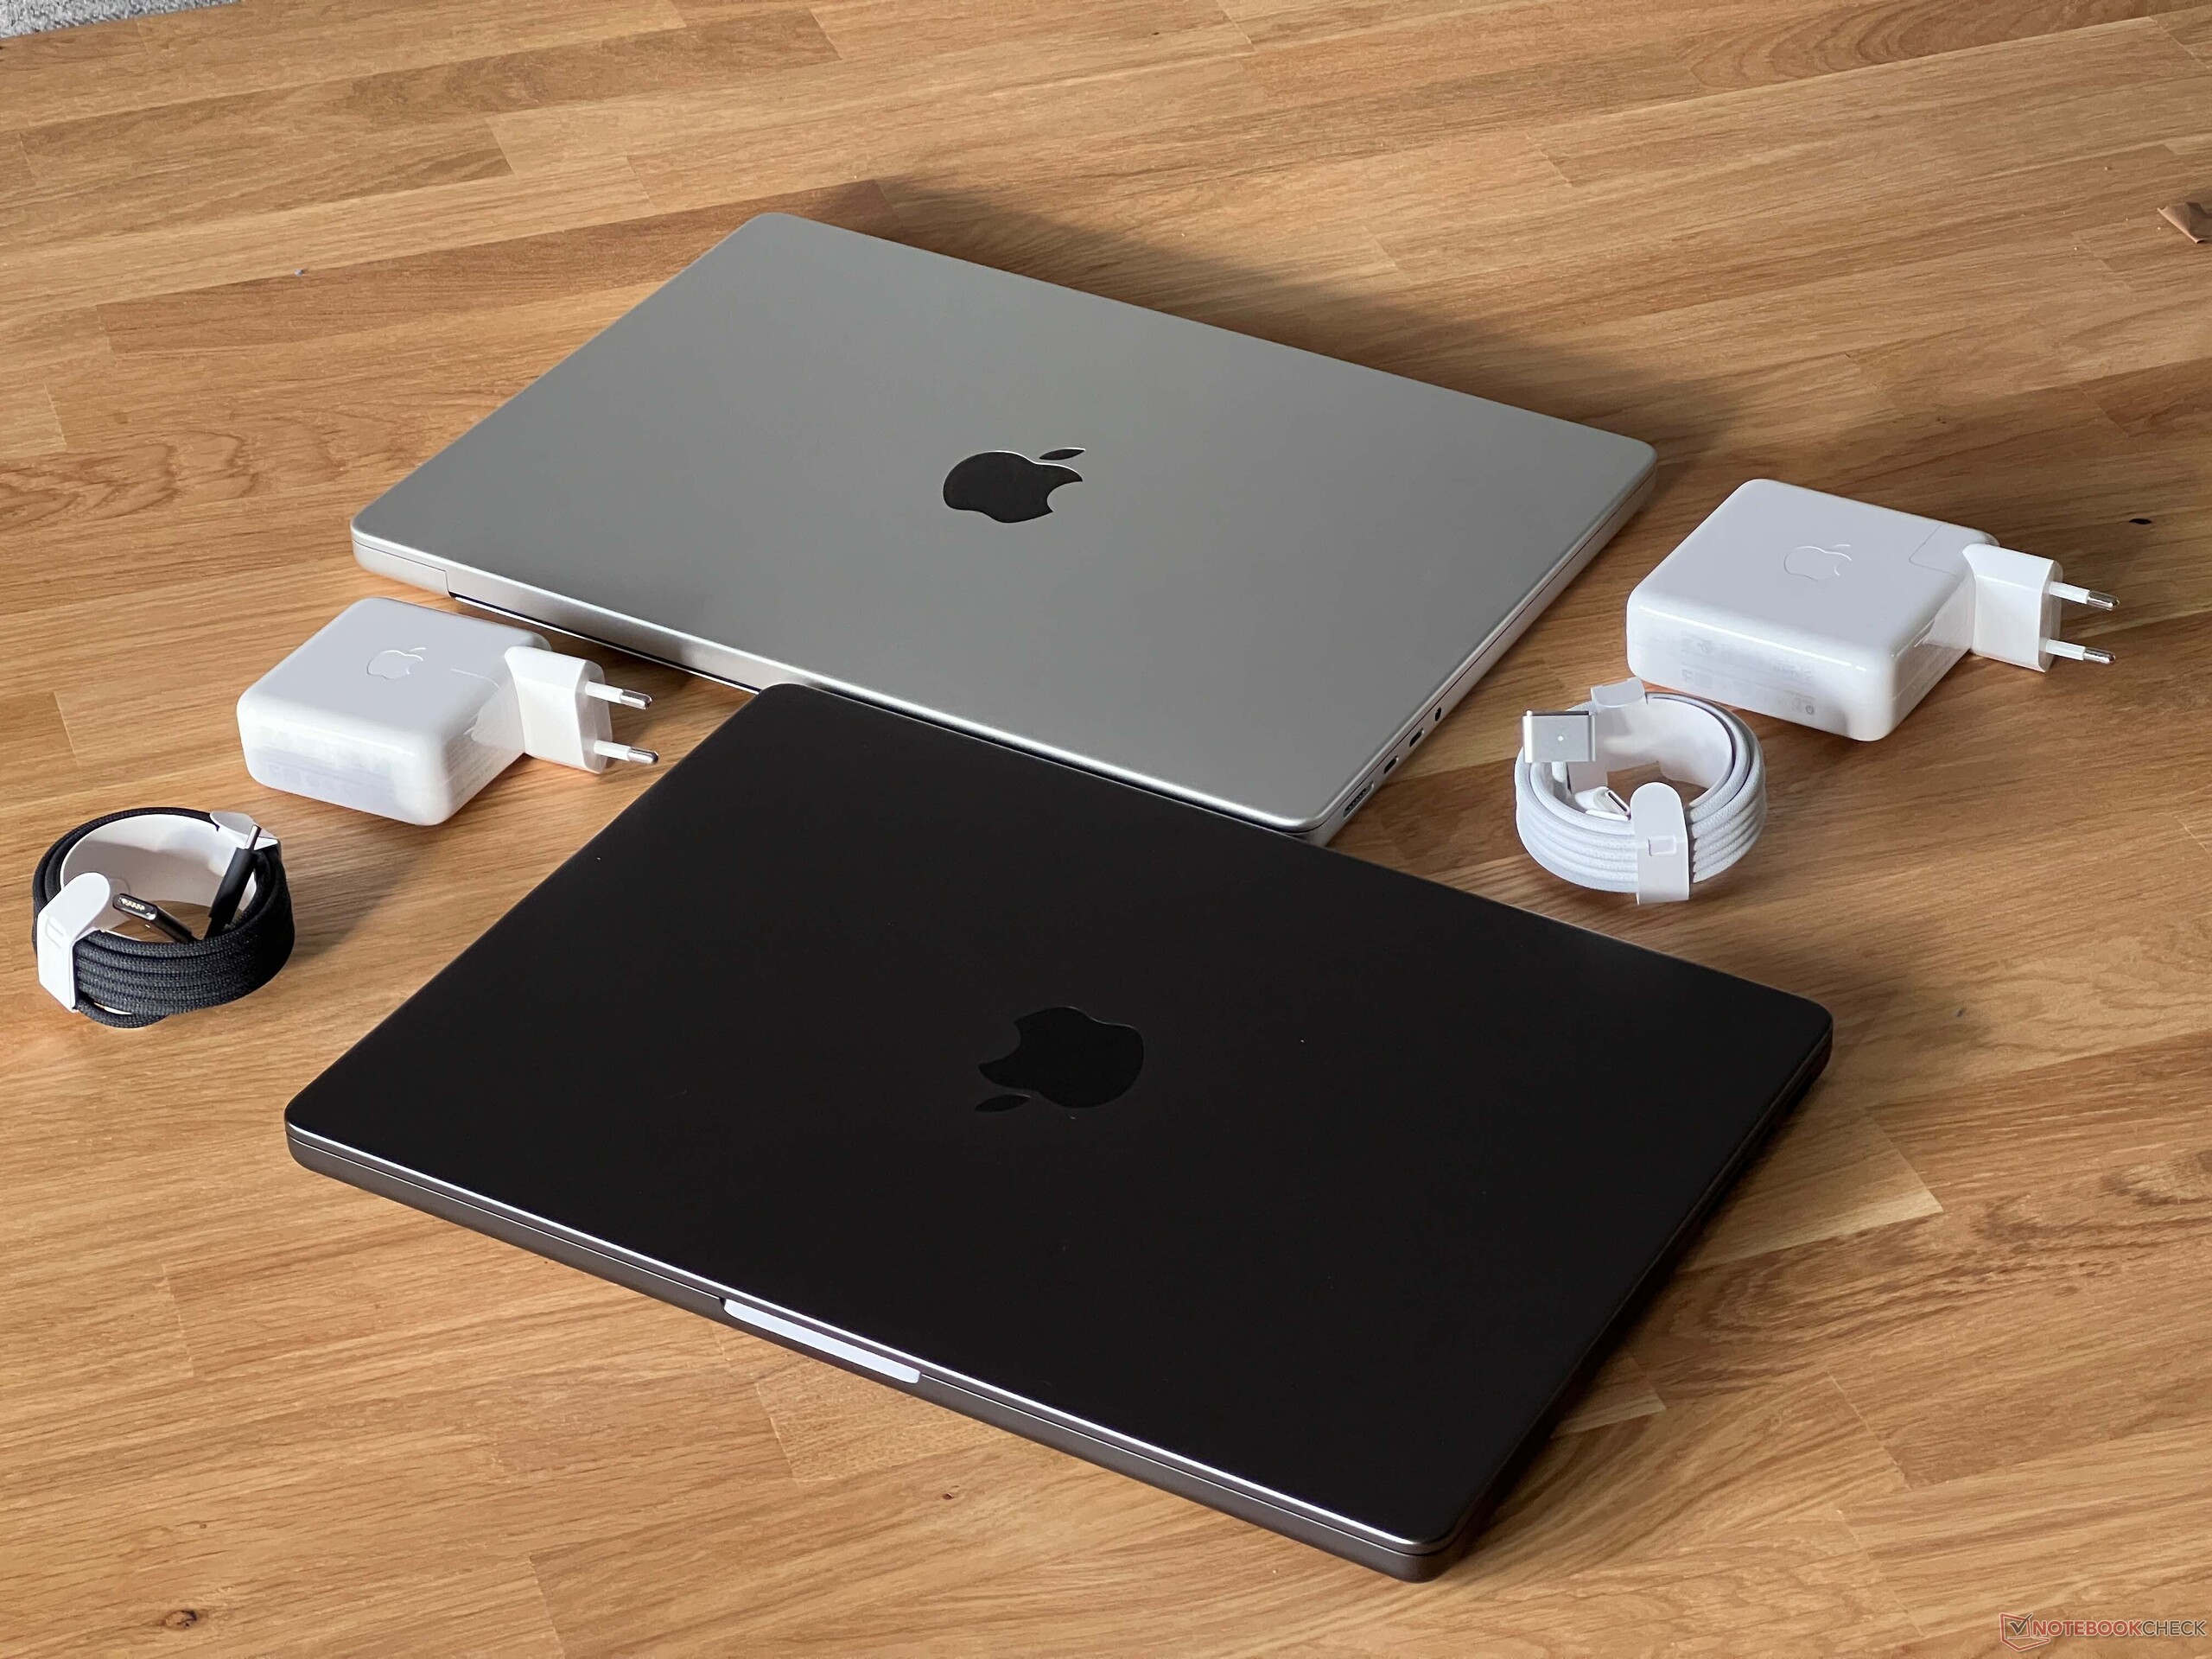
Case - Base MBP 14 still in Silver or Space Grey
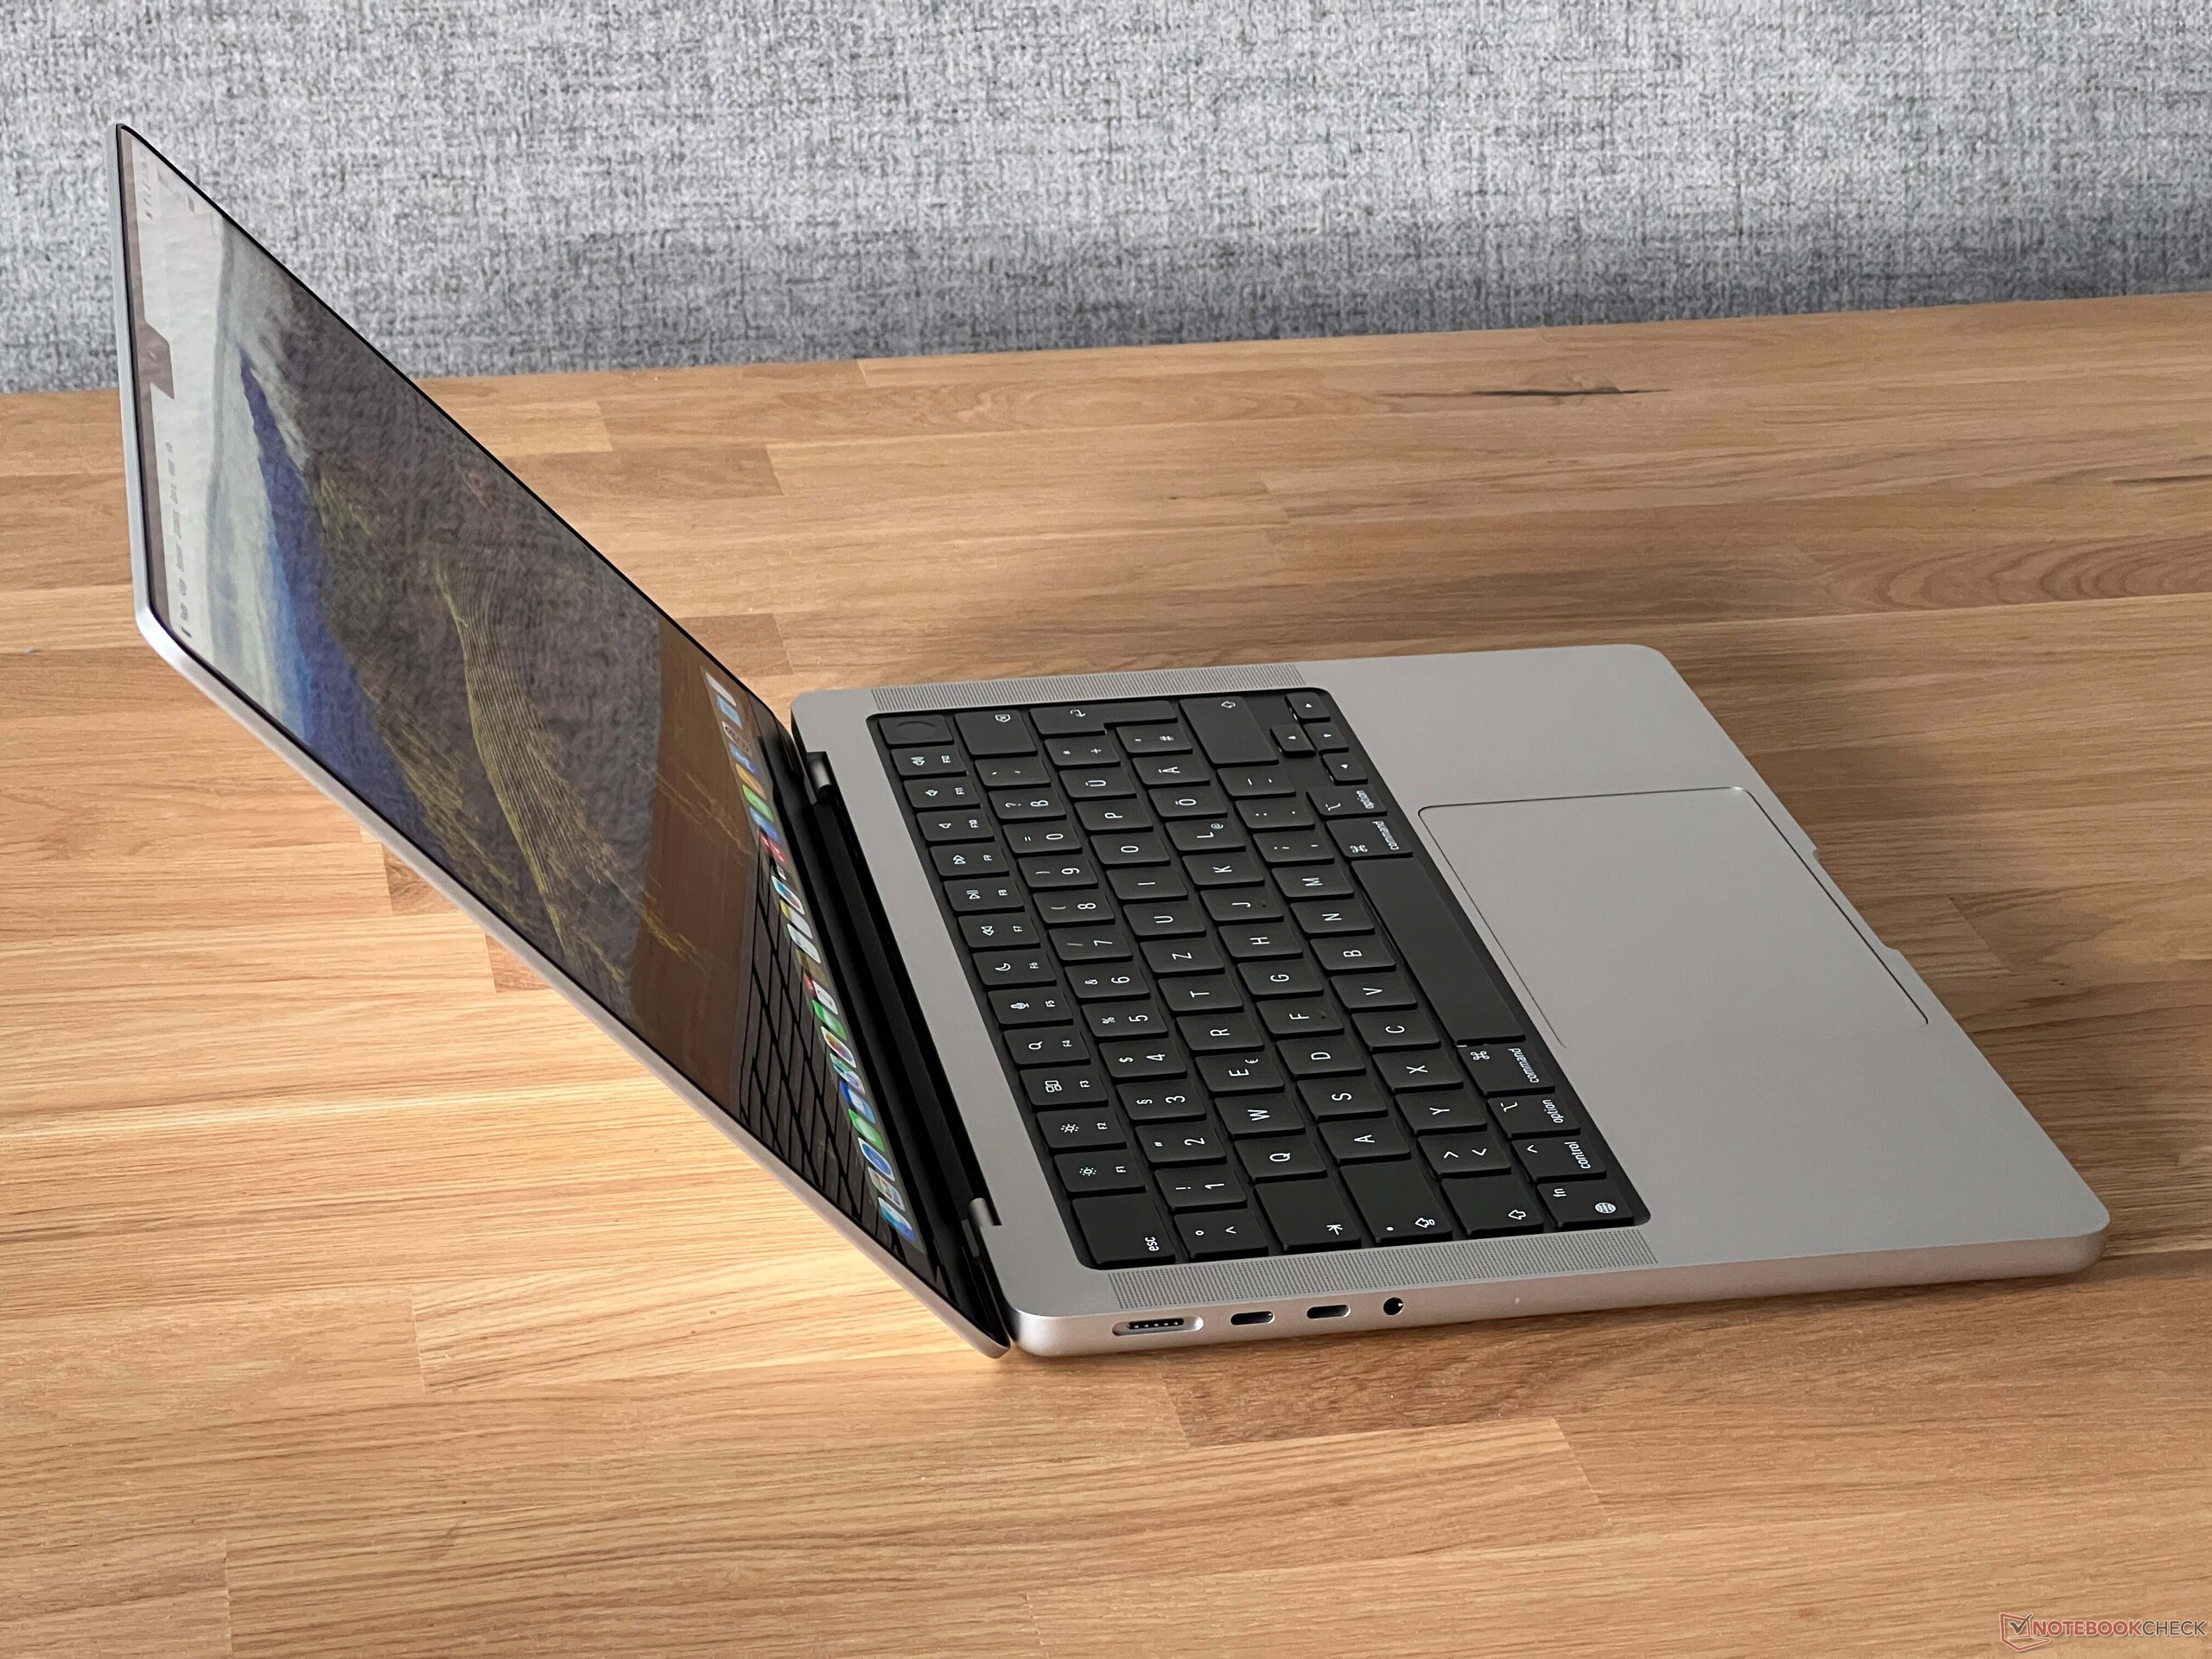
Apple keeps the familiar chassis design of the two previous years and the new entry-level model is still available in silver or space grey – the new space black option is reserved for the more expensive M3 Pro & M3 Max SKUs. The quality of the chassis is still excellent and the aluminum case feels premium and sturdy. The display hinges also leave a good impression, only the maximum opening angle (135 degrees) could be larger.
The hard front edge of the base unit can be an issue and cut into the skin when you use it for longer periods. The design of the base unit without any tapered edges also makes it feel quite bulky. It is also much bigger than the outgoing MacBook Pro 13 since it has a bigger screen, but the MBP 14 is actually slightly thinner at 15.5 vs. 15.6 millimeters.
At 1.525 kg, the base model of the new MacBook Pro 14 is one of the heavier devices in our comparison group and only the MacBook Pro M2 (like the new MBP 14 M3 Max) are slightly heavier at ~1.6 kg, just like the Lenovo Yoga Pro 9i at around 1,7 kg. The weight difference between the entry-level MBP 14 M3 and the more expensive M3 Pro & M3 Max SKUs is a result of the slimmed-down cooling solution with just one fan, the slightly smaller battery and the lack of the USB-C port at the right side.
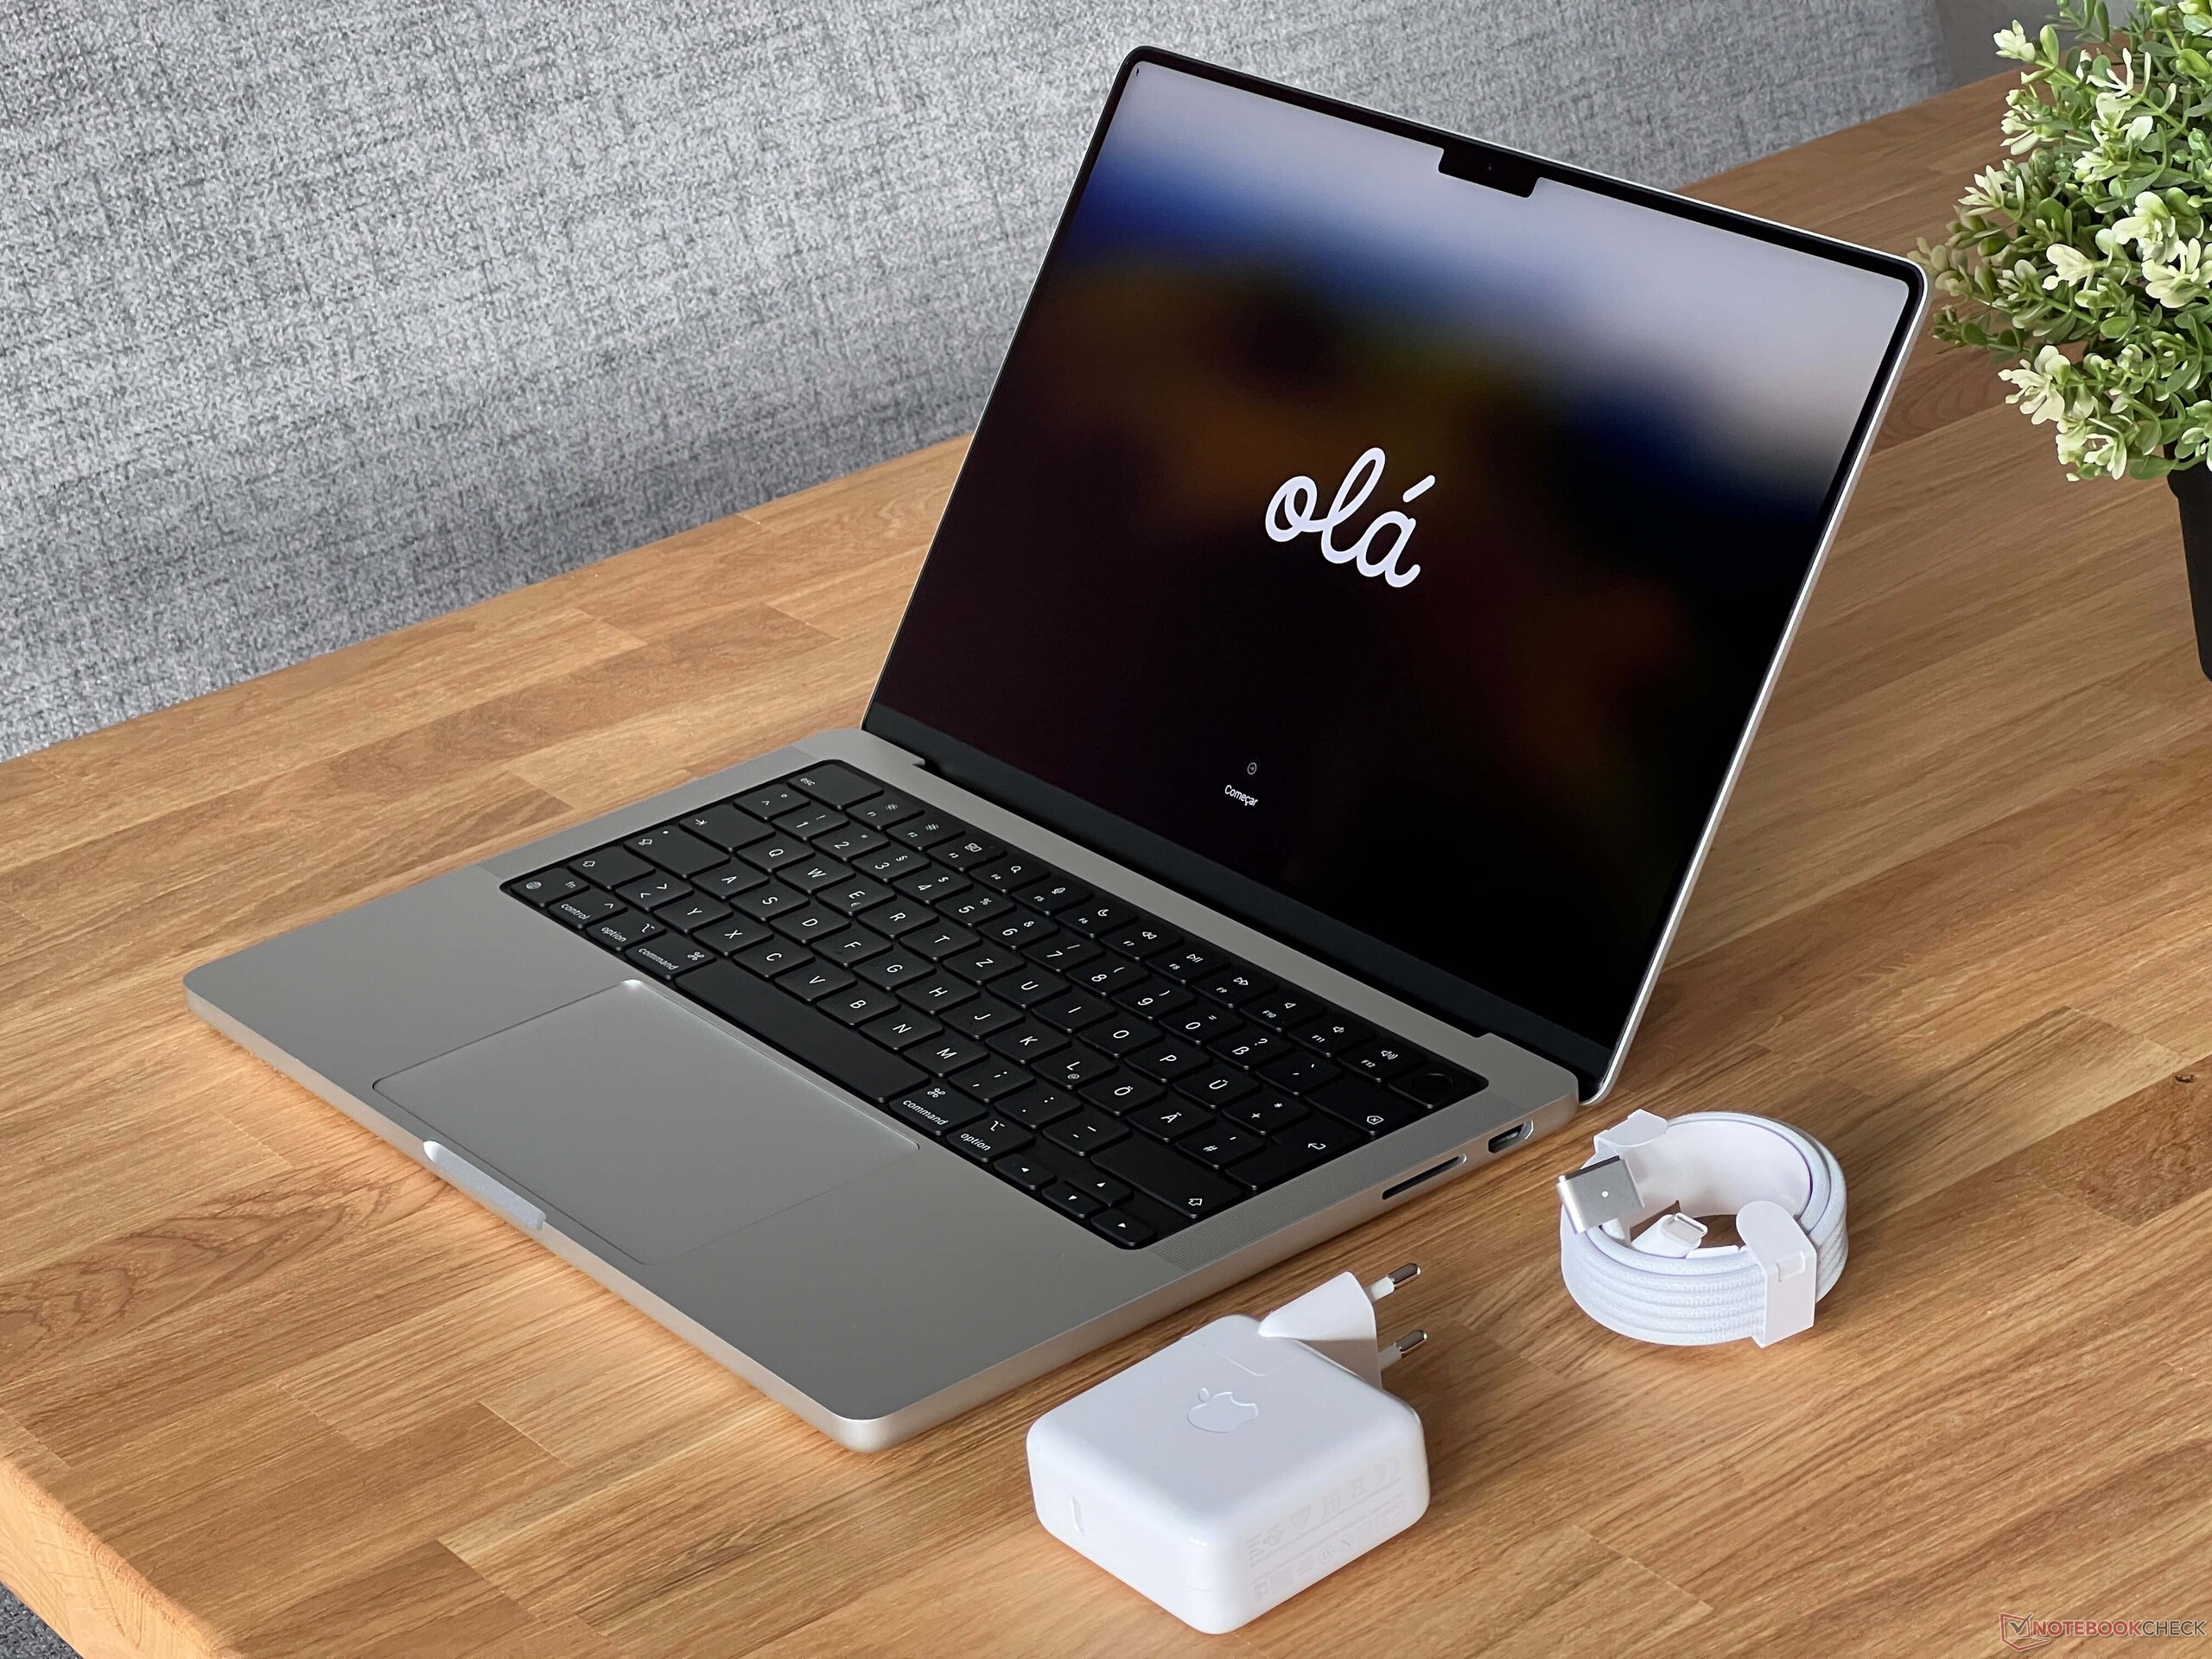
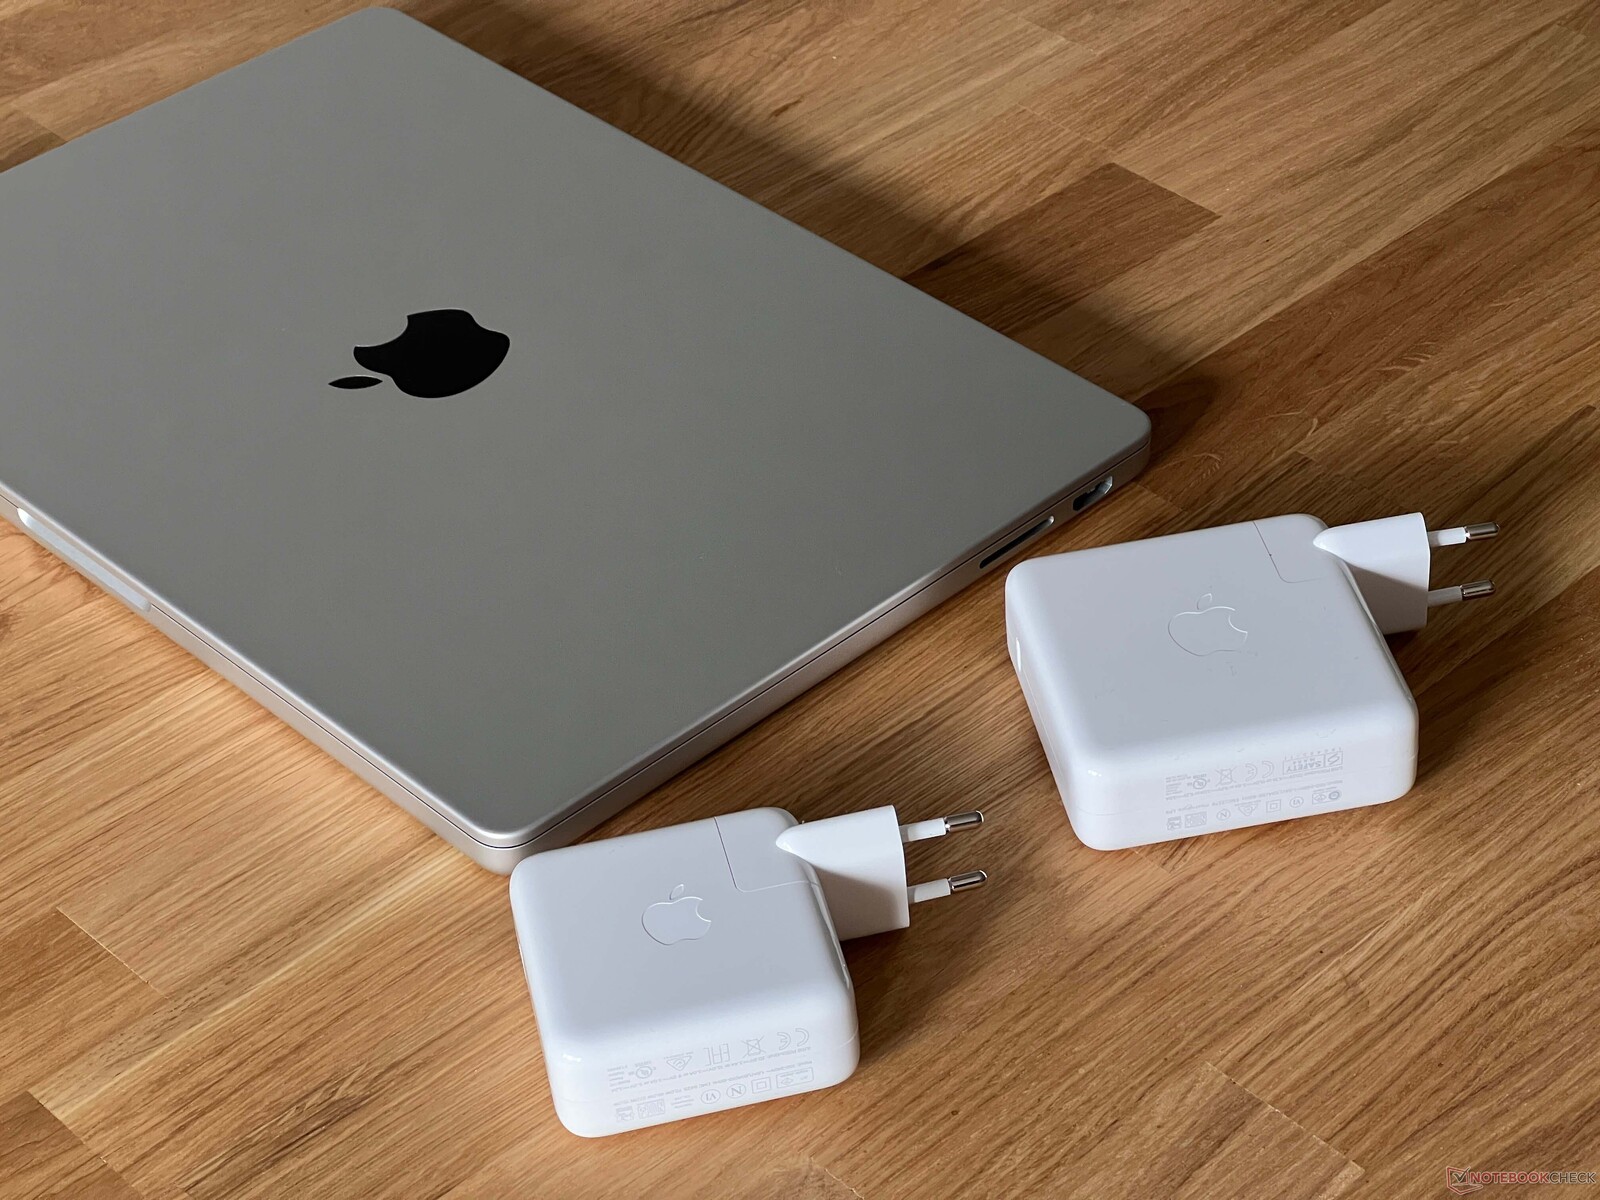
The base model is shipped with a 70-Watt MagSafe power adapter (236 grams). The optional 96-Watt adapter is noticeably bigger and heavier at 366 grams. You can also charge the MacBook Pro via USB-C.
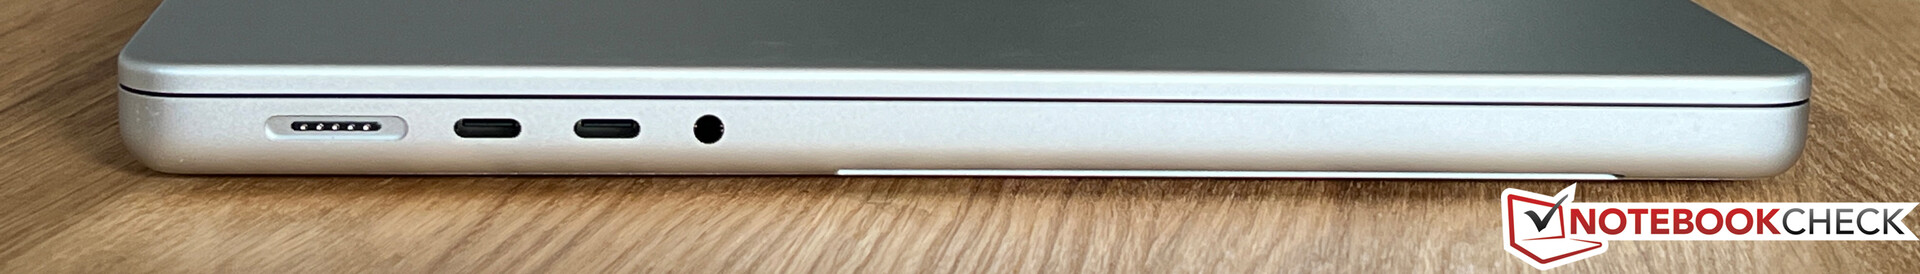
Connectivity - No Thunderbolt 4 for the base MBP 14
Looking at the port situation, the new base model of the MacBook Pro 14 is actually closer to the MacBook Air since the two USB-C ports on the left side support USB 4, but only Thunderbolt 3 and the USB-C port on the right side is gone. It’s not all bad news though, because the new Pro offers HDMI as well as the SDXC card reader compared to the MacBook Air. Like on previous M2 based MacBooks, the new MacBook Pro M3 only supports one external screen (up to 6K @ 60 Hz) and the HDMI output is limited to 4K at 120 Hz. For comparison: The M3 Pro MBP 14 can drive two external screens and the HDMI port supports 8K at 60 Hz or 4K at 240 Hz, respectively; the M3 Max can drive up to four external screens.
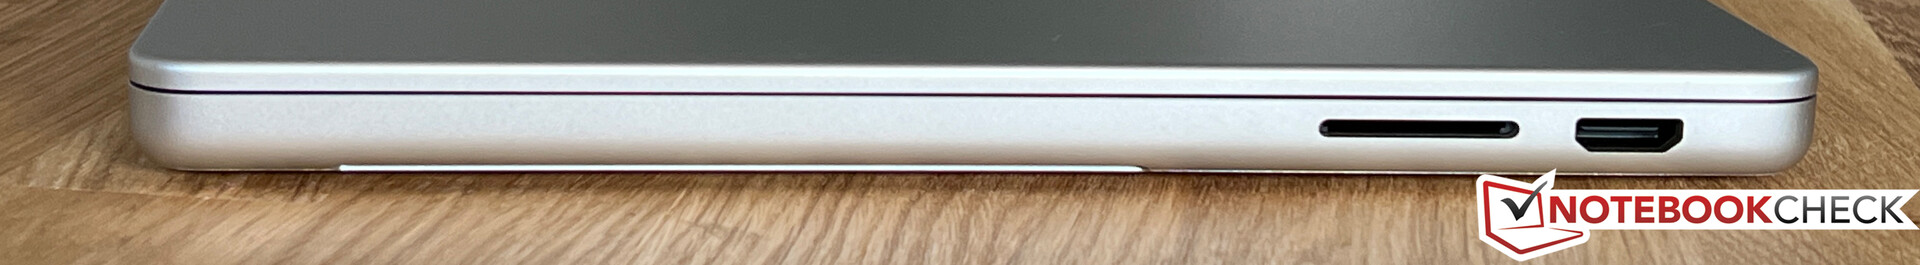
SD Card Reader
The SDXC card reader on the right side is still very fast and we determined up to 230 MB/s with our reference card (Angelbird AV Pro V60) and still 146 MB/s when we copied image files from the card, which is a good result as well. Inserted cards protrude by around 1.5 cm.
| SD Card Reader | |
| average JPG Copy Test (av. of 3 runs) | |
| Apple MacBook Pro 14 2023 M2 Pro (AV Pro V60) | |
| Gigabyte Aero 14 OLED BMF | |
| Apple MacBook Pro 14 2023 M3 (Angelibrid AV Pro V60) | |
| Average of class Multimedia (17.6 - 205, n=61, last 2 years) | |
| Lenovo Yoga Pro 9-14IRP G8 (Angelbird AV Pro V60) | |
| SCHENKER Vision 14 2023 (Angelbird AV Pro V60) | |
| maximum AS SSD Seq Read Test (1GB) | |
| Apple MacBook Pro 14 2023 M3 (Angelibrid AV Pro V60) | |
| Apple MacBook Pro 14 2023 M2 Pro (AV Pro V60) | |
| Gigabyte Aero 14 OLED BMF | |
| Average of class Multimedia (16.8 - 266, n=57, last 2 years) | |
| Lenovo Yoga Pro 9-14IRP G8 (Angelbird AV Pro V60) | |
| SCHENKER Vision 14 2023 (Angelbird AV Pro V60) | |
Communication
Apple still uses last year’s Wi-Fi 6E module including Bluetooth 5.3 and the overall performance is very good, even though there were some fluctuations of the transfer rates in combination with our reference router from Asus. However, there are no limitations and we did not experience any problems with large downloads or bad reception. Apple does not offer Wi-Fi 7 modules yet.
| Networking | |
| Apple MacBook Pro 14 2023 M3 | |
| iperf3 transmit AXE11000 |
|
| iperf3 receive AXE11000 |
|
| Apple MacBook Pro 13 2022 M2 | |
| iperf3 transmit AXE11000 |
|
| iperf3 receive AXE11000 |
|
| Huawei MateBook X Pro 2023 | |
| iperf3 transmit AXE11000 |
|
| iperf3 receive AXE11000 |
|
| iperf3 transmit AXE11000 6GHz |
|
| iperf3 receive AXE11000 6GHz |
|
| Lenovo Yoga Pro 9-14IRP G8 | |
| iperf3 transmit AXE11000 |
|
| iperf3 receive AXE11000 |
|
| Gigabyte Aero 14 OLED BMF | |
| iperf3 transmit AXE11000 |
|
| iperf3 receive AXE11000 |
|
| iperf3 transmit AXE11000 6GHz |
|
| iperf3 receive AXE11000 6GHz |
|
| Apple MacBook Pro 14 2023 M2 Pro | |
| iperf3 transmit AXE11000 6GHz |
|
| iperf3 receive AXE11000 6GHz |
|
| SCHENKER Vision 14 2023 | |
| iperf3 transmit AXE11000 |
|
| iperf3 receive AXE11000 |
|
Webcam
The image quality of the 1080p webcam is still good, but not comparable to front cameras on iPads. Face-ID or Center Stage are still not available, either.


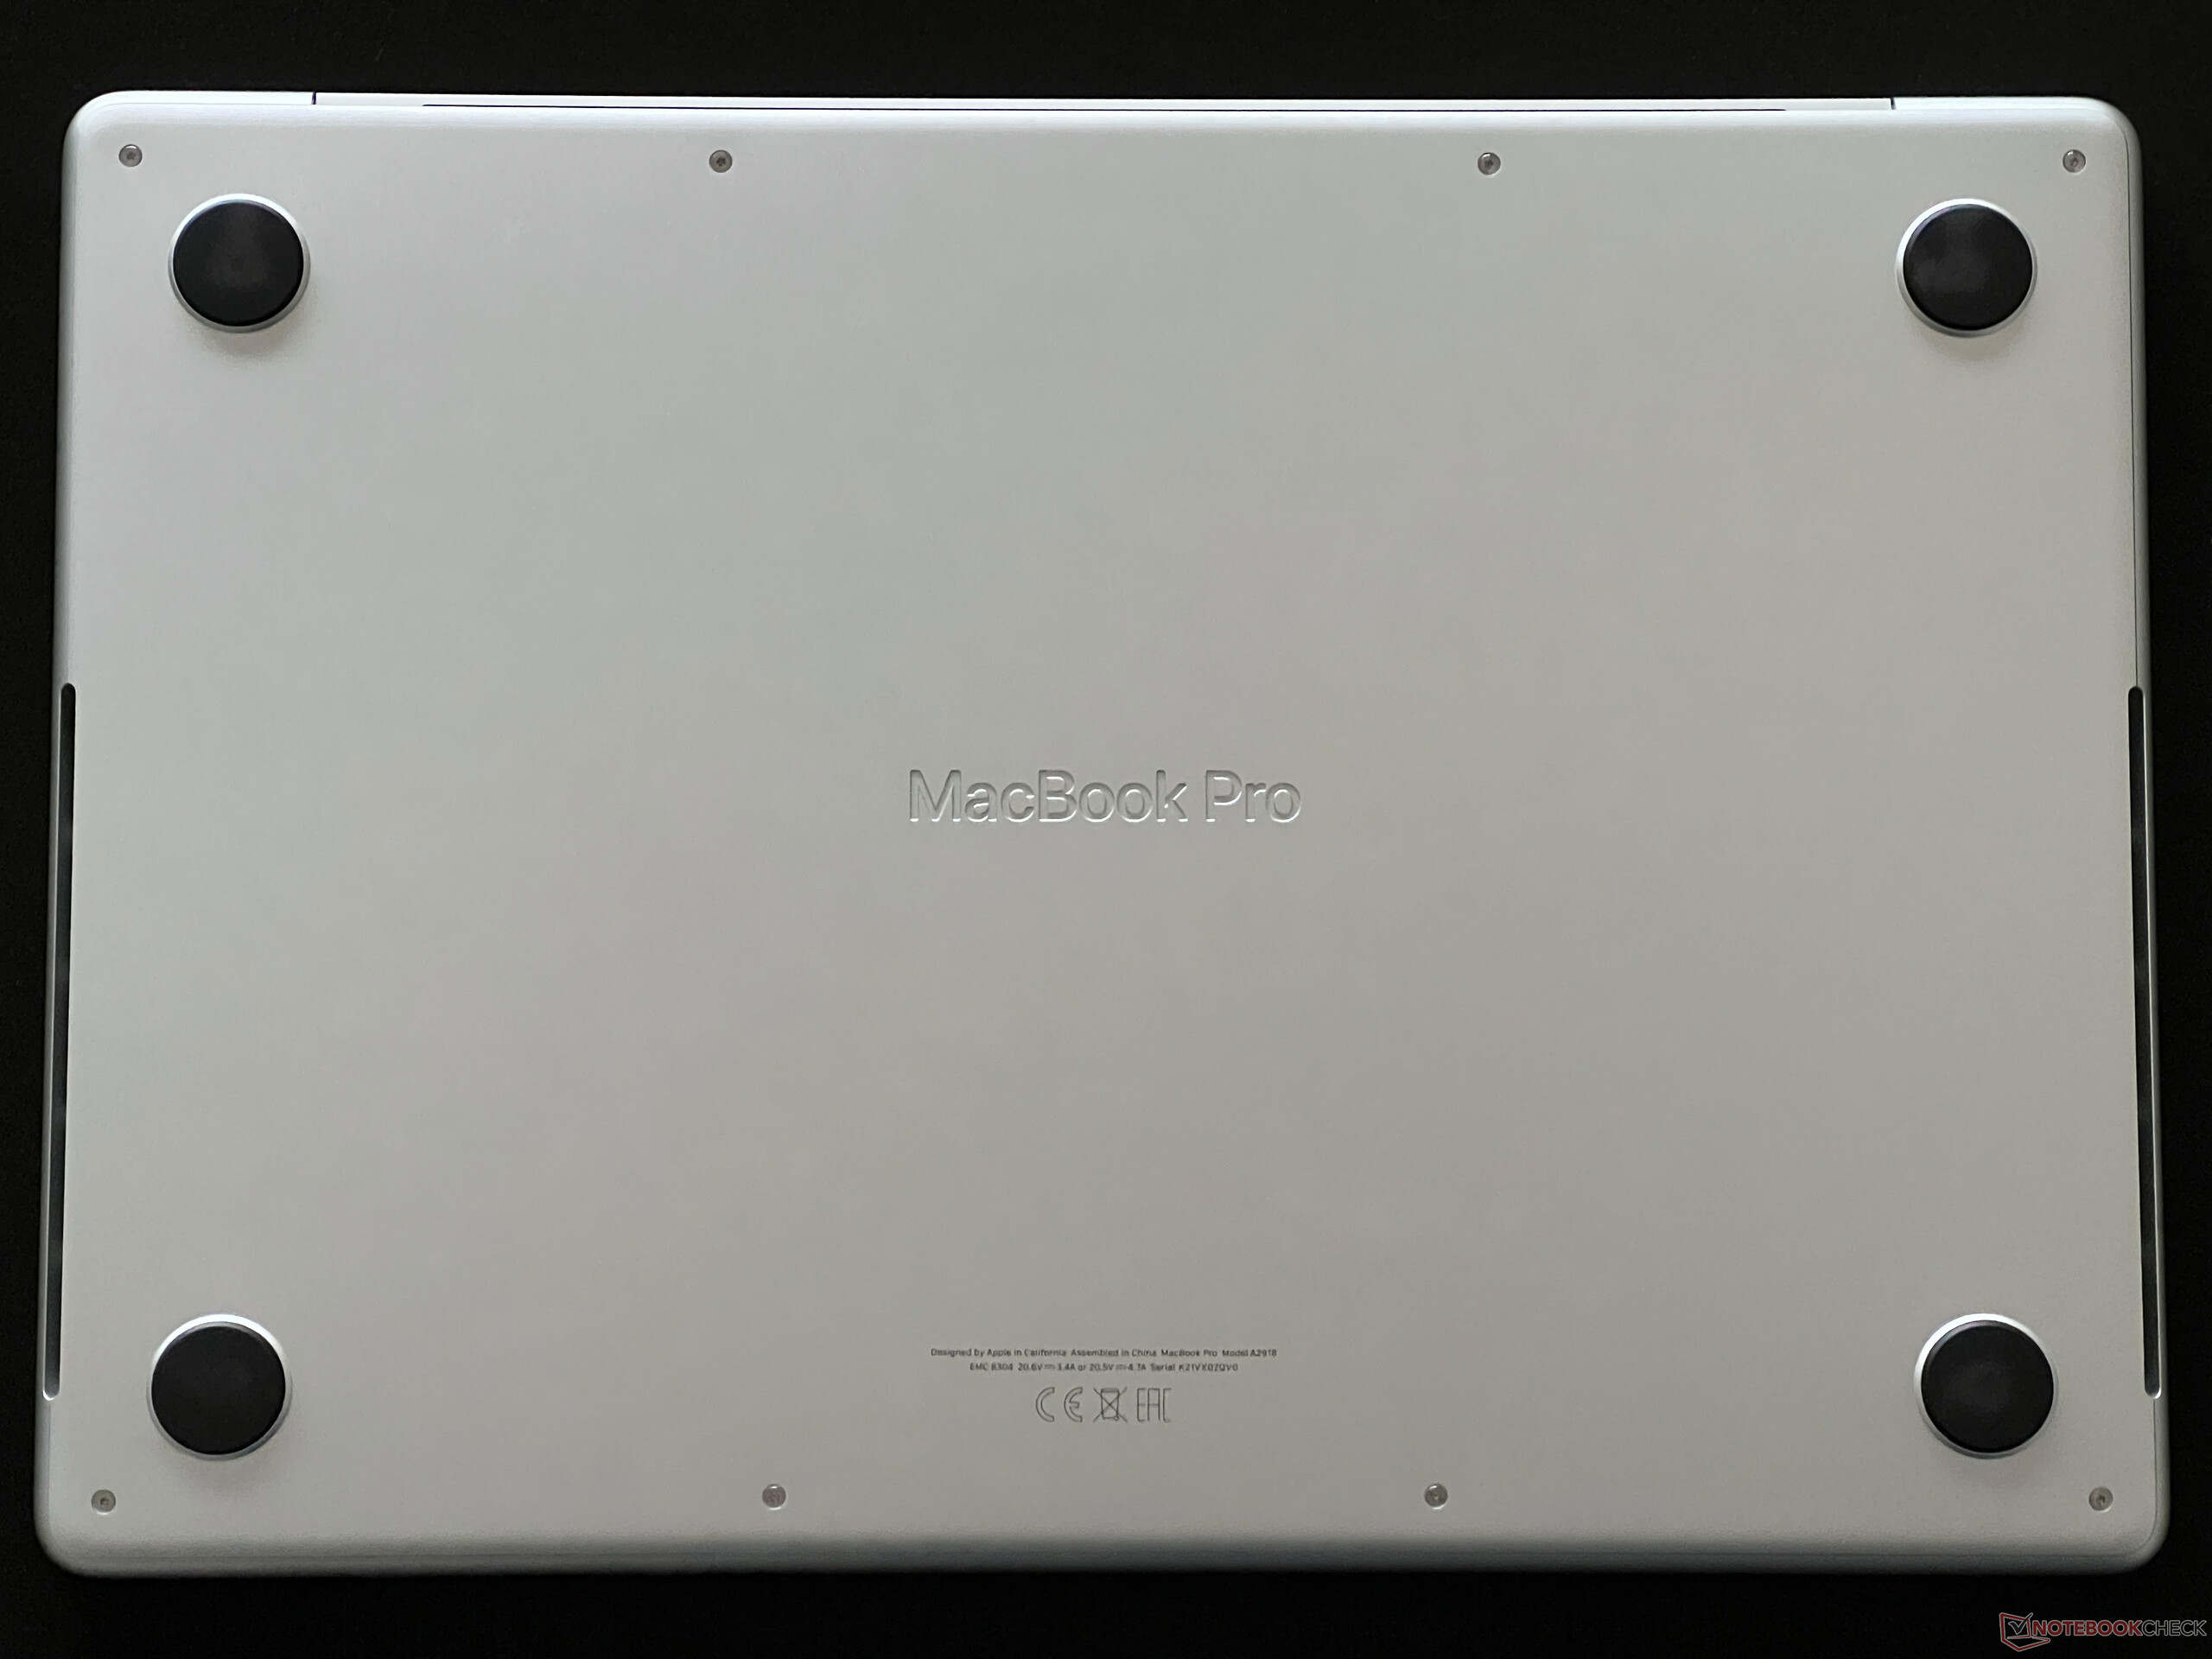
Maintenance
The bottom panel is secured by Pentalobe screws (P5) as well as small metal hooks at the back, which means you have to push the cover towards the front once you removed all the screws. There are also two clamps in the middle of the sides that require some force (we recommend a suction cup). There is not much to do once you are inside, only the fan can be cleaned by the user. All other components are soldered and you cannot upgrade any components.
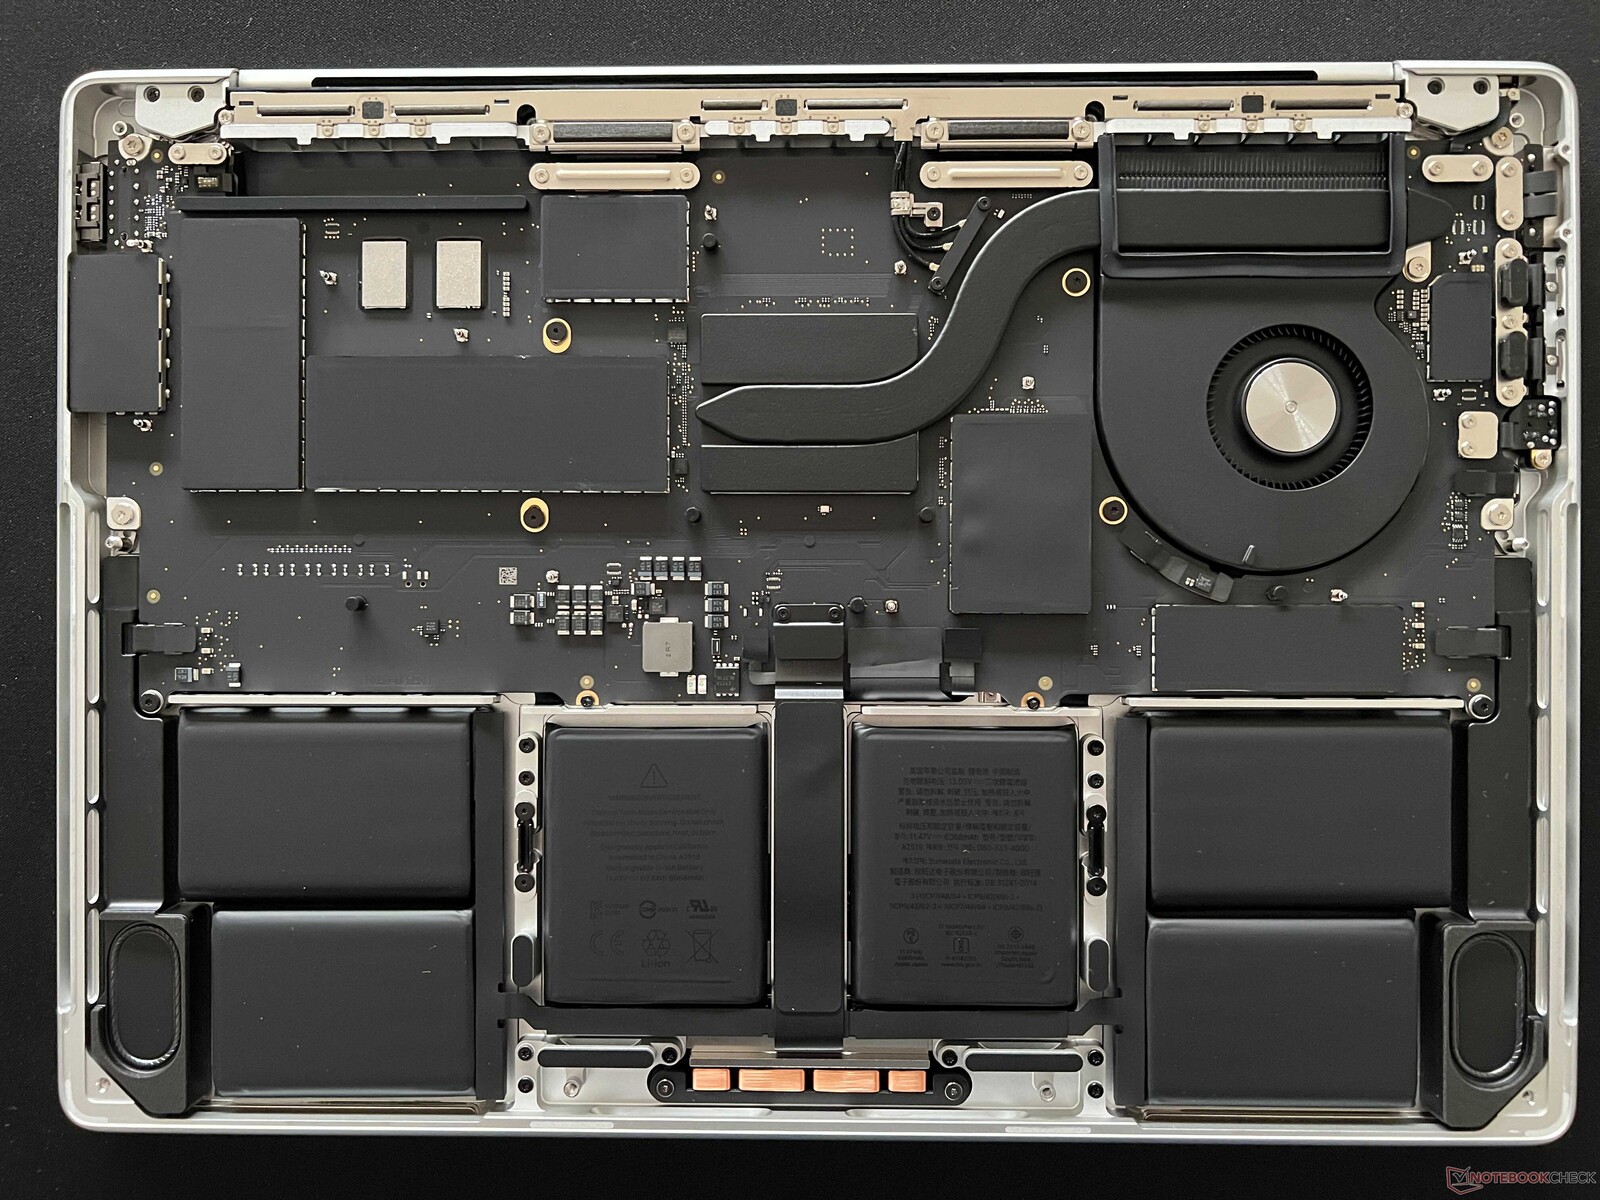
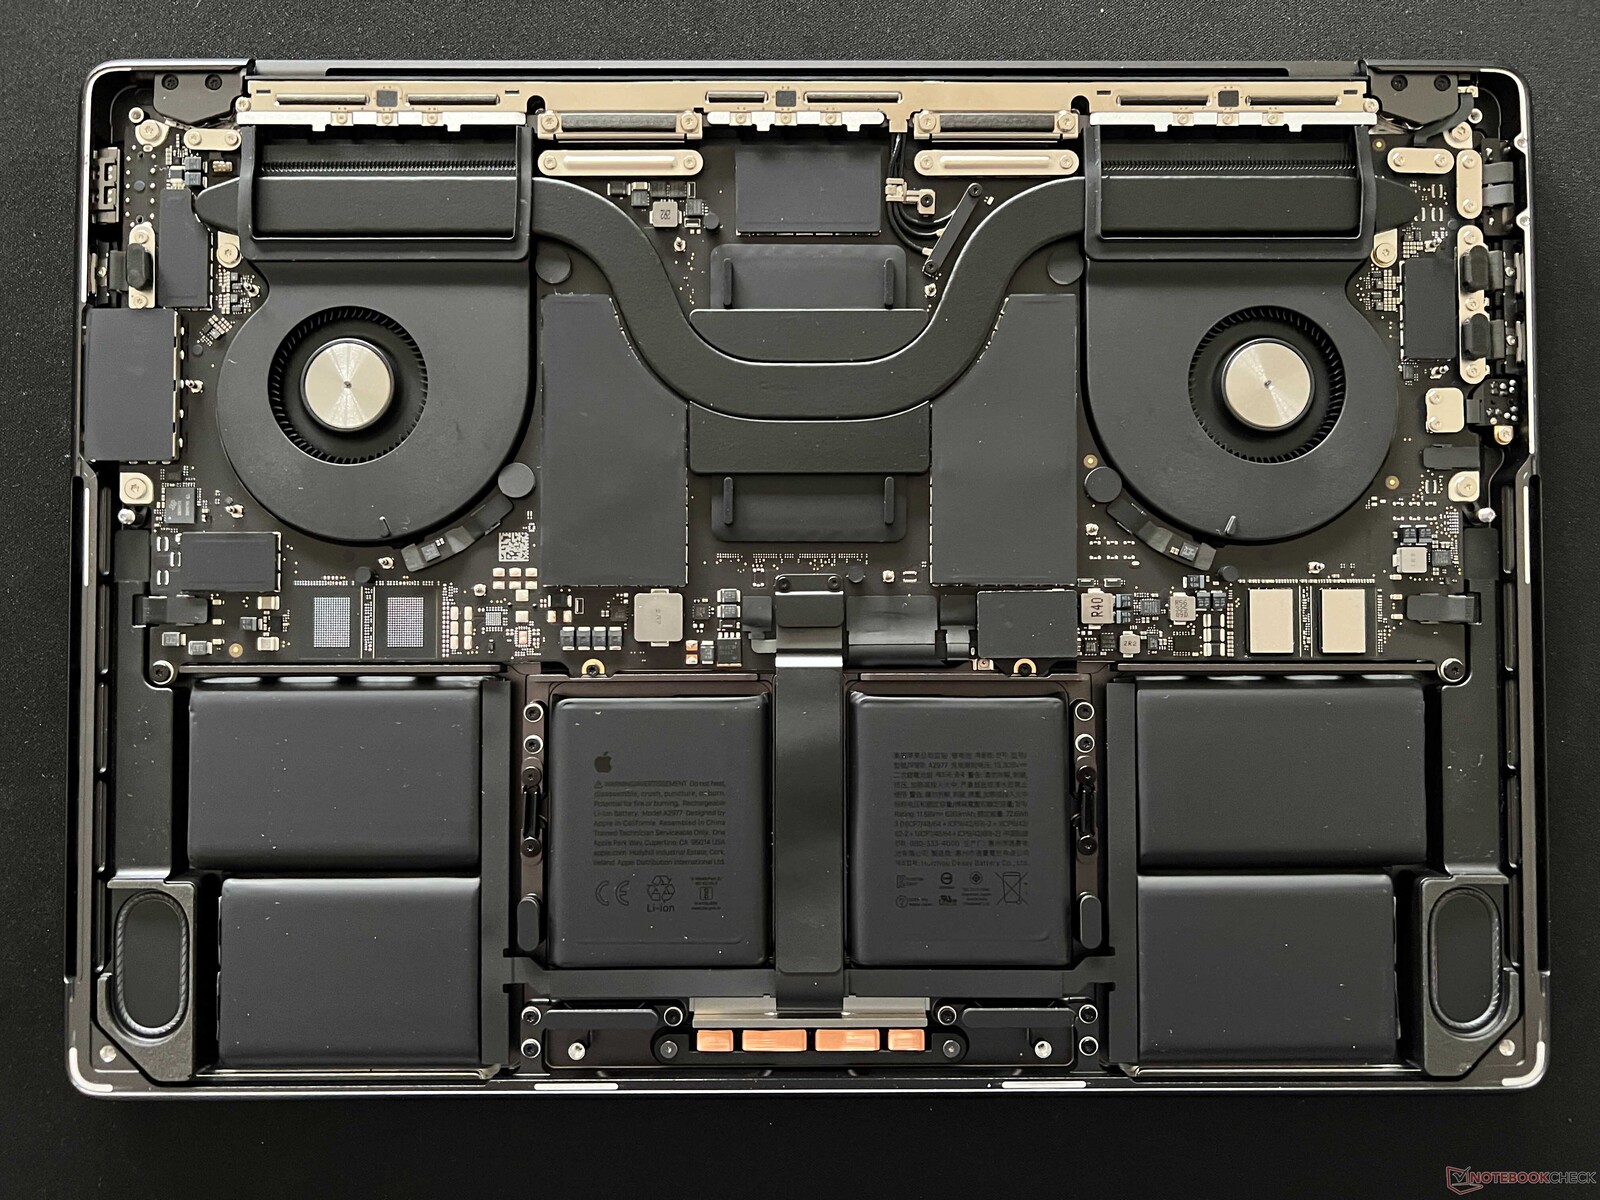
A direct comparison to the MacBook Pro 14 M3 Max (also M3 Pro) immediately shows the massive difference of the internal layout since the second fan is missing on the new base model. Everything looks nice and is hidden underneath covers, but Apple wastes a lot of space here and we do not see the reason for the smaller battery compared to the more powerful MBP 14 models.
Warranty
The base warranty for the MacBook Pro is one year. You can purchase a warranty extension (Apple Care+) for three years, which costs $279. This also includes costs for accidental damage (each subject to a service fee of $99 for screen damage or external enclosure damage, or $299 for other accidental damage). It is also possible to pay $99 per year for AppleCare+.
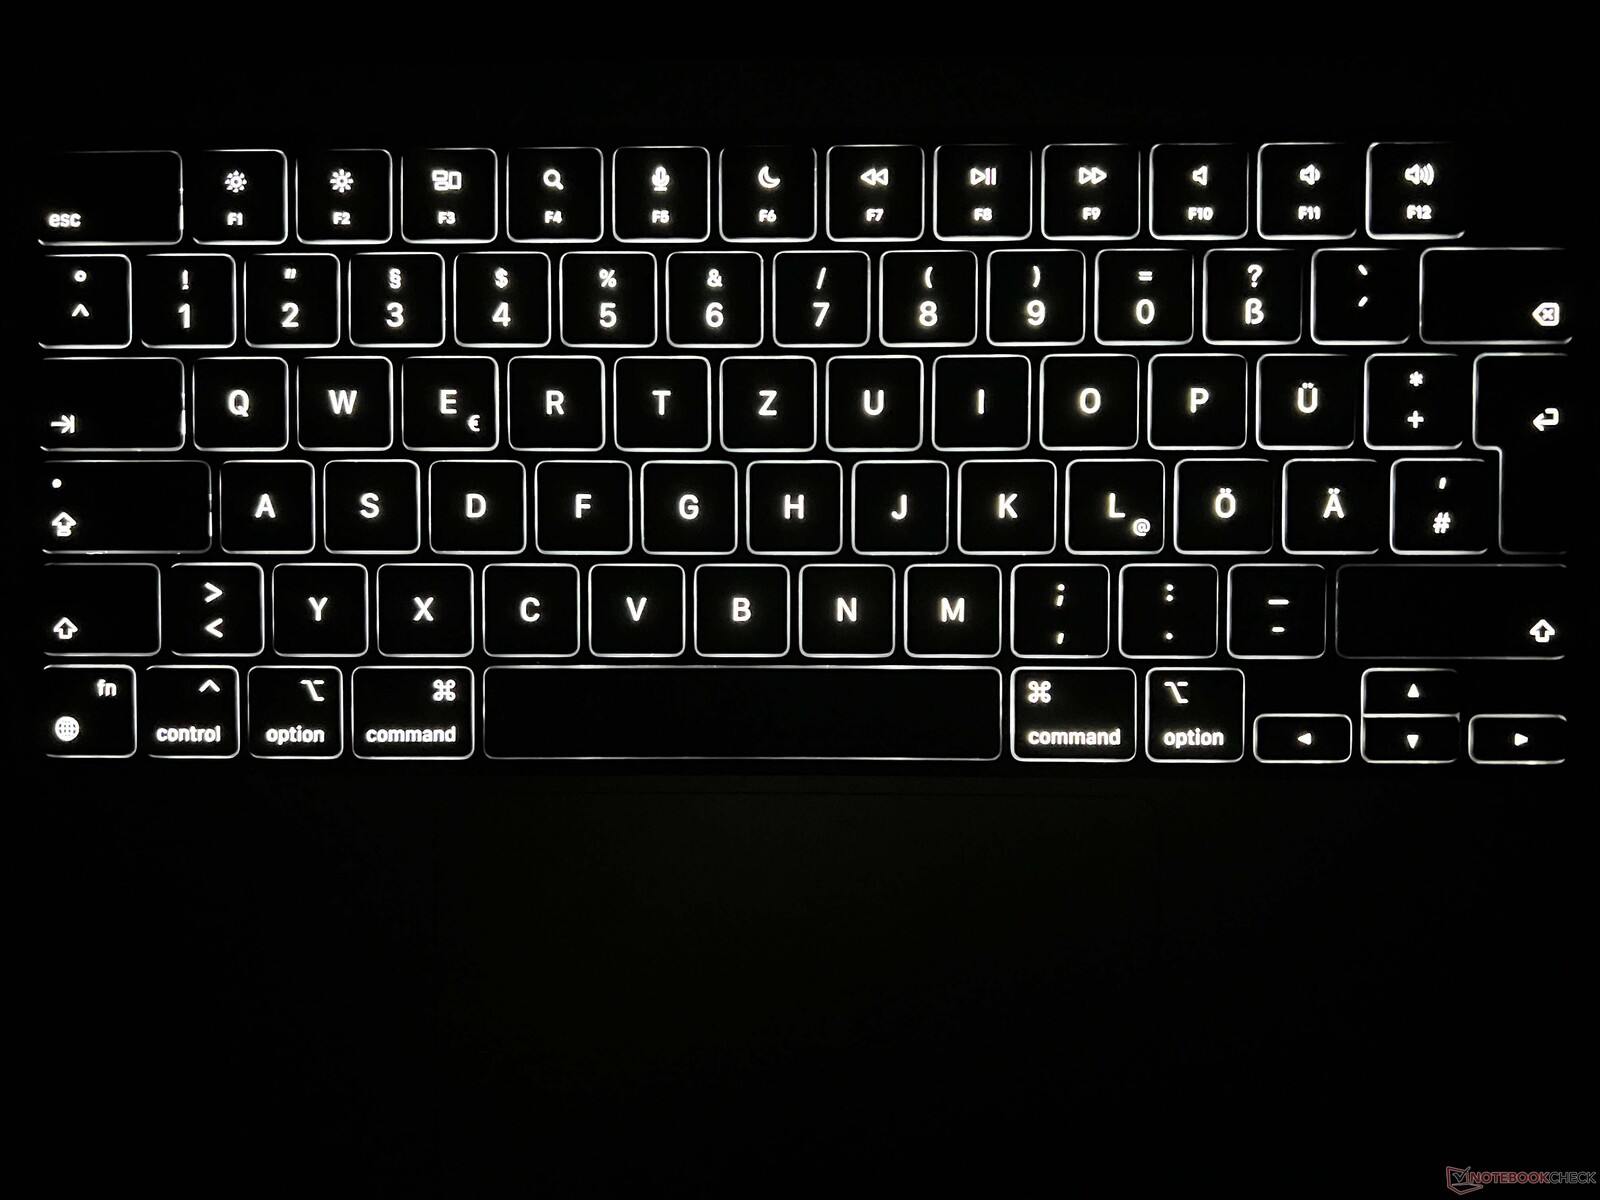
Input Devices - Perfect trackpad
The input devices are unchanged and the black keyboard still offers a comfortable and precise typing experience despite the comparatively shallow travel. There is still room for improvements compared to the best business laptops, but it is no problem to type for longer periods. The key strokes could also be a bit quieter and the arrow keys are very small. The MacBook is still superior to Windows laptops in terms of keyboard illumination, even after all these years. The brightness can be adjusted very precisely and both the automatic activation as well as intensity based on the ambient lighting work perfectly.
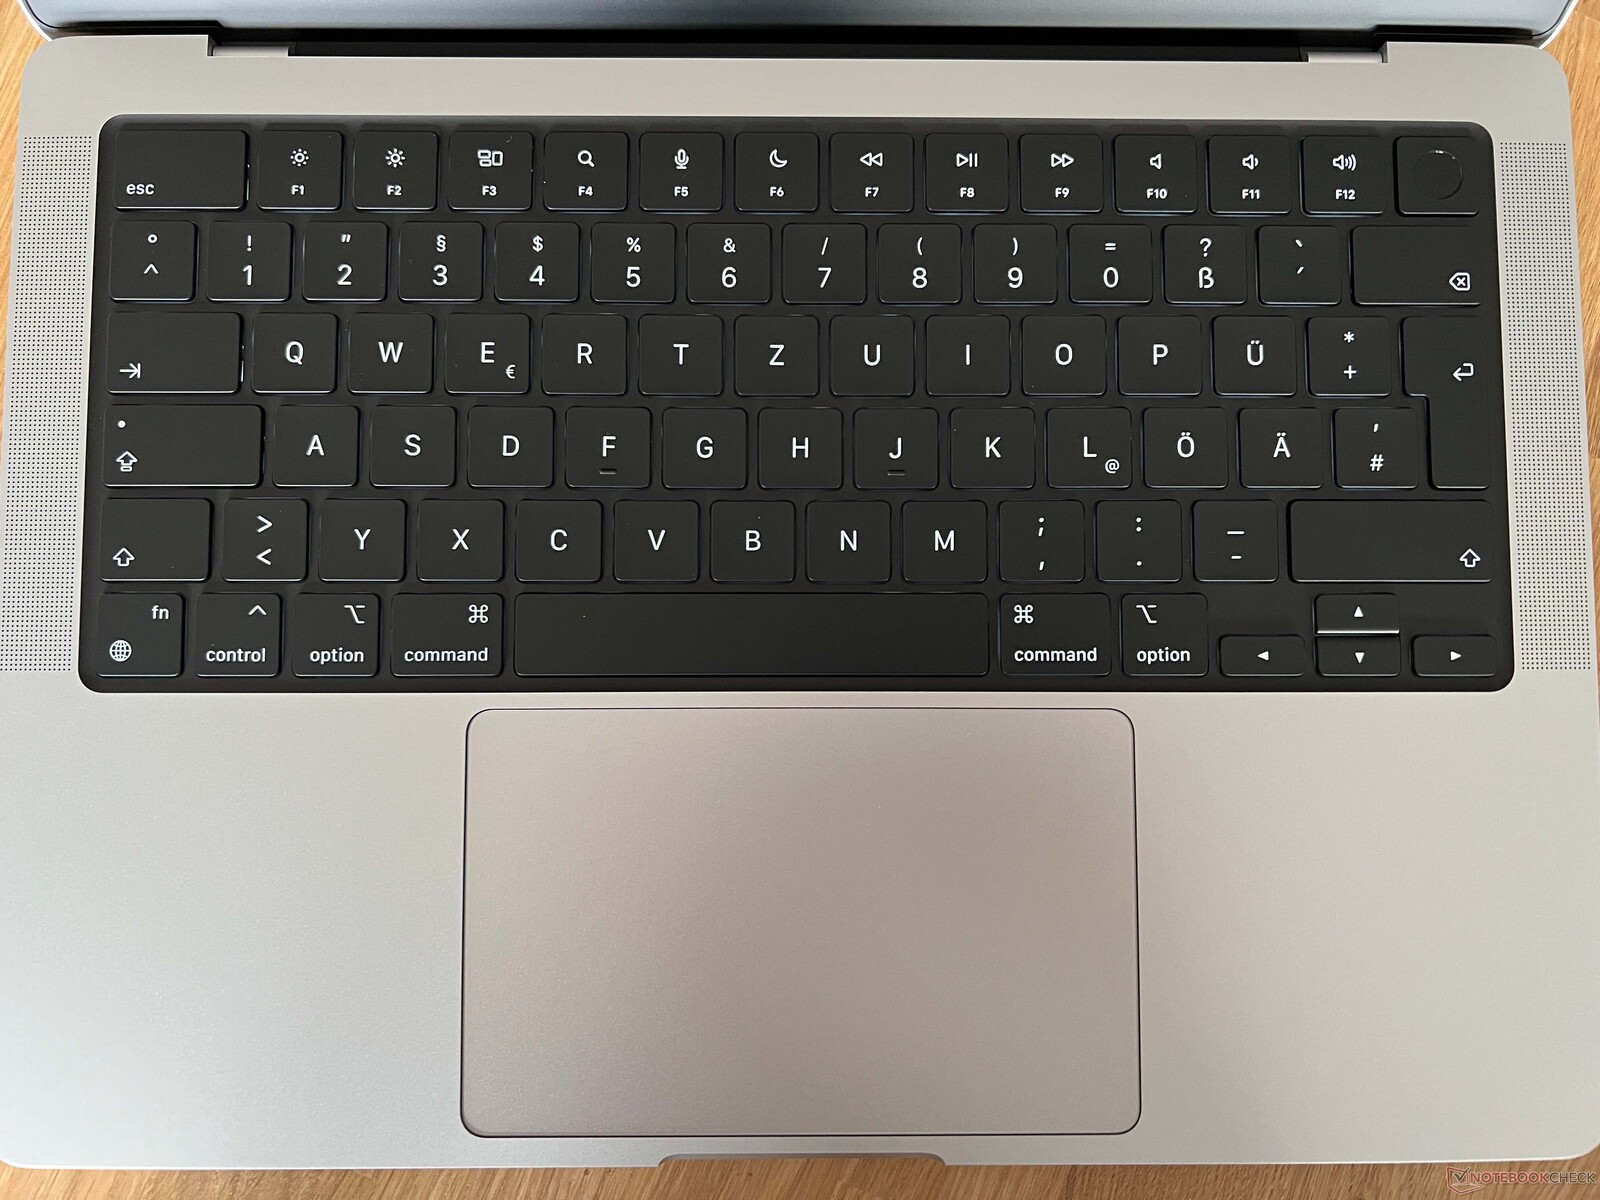
The trackpad has been the benchmark for years and the implementation with macOS is just excellent. The clicking experience is also completely identical anywhere you touch since there are no moving parts. macOS also offers plenty of customization.
Display - Mini-LED now with increased SDR brightness
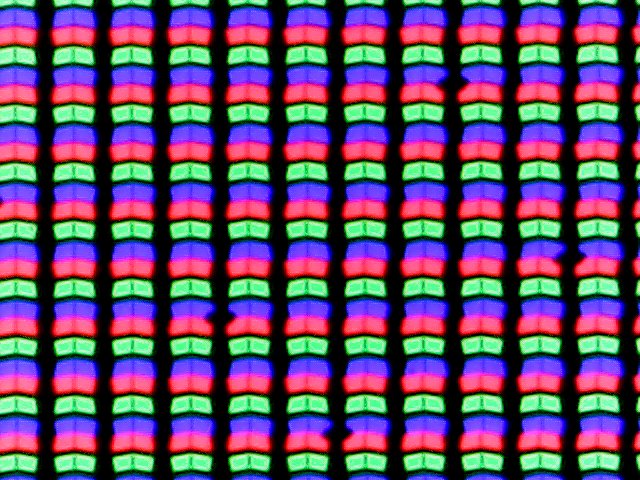
The basic specs of the Mini-LED panel inside the MacBook Pro 14 did not change. The camera notch in the middle still does not look very good, but does not take any space from the 16:10 panel. The vertical area next to the notch (which is used for menu elements) has been added on top, which results in a resolution of 3024 x 1964 pixels. This means you have slightly more room compared to a regular 16:10 panel. The subjective picture quality is still excellent and benefits from the high refresh rate (120 Hz), which is dynamically applied by the system if necessary. Black contents are also pure black (like OLED screens), which creates an extremely high contrast ratio. The only drawback is clouding when bright objects appear on dark backgrounds. This is mainly noticeable when logos are shown and you can obviously provoke this issue, but is usually not noticeable in practice. Both the brightness as well as the color temperature (True Tone) can automatically be adjusted based on the ambient lighting, which works flawlessly. There are no scaling issues in macOS, either.
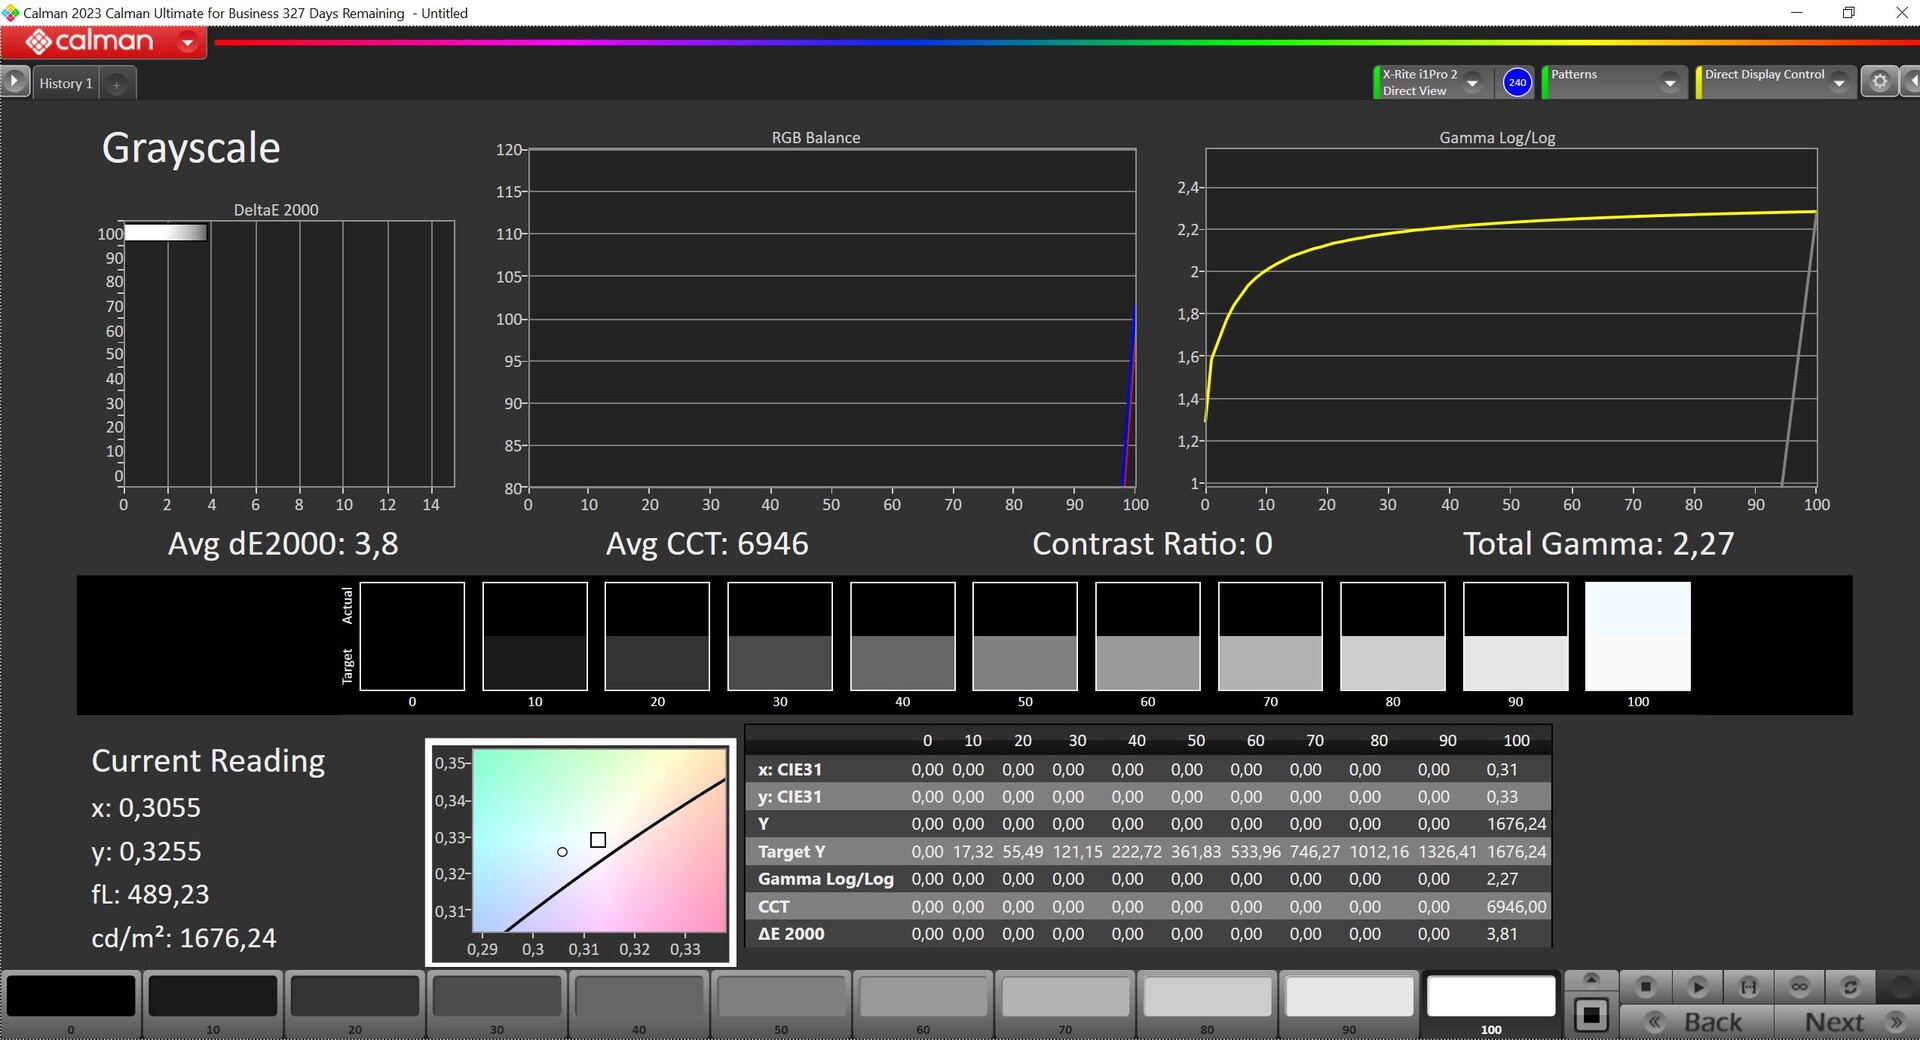
Apple claims the maximum SDR brightness was raised from 500 to 600 nits and we can confirm that with a maximum brightness of 631 nits (605nits on average) on our test model. The black value is 0, so the contrast ratio is extremely high. Apple has a big advantage over most Windows devices in terms of maximum HDR brightness (up to 1676 nits with a 10 % window, full-screen 1156 nits) as well as the implementation of HDR content. The panel simply increases the brightness when display contents require it and users do not have to change any settings. Windows users can only dream of this right now. The Mini-LED rival Lenovo Yoga 9i can keep up nicely (~700 nits SDR brightness, up to ~1400 nits HDR brightness) and even covers the wider AdobeRGB color gamut.
| |||||||||||||||||||||||||
Brightness Distribution: 93 %
Center on Battery: 631 cd/m²
Contrast: ∞:1 (Black: 0 cd/m²)
ΔE Color 2.9 | 0.5-29.43 Ø5.1, calibrated: 2
ΔE Greyscale 3.6 | 0.57-98 Ø5.3
99.2% Display P3 (Argyll 2.2.0 3D)
Gamma: 2.44
| Apple MacBook Pro 14 2023 M3 Mini-LED, 3024x1964, 14.20 | Apple MacBook Pro 14 2023 M2 Pro Mini-LED, 3024x1964, 14.20 | Apple MacBook Pro 13 2022 M2 IPS, 2560x1600, 13.30 | Huawei MateBook X Pro 2023 TMX1422, IPS, 3120x2080, 14.20 | Lenovo Yoga Pro 9-14IRP G8 CSOT T3 MNE507HZ2-1, Mini-LED, 3072x1920, 14.50 | Gigabyte Aero 14 OLED BMF Samsung SDC4192 (ATNA40YK14-0), OLED, 2880x1800, 14.00 | SCHENKER Vision 14 2023 CSOT T3 MNE007ZA1-3, IPS, 2880x1800, 14.00 | |
|---|---|---|---|---|---|---|---|
| Display | 0% | 0% | -9% | -7% | 1% | -25% | |
| Display P3 Coverage | 99.2 | 99.2 0% | 98.8 0% | 89.8 -9% | 92 -7% | 99.8 1% | 74.7 -25% |
| sRGB Coverage | 100 | 99.4 | 99.7 | 100 | 99.6 | ||
| AdobeRGB 1998 Coverage | 87.9 | 84.2 | 96.9 | 88.7 | 75.8 | ||
| Response Times | 38% | 265% | 370% | 36% | 32% | 67% | |
| Response Time Grey 50% / Grey 80% * | 69 ? | 35.2 ? 49% | 42 ? 39% | 20 ? 71% | 12.7 ? 82% | 2.4 ? 97% | 32.2 ? 53% |
| Response Time Black / White * | 75.2 ? | 26.4 ? 65% | 27.8 ? 63% | 7 ? 91% | 11.4 ? 85% | 2.4 ? 97% | 15.4 ? 80% |
| PWM Frequency | 14878 ? | 14880 ? 0% | 117780 ? 692% | 156000 ? 949% | 6000 ? -60% | 300 -98% | |
| Screen | 20% | 28% | 4% | -2% | 32% | 8% | |
| Brightness middle | 631 | 500 -21% | 514 -19% | 595 -6% | 670 6% | 423 -33% | 402 -36% |
| Brightness | 605 | 489 -19% | 497 -18% | 550 -9% | 680 12% | 427 -29% | 371 -39% |
| Brightness Distribution | 93 | 94 1% | 93 0% | 85 -9% | 89 -4% | 98 5% | 86 -8% |
| Black Level * | 0.02 | 0.31 | 0.25 | 0.19 | 0.1 | 0.27 | |
| Colorchecker dE 2000 * | 2.9 | 1.2 59% | 1.1 62% | 2.01 31% | 4 -38% | 0.55 81% | 1.8 38% |
| Colorchecker dE 2000 max. * | 4.9 | 2.6 47% | 2.3 53% | 6.9 -41% | 4.5 8% | 1.15 77% | 3.6 27% |
| Colorchecker dE 2000 calibrated * | 2 | 0.6 70% | 1.22 39% | 1.3 35% | 1.15 42% | 1.5 25% | |
| Greyscale dE 2000 * | 3.6 | 1.7 53% | 1.8 50% | 2.74 24% | 4.9 -36% | 0.69 81% | 1.8 50% |
| Gamma | 2.44 90% | 2.24 98% | 2.23 99% | 2.4 92% | 2.22 99% | 2.42 91% | 2.27 97% |
| CCT | 6964 93% | 6791 96% | 6764 96% | 6319 103% | 5735 113% | 6479 100% | 6695 97% |
| Contrast | 25000 | 1658 | 2380 | 3526 | 4230 | 1489 | |
| Total Average (Program / Settings) | 19% /
23% | 98% /
90% | 122% /
103% | 9% /
8% | 22% /
29% | 17% /
17% |
* ... smaller is better
We analyzed the Mini-LED panel with the professional CalMAN Ultimate software (X-Rite i1 Pro 2, CalMAN Patterns) and the factory calibration is worse compared to the previous MacBook Pro 14. Both the grayscale as well as the colors show deviations of more than 3 compared to the P3 reference color space. We also see a minor clue cast in combination with a slightly cool color temperature. You will not notice when you use True Tone though.
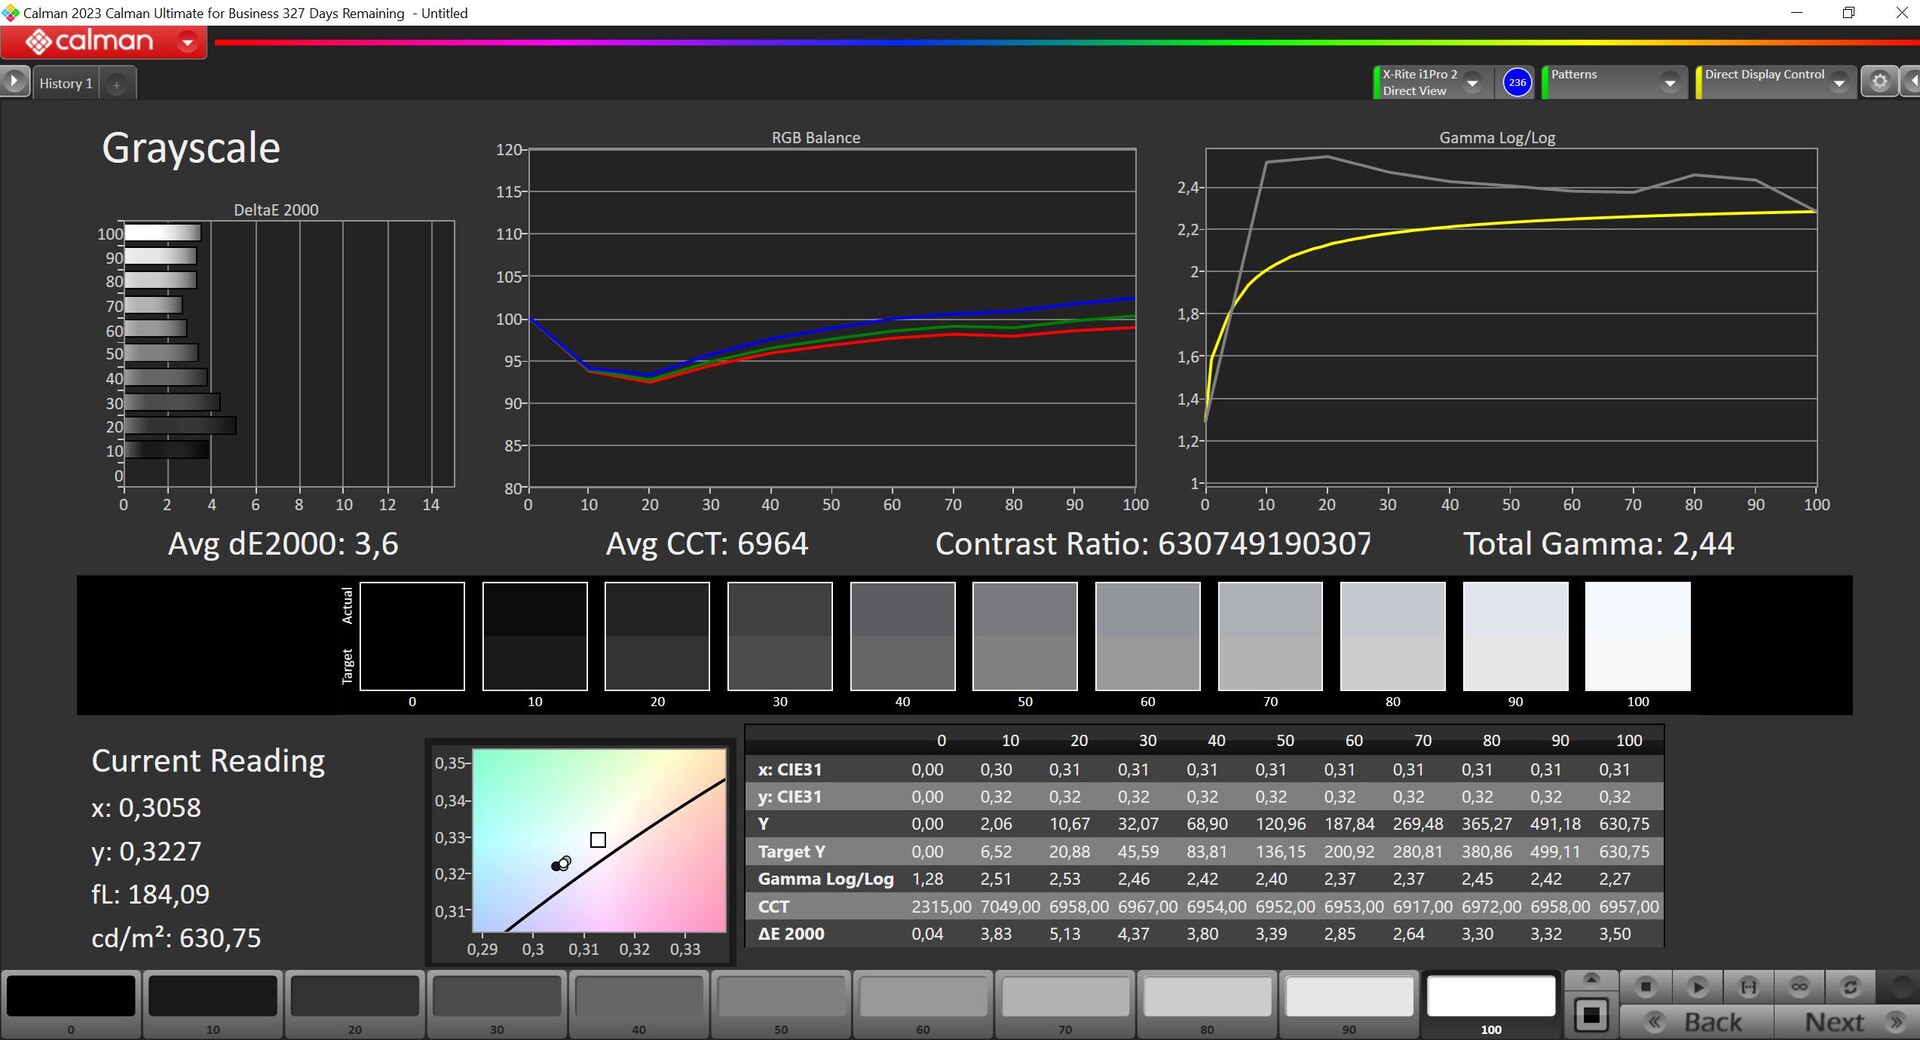
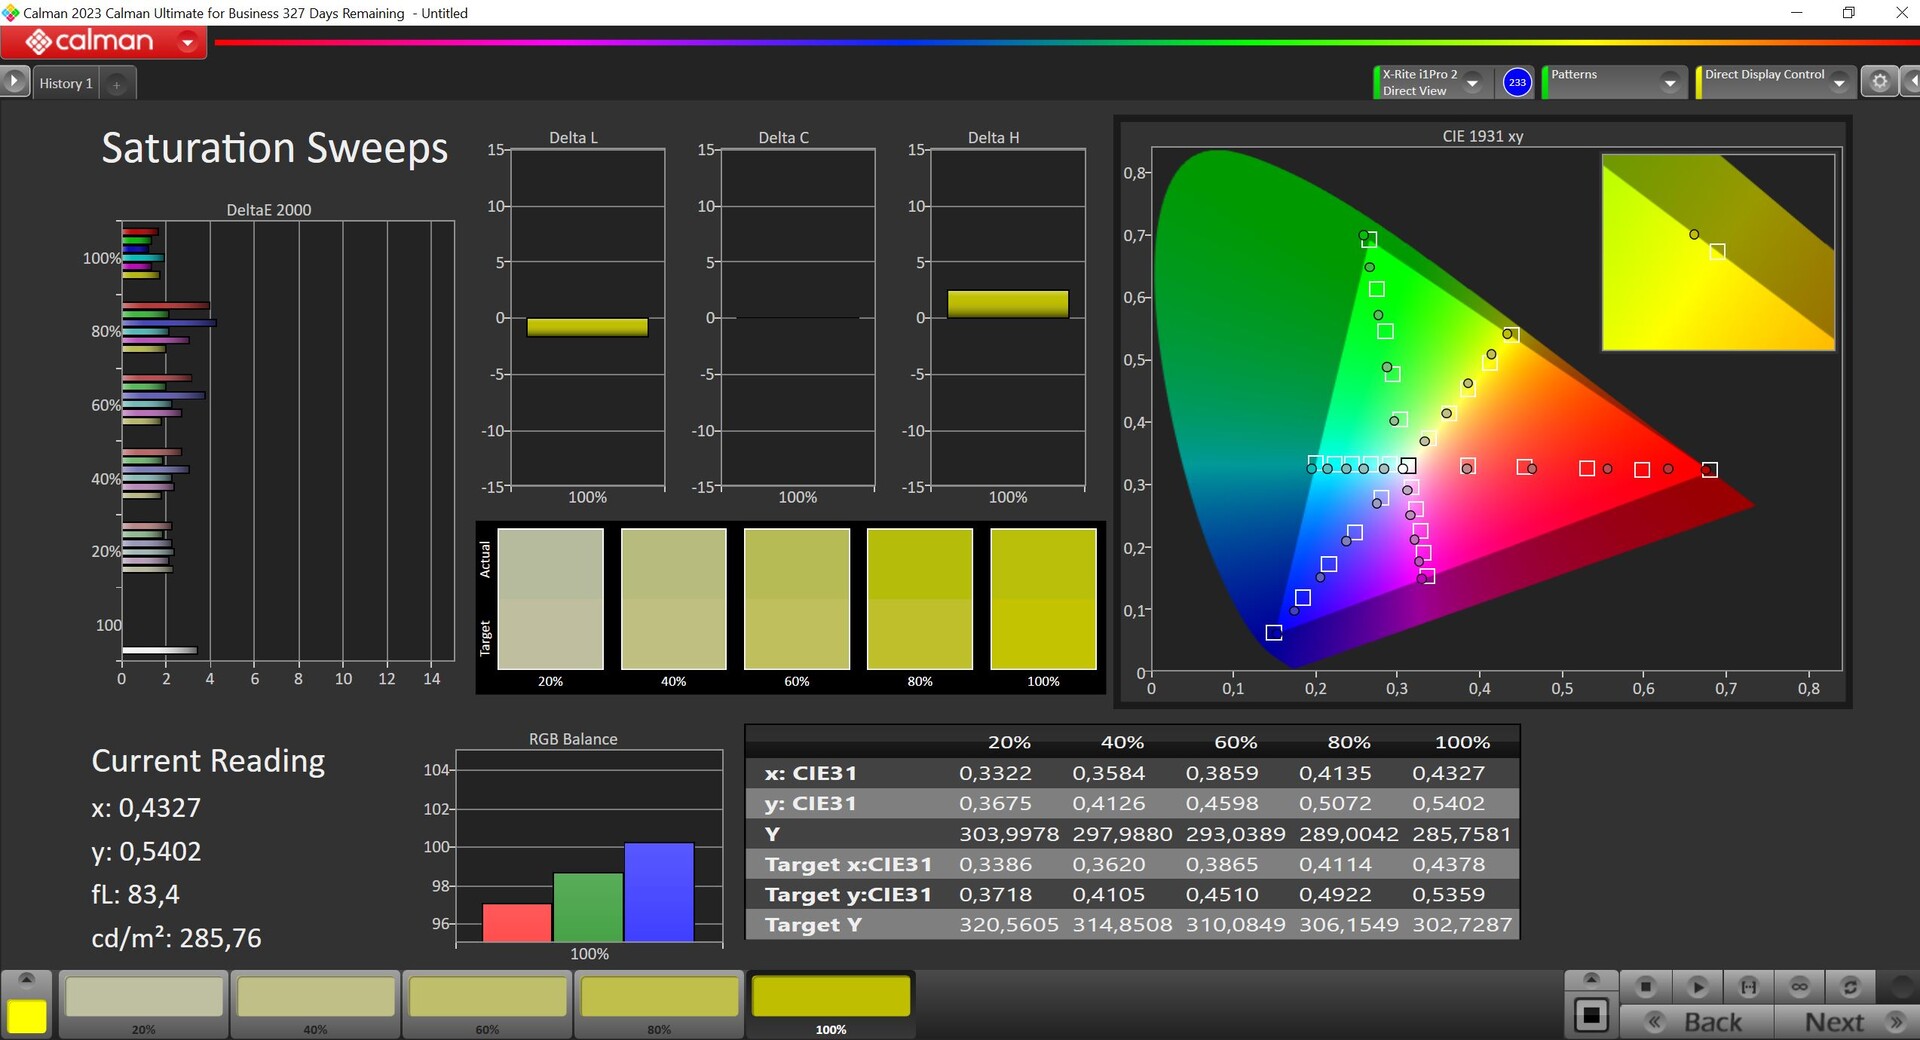
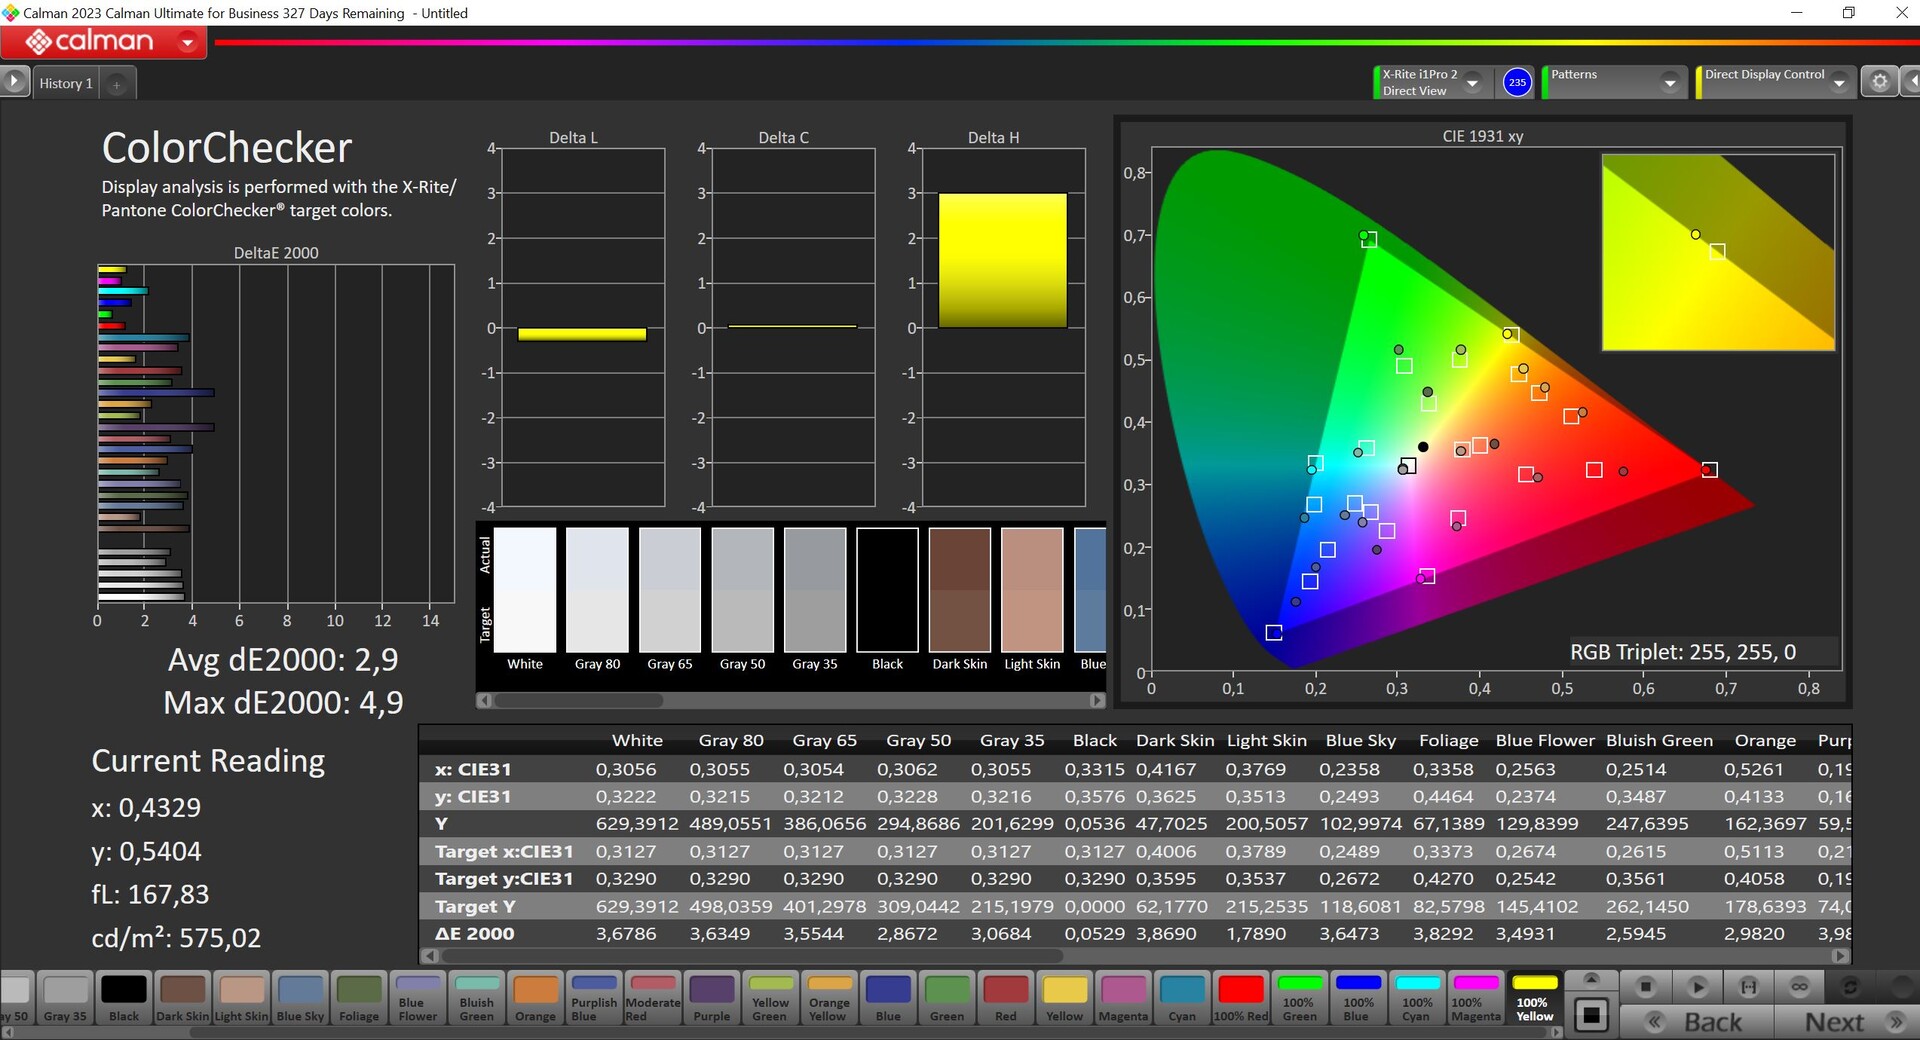
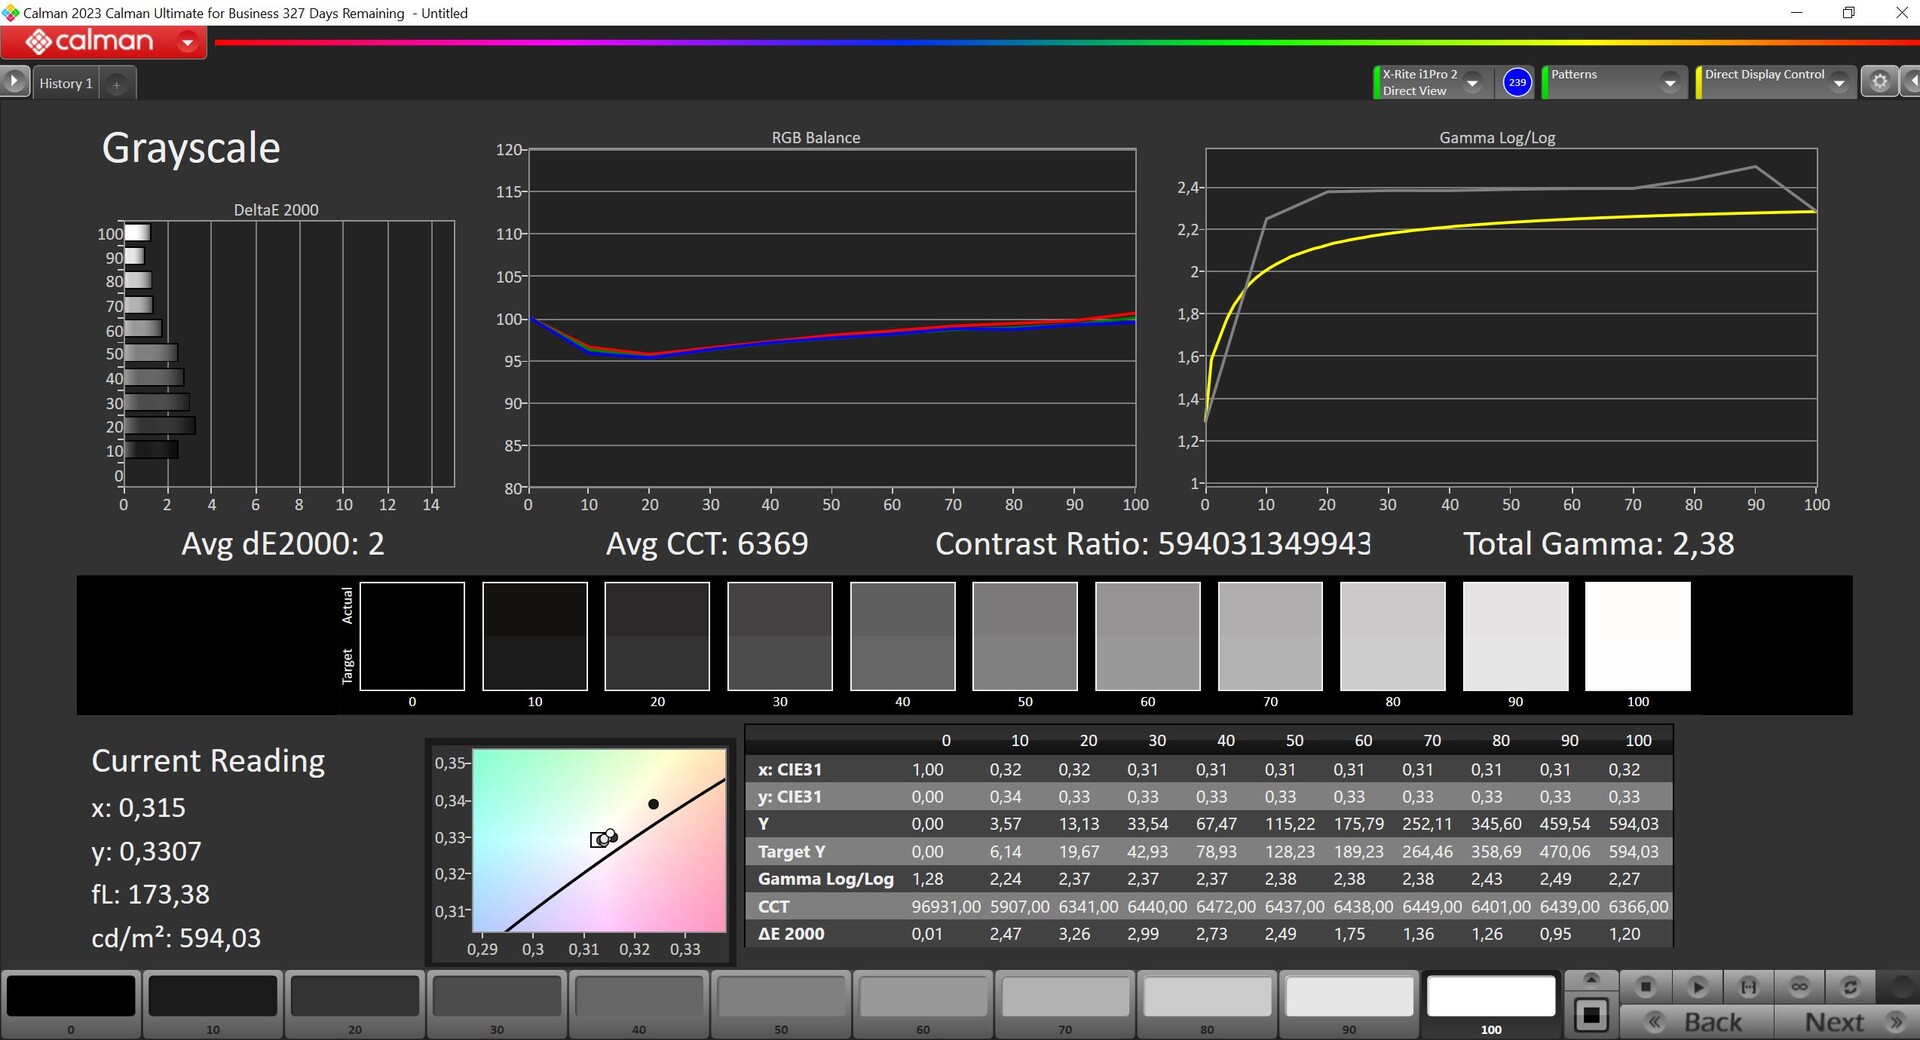


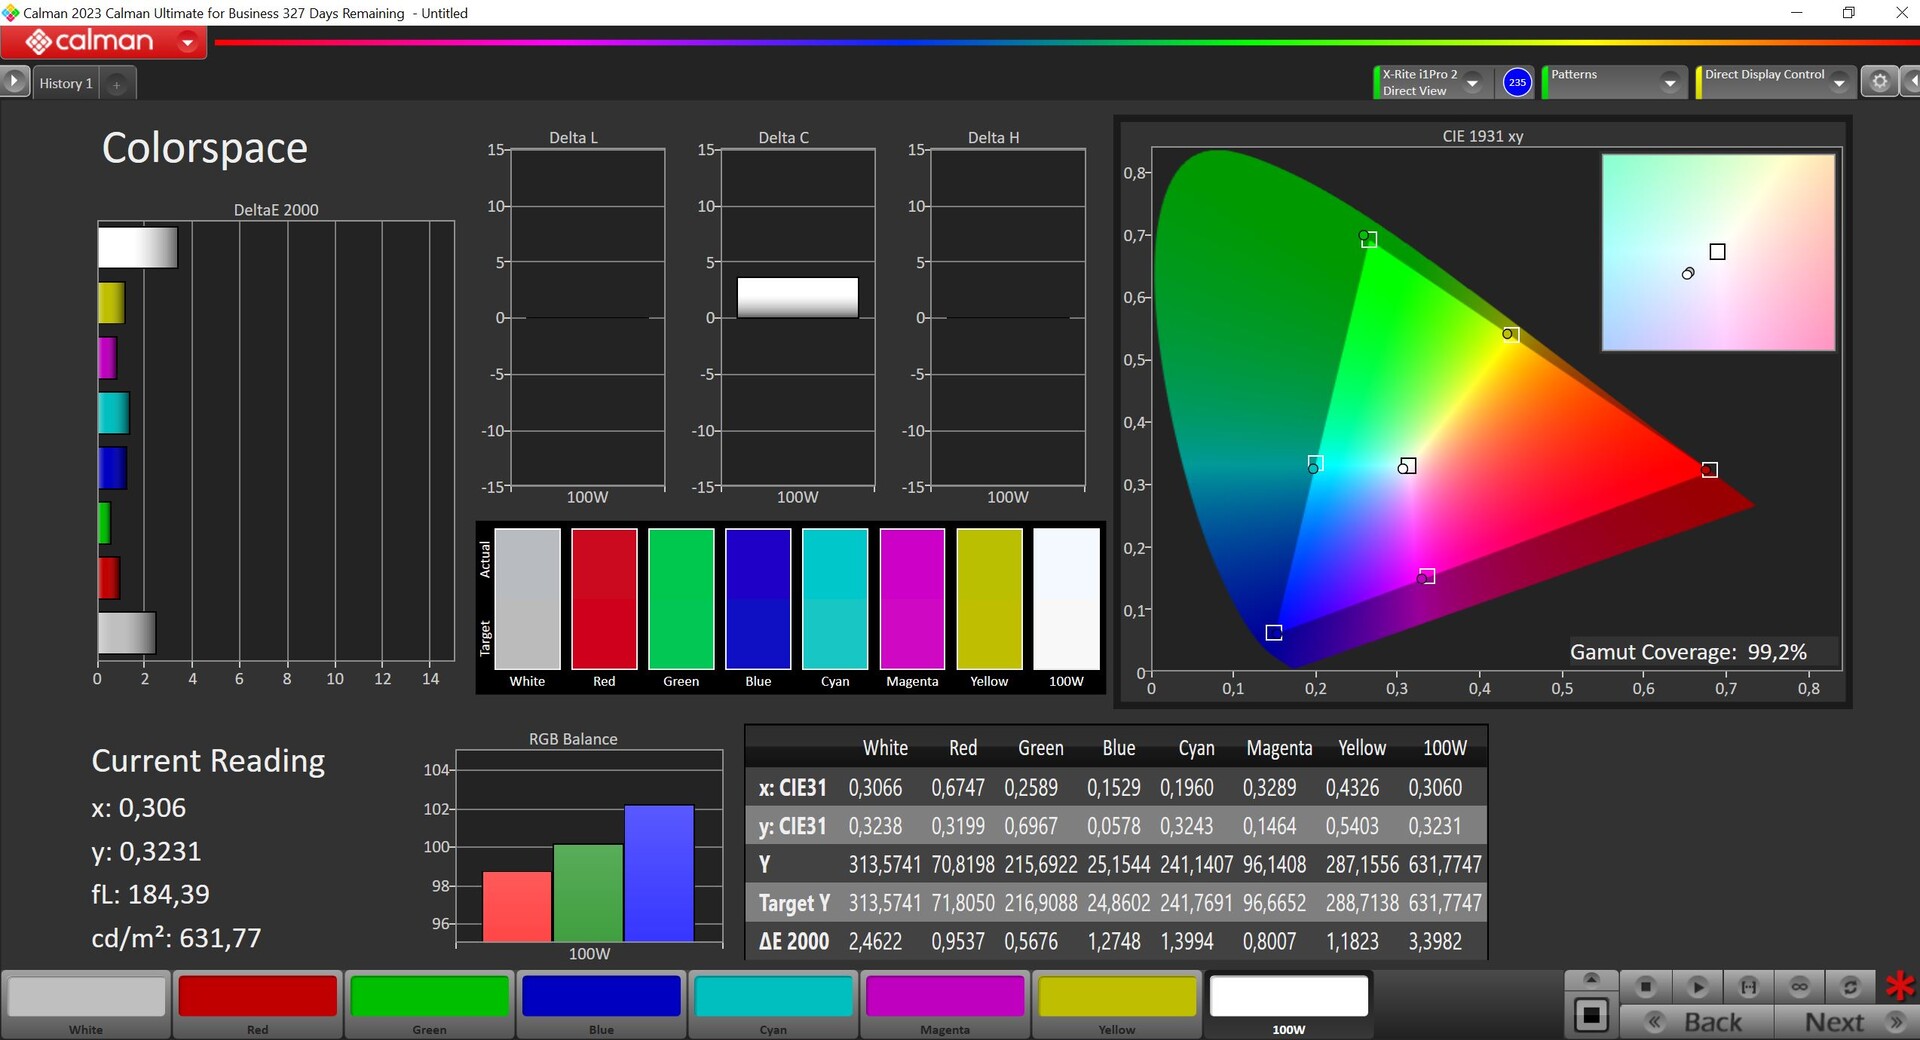
We were able to calibrate the Mini-LED panel and improve the image quality, but there are still individual colors with deviations bigger than 3. Our calibrated profile can be downloaded for free in the display box above. We are already eager to see if there is a difference compared to the more expensive MBP 14 models with M3 Pro/M3 Max. The panel still covers the P3 color gamut (99.2 %). The panel is not perfect for image calibration since you cannot deactivate the individual lighting zones of the Mini-LED screen.
Display Response Times
| ↔ Response Time Black to White | ||
|---|---|---|
| 75.2 ms ... rise ↗ and fall ↘ combined | ↗ 51.8 ms rise | 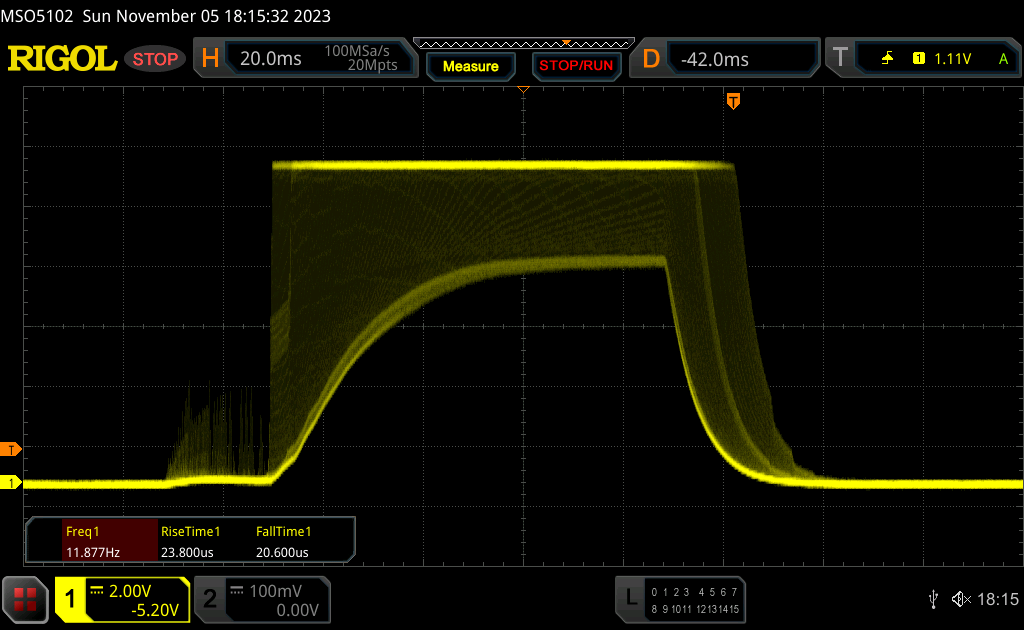 |
| ↘ 23.4 ms fall | ||
| The screen shows slow response rates in our tests and will be unsatisfactory for gamers. In comparison, all tested devices range from 0.1 (minimum) to 240 (maximum) ms. » 100 % of all devices are better. This means that the measured response time is worse than the average of all tested devices (21.8 ms). | ||
| ↔ Response Time 50% Grey to 80% Grey | ||
| 69 ms ... rise ↗ and fall ↘ combined | ↗ 29.6 ms rise | 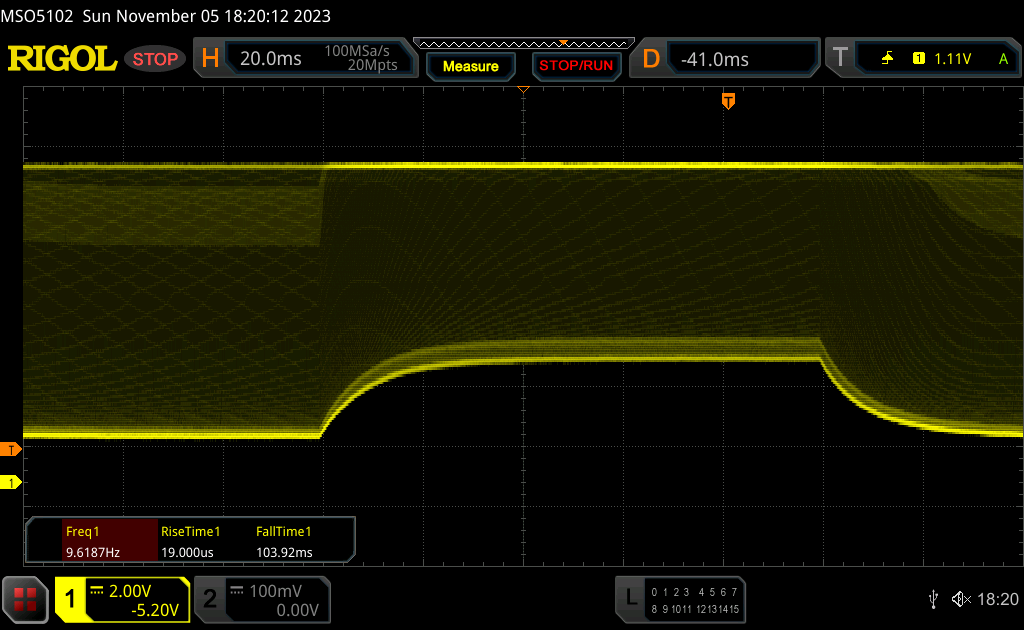 |
| ↘ 39.4 ms fall | ||
| The screen shows slow response rates in our tests and will be unsatisfactory for gamers. In comparison, all tested devices range from 0.2 (minimum) to 636 (maximum) ms. » 98 % of all devices are better. This means that the measured response time is worse than the average of all tested devices (34.3 ms). | ||
Screen Flickering / PWM (Pulse-Width Modulation)
| Screen flickering / PWM detected | 14878 Hz | ≤ 100 % brightness setting | 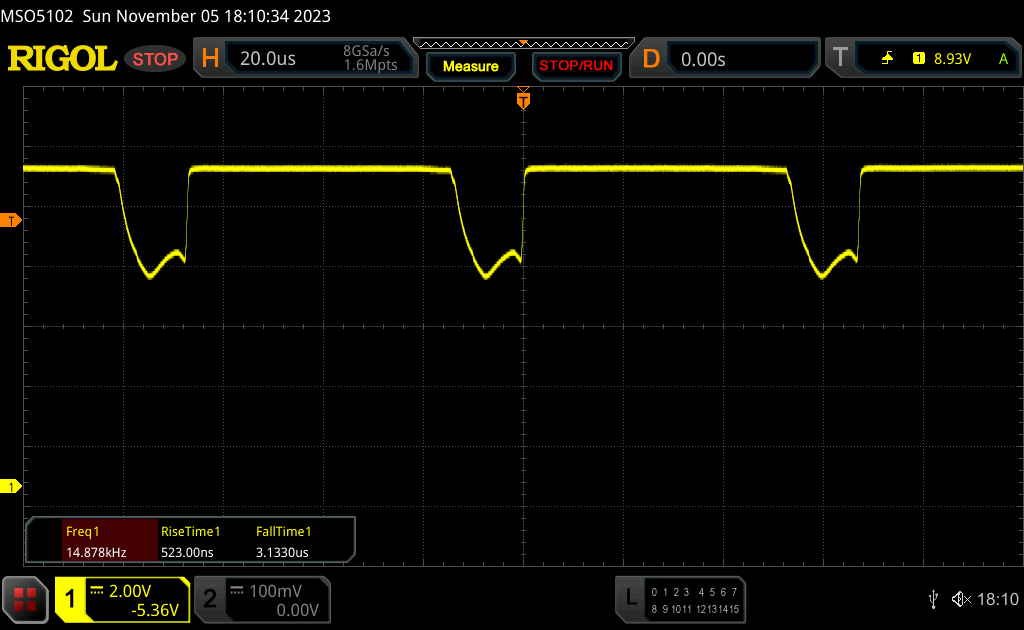 |
The display backlight flickers at 14878 Hz (Likely utilizing PWM) Flickering detected at a brightness setting of 100 % and below. There should be no flickering or PWM above this brightness setting. The frequency of 14878 Hz is quite high, so most users sensitive to PWM should not notice any flickering. In comparison: 53 % of all tested devices do not use PWM to dim the display. If PWM was detected, an average of 18716 (minimum: 5 - maximum: 3846000) Hz was measured. | |||
Like on the previous model, we can once again measure a constant flickering at 15 kHz on the new MacBook Pro 14, even at the highest brightness. However, flickering on mini-LED screens is not comparable with typical PWM flickering and the high frequency should not cause any issues.
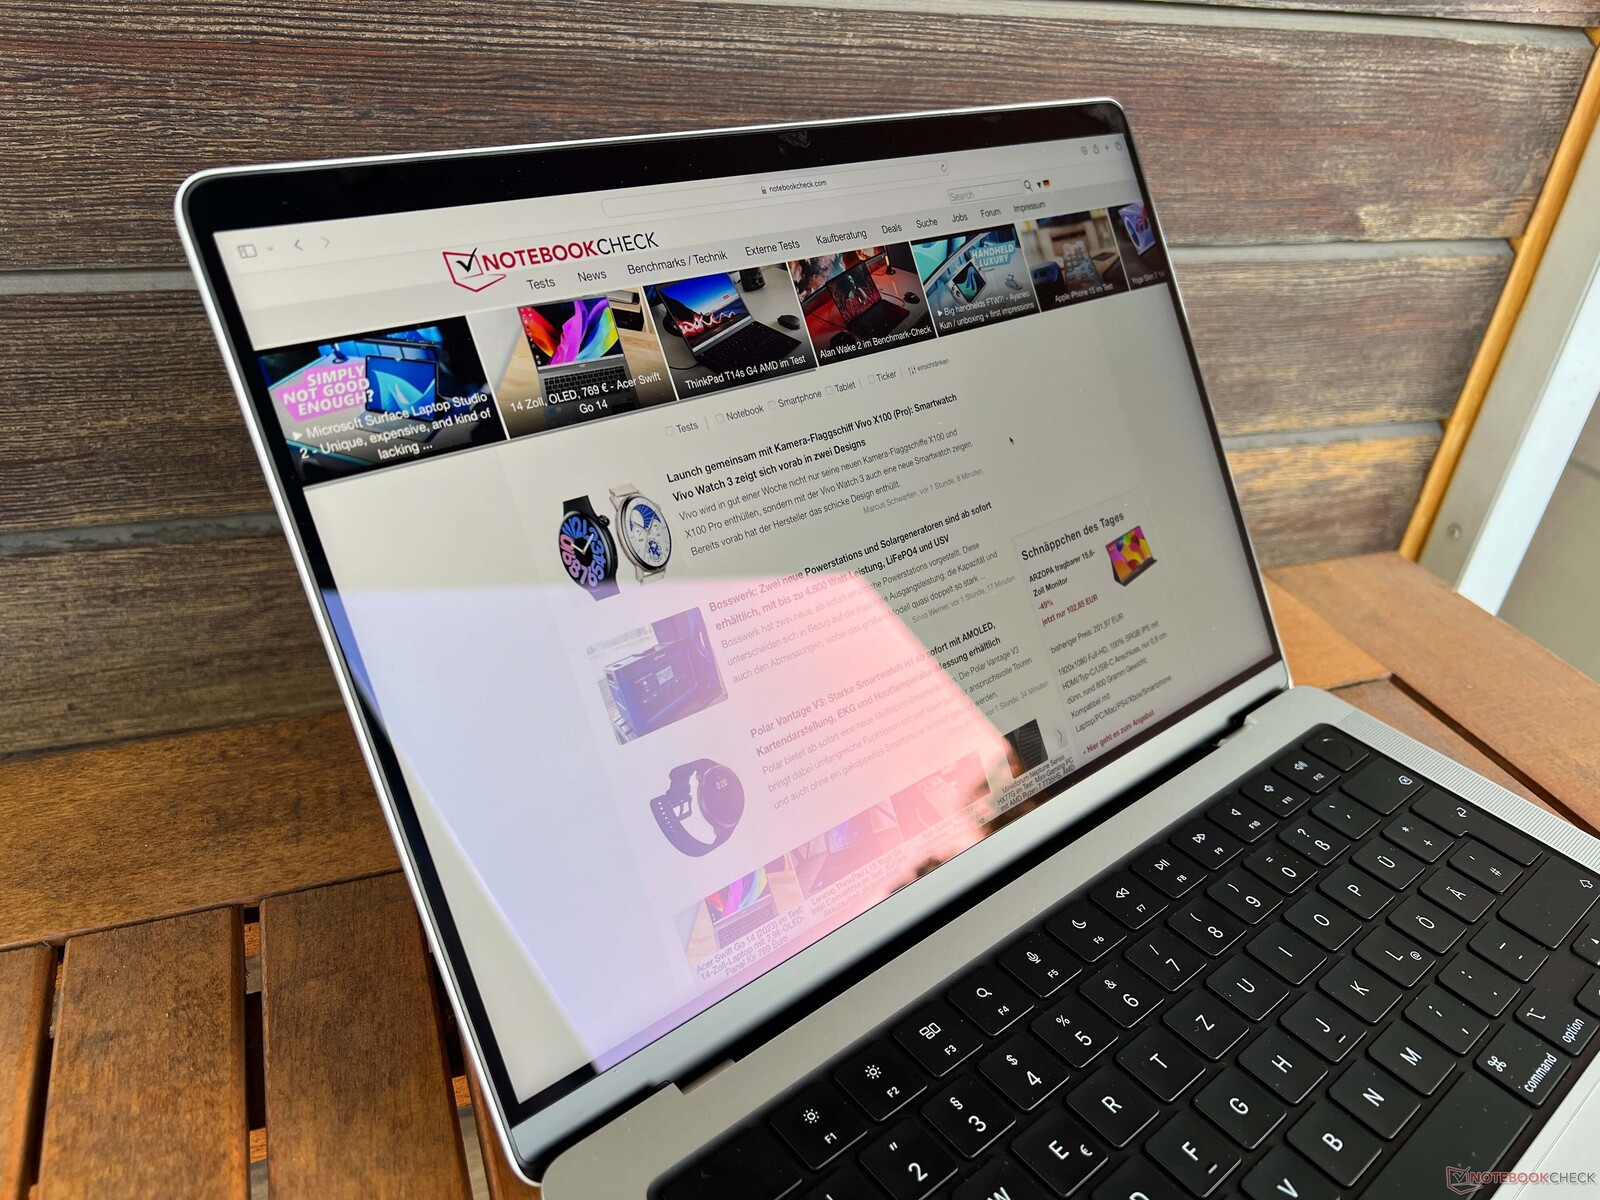
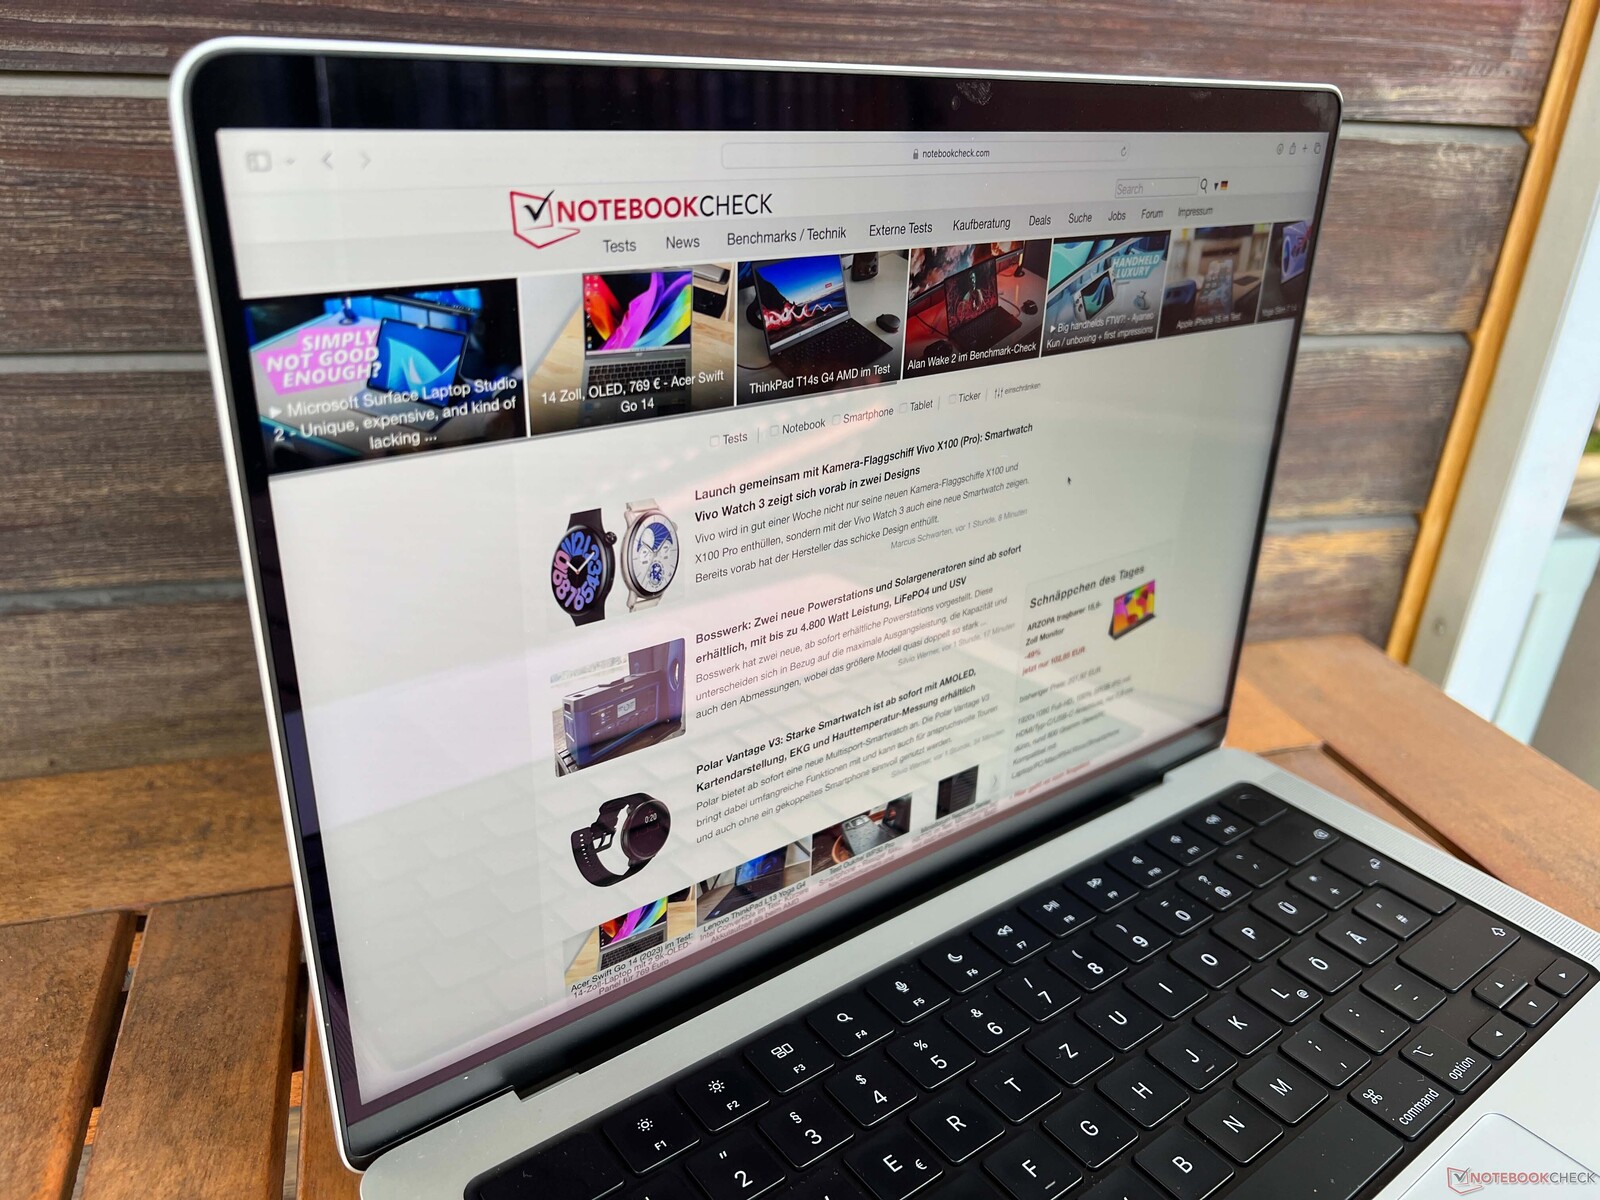
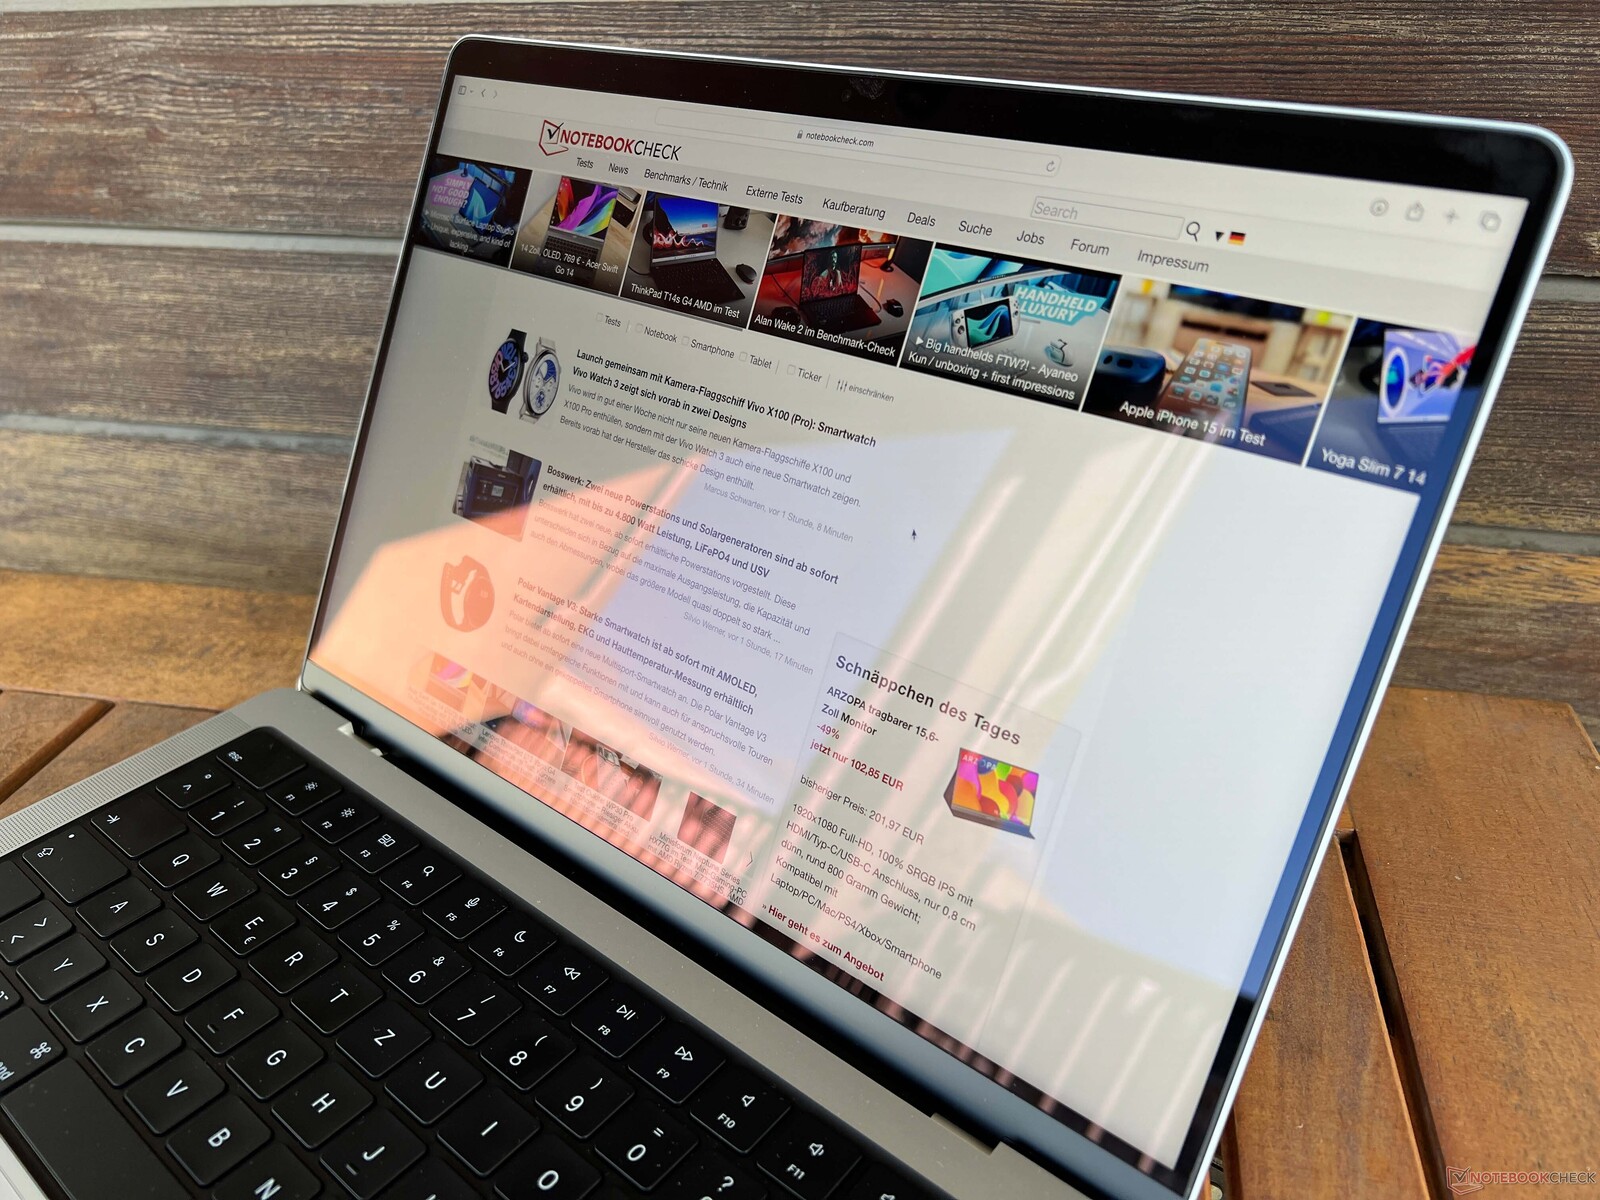
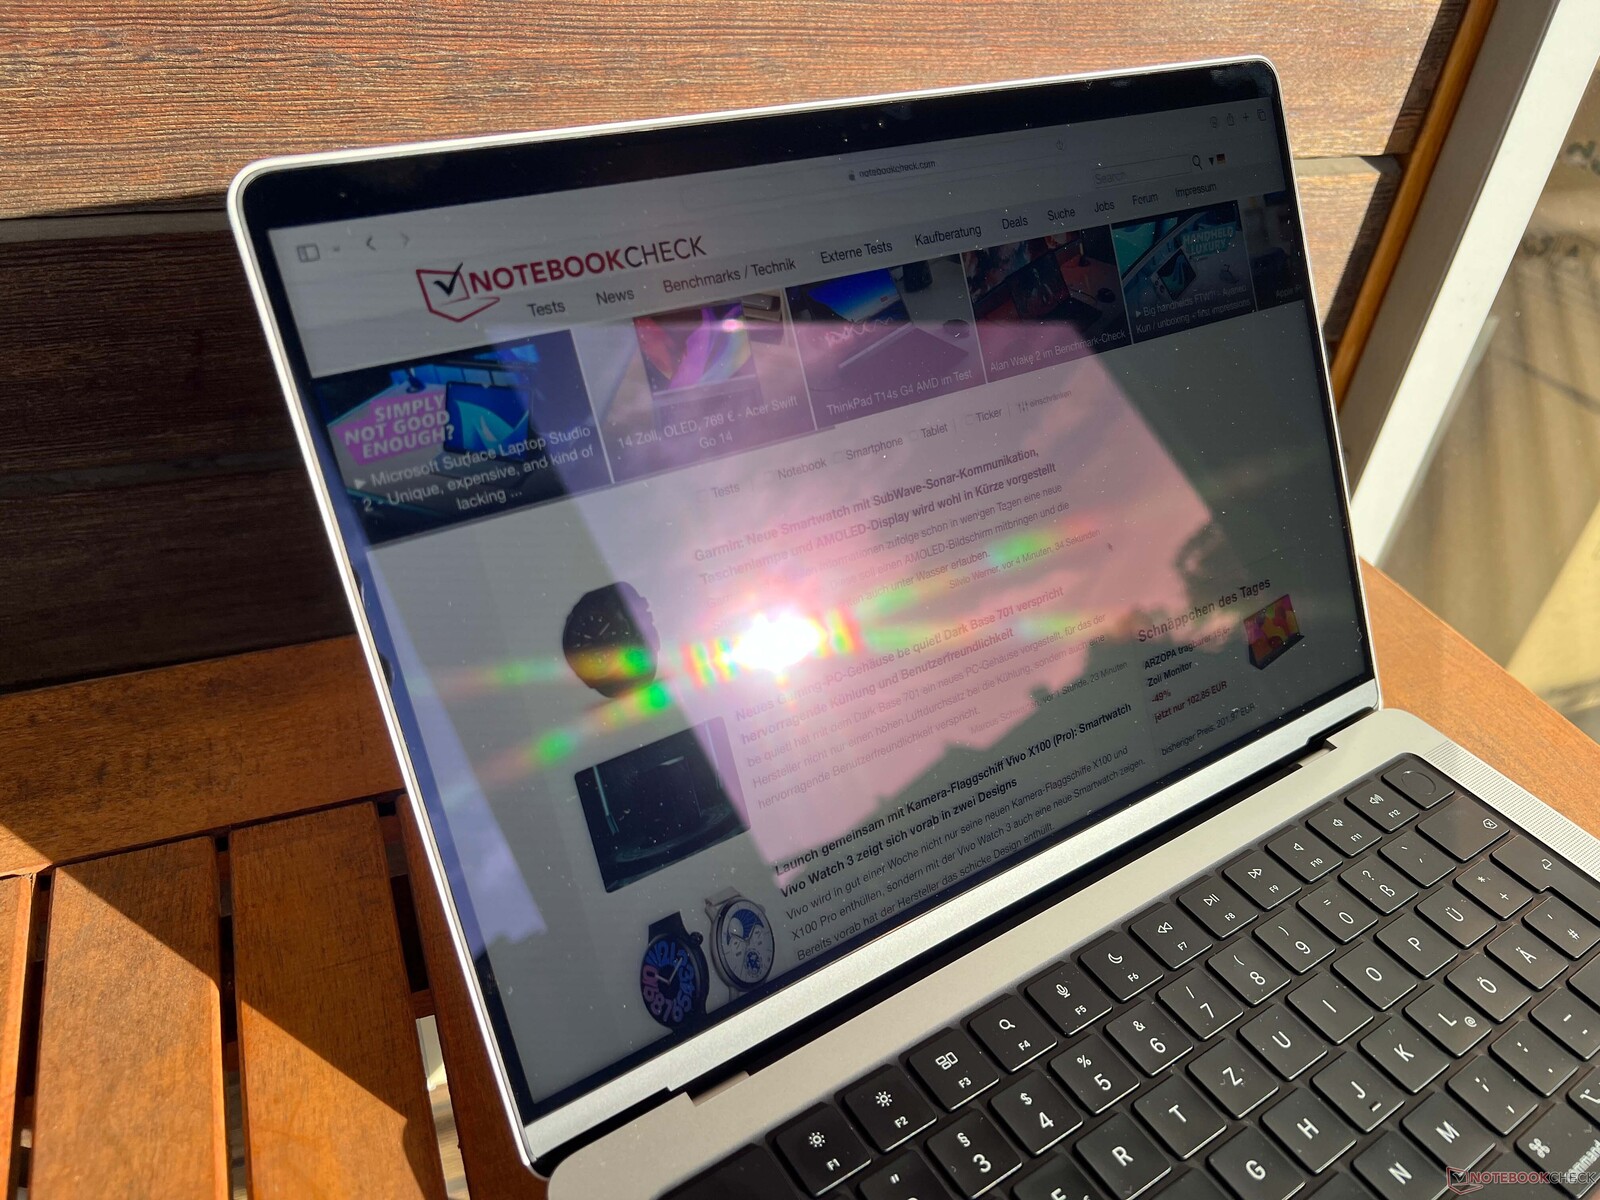
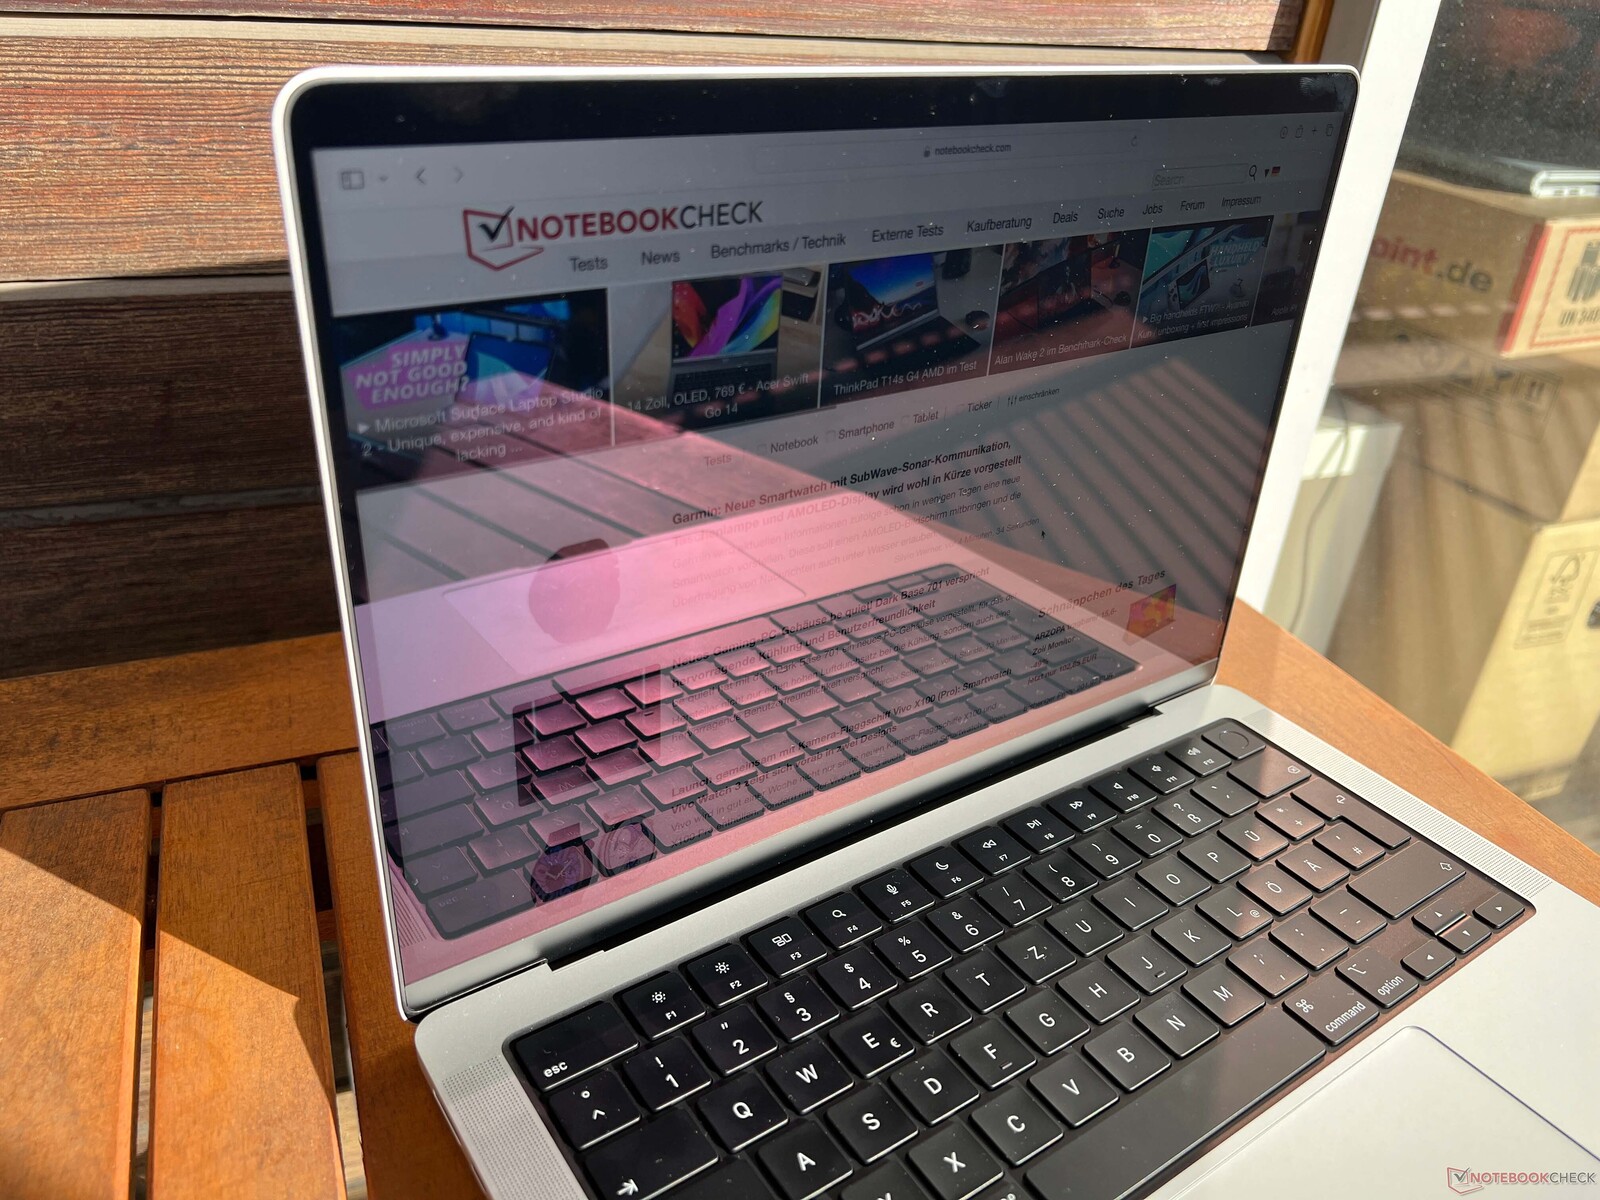
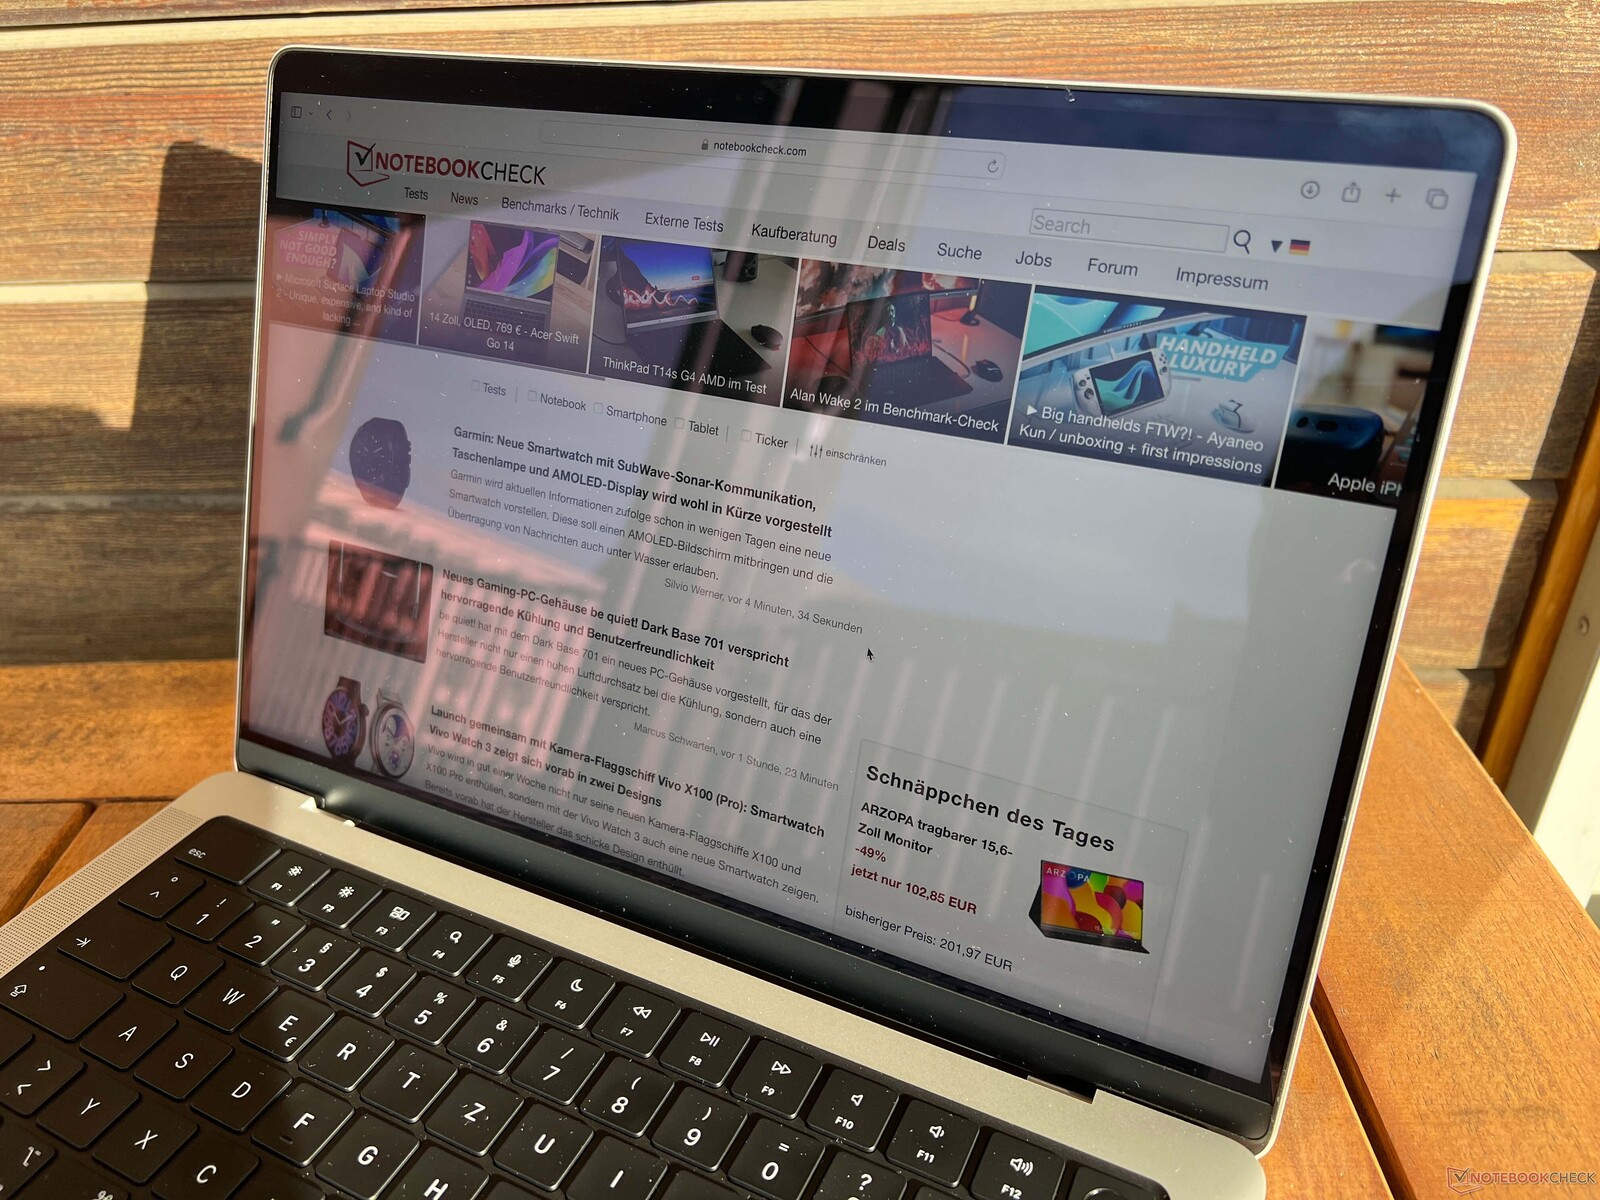
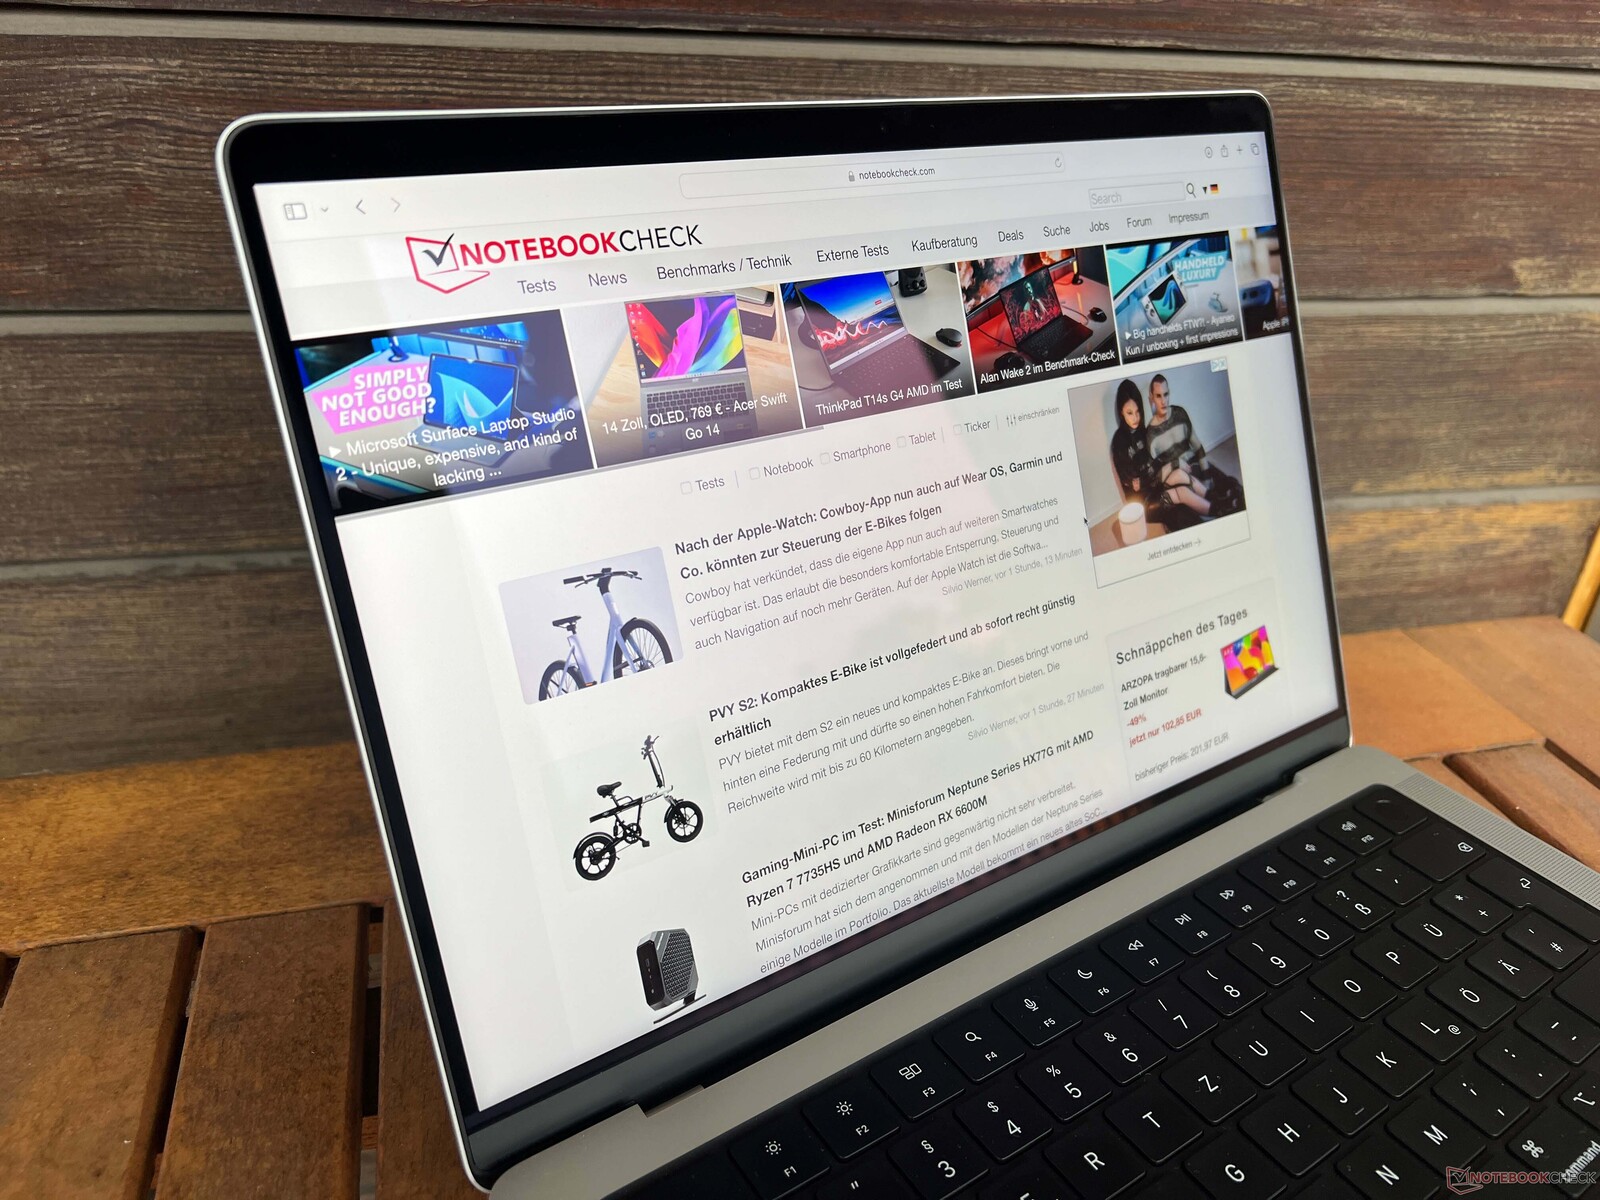
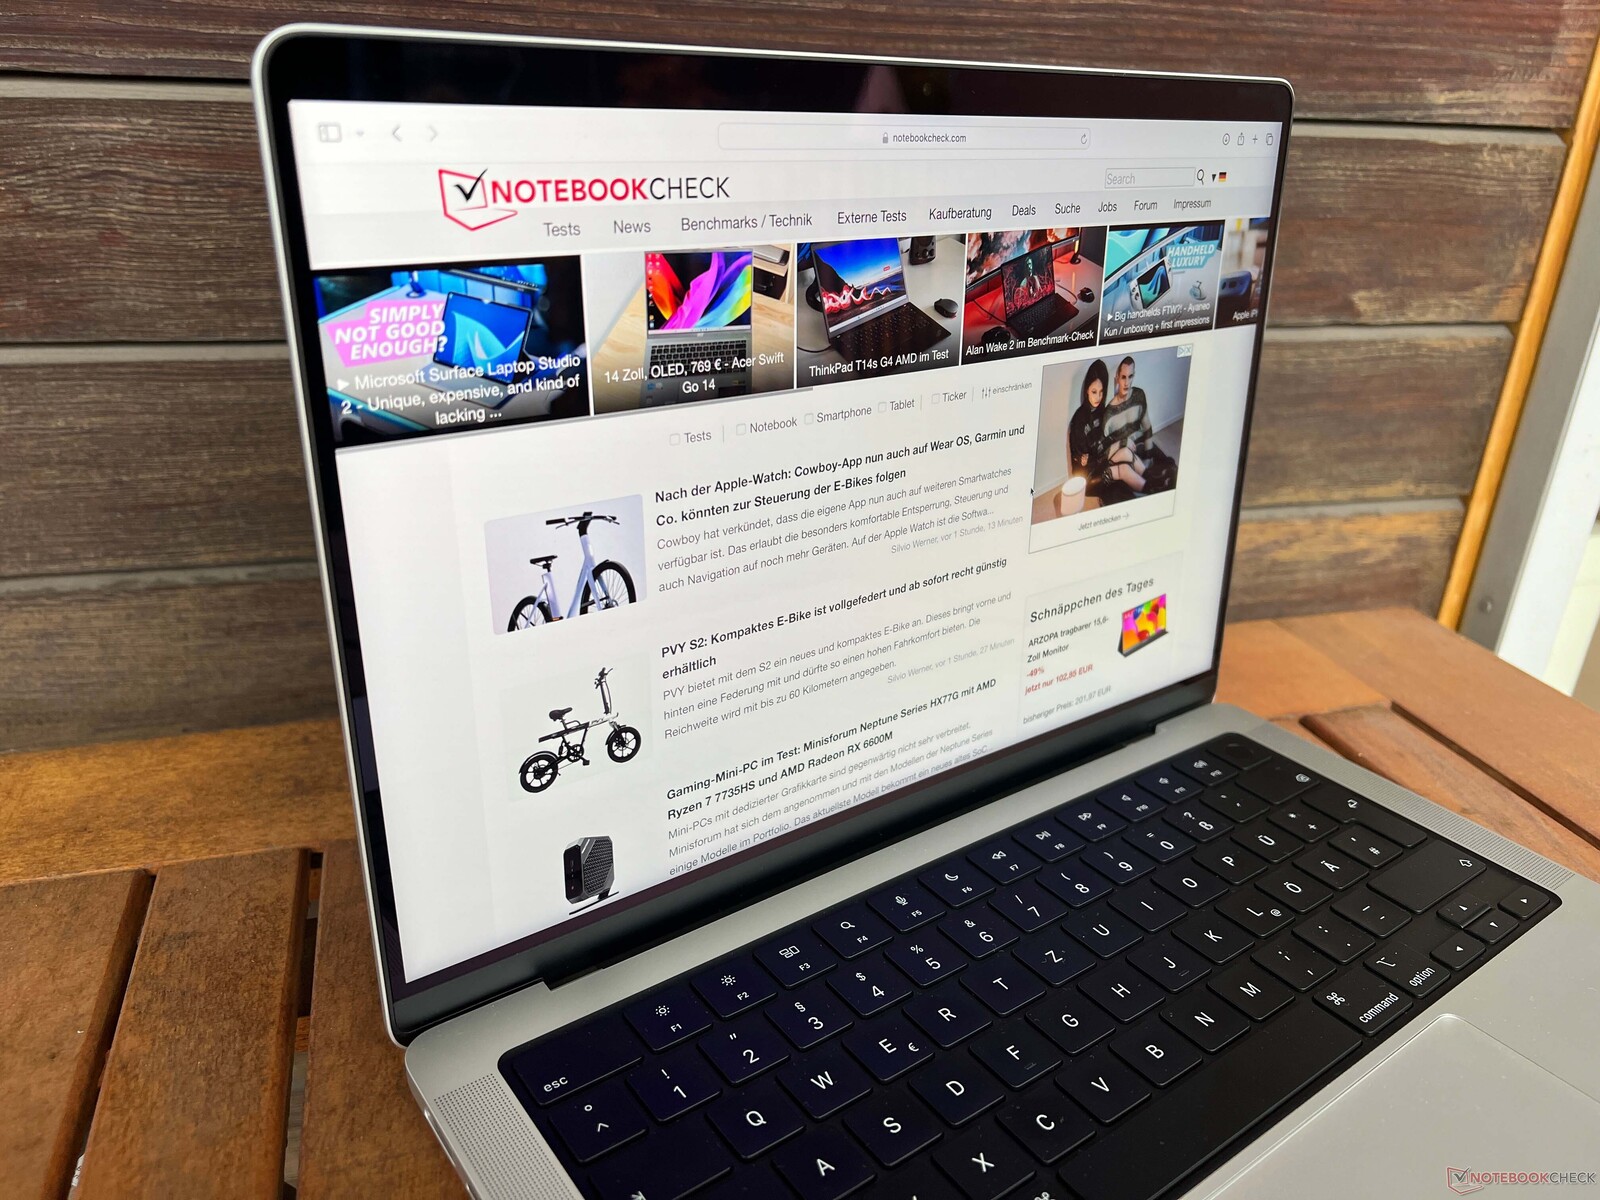
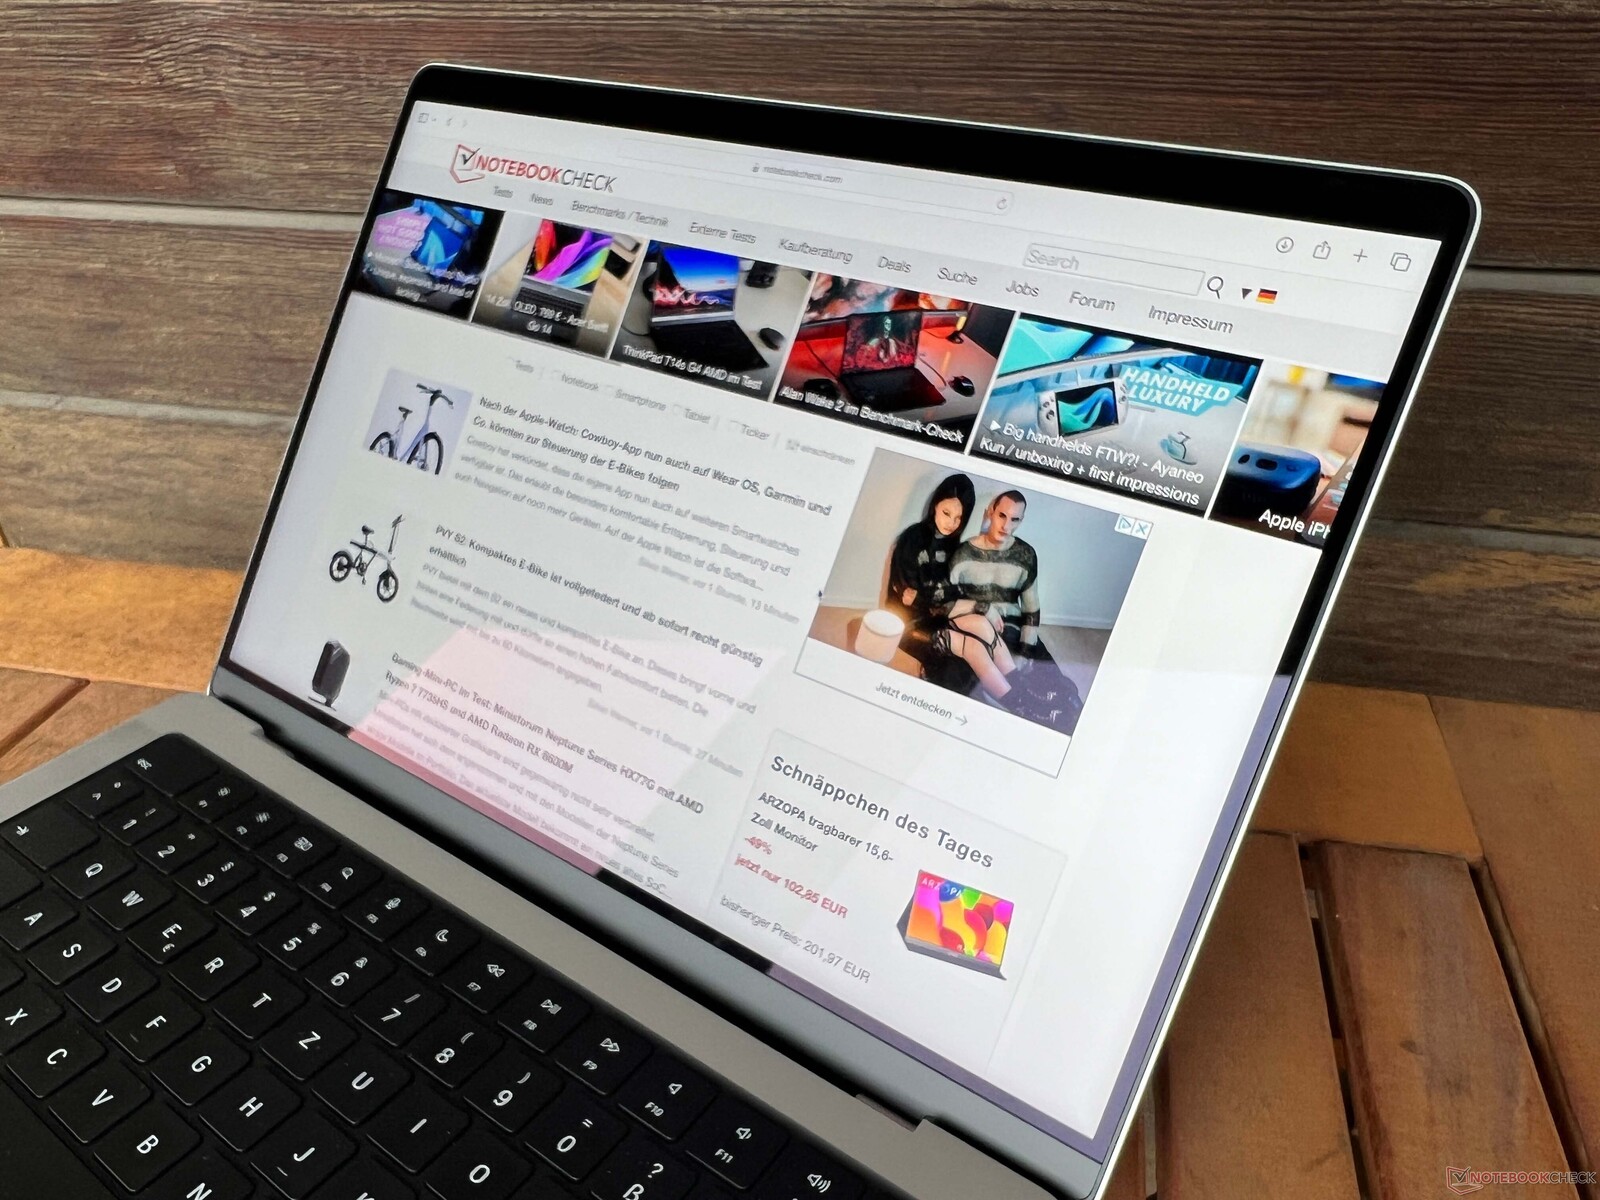
The MacBook Pro 14 uses a glossy screen, but it is not as reflective as many other glossy panels. The high values for the brightness as well as the contrast ratio obviously help as well. Our sample images show that you can even use the MacBook outdoors on sunny days as long as you avoid direct sunlight. There are no limitations in terms of the viewing angle stability.

Performance - New 3 nm chip, but no PCIe 4.0
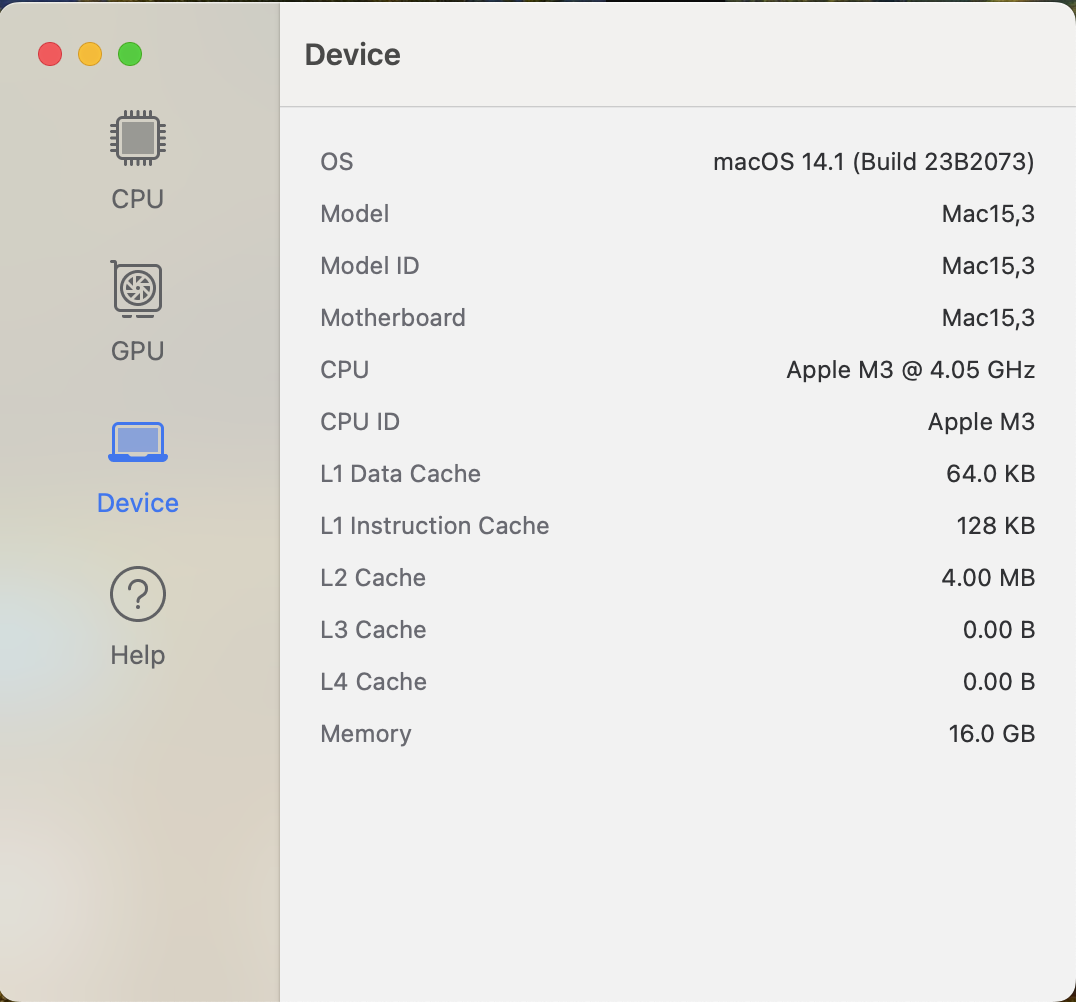
Processor - Apple M3
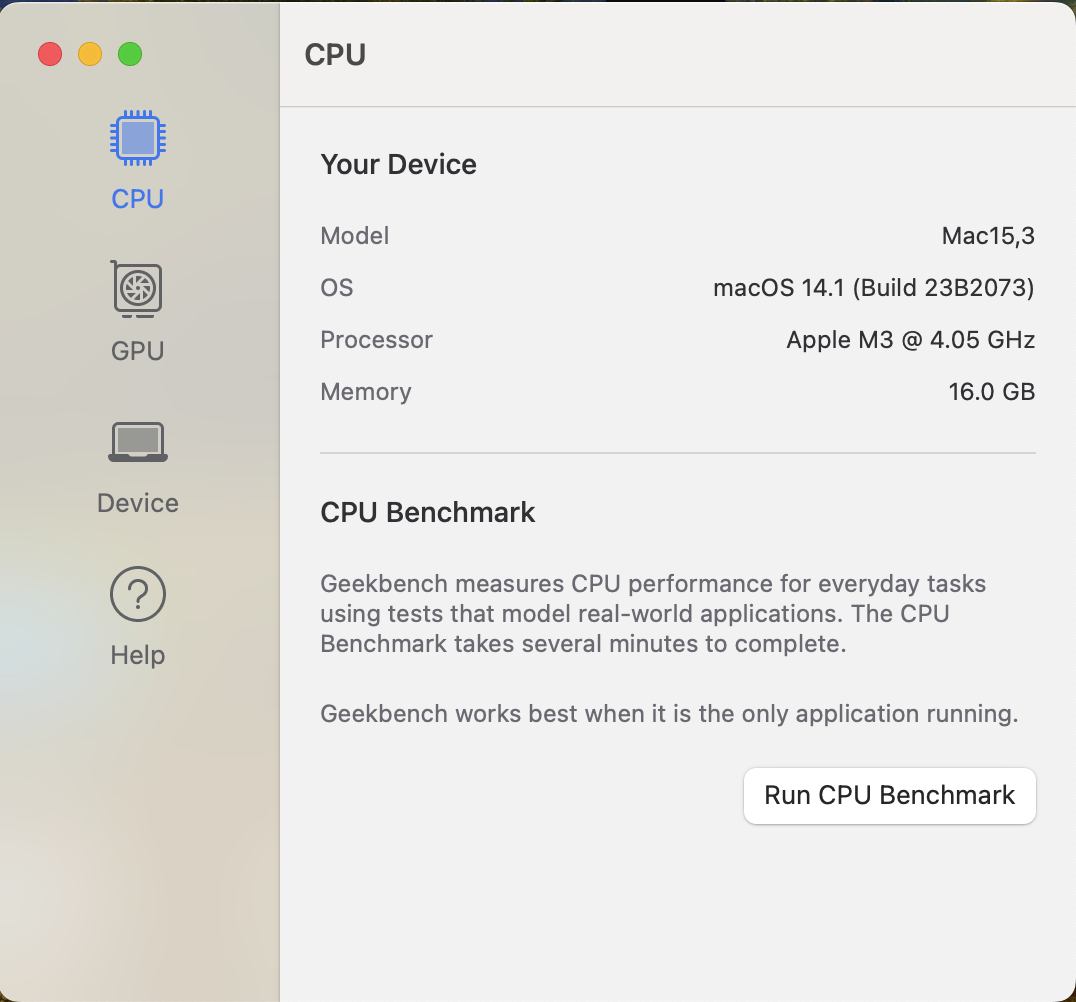
The new Apple M3 processor is one of the first chips manufactured in a 3 nm process. The core configuration does not differ from the previous M2 processor and you still get one performance cluster with four cores as well as an efficiency cluster with four cores. The clock of the cores is now higher at up to 4.056 GHz (M2 max. 4.38 GHz) for the performance cores, at least in theory. We only observed up to 3.78 GHz (usually 3.7 GHz) in single-core tests as well as 3.63 GHz in multi-core tests. The efficiency cores can now reach up to 2.748 GHz (previously up to 2.4 GHz).
We will take a closer look at the efficiency in our comprehensive analysis article of the new Apple M3, but the power consumption is pretty much identical to the Apple M2, which means the efficiency is better. We see consumption figures of around 20 Watts in multi-core tests as well as slightly more than 5 Watts in single-core tests.
Apple managed to increase the performance and we see an advantage of around 20 % over the M2 both in multi-core as well as single-core benchmarks. The multi-core performance is sufficient to beat the old M1 Pro SoC with 8 CPU cores, but the base model M2 Pro is still faster (~13 %). Intel’s U-series like the Core i7-1355U is beaten, but the P-series chips like the Core i7-1360P (at more than 30 Watts) as well as the Ryzen 7 7840U (at 24 Watt) are still a bit faster.
Cinebench 2024: CPU Multi Core | CPU Single Core
Geekbench 5.5: Multi-Core | Single-Core
Geekbench 6.2: Multi-Core | Single-Core
Cinebench 2024: CPU Multi Core | CPU Single Core
Geekbench 5.5: Multi-Core | Single-Core
Geekbench 6.2: Multi-Core | Single-Core
The situation changes in the single-core benchmarks and the performance is sufficient to keep up with Intel’s Performance cores, but they require much more power. AMD’s current Zen4 mobile processors do not stand a chance, either, and fall behind by around 10 %, despite higher consumption figures. This is a very impressive result considering the low consumption.
As per usual, the processor performance is not reduced on battery power until the battery capacity drops to 3 %. More CPU benchmarks are listed in our Tech section and we also recommend our analysis article for more information about the efficiency, which will be published soon.
We also performed our Cinebench R15 Multi loop, but you have to keep in mind that this benchmark is emulated, which affects the performance. However, it clearly shows that the CPU performance is rock steady even under sustained workloads.
Cinebench R15 Multi Loop
System Performance
All MacBooks with Apple’s own silicon are very responsive and fast system and native apps in particular run very smoothly, even complex applications like Adobe Photoshop or DaVinci Resolve. The MacBook can also emulate Intel apps via Rosetta 2, which also works very well, but the performance usually takes a hit, especially in complex apps. We included the Pugetbench benchmark scores for Adobe Photoshop as well as Premiere Pro, but keep in mind that these tests use the emulated Intel versions of the apps. The native version for Apple silicon are noticeable smoother.
Blackmagic RAW Speed Test: 12:1 8K Metal | 12:1 8K CPU
Photoshop PugetBench: Filter Score | General Score | GPU Score | Overall Score
Premiere Pro PugetBench: GPU Effects 0.98 | RAW 0.98 | Intraframe 0.98 | LongGOP 0.98 | Overall Score 0.98
Jetstream 2: Total Score
WebXPRT 3: ---
| Blackmagic RAW Speed Test / 12:1 8K Metal | |
| Average of class Multimedia (67 - 293, n=5, last 2 years) | |
| Apple MacBook Pro 14 2023 M2 Pro | |
| Apple MacBook Pro 16 2021 M1 Pro | |
| Apple MacBook Pro 14 2023 M2 Pro Entry | |
| Apple MacBook Pro 13 2022 M2 | |
| Apple MacBook Pro 14 2023 M3 | |
| Average Apple M3, Apple M3 10-Core GPU | |
| Apple MacBook Air 15 2023 M2 16 GB | |
| Blackmagic RAW Speed Test / 12:1 8K CPU | |
| Average of class Multimedia (32 - 68, n=5, last 2 years) | |
| Apple MacBook Pro 14 2023 M2 Pro | |
| Apple MacBook Pro 14 2023 M2 Pro Entry | |
| Apple MacBook Pro 14 2023 M3 | |
| Average Apple M3, Apple M3 10-Core GPU | |
| Apple MacBook Pro 16 2021 M1 Pro | |
| Apple MacBook Air 15 2023 M2 16 GB | |
| Apple MacBook Pro 13 2022 M2 | |
| Premiere Pro PugetBench / GPU Effects 0.98 | |
| Average of class Multimedia (14.5 - 57.6, n=3, last 2 years) | |
| Apple MacBook Pro 14 2023 M2 Pro | |
| Apple MacBook Pro 16 2021 M1 Pro | |
| Apple MacBook Air 15 2023 M2 16 GB | |
| Apple MacBook Pro 14 2023 M3 | |
| Average Apple M3, Apple M3 10-Core GPU | |
| Premiere Pro PugetBench / RAW 0.98 | |
| Average of class Multimedia (23.1 - 55.9, n=3, last 2 years) | |
| Apple MacBook Pro 14 2023 M2 Pro | |
| Apple MacBook Air 15 2023 M2 16 GB | |
| Apple MacBook Pro 16 2021 M1 Pro | |
| Apple MacBook Pro 14 2023 M3 | |
| Average Apple M3, Apple M3 10-Core GPU | |
| Premiere Pro PugetBench / Intraframe 0.98 | |
| Apple MacBook Pro 14 2023 M2 Pro | |
| Average of class Multimedia (58.7 - 121.3, n=3, last 2 years) | |
| Apple MacBook Pro 16 2021 M1 Pro | |
| Apple MacBook Air 15 2023 M2 16 GB | |
| Apple MacBook Pro 14 2023 M3 | |
| Average Apple M3, Apple M3 10-Core GPU | |
| Premiere Pro PugetBench / LongGOP 0.98 | |
| Apple MacBook Pro 14 2023 M2 Pro | |
| Average of class Multimedia (38.7 - 85.4, n=3, last 2 years) | |
| Apple MacBook Pro 16 2021 M1 Pro | |
| Apple MacBook Air 15 2023 M2 16 GB | |
| Apple MacBook Pro 14 2023 M3 | |
| Average Apple M3, Apple M3 10-Core GPU | |
| Premiere Pro PugetBench / Overall Score 0.98 | |
| Apple MacBook Pro 14 2023 M2 Pro | |
| Average of class Multimedia (295 - 760, n=3, last 2 years) | |
| Apple MacBook Pro 16 2021 M1 Pro | |
| Apple MacBook Air 15 2023 M2 16 GB | |
| Apple MacBook Pro 14 2023 M3 | |
| Average Apple M3, Apple M3 10-Core GPU | |
Storage Devices
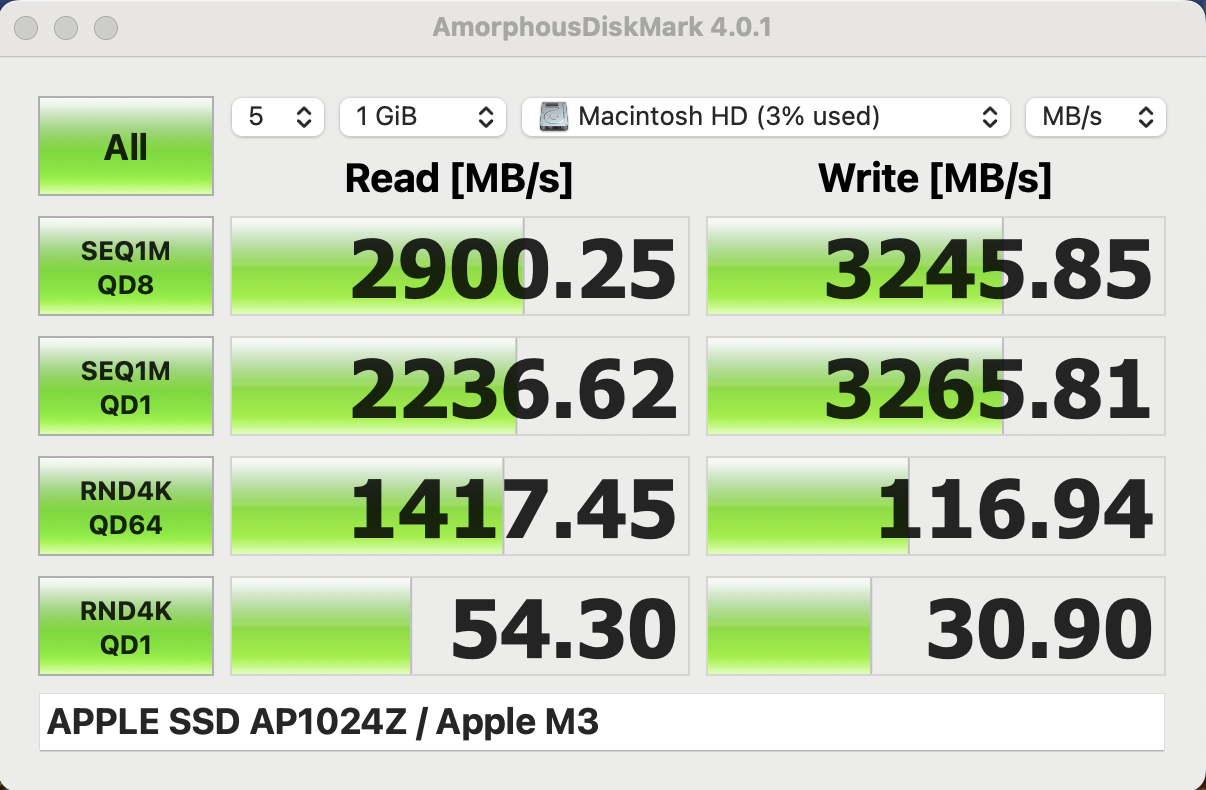
The SSD performance is also a step back compared to the previous model, because the base version of the new MacBook Pro 14 with the M3 SoC only uses a PCIe 3.0 interface instead of PCIe 4.0 on models with the M3 Pro or M3 Max, respectively. The performance is still sufficient for everyday tasks with transfer rates of up to 3 GB/s, but this performance is similar to the MacBook Air models. Our review unit is equipped with the optional 1 TB SSD (AP1024Z) and you can use 966 GB for your own files after the initial set-up. The MBP 14 with the M3 SoC can be configured with up to 2 TB SSD storage. More SSD benchmarks are listed here.
| Blackmagic Disk Speed Test | |
| 5GB Read | |
| Apple MacBook Pro 14 2023 M2 Pro | |
| Average of class Multimedia (2877 - 5666, n=7, last 2 years) | |
| Average Apple SSD AP1024Z (2797 - 4860, n=5) | |
| Apple MacBook Pro 14 2023 M2 Pro Entry | |
| Apple MacBook Pro 14 2023 M3 | |
| Apple MacBook Air 15 2023 M2 16 GB | |
| Apple MacBook Pro 13 2022 M2 | |
| Apple MacBook Air M2 10C GPU | |
| Apple MacBook Air M2 Entry | |
| 5GB Write | |
| Apple MacBook Pro 14 2023 M2 Pro | |
| Average of class Multimedia (2993 - 8271, n=7, last 2 years) | |
| Average Apple SSD AP1024Z (2873 - 6126, n=5) | |
| Apple MacBook Pro 14 2023 M2 Pro Entry | |
| Apple MacBook Pro 13 2022 M2 | |
| Apple MacBook Air M2 10C GPU | |
| Apple MacBook Pro 14 2023 M3 | |
| Apple MacBook Air 15 2023 M2 16 GB | |
| Apple MacBook Air M2 Entry | |
GPU Performance
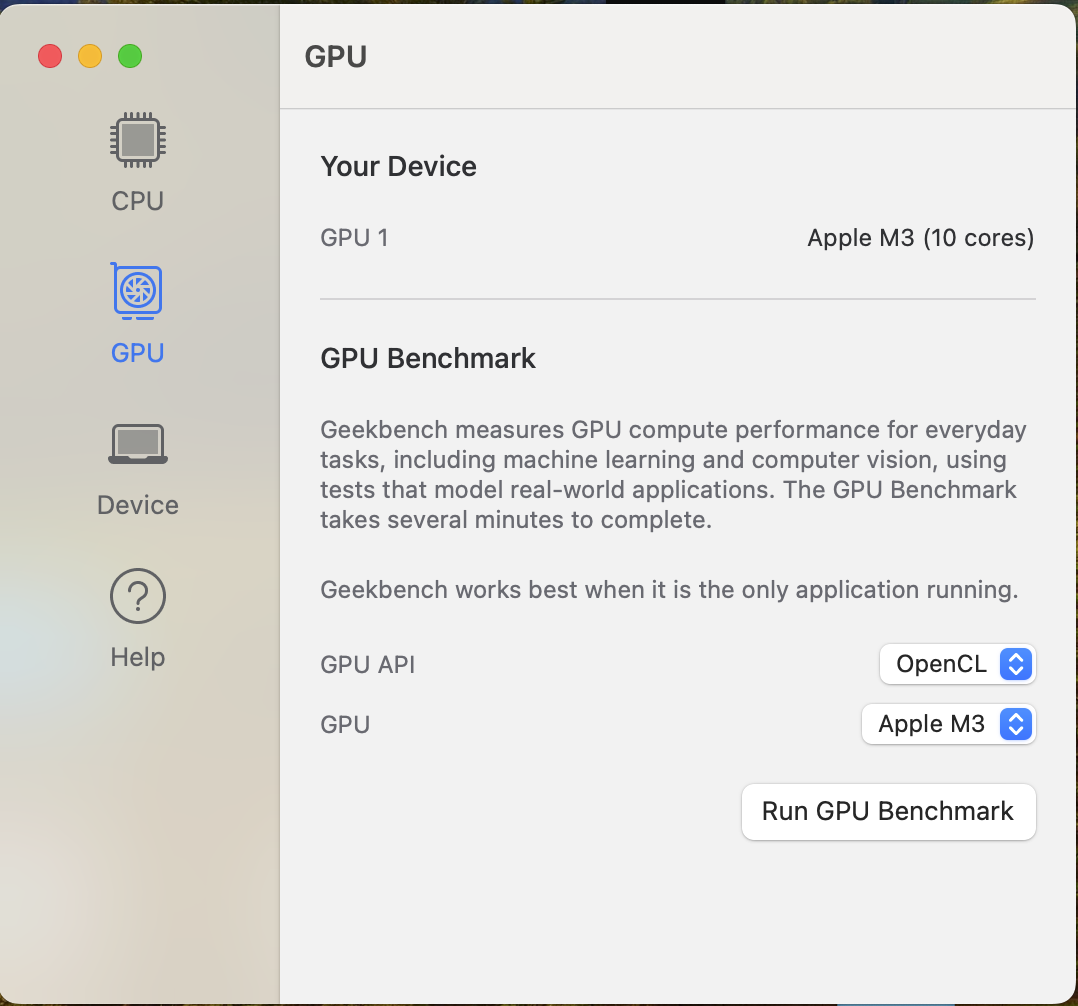
The new Apple M3 is available with two different GPU version, but the MacBook Pro is always equipped with the faster 10-core unit. The updated iMac uses the slower 8-core model, which will most likely be used for the upcoming MacBook Air M3 models as well. The number of cores is once again identical to the previous M2 GPU, but we are not able to determine the GPU clock. We think the clock is once again higher (similar to the CPU clocks) compared to 1.4 GHz on the M2 GPU since the maximum power consumption is increased from 13.5 Watts to 15 Watts.
Our benchmarks show an advantage between 10-20 % compared to the M2 GPU with 10 cores, but the new M3 GPU does not stand a chance against the two 16-core GPUs of the M1 Pro and the M2 Pro. The cross-platform 3DMark WildLife Extreme Unlimited test shows a clear advantage for the M3 GPu over the rivals from AMD (Radeon 780M) as well as Intel (Iris Xe Graphics G7). The OpenCL performance on the other hand is comparable to the Radeon 780M. The discrete GeForce RTX 4050 Laptop in Lenovo’s multimedia laptop Yoga Pro 9i is noticeably faster.
The GPU performance is completely stable, bot under sustained workloads and on battery power. More GPU benchmarks are listed in our Tech section.
| Geekbench 6.2 | |
| GPU Metal | |
| Average of class Multimedia (47494 - 155752, n=3, last 2 years) | |
| Apple MacBook Pro 16 2021 M1 Pro | |
| Apple MacBook Pro 14 2023 M3 | |
| Average Apple M3 10-Core GPU | |
| Apple MacBook Air 15 2023 M2 16 GB | |
| GPU OpenCL | |
| Lenovo Yoga Pro 9-14IRP G8 | |
| Lenovo Yoga Pro 9-14IRP G8 | |
| Average of class Multimedia (27345 - 92806, n=11, last 2 years) | |
| Apple MacBook Pro 16 2021 M1 Pro | |
| Lenovo Yoga Slim 7 14APU G8 | |
| Apple MacBook Pro 14 2023 M3 | |
| Average Apple M3 10-Core GPU | |
| Apple MacBook Air 15 2023 M2 16 GB | |
| SCHENKER Vision 14 2023 | |
| GFXBench | |
| 3840x2160 4K Aztec Ruins High Tier Offscreen | |
| Average of class Multimedia (29.6 - 204, n=8, last 2 years) | |
| Apple MacBook Pro 14 2023 M2 Pro | |
| Apple MacBook Pro 14 2023 M2 Pro Entry | |
| Apple MacBook Pro 16 2021 M1 Pro | |
| Apple MacBook Pro 14 2023 M3 | |
| Average Apple M3 10-Core GPU | |
| Apple MacBook Air 15 2023 M2 16 GB | |
| 2560x1440 Aztec Ruins High Tier Offscreen | |
| Apple MacBook Pro 14 2023 M2 Pro | |
| Average of class Multimedia (62.8 - 446, n=10, last 2 years) | |
| Apple MacBook Pro 14 2023 M2 Pro Entry | |
| Apple MacBook Pro 16 2021 M1 Pro | |
| Apple MacBook Pro 14 2023 M3 | |
| Average Apple M3 10-Core GPU | |
| Apple MacBook Pro 13 2022 M2 | |
| Apple MacBook Air 15 2023 M2 16 GB | |
| 1920x1080 Aztec Ruins Normal Tier Offscreen | |
| Apple MacBook Pro 14 2023 M2 Pro | |
| Average of class Multimedia (160 - 950, n=10, last 2 years) | |
| Apple MacBook Pro 14 2023 M2 Pro Entry | |
| Apple MacBook Pro 16 2021 M1 Pro | |
| Average Apple M3 10-Core GPU | |
| Apple MacBook Pro 14 2023 M3 | |
| Apple MacBook Pro 13 2022 M2 | |
| Apple MacBook Air 15 2023 M2 16 GB | |
| Blender | |
| v3.3 Classroom METAL | |
| Apple MacBook Air 15 2023 M2 16 GB | |
| Apple MacBook Pro 14 2023 M2 Pro Entry | |
| Apple MacBook Pro 14 2023 M3 | |
| Average Apple M3 10-Core GPU | |
| Apple MacBook Pro 14 2023 M2 Pro | |
| Average of class Multimedia (32 - 132, n=5, last 2 years) | |
| v3.3 Classroom OPTIX/RTX | |
| Average of class Multimedia (22 - 99, n=39, last 2 years) | |
| Gigabyte Aero 14 OLED BMF | |
| Lenovo Yoga Pro 9-14IRP G8 | |
| v3.3 Classroom CUDA | |
| Average of class Multimedia (35 - 152, n=41, last 2 years) | |
| Gigabyte Aero 14 OLED BMF | |
| Lenovo Yoga Pro 9-14IRP G8 | |
* ... smaller is better
Gaming Performance
Gaming on the Mac is getting more interesting and the new macOS 14 (Sonoma) also offers a Game mode when you play in full-screen mode. In addition to emulated titles (like Shadow of the Tomb Raider, Total War: Three Kingdoms) you can also use CrossOver to play Windows games. Depending on the title, this works well (like GTA V, Far Cry 5), but sometimes you have to experiment a bit. Native games for Apple’s silicon obviously work much better and this includes titles like Resident Evil Village or No Man’s Sky. The performance of the new Apple M3 is remarkable and both titles run completely smoothly in 1080p and maximum settings, which is also visible in the following video with gaming benchmarks.
| The Witcher 3 | |
| 1920x1080 High Graphics & Postprocessing (Nvidia HairWorks Off) | |
| Lenovo Yoga Pro 9-14IRP G8 | |
| Average of class Multimedia (11.2 - 290, n=88, last 2 years) | |
| Gigabyte Aero 14 OLED BMF | |
| Apple MacBook Pro 14 2023 M2 Pro | |
| Apple MacBook Pro 14 2023 M2 Pro Entry | |
| Lenovo Yoga Slim 7 14APU G8 | |
| Apple MacBook Pro 14 2023 M3 | |
| Average Apple M3 10-Core GPU | |
| SCHENKER Vision 14 2023 | |
| Huawei MateBook X Pro 2023 | |
| Apple MacBook Air 15 2023 M2 16 GB | |
| 1920x1080 Ultra Graphics & Postprocessing (HBAO+) | |
| Lenovo Yoga Pro 9-14IRP G8 | |
| Gigabyte Aero 14 OLED BMF | |
| Gigabyte Aero 14 OLED BMF | |
| Apple MacBook Pro 14 2023 M2 Pro | |
| Average of class Multimedia (7.9 - 143.2, n=92, last 2 years) | |
| Apple MacBook Pro 14 2023 M2 Pro Entry | |
| Lenovo Yoga Slim 7 14APU G8 | |
| Apple MacBook Air 15 2023 M2 16 GB | |
| Apple MacBook Pro 14 2023 M3 | |
| Average Apple M3 10-Core GPU | |
| Huawei MateBook X Pro 2023 | |
| SCHENKER Vision 14 2023 | |
| GTA V | |
| 1920x1080 High/On (Advanced Graphics Off) AA:2xMSAA + FX AF:8x | |
| Lenovo Yoga Pro 9-14IRP G8 | |
| Gigabyte Aero 14 OLED BMF | |
| Average of class Multimedia (11.8 - 181.9, n=82, last 2 years) | |
| Apple MacBook Pro 14 2023 M3 | |
| Average Apple M3 10-Core GPU | |
| Lenovo Yoga Slim 7 14APU G8 | |
| Apple MacBook Pro 14 2023 M2 Pro Entry | |
| Huawei MateBook X Pro 2023 | |
| SCHENKER Vision 14 2023 | |
| 1920x1080 Highest Settings possible AA:4xMSAA + FX AF:16x | |
| Lenovo Yoga Pro 9-14IRP G8 | |
| Gigabyte Aero 14 OLED BMF | |
| Average of class Multimedia (4.24 - 123, n=81, last 2 years) | |
| Apple MacBook Pro 14 2023 M3 | |
| Average Apple M3 10-Core GPU | |
| Lenovo Yoga Slim 7 14APU G8 | |
| Huawei MateBook X Pro 2023 | |
| SCHENKER Vision 14 2023 | |
| Shadow of the Tomb Raider | |
| 1920x1080 High Preset AA:SM | |
| Average of class Multimedia (38 - 146, n=10, last 2 years) | |
| Apple MacBook Pro 14 2023 M2 Pro | |
| Apple MacBook Pro 14 2023 M2 Pro Entry | |
| Apple MacBook Pro 16 2021 M1 Pro | |
| Apple MacBook Pro 14 2023 M3 | |
| Average Apple M3 10-Core GPU | |
| Apple MacBook Pro 13 2022 M2 | |
| Apple MacBook Air 15 2023 M2 16 GB | |
| Huawei MateBook X Pro 2023 | |
| 1920x1080 Highest Preset AA:T | |
| Average of class Multimedia (32 - 153, n=11, last 2 years) | |
| Apple MacBook Pro 14 2023 M2 Pro | |
| Apple MacBook Pro 14 2023 M2 Pro Entry | |
| Apple MacBook Pro 16 2021 M1 Pro | |
| Apple MacBook Pro 14 2023 M3 | |
| Average Apple M3 10-Core GPU | |
| Apple MacBook Pro 13 2022 M2 | |
| Apple MacBook Air 15 2023 M2 16 GB | |
| Huawei MateBook X Pro 2023 | |
| Total War: Three Kingdoms | |
| 1920x1080 Medium (incl textures) | |
| Average of class Multimedia (52 - 170, n=6, last 2 years) | |
| Apple MacBook Pro 14 2023 M2 Pro | |
| Apple MacBook Pro 14 2023 M2 Pro Entry | |
| Apple MacBook Pro 16 2021 M1 Pro | |
| Apple MacBook Pro 14 2023 M3 | |
| Average Apple M3 10-Core GPU | |
| Apple MacBook Pro 13 2022 M2 | |
| Apple MacBook Air 15 2023 M2 16 GB | |
| 1920x1080 High (incl textures) | |
| Average of class Multimedia (33 - 113, n=6, last 2 years) | |
| Apple MacBook Pro 14 2023 M2 Pro | |
| Apple MacBook Pro 14 2023 M2 Pro Entry | |
| Apple MacBook Pro 16 2021 M1 Pro | |
| Apple MacBook Pro 14 2023 M3 | |
| Average Apple M3 10-Core GPU | |
| Apple MacBook Pro 13 2022 M2 | |
| Apple MacBook Air 15 2023 M2 16 GB | |
| Far Cry 5 | |
| 1920x1080 High Preset AA:T | |
| Lenovo Yoga Pro 9-14IRP G8 | |
| Average of class Multimedia (9 - 154, n=52, last 2 years) | |
| Lenovo Yoga Slim 7 14APU G8 | |
| Apple MacBook Pro 14 2023 M3 | |
| Average Apple M3 10-Core GPU | |
| Huawei MateBook X Pro 2023 | |
| SCHENKER Vision 14 2023 | |
| 1920x1080 Ultra Preset AA:T | |
| Lenovo Yoga Pro 9-14IRP G8 | |
| Average of class Multimedia (11 - 145, n=51, last 2 years) | |
| Lenovo Yoga Slim 7 14APU G8 | |
| Apple MacBook Pro 14 2023 M3 | |
| Average Apple M3 10-Core GPU | |
| Huawei MateBook X Pro 2023 | |
| SCHENKER Vision 14 2023 | |
| low | med. | high | ultra | QHD | |
| GTA V (2015) | 98 | 83 | 68 | 44 | |
| The Witcher 3 (2015) | 38 | 28 | |||
| Far Cry 5 (2018) | 79 | 46 | 42 | 39 | 26 |
| Shadow of the Tomb Raider (2018) | 102 | 45 | 41 | 36 | 23 |
| Total War: Three Kingdoms (2019) | 151 | 52 | 33 | 24 | 15 |
| Cyberpunk 2077 2.0 Phantom Liberty (2023) | 33 | 25.7 | 21.3 | 18.1 | |
| Total War Pharaoh (2023) | 134 | 86 | 45 | 36 | 24 |
Emissions - M3 MacBook Pro with just one fan
System Noise
We already mentioned that the MacBook Pro 14 only uses one fan and it is usually always turned off in light to medium workloads. The initial fan stage at 2500 rpm is also basically inaudible. When you stress the CPU or both the CPU/GPU, however, the fan will quickly increase the speed and we can measure up to 48.5 dB(A) in our stress test. This is very loud and the fan noise is also a bit annoying (slight drone). The maximum speed of the fan is 6.800 rpm (50 dB(A)), but we had to select the speed manually. This fan stage might be used when the ambient temperatures are higher.
Pure CPU load will result in around 38 dB(A) and we noticed massive differences when you play games. We saw everything between 2500 rpm (almost inaudible, Total War: Three Kingdoms), 4000 rpm (33.7 dB(A), Far Cry 5) up to 6400 rpm (47.8 dB(A), Cyberpunk 2077) in emulated titles, while the native games Resident Evil Village or No Man’s Sky resulted in ~4500 rpm (37 dB(A)). We did not notice any electronic noises.
Noise Level
| Idle |
| 24.2 / 24.2 / 24.2 dB(A) |
| Load |
| 25.1 / 48.5 dB(A) |
 | ||
30 dB silent 40 dB(A) audible 50 dB(A) loud |
||
min: | ||
| Apple MacBook Pro 14 2023 M3 M3 10-Core GPU, M3, Apple SSD AP1024Z | Apple MacBook Pro 14 2023 M2 Pro Entry M2 Pro 16-Core GPU, M2 Pro 10-Core, Apple SSD AP0512Z | Apple MacBook Pro 13 2022 M2 M2 10-Core GPU, M2, Apple SSD AP1024Z | Huawei MateBook X Pro 2023 Iris Xe G7 96EUs, i7-1360P | Lenovo Yoga Pro 9-14IRP G8 NVIDIA GeForce RTX 4050 Laptop GPU, i7-13705H, Samsung PM9A1 MZVL21T0HCLR | Gigabyte Aero 14 OLED BMF NVIDIA GeForce RTX 4050 Laptop GPU, i7-13700H, Gigabyte AG470S1TB-SI B10 | SCHENKER Vision 14 2023 Iris Xe G7 96EUs, i7-13700H, Samsung 990 Pro 1 TB | |
|---|---|---|---|---|---|---|---|
| Noise | 2% | -4% | -15% | -31% | -19% | -21% | |
| off / environment * | 24.2 | 23.6 2% | 23.9 1% | 25.4 -5% | 24.8 -2% | 24 1% | 24.5 -1% |
| Idle Minimum * | 24.2 | 23.6 2% | 23.9 1% | 25.4 -5% | 24.8 -2% | 24 1% | 24.5 -1% |
| Idle Average * | 24.2 | 23.6 2% | 23.9 1% | 25.4 -5% | 24.8 -2% | 24 1% | 24.5 -1% |
| Idle Maximum * | 24.2 | 23.6 2% | 23.9 1% | 29.6 -22% | 24.8 -2% | 35.71 -48% | 30.4 -26% |
| Load Average * | 25.1 | 24.2 4% | 23.9 5% | 42 -67% | 47.4 -89% | 39.5 -57% | |
| Witcher 3 ultra * | 25.1 | 34.6 -38% | 52.9 -111% | 40.22 -60% | 41.7 -66% | ||
| Load Maximum * | 48.5 | 47.5 2% | 49 -1% | 40.9 16% | 52.9 -9% | 51.93 -7% | 44.9 7% |
* ... smaller is better
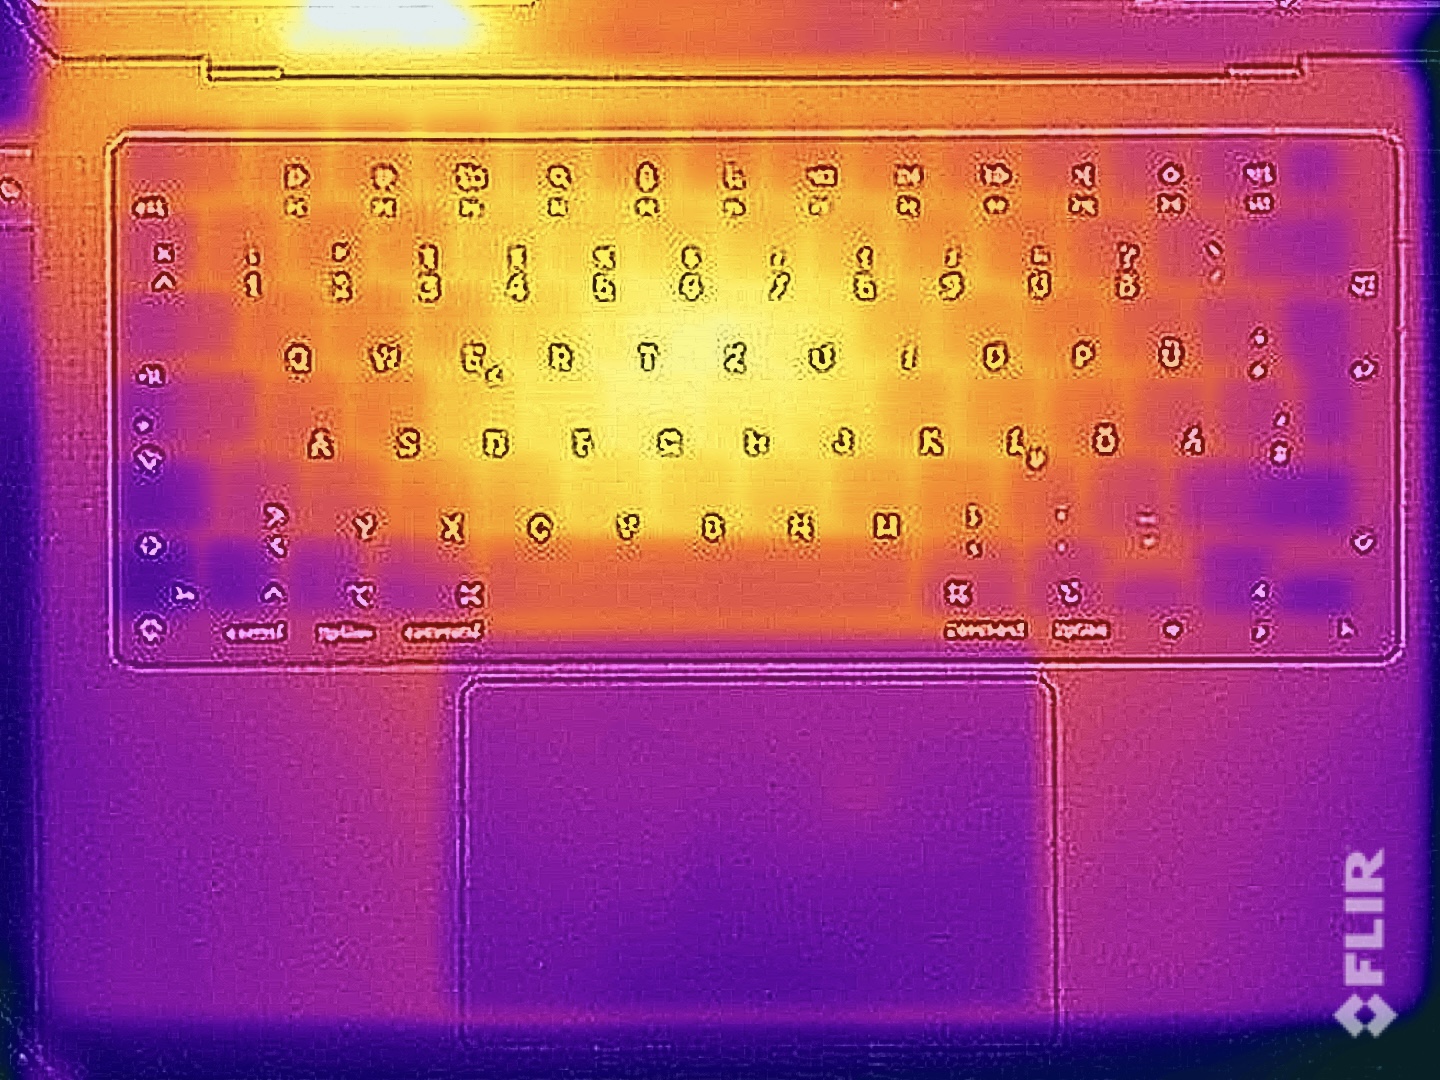
Temperature
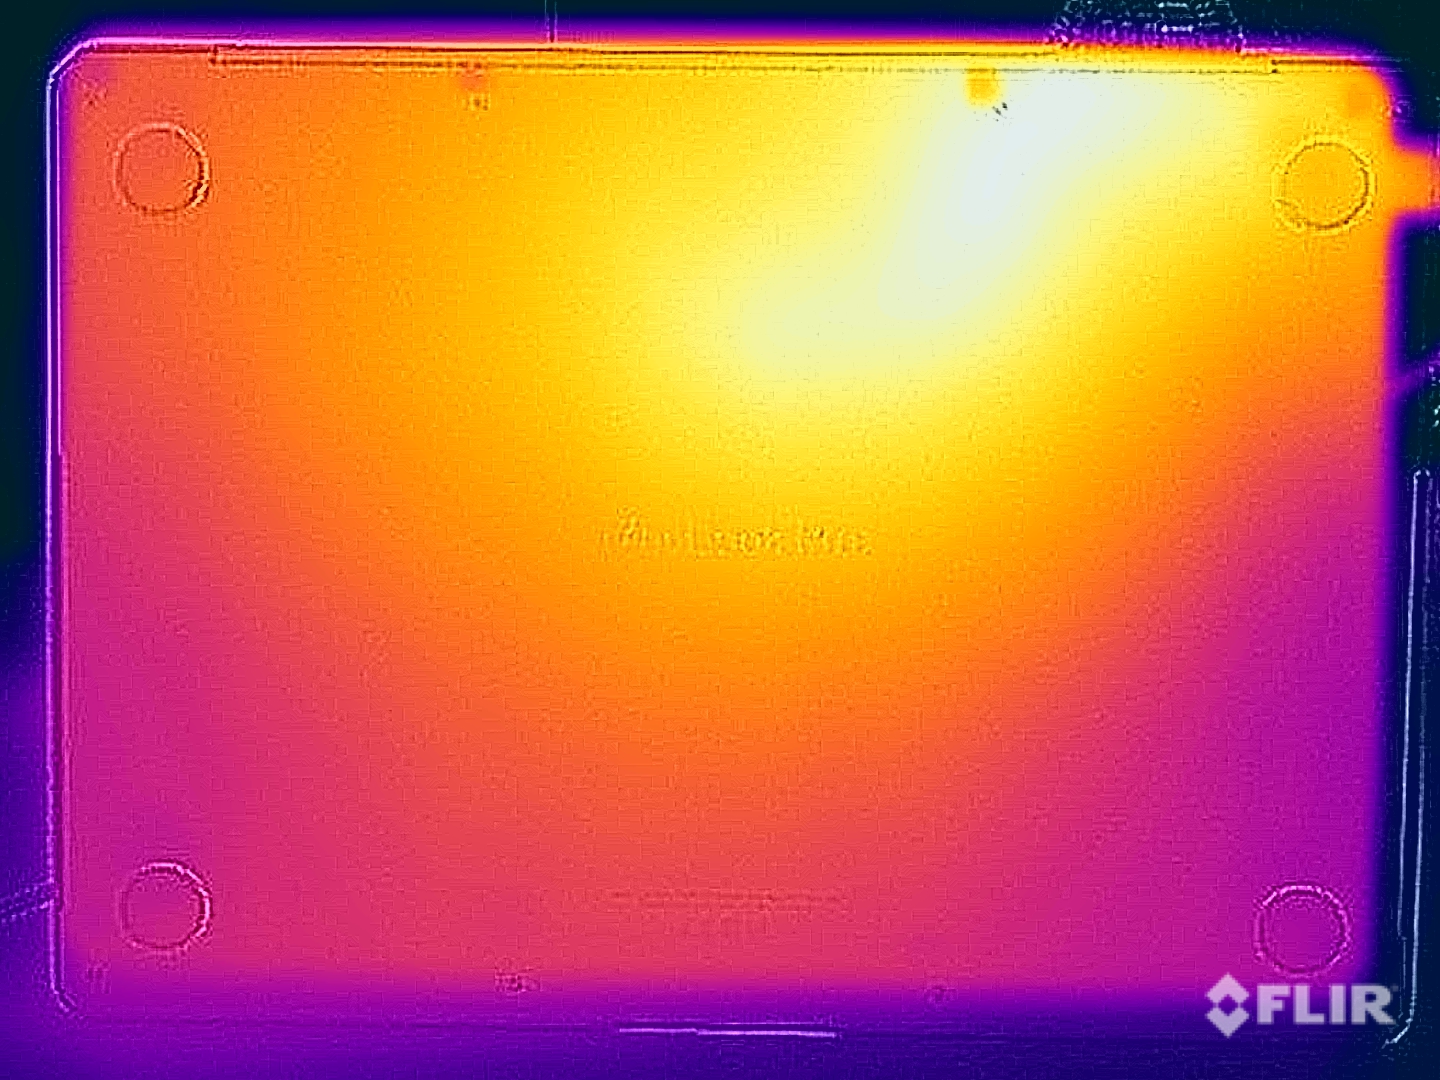
The metal chassis of the MacBook Pro 14 M3 stays very cool during light workloads and the temperature distribution is very even. If you start to stress the laptop, you will notice the asymmetrical cooling solution. The left side of the chassis is warmer than the right side and the hot spot is in the upper center area where the M3 SoC is located. However, maximum temperatures are completely uncritical at up to 41 °C at the top and 40 °C at the bottom of the base unit, respectively, which means you can put it on your laps even under maximum load. The temperature inside the chassis is much higher and as per usual for MacBooks, the SoC constantly hovers around 101-102 °C during our stress test.
(±) The maximum temperature on the upper side is 41.3 °C / 106 F, compared to the average of 36.9 °C / 98 F, ranging from 21.1 to 71 °C for the class Multimedia.
(+) The bottom heats up to a maximum of 39.6 °C / 103 F, compared to the average of 39.2 °C / 103 F
(+) In idle usage, the average temperature for the upper side is 23 °C / 73 F, compared to the device average of 31.2 °C / 88 F.
(±) Playing The Witcher 3, the average temperature for the upper side is 36.3 °C / 97 F, compared to the device average of 31.2 °C / 88 F.
(+) The palmrests and touchpad are reaching skin temperature as a maximum (33 °C / 91.4 F) and are therefore not hot.
(-) The average temperature of the palmrest area of similar devices was 28.9 °C / 84 F (-4.1 °C / -7.4 F).
| Apple MacBook Pro 14 2023 M3 Apple M3, Apple M3 10-Core GPU | Apple MacBook Pro 14 2023 M2 Pro Entry Apple M2 Pro 10-Core, Apple M2 Pro 16-Core GPU | Apple MacBook Pro 13 2022 M2 Apple M2, Apple M2 10-Core GPU | Huawei MateBook X Pro 2023 Intel Core i7-1360P, Intel Iris Xe Graphics G7 96EUs | Lenovo Yoga Pro 9-14IRP G8 Intel Core i7-13705H, NVIDIA GeForce RTX 4050 Laptop GPU | Gigabyte Aero 14 OLED BMF Intel Core i7-13700H, NVIDIA GeForce RTX 4050 Laptop GPU | SCHENKER Vision 14 2023 Intel Core i7-13700H, Intel Iris Xe Graphics G7 96EUs | |
|---|---|---|---|---|---|---|---|
| Heat | -3% | -9% | -29% | -21% | -15% | -13% | |
| Maximum Upper Side * | 41.3 | 47 -14% | 45.1 -9% | 46.5 -13% | 41 1% | 42 -2% | 45.8 -11% |
| Maximum Bottom * | 39.6 | 42.8 -8% | 43 -9% | 44.7 -13% | 56.7 -43% | 52 -31% | 42 -6% |
| Idle Upper Side * | 23.2 | 22.3 4% | 25.2 -9% | 34.9 -50% | 27.4 -18% | 26 -12% | 27.5 -19% |
| Idle Bottom * | 23.3 | 21.7 7% | 25.4 -9% | 32.9 -41% | 29.1 -25% | 27 -16% | 27.1 -16% |
* ... smaller is better
Stress test
Apple traditionally favors the graphics performance when you stress both the CPU and GPU simultaneously, and this is once again the case for the new MacBook Pro 14 M3. The GPU consumes the full ~15 Watts while the CPU starts with 20 Watts and then levels off at ~14-15 Watts. This means Apple can cool around 28 Watts for sustained load scenarios with the single fan. We have also added the previous entry-level MacBook Pro 14 M2 Pro. The 16-core GPU was more powerful and consumed 25 Watts during the stress test, while the processor was limited to around 10 Watts. This means the M2 Pro with two fans managed 35 Watts for sustained workloads. This indicates that the MacBook Pro 14 could have utilized the full performance of the M3 SoC with two fans, but Apple decided to save the money for the second fan.
Speakers
Competitiors like the MateBook X Pro, Yoga Pro 9i and especially the Yoga Slim 7 are closing the gap, but the sound system of the MacBook Pro 14 is still one of the best and you will not be disappointed. The sound from the 6-speaker system is powerful and loud, so external speakers are usually not necessary.
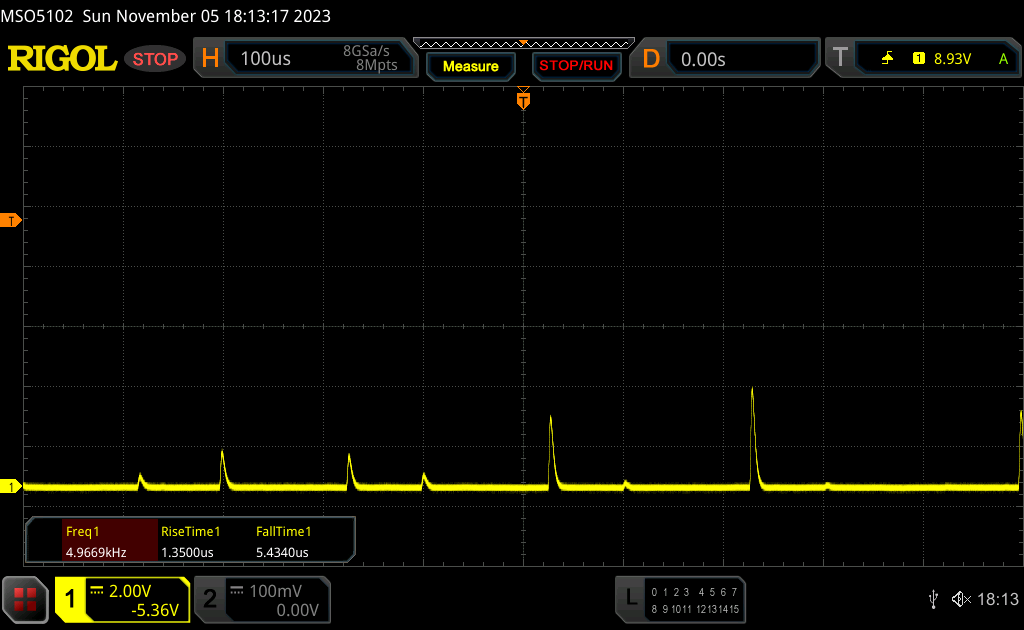
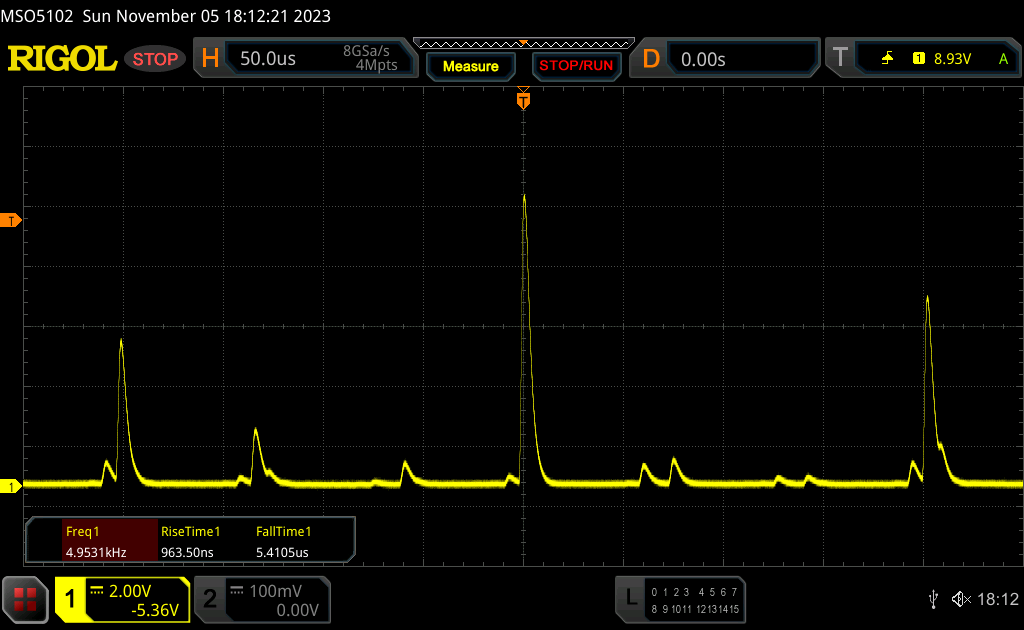
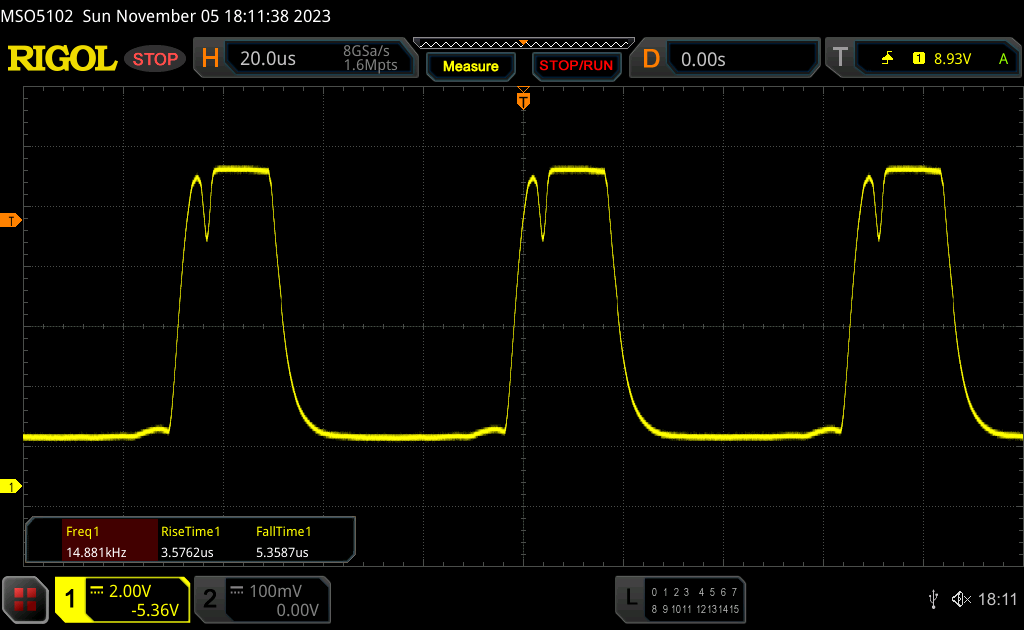
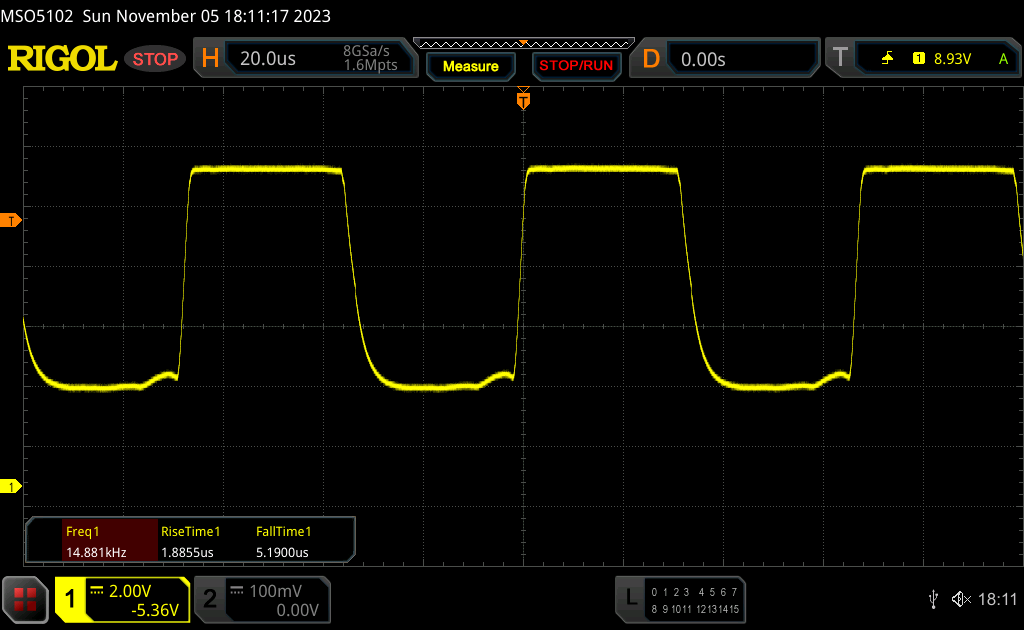
Apple MacBook Pro 14 2023 M3 audio analysis
(+) | speakers can play relatively loud (84 dB)
Bass 100 - 315 Hz
(+) | good bass - only 4.7% away from median
(±) | linearity of bass is average (8.2% delta to prev. frequency)
Mids 400 - 2000 Hz
(+) | balanced mids - only 1.1% away from median
(+) | mids are linear (2.4% delta to prev. frequency)
Highs 2 - 16 kHz
(+) | balanced highs - only 2.1% away from median
(+) | highs are linear (2.6% delta to prev. frequency)
Overall 100 - 16.000 Hz
(+) | overall sound is linear (5.6% difference to median)
Compared to same class
» 1% of all tested devices in this class were better, 1% similar, 98% worse
» The best had a delta of 5%, average was 18%, worst was 45%
Compared to all devices tested
» 0% of all tested devices were better, 0% similar, 100% worse
» The best had a delta of 4%, average was 26%, worst was 134%
Huawei MateBook X Pro 2023 audio analysis
(+) | speakers can play relatively loud (94 dB)
Bass 100 - 315 Hz
(±) | reduced bass - on average 9.2% lower than median
(+) | bass is linear (4.9% delta to prev. frequency)
Mids 400 - 2000 Hz
(+) | balanced mids - only 1.8% away from median
(+) | mids are linear (3.7% delta to prev. frequency)
Highs 2 - 16 kHz
(±) | higher highs - on average 6.5% higher than median
(±) | linearity of highs is average (8.1% delta to prev. frequency)
Overall 100 - 16.000 Hz
(+) | overall sound is linear (10.3% difference to median)
Compared to same class
» 5% of all tested devices in this class were better, 2% similar, 94% worse
» The best had a delta of 5%, average was 19%, worst was 53%
Compared to all devices tested
» 3% of all tested devices were better, 1% similar, 96% worse
» The best had a delta of 4%, average was 26%, worst was 134%
Lenovo Yoga Pro 9-14IRP G8 audio analysis
(±) | speaker loudness is average but good (81.8 dB)
Bass 100 - 315 Hz
(±) | reduced bass - on average 5.9% lower than median
(±) | linearity of bass is average (7.8% delta to prev. frequency)
Mids 400 - 2000 Hz
(+) | balanced mids - only 2.3% away from median
(+) | mids are linear (3.2% delta to prev. frequency)
Highs 2 - 16 kHz
(+) | balanced highs - only 2.5% away from median
(+) | highs are linear (3.4% delta to prev. frequency)
Overall 100 - 16.000 Hz
(+) | overall sound is linear (7.3% difference to median)
Compared to same class
» 4% of all tested devices in this class were better, 1% similar, 96% worse
» The best had a delta of 5%, average was 18%, worst was 45%
Compared to all devices tested
» 1% of all tested devices were better, 0% similar, 99% worse
» The best had a delta of 4%, average was 26%, worst was 134%
Energy Management - Very long battery runtime
Power Consumption
The idle consumption is pretty much identical to the previous MacBook Pro 14 Entry with the M2 Pro, which means the efficiency is better considering the increased SDR brightness of the screen. Our load scenarios clearly show the lower power consumption of the M3 chip compared to the M2 Pro and the maximum value at the beginning of the stress test is 67 Watts, which levels off at around 57 Watts over the course of the test. This means the included 70-Watt PSU is sufficient and the optional 96-Watt adapter does not any performance benefits for the base MacBook Pro 14.
| Off / Standby | |
| Idle | |
| Load |
|
| Apple MacBook Pro 14 2023 M3 M3, M3 10-Core GPU, Apple SSD AP1024Z, Mini-LED, 3024x1964, 14.20 | Apple MacBook Pro 14 2023 M2 Pro Entry M2 Pro 10-Core, M2 Pro 16-Core GPU, Apple SSD AP0512Z, Mini-LED, 3024x1964, 14.20 | Apple MacBook Pro 13 2022 M2 M2, M2 10-Core GPU, Apple SSD AP1024Z, IPS, 2560x1600, 13.30 | Huawei MateBook X Pro 2023 i7-1360P, Iris Xe G7 96EUs, , IPS, 3120x2080, 14.20 | Lenovo Yoga Pro 9-14IRP G8 i7-13705H, NVIDIA GeForce RTX 4050 Laptop GPU, Samsung PM9A1 MZVL21T0HCLR, Mini-LED, 3072x1920, 14.50 | Gigabyte Aero 14 OLED BMF i7-13700H, NVIDIA GeForce RTX 4050 Laptop GPU, Gigabyte AG470S1TB-SI B10, OLED, 2880x1800, 14.00 | SCHENKER Vision 14 2023 i7-13700H, Iris Xe G7 96EUs, Samsung 990 Pro 1 TB, IPS, 2880x1800, 14.00 | Average Apple M3 10-Core GPU | Average of class Multimedia | |
|---|---|---|---|---|---|---|---|---|---|
| Power Consumption | -18% | 19% | -31% | -181% | -84% | -17% | 0% | -90% | |
| Idle Minimum * | 2.2 | 2.5 -14% | 1.77 20% | 4.1 -86% | 10.9 -395% | 7.4 -236% | 4.2 -91% | 2.2 -0% | 7.55 ? -243% |
| Idle Average * | 12 | 12.1 -1% | 6.7 44% | 6.6 45% | 17.7 -48% | 8.3 31% | 7.4 38% | 12 -0% | 11.7 ? 2% |
| Idle Maximum * | 12.2 | 12.3 -1% | 6.9 43% | 8 34% | 19.3 -58% | 8.7 29% | 8 34% | 12.2 -0% | 14.6 ? -20% |
| Load Average * | 36.4 | 49.8 -37% | 30.9 15% | 61 -68% | 93.3 -156% | 76 -109% | 42.8 -18% | 36.4 -0% | 77.3 ? -112% |
| Witcher 3 ultra * | 31.9 | 46.6 -46% | 38.9 -22% | 56 -76% | 129.5 -306% | 70 -119% | 47.9 -50% | ||
| Load Maximum * | 66.7 | 71.4 -7% | 56 16% | 90 -35% | 150.2 -125% | 132 -98% | 76 -14% | 66.7 -0% | 117.9 ? -77% |
* ... smaller is better
Power Consumption Witcher 3 / Stress test
Power Consumption external screen
Battery Runtime
The battery capacity of the base model is 70 Wh and therefore a bit smaller compared to the more expensive moels with the M3 Pro/M3 Max (72.4 Wh), but the battery runtime is still extremely long. You can drain the battery under load in ~1.5 hours if you want to, but you also get uncompromised performance in return. Our Wi-Fi test at an adjusted brightness of 150 nits runs for 15 hours and 51 minutes, which is considerable longer compared to the MBP 14 M2 Pro at around 13 hours. Only the smaller MacBook Pro 13 M2 had an advantage (19 hours). The Windows competition cannot keep up with these results, only the Schenker Vision 14 with the larger 99 Wh battery is pretty close with around 14 hours.
If you use the full SDR brightness, our Wi-Fi test only runs for little more than 6 hours and therefore half an hour shorter compared to the MBP 14 with the M2 Pro, which is a direct result of the increased SDR brightness (600 nits). Schenker’s Vision 14 also lasts longer at 10 hours, but cannot match the brightness of the MBP 14. The other Mini-LED rival in this comparison group, the Yoga Pro 9i, is clearly beaten in the Wi-Fi test (8 and 5 hours, respectively).
Our video test at 150 nits runs for 19 hours, which is once again a great result. If you prefer HDR videos at full brightness, you can expect little more than 5 hours.
| PSU | 20 % | 40 % | 50 % | 80 % | 90 % | 100 % |
|---|---|---|---|---|---|---|
| 70-Watt | 16 minutes | 30 minutes | 38 minutes | 63 minutes | 78 minutes | 115 minutes |
| 96-Watt | 14 minutes | 26 minutes | 32 minutes | 56 minutes | 71 minutes | 113 minutes |
We checked the charging time (device turned on) with the standard 70W power adapter as well as the optional 96W unit, but you can see that the difference is not really that big. A full recharge takes under two hours for both adapters, so the optional 96W adapter does not make much sense for the MBP 14 M3.
| Apple MacBook Pro 14 2023 M3 M3, M3 10-Core GPU, 70 Wh | Apple MacBook Pro 14 2023 M2 Pro Entry M2 Pro 10-Core, M2 Pro 16-Core GPU, 70 Wh | Apple MacBook Pro 13 2022 M2 M2, M2 10-Core GPU, 58.2 Wh | Huawei MateBook X Pro 2023 i7-1360P, Iris Xe G7 96EUs, 60 Wh | Lenovo Yoga Pro 9-14IRP G8 i7-13705H, NVIDIA GeForce RTX 4050 Laptop GPU, 75 Wh | Gigabyte Aero 14 OLED BMF i7-13700H, NVIDIA GeForce RTX 4050 Laptop GPU, 63 Wh | SCHENKER Vision 14 2023 i7-13700H, Iris Xe G7 96EUs, 99 Wh | Average of class Multimedia | |
|---|---|---|---|---|---|---|---|---|
| Battery Runtime | -17% | 11% | -22% | -43% | -29% | -13% | -31% | |
| H.264 | 1143 | 982 -14% | 1153 1% | 527 -54% | 547 -52% | 621 ? -46% | ||
| WiFi v1.3 | 951 | 774 -19% | 1144 20% | 580 -39% | 477 -50% | 457 -52% | 823 -13% | 530 ? -44% |
| Load | 98 | 124 27% | 72 -27% | 92 -6% | 95.2 ? -3% |
Pros
Cons
Verdict - The new base MacBook Pro 14 M3 is a downgrade

Apple finally replaces the small MacBook Pro 13 with the Touch Bar and offers a new entry-level model of the larger MacBook Pro 14 with the new base M3 SoC instead. At first glance, it is obviously much more affordable with a starting price of $1599, but you have to keep in mind that this model only comes with 8 GB RAM. There are also deficits compared to the faster MacBook Pro 14 models, because the removal of one fan results in reduced cooling performance and you cannot utilize the full potential of the new M3 SoC when you stress both the CPU and GPU, despite the loud fan noise. The USB-C port on the right side is gone as well and the two USB-C ports on the left do not support Thunderbolt 4, which is similar to the MacBook Air. The base MBP 14 can only drive one external screen and the SSD is not attached via PCIe 4.0.
Apple’s new M3 SoC benefits heavily from the new 3 nm manufacturing process. The power consumption is similar to last year’s M2 SoC, but the performance is higher. The basic configuration with four performance and four efficiency cores is identical, but the clocks are higher. We see advantages of around 20 % over the M2 both in single-core as well as multi-core scenarios. The problem is the comparison with the M2 Pro MacBook Pro 14, because the M2 Pro is still faster in multi-core and GPU benchmarks. The new 10-core M3 GPU is 10-20 % faster than the M2 GPU, but the power consumption is also a bit higher. We will check the efficiency in our analysis article, which will be published soon.
Apple’s new M3 SoC (3 nm) is much more efficient, but feels a bit misplaced in the MacBook Pro 14. Considering the deficits in terms of connectivity and cooling performance as well as just 8 GB RAM, the lower starting price of $1599 is a bit misleading.
Otherwise, there are no major changes for the MacBook Pro 14. The chassis is identical, which still means you cannot upgrade the RAM or SSD capacity. Considering Apple’s high upgrade prices this is a big disadvantage, especially in terms of the SSD. Apple increases the maximum SDR brightness of the display from 500 to 600 nits and we can confirm that. The subjective picture quality of the Mini-LED screen is still great and we once again have to praise the excellent HDR implementation of macOS. The panel will simply increase the HDR brightness when HDR contents are shown and users do not have to worry about anything. Windows laptops are much more complicated in this regard.
If you are interested in the base model of the MacBook Pro 14, you should get the old M2 Pro version as long as it is still available. The SDR brightness and the single-core performance are lower, but it is a much better package overall.
All in all, the new entry-level version of the MacBook Pro 14 with the base M3 SoC is a very responsive laptop with long battery runtimes, excellent display, high-quality chassis and great speakers. However, you just notice that Apple cut the cost in some areas and the old entry-level MacBook Pro 14 with the M2 Pro simply had a much better price-performance ratio. If you are interested in the entry-level version, you should get the old M2 Pro unit as long as it is still available. The only use case for the MBP 14 M3 would be if you basically just need MacBook Air performance, but you want a better screen (HDR and 120 Hz). However, this comes at a price and the price-performance ratio of the new MBP 14 M3 is just not very good, even for Apple standards and we have to criticize the meager RAM equipment in particular. The Windows competition is often more affordable and has more maintenance options. Models with the GeForce RTX 4050 Laptop are also better choices if you want to play games. Lenovo’s Yoga Pro 9i offers the superior Mini-LED panel in some respects, it does not use the individual lighting zones for SDR contents and even covers the wider AdobeRGB gamut, but the battery runtime is much shorter in return.
Price and Availability
You can order the new MacBook Pro 14 M3 (available November 7th) from Amazon. The base model retails for $1599 and the higher M3 spec with an upgraded 1 TB SSD retails for $1799.
Apple MacBook Pro 14 2023 M3
-
11/06/2023 v7
Andreas Osthoff
More articles related to this device
Apple MacBook Pro 14 2023 M3 (MacBook Pro 14 2023 Series)Related Articles


Transparency
The present review sample was made available to the author as a loan by the manufacturer or a shop for the purposes of review. The lender had no influence on this review, nor did the manufacturer receive a copy of this review before publication. There was no obligation to publish this review.
Pricecompare
