 Deutsch
 English
 Español
 Français
 Italiano
 Nederlands
 Polski
 Português
 Русский
 Türkçe
 Svenska
 Chinese
 Magyar
Asus ROG Strix SCAR 17 X3D review - The world's fastest gaming laptop
The ROG Strix SCAR 17 might not be Asus' most modern gaming PC - but it's certainly one of the fastest on the market. We have already tested a variety of configurations, first and foremost the version with AMD's Zen4 processor Ryzen 9 7945HX as well as the Nvidia GeForce RTX 4090 Laptop. With the brand-new ROG Strix SCAR 17 X3D, Asus has cooperated with AMD to be the first manufacturer to install the new Ryzen 9 7945HX3D into a laptop which will have its supposedly already good gaming performance increased even more through additional 3D V-Cache.
Aside from the processor, the ROG Strix SCAR 17 X3D offers nothing new, which means we will be concentrating fully on its performance and emissions in this review. For further information on its case, connectivity, input devices, display and speakers, you can take a look at our previous review. Furthermore, we would recommend taking a look at our analysis article to go with the new AMD Ryzen 9 7945HX3D, which includes all of the processor's technical information:
Possible competitors compared
Rating | Date | Model | Weight | Height | Size | Resolution | Best Price |
|---|---|---|---|---|---|---|---|
| 87.2 % | 08/2023 | Asus ROG Strix Scar 17 G733PYV-LL053X R9 7945HX3D, NVIDIA GeForce RTX 4090 Laptop GPU | 2.9 kg | 28.3 mm | 17.30" | 2560x1440 | |
| 88.3 % | 04/2023 | Asus ROG Strix Scar 17 G733PY-XS96 R9 7945HX, NVIDIA GeForce RTX 4090 Laptop GPU | 2.9 kg | 28.3 mm | 17.30" | 2560x1440 | |
| 90.7 % | 04/2023 | Alienware m18 R1 i9-13980HX, NVIDIA GeForce RTX 4090 Laptop GPU | 3.9 kg | 26.7 mm | 18.00" | 1920x1200 | |
| 86.6 % | 02/2023 | Asus ROG Strix Scar 18 2023 G834JY-N6005W i9-13980HX, NVIDIA GeForce RTX 4090 Laptop GPU | 3.1 kg | 30.8 mm | 18.00" | 2560x1600 | |
| 89 % | 02/2023 | MSI Titan GT77 HX 13VI i9-13950HX, NVIDIA GeForce RTX 4090 Laptop GPU | 3.5 kg | 23 mm | 17.30" | 3840x2160 | |
| 85.5 % | 06/2023 | SCHENKER Key 17 Pro (Early 23) i9-13900HX, NVIDIA GeForce RTX 4090 Laptop GPU | 3.4 kg | 24.9 mm | 17.30" | 3840x2160 |
Performance - The SCAR 17 X3D with the best of AMD & Nvidia
Compared to the regular ROG Strix SCAR 17 with the Ryzen 9 7945HX, this version features an important change regarding the processor's cooling. Due to the new 7945HX3D processor's metal surface texture, no liquid metal can be used - instead, the device relies on regular thermal paste. In general, its TDP classification remains the same according to Asus, but it takes its toll on the laptop's performance.
Testing conditions
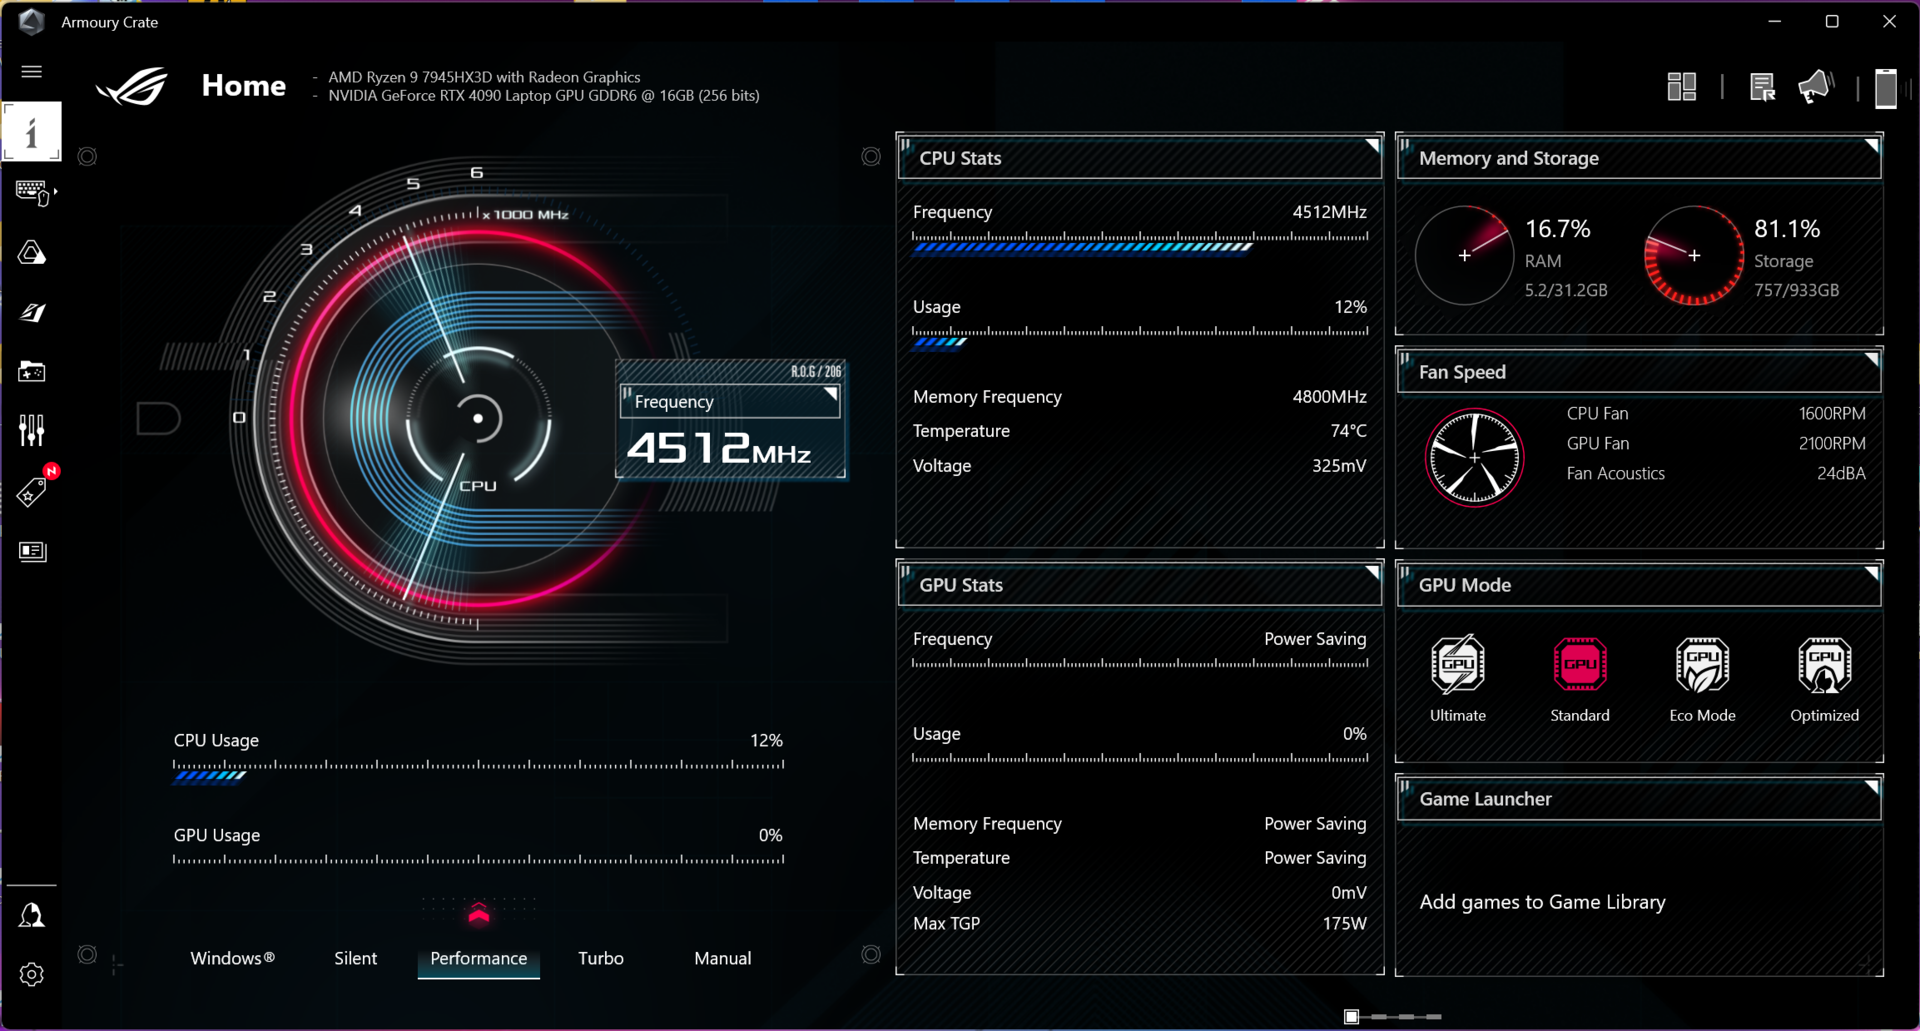
The pre-installed Armoury Crate software gives you access to the well-known energy profiles Silent, Performance and Turbo. Additionally, there is a manual mode which lets you change the TDP/TGP values for the CPU/GPU. There are also a few GPU modes to choose from - in our test, we utilized the mode Ultimate in coordination with the energy profile Turbo. The following table contains the respective TDP/TGP values in the different energy profiles. In battery mode, the Turbo profile is not available.
| Scenario | Silent | Performance | Turbo |
|---|---|---|---|
| CPU load | 65/55 watts | 90/85 watts | 125/90 watts |
| GPU load | D-Notify | 140 + 20 watts Dynamic Boost | 150 + 25 watts Dynamic Boost |
| Stress test | CPU: 35 watts GPU: D-Notify |
CPU: 40 watts GPU: 150 watts |
CPU: 50 watts GPU: 175 watts |
Please note: D-Notify is an Nvidia-specific function. With the D-Notify function activated, the GPU will increase its power consumption based on the application/load until the GPU reaches a temperature of 75 °C. In this case, the TGP is limited to 55 watts.
Processor - Ryzen 9 7945HX3D
The new AMD Ryzen 9 7945HX3D's basic technical specifications are identical to the regular Ryzen 9 7945HX: 16 Zen4 cores (32 threads) with a maximum clock of up to 5.4 GHz. However, on the new model, the 80-MB cache (16 MB L2 + 64 MB L3) is increased by an additional 64-MB L3 cache. All further technical information regarding this can be found in our analysis of the new Ryzen 9 7945HX3D.
In contrast to the SCAR 17 with the normal Ryzen 9 7945HX, the benchmarks run using the new version showed lower total power consumption values. We noted a maximum of up to 115 watts which quickly balanced out at 100 watts. Here, the missing liquid metal already makes itself known. The benchmark results are still phenomenal in total - although, when it comes to pure CPU performance, the normal 7945HX models do have a slight advantage. Again, its total performance is comparable with the Intel HX CPUs, which only did better in certain single-core tests. At the same time, you shouldn't forget that the Intel chips use considerably more power - in single-core use and especially when all the cores are loaded. To compare: The Ryzen 9 7945HX3D with 100 watts was considerably faster in the multi-core tests compared to the Core i9-13980HX at 170 watts.
In battery use, the processor uses a maximum of 85 watts for a short space of time, after which it balances out quickly at 55 watts. In the Cinebench R23 Multi test, this was enough to secure itself 24,127 points, equivalent to a deficit of 26 %. Its single-core use was not limited. Further CPU benchmarks can be found in our tech section.
Cinebench R15 Multi continuous test
Cinebench R23: Multi Core | Single Core
Cinebench R20: CPU (Multi Core) | CPU (Single Core)
Cinebench R15: CPU Multi 64Bit | CPU Single 64Bit
Blender: v2.79 BMW27 CPU
7-Zip 18.03: 7z b 4 | 7z b 4 -mmt1
Geekbench 5.5: Multi-Core | Single-Core
HWBOT x265 Benchmark v2.2: 4k Preset
LibreOffice : 20 Documents To PDF
R Benchmark 2.5: Overall mean
* ... smaller is better
AIDA64: FP32 Ray-Trace | FPU Julia | CPU SHA3 | CPU Queen | FPU SinJulia | FPU Mandel | CPU AES | CPU ZLib | FP64 Ray-Trace | CPU PhotoWorxx
System performance
The new ROG Strix SCAR 17 X3D also did better than the competition in the synthetic PCMark 10 test - although, the differences weren't big and in everyday use, all the comparison devices are extremely fast. The AMD test device only came just behind its fastest Intel competitors in the cross-platform CrossMark test.
CrossMark: Overall | Productivity | Creativity | Responsiveness
| PCMark 10 Score | 9117 points | |
Help | ||
* ... smaller is better
DPC latency
In our standardized latency test (web browsing, 4K YouTube playback, CPU load), our test device showed slight restrictions when using real-time audio applications with the present BIOS version.
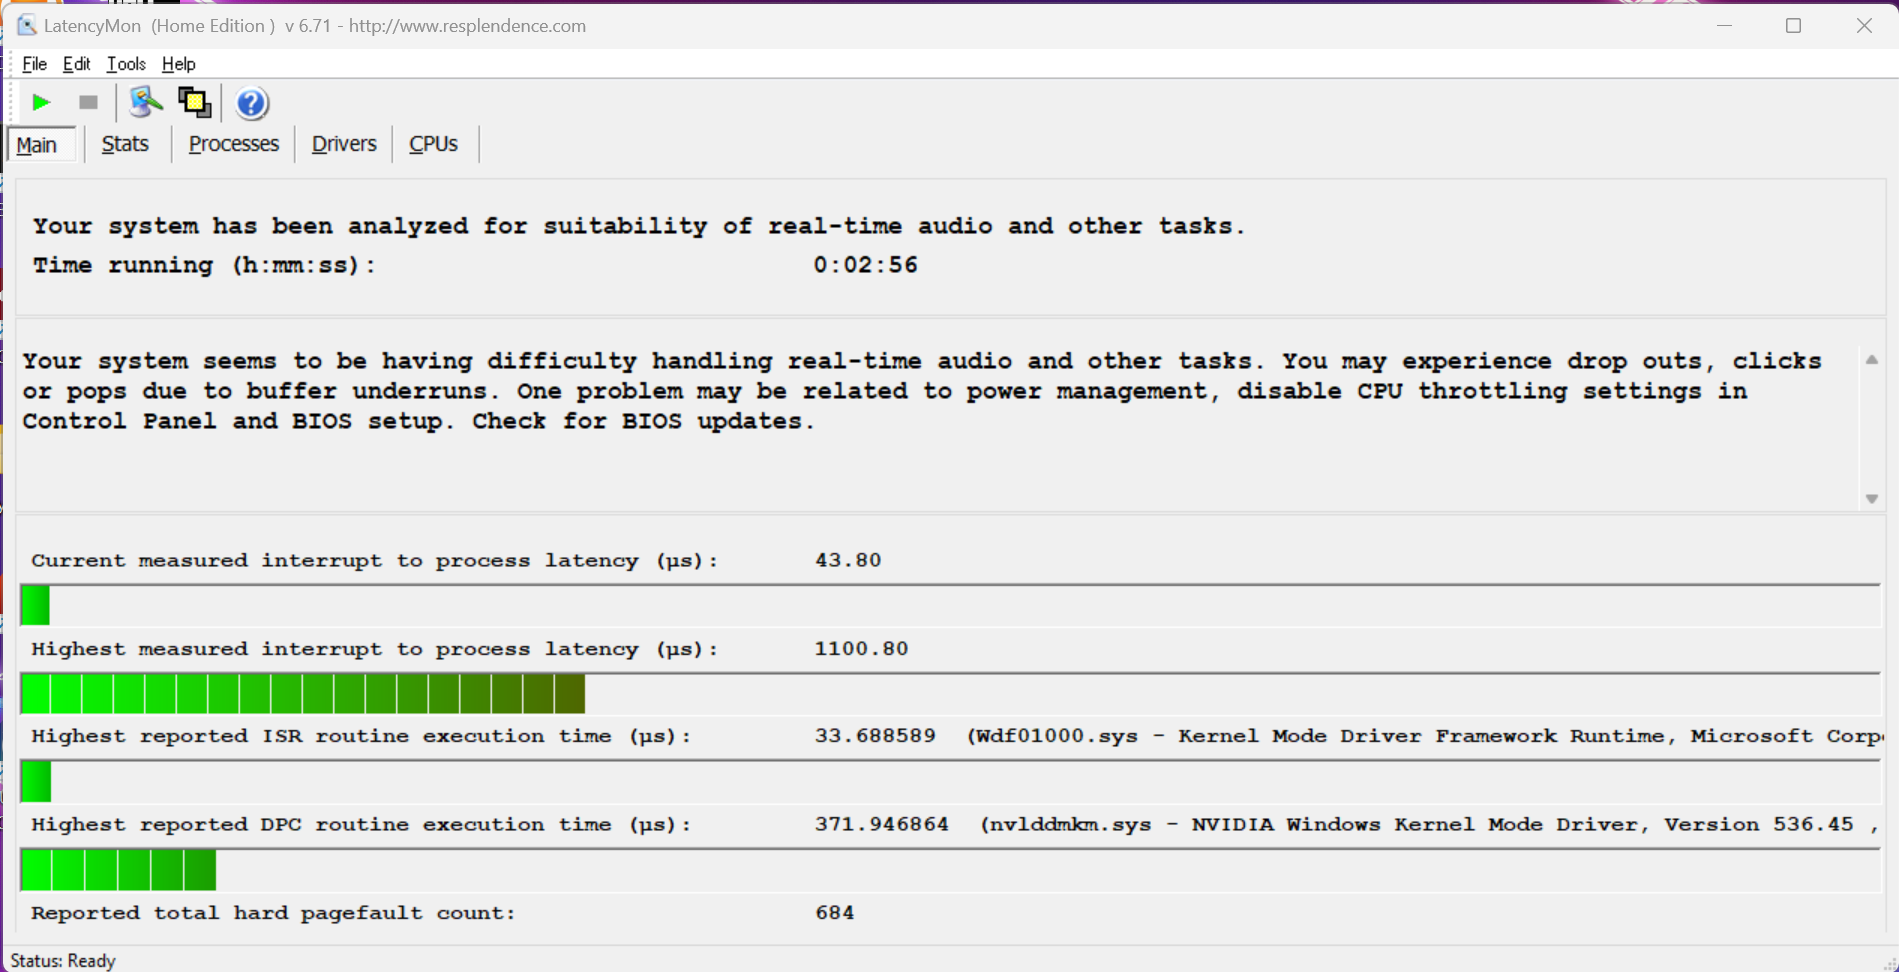
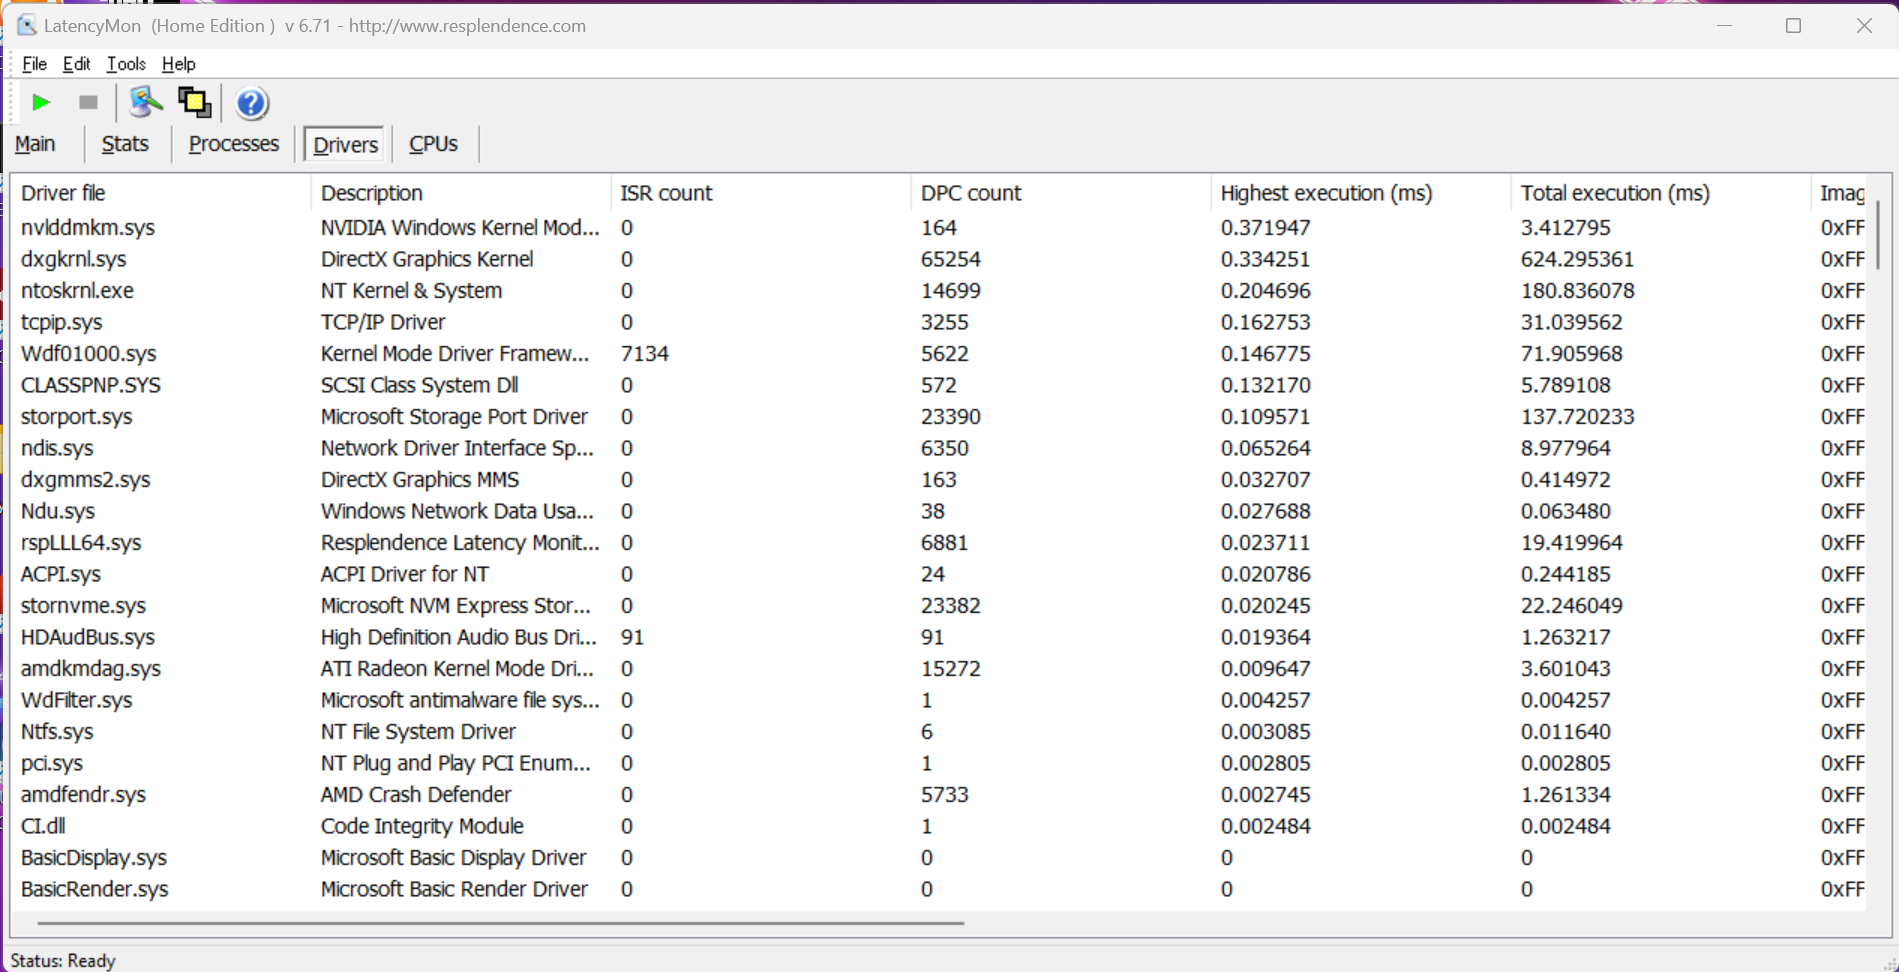
| DPC Latencies / LatencyMon - interrupt to process latency (max), Web, Youtube, Prime95 | |
| Asus ROG Strix Scar 17 G733PYV-LL053X | |
* ... smaller is better
Storage devices
A 1-TB SSD from SK Hynix (PC801) is installed into the ROG Strix SCAR 17 X3D. The M.2 2280 SSD is connected via the fast PCIe 4.0 interface and delivers very good transfer rates. Moreover, its performance remains stable even under permanent load. After the first start-up, users have 868 GB available - but thanks to the second M.2 slot (also M.2 2280, PCIe 4.0), the storage space can be expanded if necessary. More SSD benchmarks are listed here.

Reading continuous performance: DiskSpd Read Loop, Queue Depth 8
Graphics card - GeForce RTX 4090 Laptop
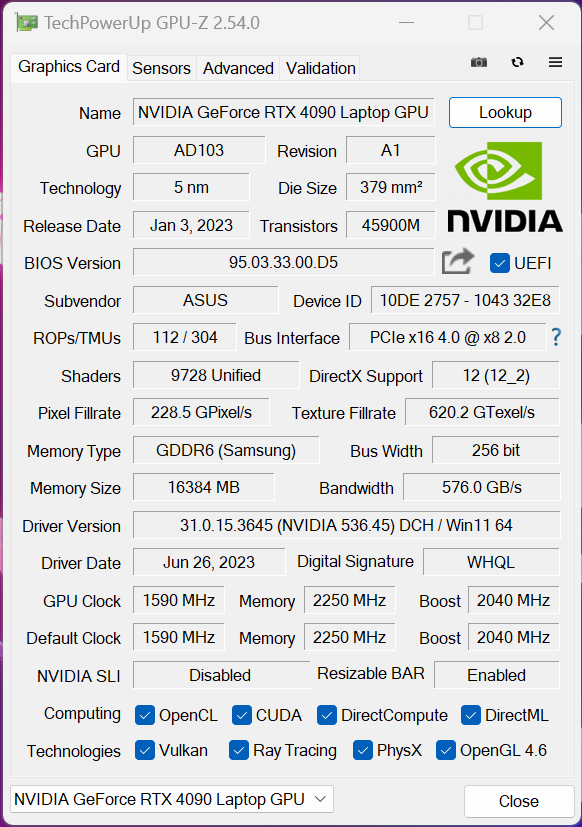
The ROG Strix SCAR 17 X3D supports Nvidia's Advanced Optimus technology. When completing easy tasks, the processor's integrated Radeon 610M takes care of graphics processing and for more demanding tasks (e.g. gaming) the laptop automatically switches to the dedicated GeForce RTX 4090 Laptop. Thanks to an integrated MUX switch, the iGPU can be deactivated without the laptop having to be completely restarted. With a maximum power consumption of 175 watts (150 watts TGP + 25 watts Dynamic Boost), this is one of the fastest versions of the RTX 4090 Laptop.
There may have been one or two differences in the benchmarks but in total, the laptops fitted with the RTX 4090 Laptop work practically the same. In battery use, the GeForce RTX 4090 Laptop could consume a maximum of 55 watts which was enough to secure itself a graphics score of 5,590 points in our Time Spy test. This corresponds to a whopping 75 % deficit. Further GPU benchmarks can be found here.
| 3DMark 11 - 1280x720 Performance GPU | |
| Alienware m18 R1 | |
| SCHENKER Key 17 Pro (Early 23) | |
| MSI Titan GT77 HX 13VI | |
| Average NVIDIA GeForce RTX 4090 Laptop GPU (56764 - 73027, n=25) | |
| Asus ROG Strix Scar 17 G733PYV-LL053X | |
| Asus ROG Strix Scar 18 2023 G834JY-N6005W | |
| Asus ROG Strix Scar 17 G733PY-XS96 | |
| Lenovo Legion Pro 7 RTX4090 | |
| Asus ROG Zephyrus M16 GU604VY-NM042X | |
| Lenovo Legion Pro 5 16ARX8 | |
| Average of class Gaming (1029 - 72070, n=235, last 2 years) | |
| 3DMark | |
| 1920x1080 Fire Strike Graphics | |
| Asus ROG Strix Scar 17 G733PY-XS96 | |
| Asus ROG Strix Scar 17 G733PYV-LL053X | |
| MSI Titan GT77 HX 13VI | |
| Asus ROG Strix Scar 18 2023 G834JY-N6005W | |
| Alienware m18 R1 | |
| Average NVIDIA GeForce RTX 4090 Laptop GPU (41210 - 53059, n=25) | |
| Lenovo Legion Pro 7 RTX4090 | |
| Asus ROG Zephyrus M16 GU604VY-NM042X | |
| SCHENKER Key 17 Pro (Early 23) | |
| Lenovo Legion Pro 5 16ARX8 | |
| Average of class Gaming (781 - 53059, n=241, last 2 years) | |
| 2560x1440 Time Spy Graphics | |
| Alienware m18 R1 | |
| Asus ROG Strix Scar 17 G733PY-XS96 | |
| MSI Titan GT77 HX 13VI | |
| SCHENKER Key 17 Pro (Early 23) | |
| Asus ROG Strix Scar 17 G733PYV-LL053X | |
| Lenovo Legion Pro 7 RTX4090 | |
| Asus ROG Strix Scar 18 2023 G834JY-N6005W | |
| Average NVIDIA GeForce RTX 4090 Laptop GPU (17620 - 23292, n=25) | |
| Asus ROG Zephyrus M16 GU604VY-NM042X | |
| Lenovo Legion Pro 5 16ARX8 | |
| Average of class Gaming (224 - 22547, n=241, last 2 years) | |
| 3DMark 11 Performance | 47621 points | |
| 3DMark Fire Strike Score | 41279 points | |
| 3DMark Time Spy Score | 19832 points | |
Help | ||
| Blender / v3.3 Classroom OPTIX/RTX | |
| Average of class Gaming (9 - 142, n=139, last 2 years) | |
| Lenovo Legion Pro 5 16ARX8 | |
| Asus ROG Zephyrus M16 GU604VY-NM042X | |
| Lenovo Legion Pro 7 RTX4090 | |
| Average NVIDIA GeForce RTX 4090 Laptop GPU (9 - 15, n=22) | |
| MSI Titan GT77 HX 13VI | |
| Asus ROG Strix Scar 17 G733PY-XS96 | |
| SCHENKER Key 17 Pro (Early 23) | |
| Asus ROG Strix Scar 17 G733PYV-LL053X | |
| Asus ROG Strix Scar 18 2023 G834JY-N6005W | |
* ... smaller is better
Gaming Performance
Now it's time to take a look at the gaming benchmarks. Firstly, we will be looking at Full HD resolution. Here, the new Ryzen 9 7945HX3D could clearly show its strengths in certain games and we often noted two-digit percentage advantages; in Far Cry 5, we even measured a whopping 36 % advantage over the regular Ryzen 9 7945HX as well as Intel's HX CPUs. However, there was also no advantage in a few games, such as The Witcher 3 or Call of Duty Modern Warfare 2.
| The Witcher 3 - 1920x1080 Ultra Graphics & Postprocessing (HBAO+) | |
| Alienware m18 R1 | |
| Asus ROG Strix Scar 17 G733PYV-LL053X | |
| SCHENKER Key 17 Pro (Early 23) | |
| Asus ROG Strix Scar 17 G733PY-XS96 | |
| Lenovo Legion Pro 7 RTX4090 | |
| MSI Titan GT77 HX 13VI | |
| Lenovo Legion Pro 5 16ARX8 | |
| Average of class Gaming (8.61 - 216, n=235, last 2 years) | |
| GTA V - 1920x1080 Highest Settings possible AA:4xMSAA + FX AF:16x | |
| Asus ROG Strix Scar 17 G733PYV-LL053X | |
| Alienware m18 R1 | |
| Lenovo Legion Pro 7 RTX4090 | |
| SCHENKER Key 17 Pro (Early 23) | |
| Asus ROG Strix Scar 18 2023 G834JY-N6005W | |
| MSI Titan GT77 HX 13VI | |
| Lenovo Legion Pro 5 16ARX8 | |
| Asus ROG Strix Scar 17 G733PY-XS96 | |
| Average of class Gaming (6.38 - 167.7, n=224, last 2 years) | |
| Final Fantasy XV Benchmark - 1920x1080 High Quality | |
| Alienware m18 R1 | |
| MSI Titan GT77 HX 13VI | |
| SCHENKER Key 17 Pro (Early 23) | |
| Lenovo Legion Pro 7 RTX4090 | |
| Asus ROG Strix Scar 17 G733PYV-LL053X | |
| Asus ROG Strix Scar 18 2023 G834JY-N6005W | |
| Asus ROG Strix Scar 17 G733PY-XS96 | |
| Lenovo Legion Pro 5 16ARX8 | |
| Average of class Gaming (9.13 - 194.9, n=234, last 2 years) | |
| Strange Brigade - 1920x1080 ultra AA:ultra AF:16 | |
| Asus ROG Strix Scar 17 G733PYV-LL053X | |
| SCHENKER Key 17 Pro (Early 23) | |
| MSI Titan GT77 HX 13VI | |
| Alienware m18 R1 | |
| Asus ROG Strix Scar 18 2023 G834JY-N6005W | |
| Lenovo Legion Pro 7 RTX4090 | |
| Lenovo Legion Pro 5 16ARX8 | |
| Average of class Gaming (14.6 - 421, n=232, last 2 years) | |
| Dota 2 Reborn - 1920x1080 ultra (3/3) best looking | |
| Asus ROG Strix Scar 17 G733PYV-LL053X | |
| Alienware m18 R1 | |
| Asus ROG Strix Scar 18 2023 G834JY-N6005W | |
| MSI Titan GT77 HX 13VI | |
| SCHENKER Key 17 Pro (Early 23) | |
| Lenovo Legion Pro 7 RTX4090 | |
| Lenovo Legion Pro 5 16ARX8 | |
| Asus ROG Strix Scar 17 G733PY-XS96 | |
| Average of class Gaming (26.9 - 220, n=247, last 2 years) | |
| X-Plane 11.11 - 1920x1080 high (fps_test=3) | |
| Asus ROG Strix Scar 17 G733PYV-LL053X | |
| Alienware m18 R1 | |
| Asus ROG Strix Scar 18 2023 G834JY-N6005W | |
| SCHENKER Key 17 Pro (Early 23) | |
| Lenovo Legion Pro 7 RTX4090 | |
| MSI Titan GT77 HX 13VI | |
| MSI Titan GT77 HX 13VI | |
| Lenovo Legion Pro 5 16ARX8 | |
| Average of class Gaming (12.4 - 166.2, n=251, last 2 years) | |
| Asus ROG Strix Scar 17 G733PY-XS96 | |
| Shadow of the Tomb Raider - 1920x1080 Highest Preset AA:T | |
| Asus ROG Strix Scar 17 G733PYV-LL053X | |
| Asus ROG Strix Scar 17 G733PY-XS96 | |
| MSI Titan GT77 HX 13VI | |
| Lenovo Legion Pro 5 16ARX8 | |
| Average of class Gaming (27 - 271, n=31, last 2 years) | |
| Asus ROG Strix Scar 18 2023 G834JY-N6005W | |
| F1 22 - 1920x1080 Ultra High Preset AA:T AF:16x | |
| Alienware m18 R1 | |
| MSI Titan GT77 HX 13VI | |
| Asus ROG Strix Scar 17 G733PYV-LL053X | |
| Lenovo Legion Pro 7 RTX4090 | |
| Asus ROG Strix Scar 18 2023 G834JY-N6005W | |
| Asus ROG Strix Scar 17 G733PY-XS96 | |
| Lenovo Legion Pro 5 16ARX8 | |
| Average of class Gaming (13 - 144.7, n=93, last 2 years) | |
| Far Cry 5 - 1920x1080 Ultra Preset AA:T | |
| Asus ROG Strix Scar 17 G733PYV-LL053X | |
| MSI Titan GT77 HX 13VI | |
| Asus ROG Strix Scar 18 2023 G834JY-N6005W | |
| Asus ROG Strix Scar 17 G733PY-XS96 | |
| Average of class Gaming (14 - 218, n=134, last 2 years) | |
| Far Cry 6 - 1920x1080 Ultra Graphics Quality + HD Textures AA:T | |
| Asus ROG Strix Scar 17 G733PYV-LL053X | |
| MSI Titan GT77 HX 13VI | |
| Asus ROG Strix Scar 17 G733PY-XS96 | |
| Lenovo Legion Pro 5 16ARX8 | |
| Average of class Gaming (14.7 - 167, n=48, last 2 years) | |
| Call of Duty Modern Warfare 2 2022 - 1920x1080 Extreme Quality Preset AA:T2X Filmic SM | |
| Asus ROG Strix Scar 17 G733PYV-LL053X | |
| Asus ROG Strix Scar 17 G733PY-XS96 | |
| MSI Titan GT77 HX 13VI | |
| Asus ROG Strix Scar 18 2023 G834JY-N6005W | |
| Average of class Gaming (17 - 182, n=36, last 2 years) | |
| Lenovo Legion Pro 5 16ARX8 | |
| Cyberpunk 2077 1.6 - 1920x1080 Ultra Preset | |
| Asus ROG Strix Scar 17 G733PYV-LL053X | |
| MSI Titan GT77 HX 13VI | |
| Asus ROG Strix Scar 17 G733PY-XS96 | |
| Alienware m18 R1 | |
| Asus ROG Strix Scar 18 2023 G834JY-N6005W | |
| Lenovo Legion Pro 5 16ARX8 | |
| Average of class Gaming (16.7 - 159.7, n=115, last 2 years) | |
In QHD resolution, the new processor also showed its benefits, although the difference wasn't quite as large here when compared to the 1080p settings. In total, the Ryzen 9 7945HX3D is still able to offer better performance than its competitors - sometimes still enough to secure itself a two-digit percentage advantage.
| Shadow of the Tomb Raider - 2560x1440 Highest Preset AA:T | |
| Asus ROG Strix Scar 17 G733PYV-LL053X | |
| Asus ROG Strix Scar 17 G733PY-XS96 | |
| MSI Titan GT77 HX 13VI | |
| Lenovo Legion Pro 7 RTX4090 | |
| Far Cry 5 - 2560x1440 Ultra Preset AA:T | |
| Asus ROG Strix Scar 17 G733PYV-LL053X | |
| MSI Titan GT77 HX 13VI | |
| Asus ROG Strix Scar 17 G733PY-XS96 | |
| Far Cry 6 - 2560x1440 Ultra Graphics Quality + HD Textures AA:T | |
| Asus ROG Strix Scar 17 G733PYV-LL053X | |
| MSI Titan GT77 HX 13VI | |
| Asus ROG Strix Scar 17 G733PY-XS96 | |
| Final Fantasy XV Benchmark - 2560x1440 High Quality | |
| MSI Titan GT77 HX 13VI | |
| Alienware m18 R1 | |
| SCHENKER Key 17 Pro (Early 23) | |
| Lenovo Legion Pro 7 RTX4090 | |
| Asus ROG Strix Scar 17 G733PYV-LL053X | |
| Asus ROG Strix Scar 17 G733PY-XS96 | |
| GTA V - 2560x1440 Highest Settings possible AA:4xMSAA + FX AF:16x | |
| Asus ROG Strix Scar 17 G733PYV-LL053X | |
| Alienware m18 R1 | |
| SCHENKER Key 17 Pro (Early 23) | |
| MSI Titan GT77 HX 13VI | |
| Lenovo Legion Pro 7 RTX4090 | |
| Asus ROG Strix Scar 17 G733PY-XS96 | |
| F1 22 - 2560x1440 Ultra High Preset AA:T AF:16x | |
| Alienware m18 R1 | |
| Asus ROG Strix Scar 17 G733PY-XS96 | |
| Asus ROG Strix Scar 17 G733PYV-LL053X | |
| MSI Titan GT77 HX 13VI | |
| Lenovo Legion Pro 7 RTX4090 | |
| Call of Duty Modern Warfare 2 2022 - 2560x1440 Extreme Quality Preset AA:T2X Filmic SM | |
| Asus ROG Strix Scar 17 G733PYV-LL053X | |
| MSI Titan GT77 HX 13VI | |
| Asus ROG Strix Scar 17 G733PY-XS96 | |
| Lenovo Legion Pro 7 RTX4090 | |
| Cyberpunk 2077 1.6 - 2560x1440 Ultra Preset | |
| Asus ROG Strix Scar 17 G733PYV-LL053X | |
| Asus ROG Strix Scar 17 G733PY-XS96 | |
| Alienware m18 R1 | |
| Lenovo Legion Pro 7 RTX4090 | |
| MSI Titan GT77 HX 13VI | |
In 4K resolution, the new Ryzen 9 7945HX3D doesn't have any advantage over the regular Ryzen 9 7945HX or Intel's mobile HX processors - although, all the models range on a comparable level.
| Shadow of the Tomb Raider - 3840x2160 Highest Preset AA:T | |
| Lenovo Legion Pro 7 RTX4090 | |
| Asus ROG Strix Scar 17 G733PY-XS96 | |
| Asus ROG Strix Scar 17 G733PYV-LL053X | |
| MSI Titan GT77 HX 13VI | |
| Far Cry 5 - 3840x2160 Ultra Preset AA:T | |
| MSI Titan GT77 HX 13VI | |
| Asus ROG Strix Scar 17 G733PYV-LL053X | |
| Asus ROG Strix Scar 17 G733PY-XS96 | |
| Far Cry 6 - 3840x2160 Ultra Graphics Quality + HD Textures AA:T | |
| MSI Titan GT77 HX 13VI | |
| Asus ROG Strix Scar 17 G733PYV-LL053X | |
| Asus ROG Strix Scar 17 G733PY-XS96 | |
| Final Fantasy XV Benchmark - 3840x2160 High Quality | |
| MSI Titan GT77 HX 13VI | |
| Asus ROG Strix Scar 17 G733PY-XS96 | |
| Alienware m18 R1 | |
| SCHENKER Key 17 Pro (Early 23) | |
| Lenovo Legion Pro 7 RTX4090 | |
| Asus ROG Strix Scar 17 G733PYV-LL053X | |
| GTA V - 3840x2160 High/On (Advanced Graphics Off) AA:FX AF:8x | |
| Asus ROG Strix Scar 17 G733PYV-LL053X | |
| Alienware m18 R1 | |
| MSI Titan GT77 HX 13VI | |
| Lenovo Legion Pro 7 RTX4090 | |
| Asus ROG Strix Scar 17 G733PY-XS96 | |
| SCHENKER Key 17 Pro (Early 23) | |
| F1 22 - 3840x2160 Ultra High Preset AA:T AF:16x | |
| Lenovo Legion Pro 7 RTX4090 | |
| Asus ROG Strix Scar 17 G733PY-XS96 | |
| Alienware m18 R1 | |
| Asus ROG Strix Scar 17 G733PYV-LL053X | |
| MSI Titan GT77 HX 13VI | |
| Call of Duty Modern Warfare 2 2022 - 3840x2160 Extreme Quality Preset AA:T2X Filmic SM | |
| MSI Titan GT77 HX 13VI | |
| Asus ROG Strix Scar 17 G733PYV-LL053X | |
| Asus ROG Strix Scar 17 G733PY-XS96 | |
| Lenovo Legion Pro 7 RTX4090 | |
| Cyberpunk 2077 1.6 - 3840x2160 Ultra Preset | |
| MSI Titan GT77 HX 13VI | |
| Asus ROG Strix Scar 17 G733PYV-LL053X | |
| Lenovo Legion Pro 7 RTX4090 | |
| Alienware m18 R1 | |
| Asus ROG Strix Scar 17 G733PY-XS96 | |
| low | med. | high | ultra | QHD | 4K | |
| GTA V (2015) | 187.1 | 167.7 | 160.6 | 182.7 | ||
| The Witcher 3 (2015) | 414 | 207 | 163 | 155 | ||
| Dota 2 Reborn (2015) | 288 | 255 | 244 | 220 | 205 | |
| Final Fantasy XV Benchmark (2018) | 229 | 180 | 151.2 | 85 | ||
| X-Plane 11.11 (2018) | 196.3 | 190.3 | 166.2 | 139.5 | ||
| Far Cry 5 (2018) | 248 | 232 | 218 | 194 | 110 | |
| Strange Brigade (2018) | 460 | 420 | 318 | 161 | ||
| Shadow of the Tomb Raider (2018) | 293 | 271 | 199 | 104 | ||
| Assassin´s Creed Valhalla (2020) | 195 | 178 | 138 | 80 | ||
| F1 2021 (2021) | 685 | 616 | 470 | 271 | 204 | 115.1 |
| Far Cry 6 (2021) | 182 | 167 | 146 | 88 | ||
| Cyberpunk 2077 1.6 (2022) | 205 | 157 | 116 | 51 | ||
| F1 22 (2022) | 281 | 135.9 | 91.8 | 45 | ||
| Call of Duty Modern Warfare 2 2022 (2022) | 190 | 182 | 136 | 83 | ||
| Star Wars Jedi Survivor (2023) | 106 | 103 | 71 | 39 | ||
| F1 23 (2023) | 374 | 132 | 85.1 | 42.2 |
Emissions - The SCAR 17 has an annoying coil whine
Noise emissions
Of course, you have to expect to be able to hear the fans on a device as powerful as this - but still, the laptop features a silent mode which completely deactivates the fans in everyday use. This is really handy if you are surfing the web, writing emails or watching videos. Gaming isn't possible in this mode and in this case, we noted relatively decent noise emission values of about 41 dB(A). However, we did unfortunately note some really annoying coil whining noises during our gaming tests (and never during any other uses). The fans are considerably louder in Performance and Turbo mode (~48 dB(A) & 54 dB(A)), which even drowns out the coil whine. Regardless, we would recommend using headphones for either of these modes. The following table shows the fan noise emissions in various applications and energy profiles.
| Scenario | Silent | Performance | Turbo |
|---|---|---|---|
| 3DMark 06 | 30 dB(A) | 35.5 dB(A) | 53.4 dB(A) |
| The Witcher 3 (Ultra settings) | 40.9 dB(A) | 48.5 dB(A) | 53.4 dB(A) |
| Cyberpunk 2077 (Ultra settings) | 40.9 dB(A) | 48.5 dB(A) | 53.4 dB(A) |
| Stress test | 40.9 dB(A) | 48.5 dB(A) | 53.4 dB(A) |
Noise Level
| Idle |
| 23 / 27.7 / 34.7 dB(A) |
| Load |
| 53.4 / 53.4 dB(A) |
 | ||
30 dB silent 40 dB(A) audible 50 dB(A) loud |
||
min: | ||
| Asus ROG Strix Scar 17 G733PYV-LL053X NVIDIA GeForce RTX 4090 Laptop GPU, R9 7945HX3D, SK hynix PC801 HFS001TEJ9X101N | Asus ROG Strix Scar 17 G733PY-XS96 NVIDIA GeForce RTX 4090 Laptop GPU, R9 7945HX, SK hynix PC801 HFS001TEJ9X101N | Alienware m18 R1 NVIDIA GeForce RTX 4090 Laptop GPU, i9-13980HX, SK hynix PC801 HFS001TEJ9X101N | Asus ROG Strix Scar 18 2023 G834JY-N6005W NVIDIA GeForce RTX 4090 Laptop GPU, i9-13980HX, 2x Samsung PM9A1 MZVL21T0HCLR (RAID 0) | MSI Titan GT77 HX 13VI NVIDIA GeForce RTX 4090 Laptop GPU, i9-13950HX, Samsung PM9A1 MZVL22T0HBLB | SCHENKER Key 17 Pro (Early 23) NVIDIA GeForce RTX 4090 Laptop GPU, i9-13900HX, Samsung 990 Pro 2 TB MZVL72T0HDLB | |
|---|---|---|---|---|---|---|
| Noise | 9% | 12% | 2% | -5% | -17% | |
| off / environment * | 23 | 22.7 1% | 22.8 1% | 23.9 -4% | 24.6 -7% | 26 -13% |
| Idle Minimum * | 23 | 23.5 -2% | 23 -0% | 23.9 -4% | 29.2 -27% | 26 -13% |
| Idle Average * | 27.7 | 27.7 -0% | 23 17% | 32.6 -18% | 29.2 -5% | 33 -19% |
| Idle Maximum * | 34.7 | 27.7 20% | 23 34% | 32.6 6% | 29.2 16% | 46 -33% |
| Load Average * | 53.4 | 30.5 43% | 35.6 33% | 35.9 33% | 50.7 5% | 56 -5% |
| Witcher 3 ultra * | 53.4 | 51.4 4% | 51.3 4% | 53.3 -0% | 62 -16% | |
| Load Maximum * | 53.4 | 54.1 -1% | 56.7 -6% | 55.8 -4% | 61 -14% | 64 -20% |
* ... smaller is better
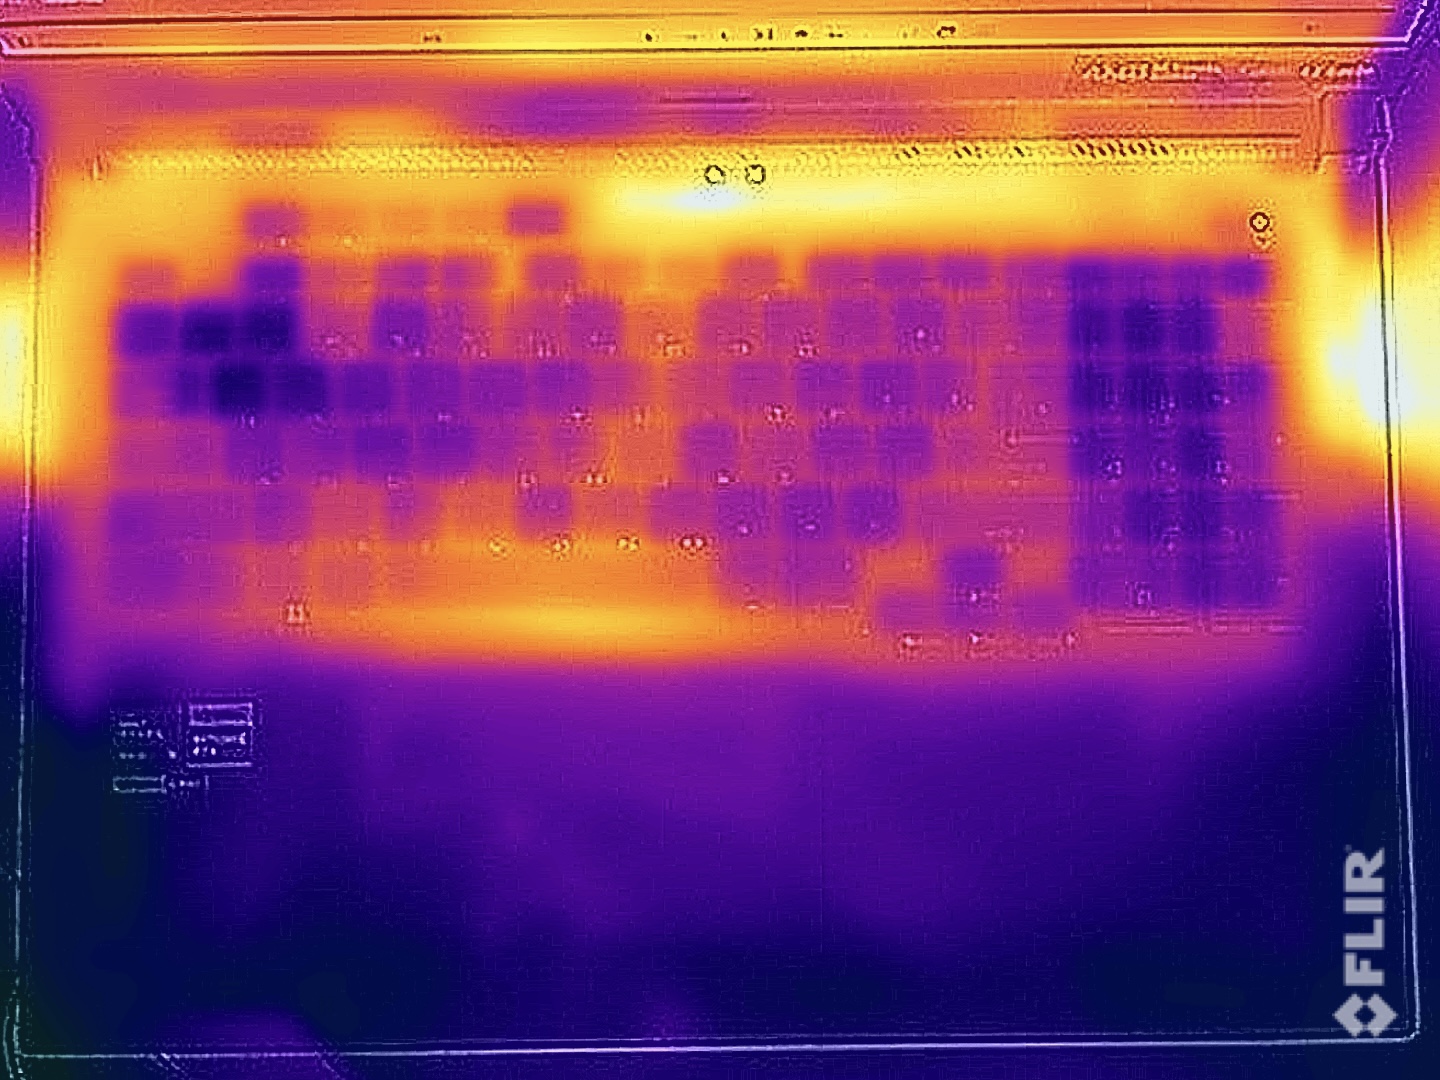
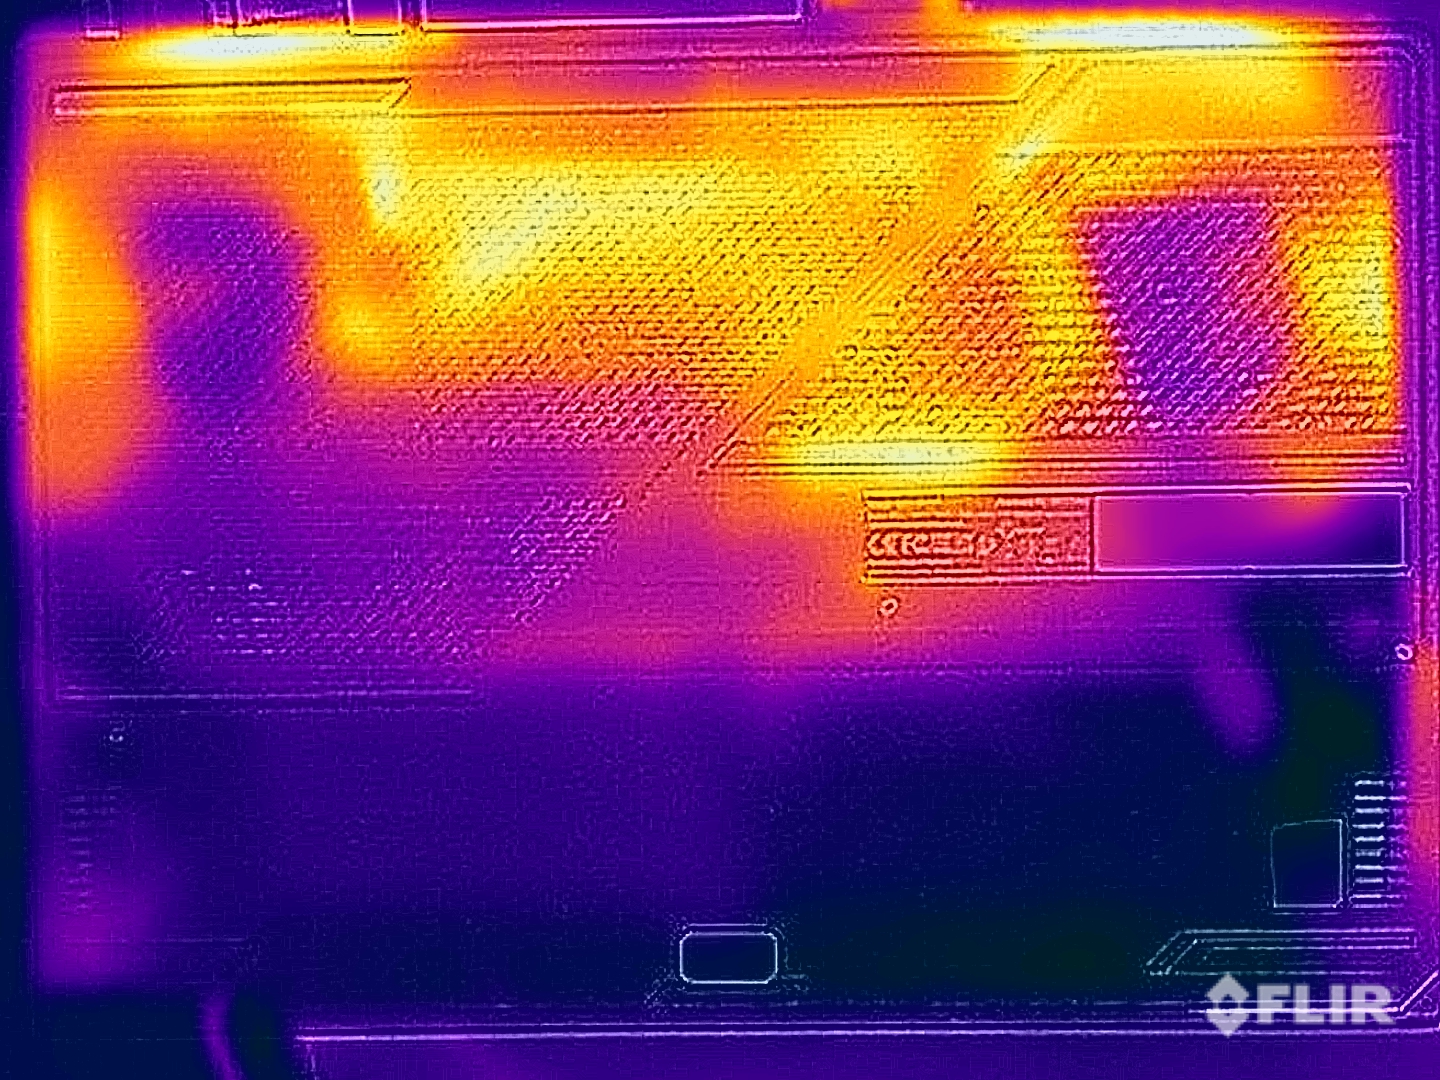
Temperature
Even under load, the laptop's surface temperatures proved to be totally fine - you could easily still place the SCAR 17 on your thighs while gaming without any complaints (although you probably won't want to due to its size). During the stress test, the GPU was favored, which was already clear when looking at the TDP/TGP configurations. At the beginning of the test, the processor consumed 85 watts and the GPU had a consumption of 120 watts - after a few minutes, the processor balanced out at 50 watts and the graphics card consumed 175 watts.
(±) The maximum temperature on the upper side is 40.1 °C / 104 F, compared to the average of 40.4 °C / 105 F, ranging from 21.2 to 68.8 °C for the class Gaming.
(-) The bottom heats up to a maximum of 46.7 °C / 116 F, compared to the average of 43.3 °C / 110 F
(+) In idle usage, the average temperature for the upper side is 25.8 °C / 78 F, compared to the device average of 33.9 °C / 93 F.
(±) Playing The Witcher 3, the average temperature for the upper side is 33.3 °C / 92 F, compared to the device average of 33.9 °C / 93 F.
(+) The palmrests and touchpad are cooler than skin temperature with a maximum of 25.6 °C / 78.1 F and are therefore cool to the touch.
(+) The average temperature of the palmrest area of similar devices was 29 °C / 84.2 F (+3.4 °C / 6.1 F).
| Asus ROG Strix Scar 17 G733PYV-LL053X AMD Ryzen 9 7945HX3D, NVIDIA GeForce RTX 4090 Laptop GPU | Asus ROG Strix Scar 17 G733PY-XS96 AMD Ryzen 9 7945HX, NVIDIA GeForce RTX 4090 Laptop GPU | Alienware m18 R1 Intel Core i9-13980HX, NVIDIA GeForce RTX 4090 Laptop GPU | Asus ROG Strix Scar 18 2023 G834JY-N6005W Intel Core i9-13980HX, NVIDIA GeForce RTX 4090 Laptop GPU | MSI Titan GT77 HX 13VI Intel Core i9-13950HX, NVIDIA GeForce RTX 4090 Laptop GPU | SCHENKER Key 17 Pro (Early 23) Intel Core i9-13900HX, NVIDIA GeForce RTX 4090 Laptop GPU | |
|---|---|---|---|---|---|---|
| Heat | 7% | 4% | -15% | 1% | -29% | |
| Maximum Upper Side * | 40.1 | 34.6 14% | 39 3% | 54 -35% | 40.6 -1% | 57 -42% |
| Maximum Bottom * | 46.7 | 35.6 24% | 36.4 22% | 46 1% | 41.1 12% | 60 -28% |
| Idle Upper Side * | 26.5 | 27.2 -3% | 29.2 -10% | 30 -13% | 26.2 1% | 32 -21% |
| Idle Bottom * | 27.7 | 30 -8% | 27.8 -0% | 31 -12% | 30.3 -9% | 34 -23% |
* ... smaller is better
Power management - A gaming laptop with little stamina
Power consumption
Unsurprisingly, the SCAR 17 X3D uses a ton of power and during the beginning of the stress test, we measured around 328 watts. After a short while, this evened out at 300 watts - while gaming, it consumed between 260 - 300 watts. As a result, the supplied power connection is sufficiently sized.
| Off / Standby | |
| Idle | |
| Load |
|
| Asus ROG Strix Scar 17 G733PYV-LL053X R9 7945HX3D, NVIDIA GeForce RTX 4090 Laptop GPU, SK hynix PC801 HFS001TEJ9X101N, IPS, 2560x1440, 17.30 | Asus ROG Strix Scar 17 G733PY-XS96 R9 7945HX, NVIDIA GeForce RTX 4090 Laptop GPU, SK hynix PC801 HFS001TEJ9X101N, IPS, 2560x1440, 17.30 | Alienware m18 R1 i9-13980HX, NVIDIA GeForce RTX 4090 Laptop GPU, SK hynix PC801 HFS001TEJ9X101N, IPS, 1920x1200, 18.00 | Asus ROG Strix Scar 18 2023 G834JY-N6005W i9-13980HX, NVIDIA GeForce RTX 4090 Laptop GPU, 2x Samsung PM9A1 MZVL21T0HCLR (RAID 0), IPS, 2560x1600, 18.00 | MSI Titan GT77 HX 13VI i9-13950HX, NVIDIA GeForce RTX 4090 Laptop GPU, Samsung PM9A1 MZVL22T0HBLB, Mini-LED, 3840x2160, 17.30 | SCHENKER Key 17 Pro (Early 23) i9-13900HX, NVIDIA GeForce RTX 4090 Laptop GPU, Samsung 990 Pro 2 TB MZVL72T0HDLB, IPS, 3840x2160, 17.30 | Average NVIDIA GeForce RTX 4090 Laptop GPU | Average of class Gaming | |
|---|---|---|---|---|---|---|---|---|
| Power Consumption | -13% | -46% | -32% | -6% | -10% | -16% | 7% | |
| Idle Minimum * | 15.4 | 14.5 6% | 21.6 -40% | 17.3 -12% | 14 9% | 18 -17% | 16.9 ? -10% | 13.9 ? 10% |
| Idle Average * | 21.6 | 21.1 2% | 25.2 -17% | 27 -25% | 21.6 -0% | 20 7% | 23.6 ? -9% | 19 ? 12% |
| Idle Maximum * | 22.2 | 42.8 -93% | 56.7 -155% | 46 -107% | 24.8 -12% | 25 -13% | 34.3 ? -55% | 25.9 ? -17% |
| Load Average * | 116.7 | 116.7 -0% | 164.1 -41% | 133 -14% | 122.5 -5% | 136 -17% | 127 ? -9% | 112 ? 4% |
| Witcher 3 ultra * | 262 | 278 -6% | 311 -19% | 265 -1% | 292 -11% | |||
| Load Maximum * | 327.1 | 279.6 15% | 338.9 -4% | 329 -1% | 418 -28% | 358 -9% | 325 ? 1% | 247 ? 24% |
* ... smaller is better
Power consumption Witcher 3 / stress test
Power consumption with external monitor
Runtimes
Matching its idle consumption, the 90 Wh battery allowed runtimes between 4 - 5 hours in the 60-Hz WLAN and video tests (depending on the brightness). This isn't very much and some rivals do offer more endurance. Although, compared to its predecessor, the laptop's endurance has at least improved a bit.
| Asus ROG Strix Scar 17 G733PYV-LL053X R9 7945HX3D, NVIDIA GeForce RTX 4090 Laptop GPU, 90 Wh | Asus ROG Strix Scar 17 G733PY-XS96 R9 7945HX, NVIDIA GeForce RTX 4090 Laptop GPU, 90 Wh | Alienware m18 R1 i9-13980HX, NVIDIA GeForce RTX 4090 Laptop GPU, 97 Wh | Asus ROG Strix Scar 18 2023 G834JY-N6005W i9-13980HX, NVIDIA GeForce RTX 4090 Laptop GPU, 90 Wh | MSI Titan GT77 HX 13VI i9-13950HX, NVIDIA GeForce RTX 4090 Laptop GPU, 99.9 Wh | SCHENKER Key 17 Pro (Early 23) i9-13900HX, NVIDIA GeForce RTX 4090 Laptop GPU, 99 Wh | Average of class Gaming | |
|---|---|---|---|---|---|---|---|
| Battery Runtime | -14% | -15% | 30% | 29% | 43% | 37% | |
| H.264 | 302 | 419 39% | 358 19% | 383 ? 27% | |||
| WiFi v1.3 | 287 | 248 -14% | 260 -9% | 428 49% | 319 11% | 411 43% | 360 ? 25% |
| Load | 55 | 44 -20% | 56 2% | 86 56% | 87 ? 58% | ||
| Witcher 3 ultra | 53 | 77.9 ? |
Pros
Cons
Verdict - The ROG Strix SCAR 17 X3D is now even faster
Thanks to the new AMD Ryzen 9 9745HX3D, the ROG Strix SCAR 17 X3D from Asus is now even faster, making it one of the fastest gaming laptops in existence. The new processor, thanks to its additional 3D V-Cache, is able to show two-figure percentage performance increases - in particular when gaming in 1080p. In higher QHD resolutions, its advantages are not as big and in 4K, there really isn't much difference compared to the regular Ryzen 9 7945HX.
As the new Ryzen 9 7945HX3D isn't compatible with liquid metal, its maximum multi-core CPU performance is actually a little worse than the regular Ryzen 9 7945HX as a direct result of its weaker cooling. At the end of the day, their performances are comparable in everyday use, and the chips continue to be much more efficient than Intel's HX processors.
Thanks to the AMD Ryzen 9 7945HX3D, the new ROG Strix SCAR 17 3DX is even faster when it comes to gaming in Full HD/QHD resolution. As a result, it is promoted to being the current fastest gaming laptop on the market.
Its well-known flaws remain on this model because although its performance is good, the laptop's design with its 16:9 panel does feel a little outdated at this point. Furthermore, we would like to have seen a more reserved version of ProArt which you could also use inconspicuously as a workstation. Its normally practical silent mode can barely be used while gaming, as you consistently hear an annoying coil whining noise and we would definitely recommend using headphones for any other energy profile. Its coil whine and loud cooling unit are also in the way of this laptop getting a better rating.
Price and availability
The new Asus ROG Strix SCAR 17 X3D is available from August 22. As soon as we have official pricing information, we will update this article.
Asus ROG Strix Scar 17 G733PYV-LL053X
-
08/22/2023 v7
Andreas Osthoff
Transparency
The present review sample was made available to the author as a loan by the manufacturer or a shop for the purposes of review. The lender had no influence on this review, nor did the manufacturer receive a copy of this review before publication. There was no obligation to publish this review.
Pricecompare

