 Deutsch
 English
 Español
 Français
 Italiano
 Nederlands
 Polski
 Português
 Русский
 Türkçe
 Svenska
 Chinese
 Magyar
Barely any better than the previous year: 2023 Dell XPS 13 Plus 9320 Core i7-1360P review

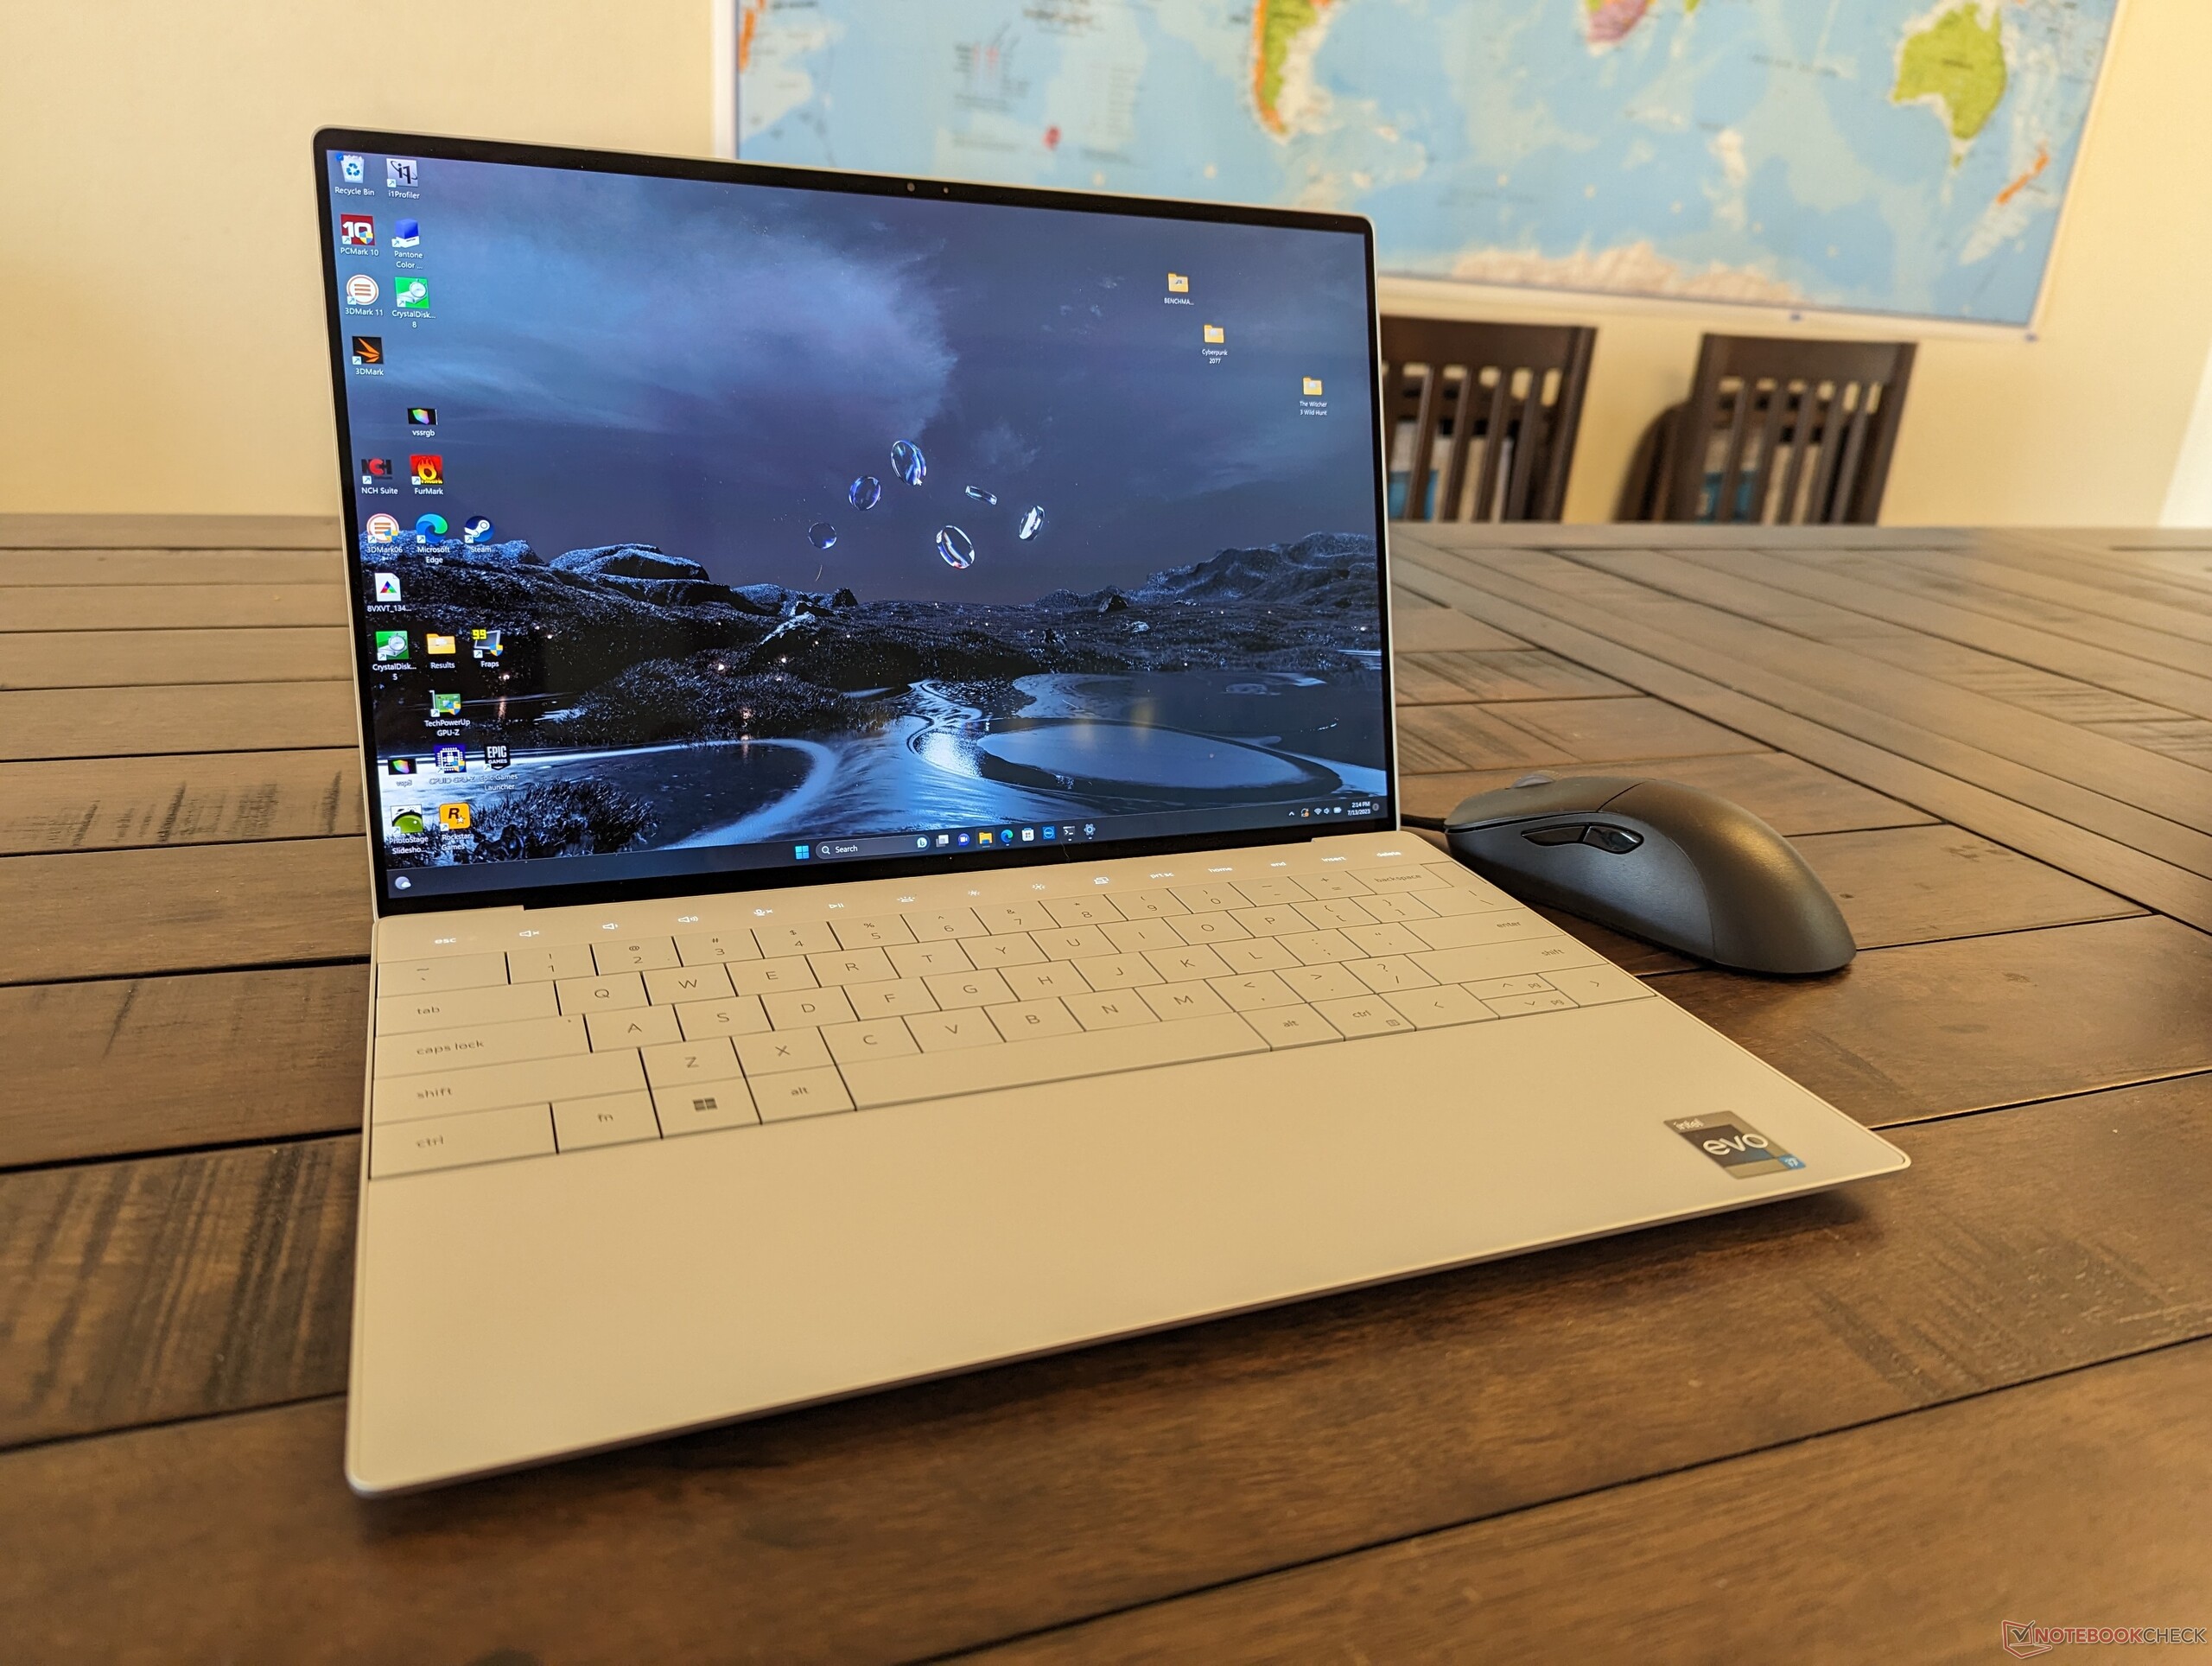
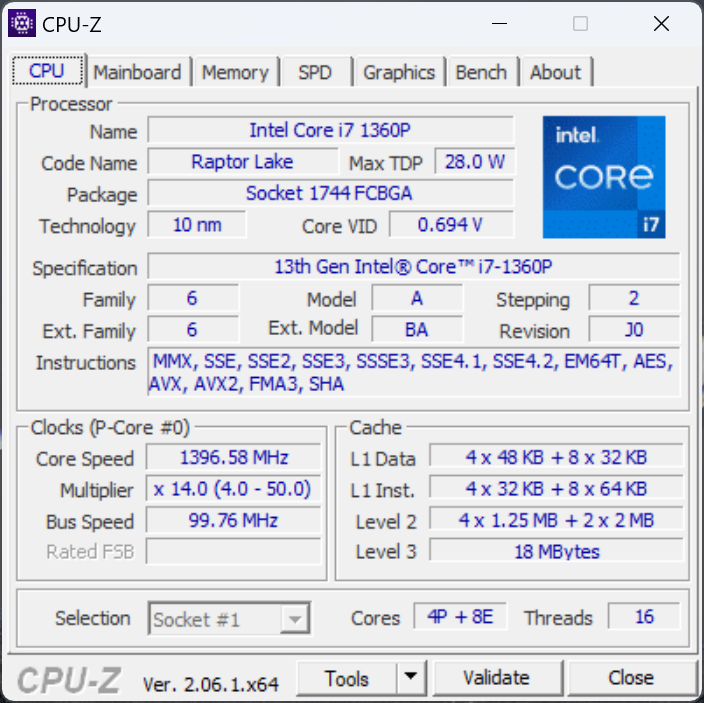
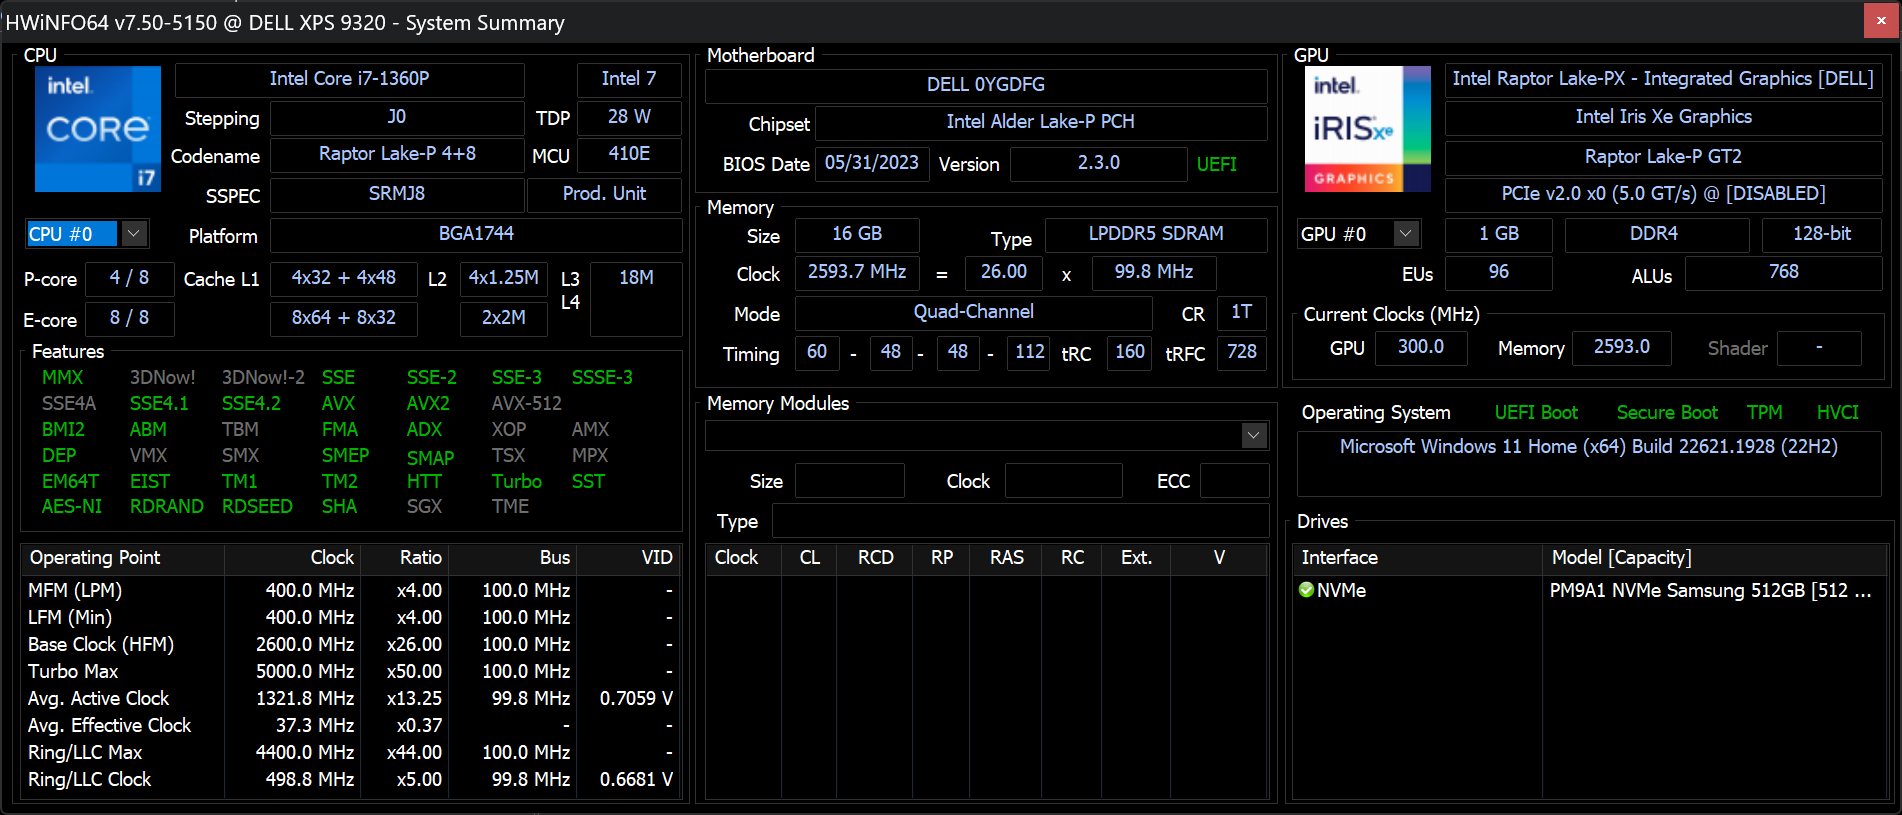
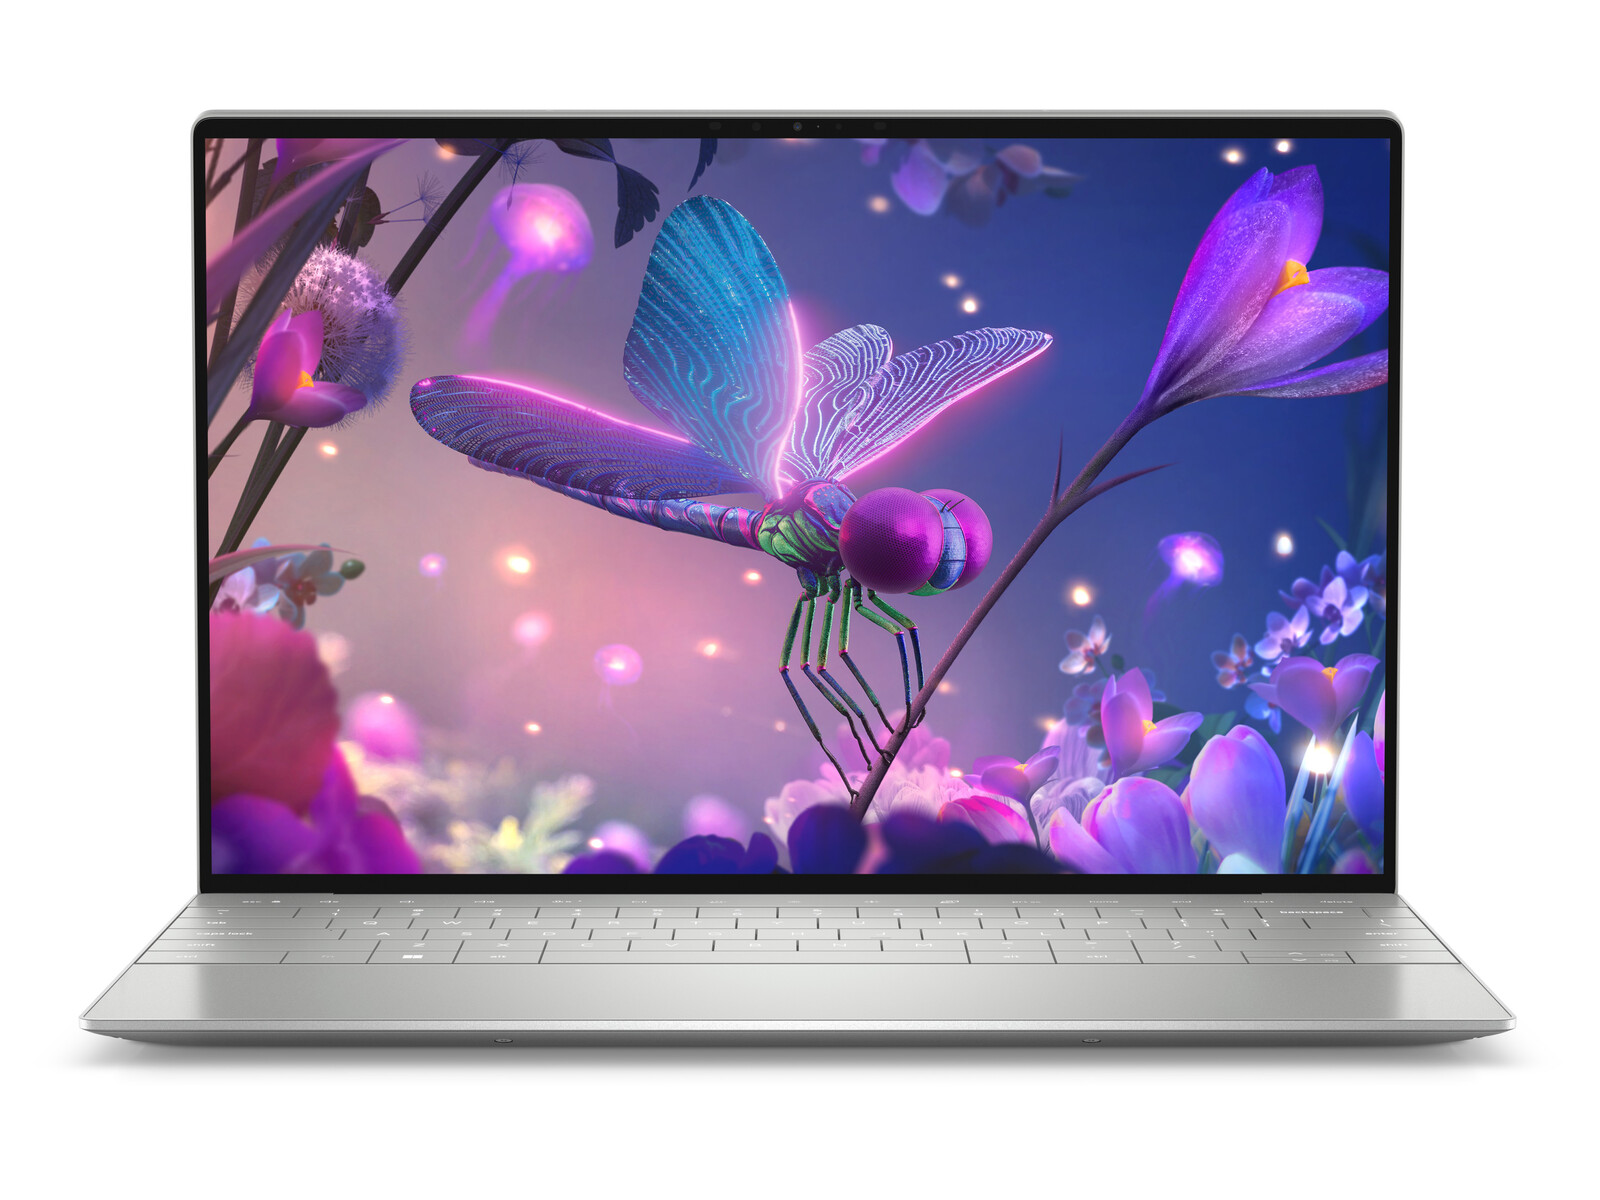
The 2023 XPS 13 Plus 9320 is this year's refresh to the original 2022 model. It utilizes the same chassis design but with newer 13th gen Raptor Lake CPU options to replace the older 12th gen Alder Lake options. There are otherwise no exterior changes and so we recommend checking out our review on the 2022 model to learn more about the physical features of the XPS 13 Plus.
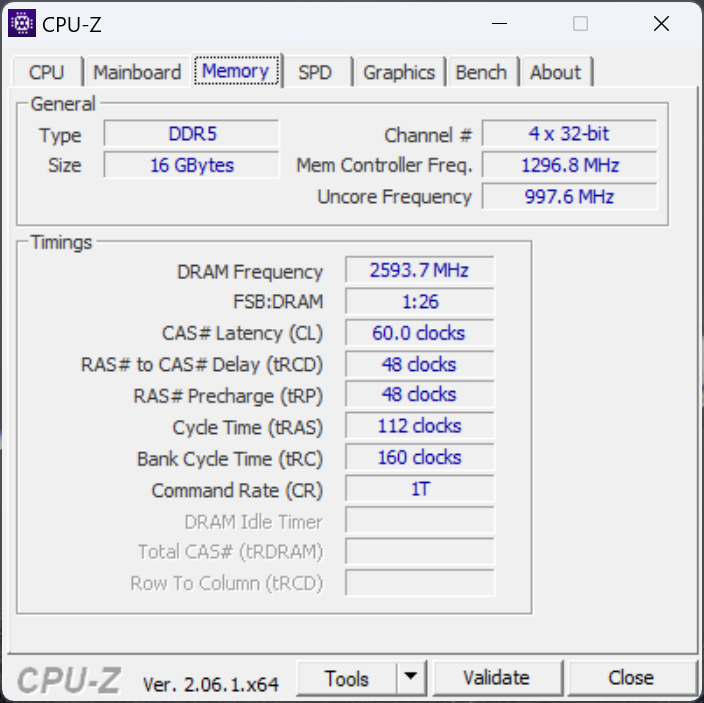
Our configuration is a midrange SKU with the 13.4-inch 3.5K (3456 x 2160) OLED touchscreen and 16 GB of fast LPDDR5 6000 MHz RAM for about $1300 USD. Other SKUs may come with 1200p or 2400p panels instead, but all are currently shipping with the same Core i7-1360P processor.
Alternatives to the XPS 13 Plus include other flagship 13-inch subnotebooks like the Framework Laptop 13.5, HP Spectre x360 13.5, or the Lenovo ThinkPad X13 G3.
More Dell reviews:
Potential Competitors in Comparison
Rating | Date | Model | Weight | Height | Size | Resolution | Best Price |
|---|---|---|---|---|---|---|---|
| 87.4 % | 07/2023 | Dell XPS 13 Plus 9320 Core i7-1360P i7-1360P, Iris Xe G7 96EUs | 1.3 kg | 15.3 mm | 13.40" | 3456x2160 | |
| 87.3 % | 09/2022 | Dell XPS 13 Plus 9320 i7-1280P OLED i7-1280P, Iris Xe G7 96EUs | 1.3 kg | 15.28 mm | 13.40" | 3456x2160 | |
| 85.9 % | 11/2019 | Dell XPS 13 7390 Core i7-10710U i7-10710U, UHD Graphics 620 | 1.2 kg | 11.6 mm | 13.30" | 3840x2160 | |
| 86.2 % | 05/2023 | Framework Laptop 13.5 13th Gen Intel i7-1370P, Iris Xe G7 96EUs | 1.3 kg | 15.85 mm | 13.50" | 2256x1504 | |
| 89.1 % | 06/2023 | Lenovo ThinkPad X13 Yoga G3 21AW003UGE i7-1265U, Iris Xe G7 96EUs | 1.2 kg | 15.9 mm | 13.30" | 2560x1600 | |
| 90.3 % | 08/2022 | HP Spectre x360 13.5 14t-ef000 i7-1255U, Iris Xe G7 96EUs | 1.4 kg | 17 mm | 13.50" | 3000x2000 |
Case
Communication
| Networking | |
| iperf3 transmit AX12 | |
| Dell XPS 13 7390 Core i7-10710U | |
| iperf3 receive AX12 | |
| Dell XPS 13 7390 Core i7-10710U | |
| iperf3 transmit AXE11000 | |
| Dell XPS 13 Plus 9320 Core i7-1360P | |
| Framework Laptop 13.5 13th Gen Intel | |
| Lenovo ThinkPad X13 Yoga G3 21AW003UGE | |
| iperf3 receive AXE11000 | |
| Lenovo ThinkPad X13 Yoga G3 21AW003UGE | |
| Dell XPS 13 Plus 9320 Core i7-1360P | |
| Framework Laptop 13.5 13th Gen Intel | |
| iperf3 transmit AXE11000 6GHz | |
| HP Spectre x360 13.5 14t-ef000 | |
| Framework Laptop 13.5 13th Gen Intel | |
| Dell XPS 13 Plus 9320 Core i7-1360P | |
| iperf3 receive AXE11000 6GHz | |
| Framework Laptop 13.5 13th Gen Intel | |
| Dell XPS 13 Plus 9320 Core i7-1360P | |
| HP Spectre x360 13.5 14t-ef000 | |
Webcam
There are no changes to the 1 MP webcam whereas some competing models like the HP Spectre have already moved on to higher quality 5 MP sensors.


Maintenance

Display

Four display options are available as follows:
- 1920 x 1200, 60 Hz, IPS, non-touch, matte, 500 nits
- 1920 x 1200, 60 Hz, IPS, touch, matte, 500 nits
- 3456 x 2160, 60 Hz, OLED, touch, glossy, 400 nits
- 3840 x 2400, 60 Hz, IPS, touch, glossy, 500 nits
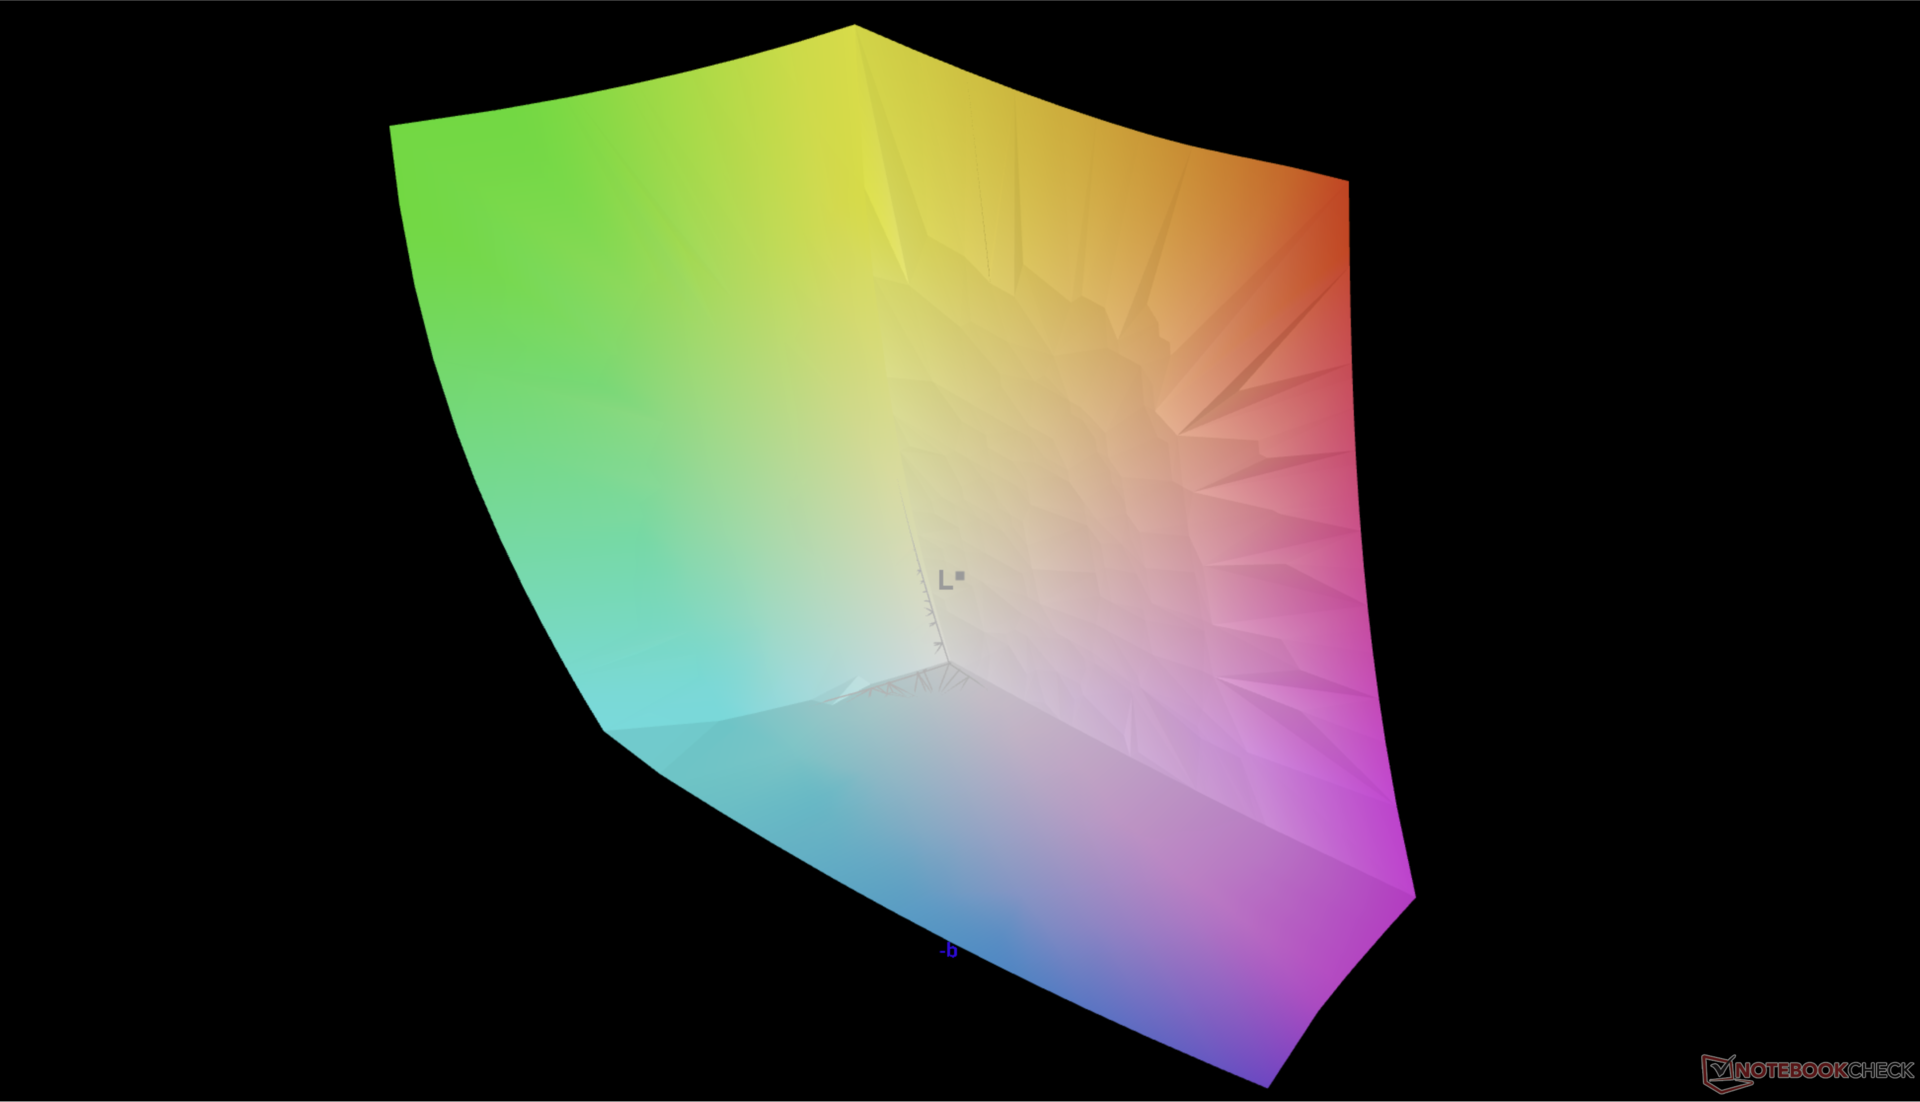
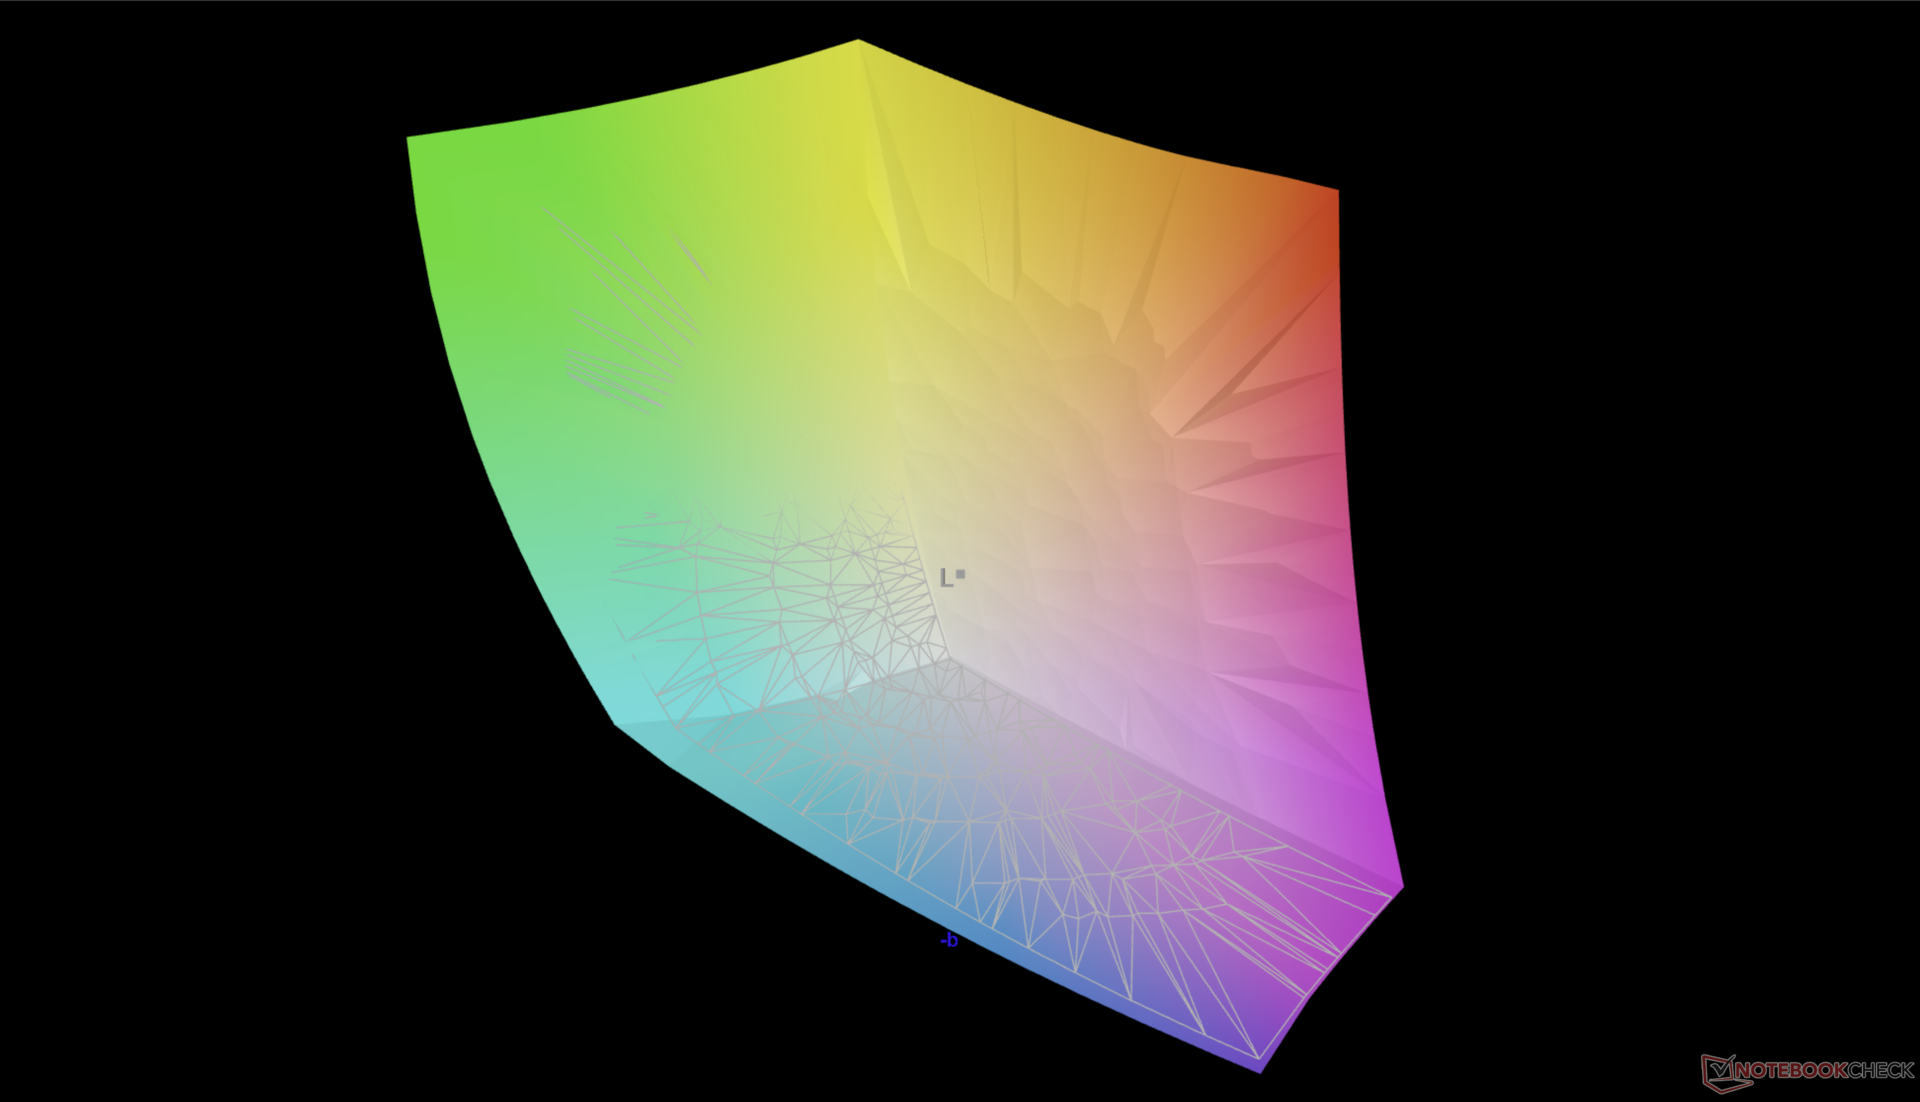
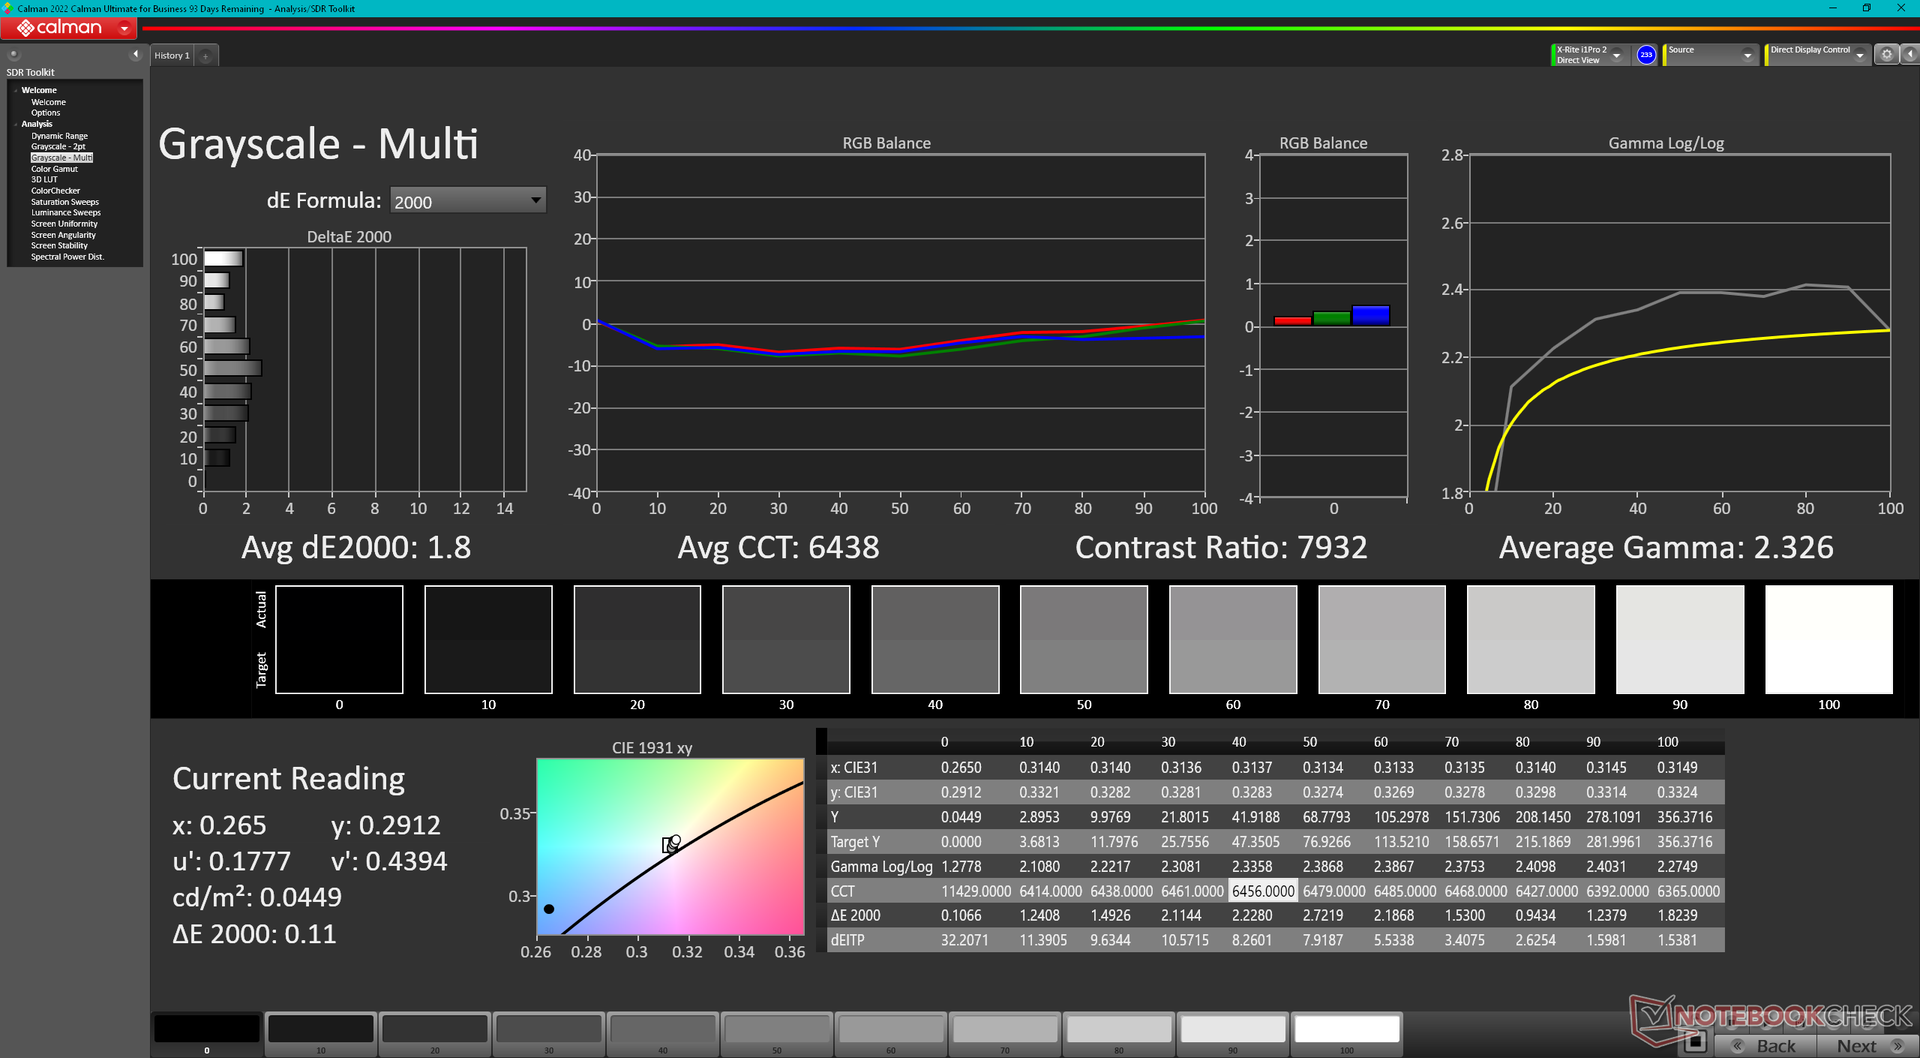
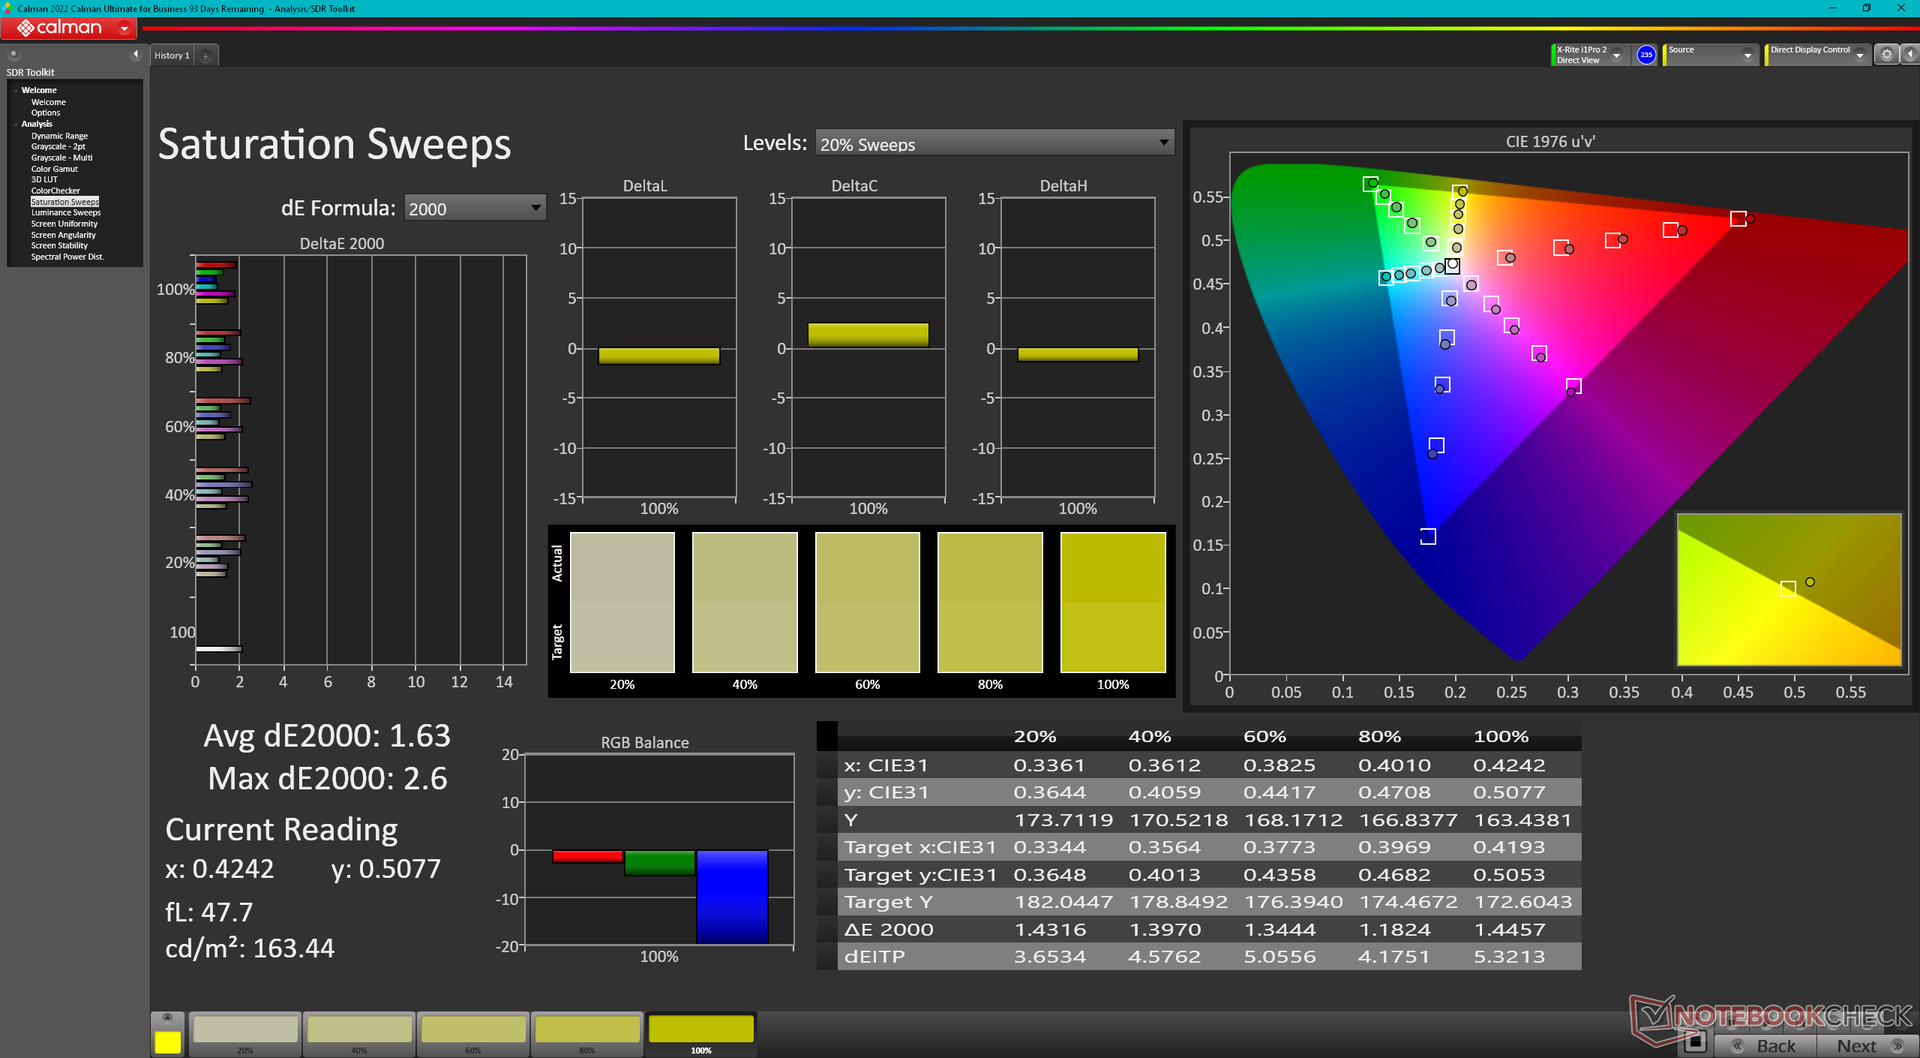
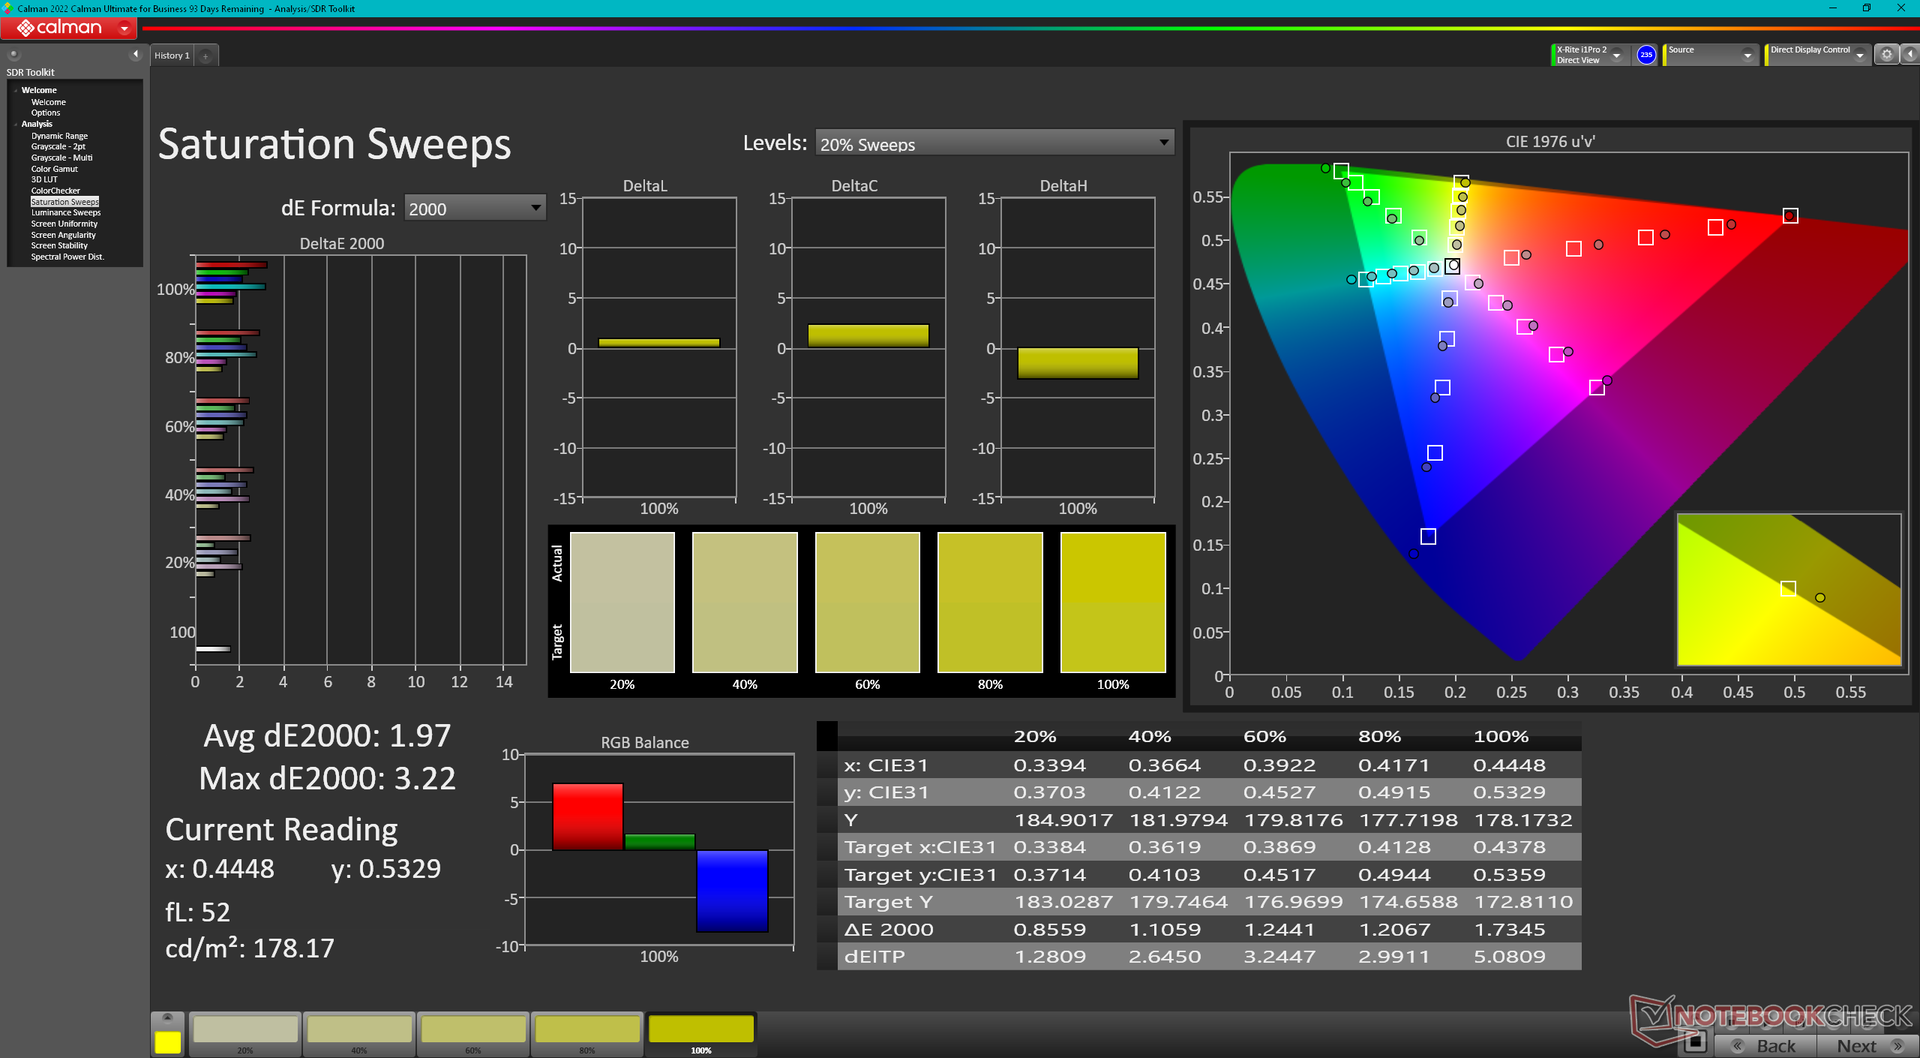
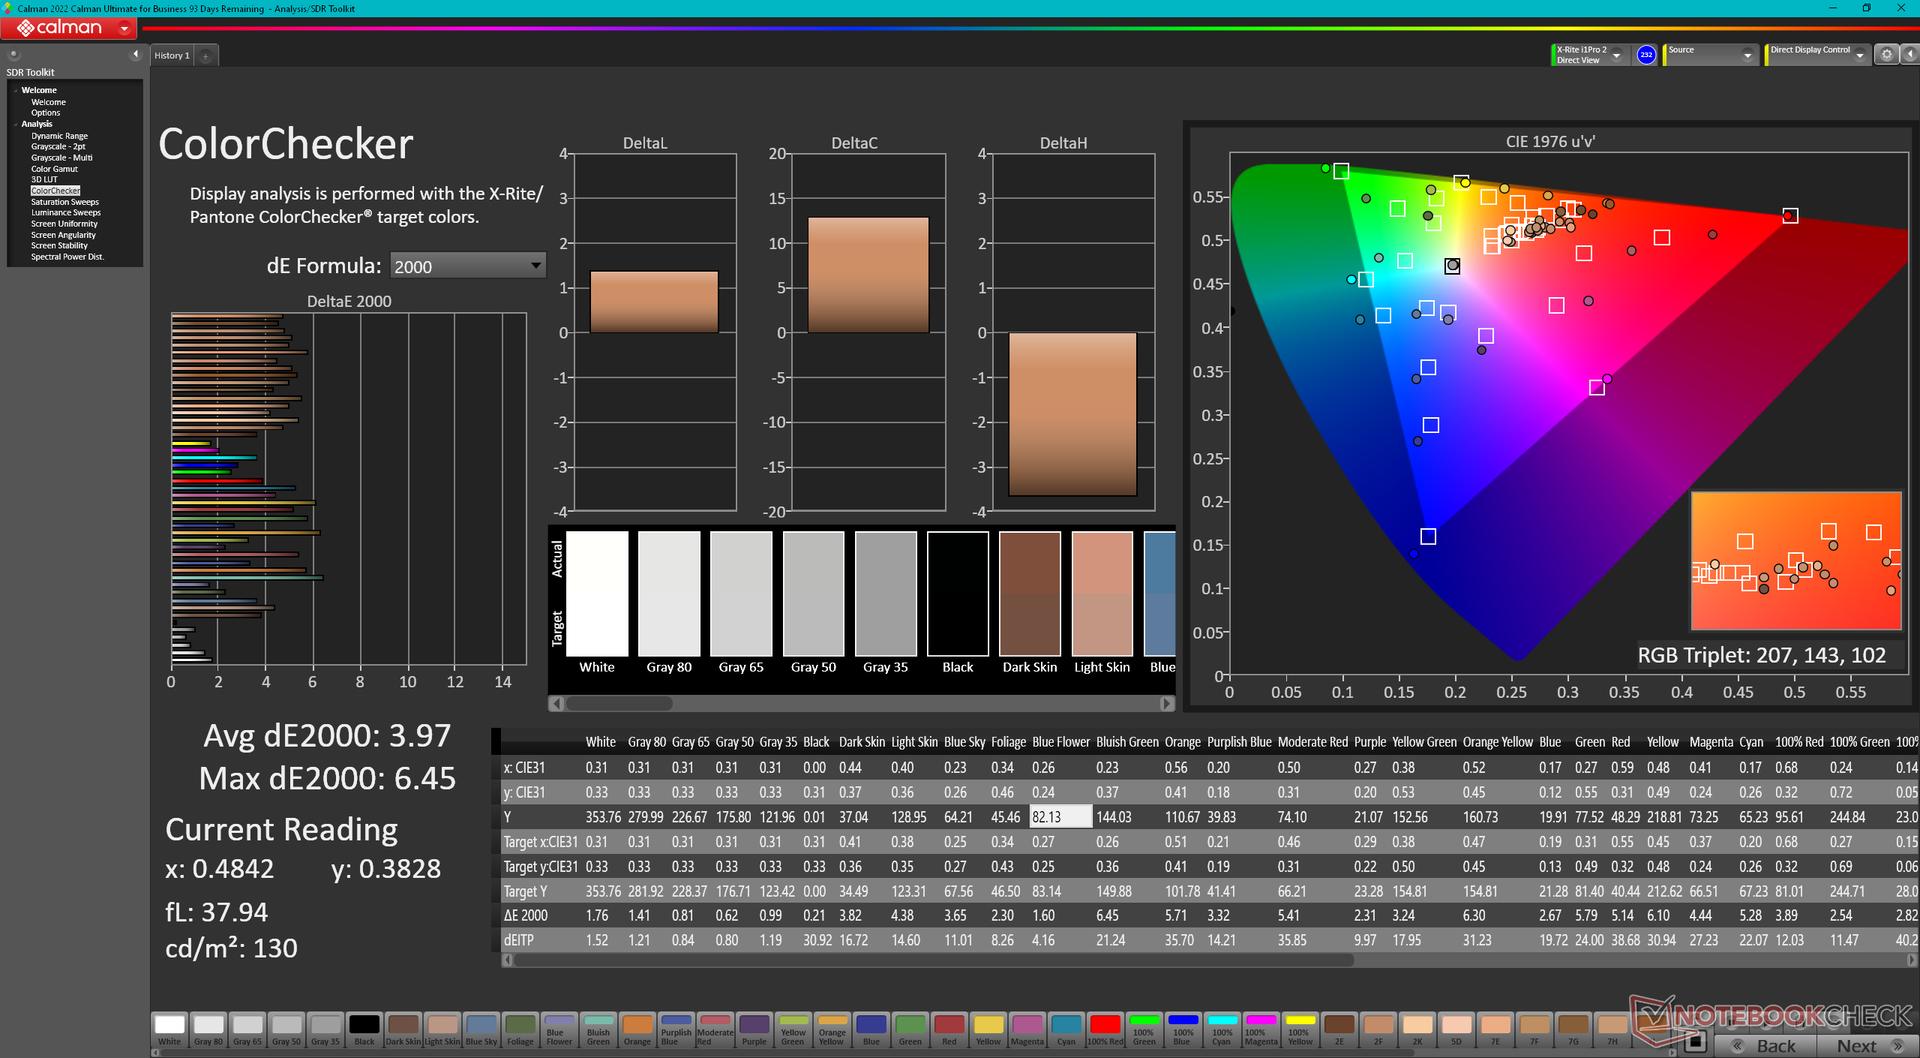
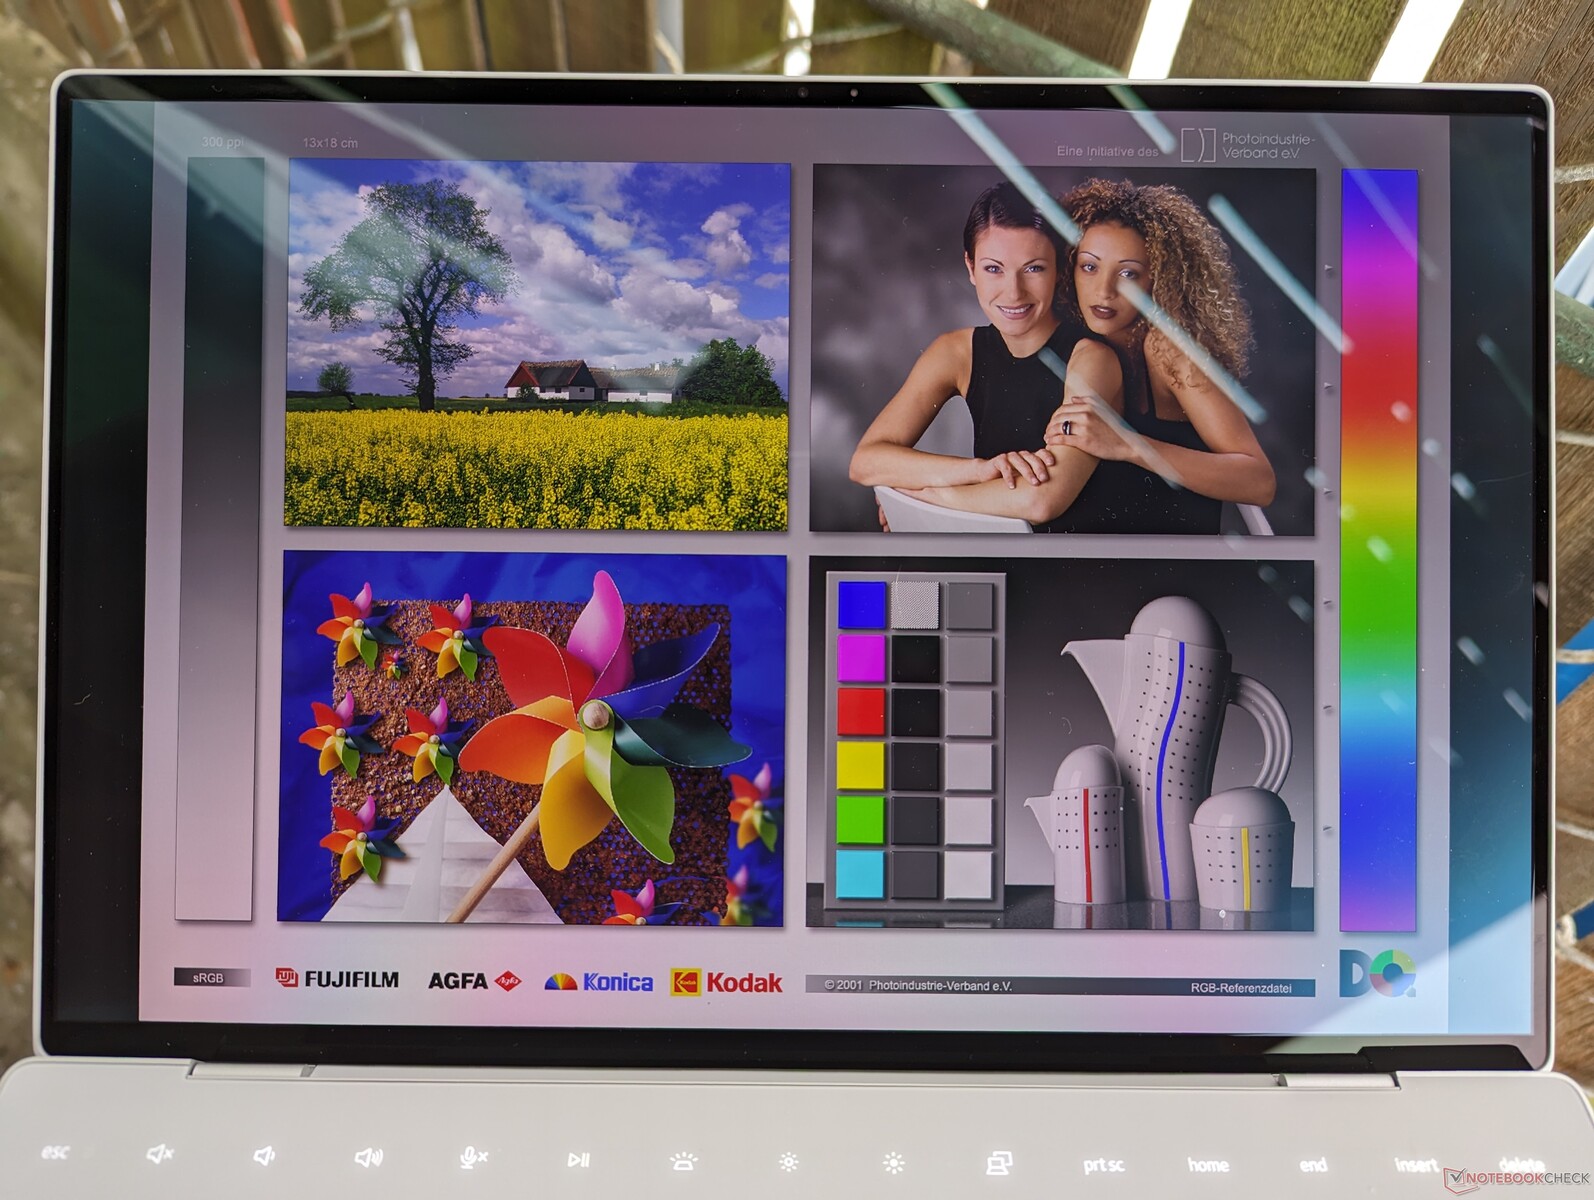
Our OLED configuration utilizes the same Samsung 134XK04 panel as found on last year's OLED SKU and so the viewing experience remains identical. Owners are getting 99 percent sRGB coverage at a minimum no matter the option selected based on our experiences with all three resolution options.

| |||||||||||||||||||||||||
Brightness Distribution: 96 %
Center on Battery: 361.7 cd/m²
Contrast: ∞:1 (Black: 0 cd/m²)
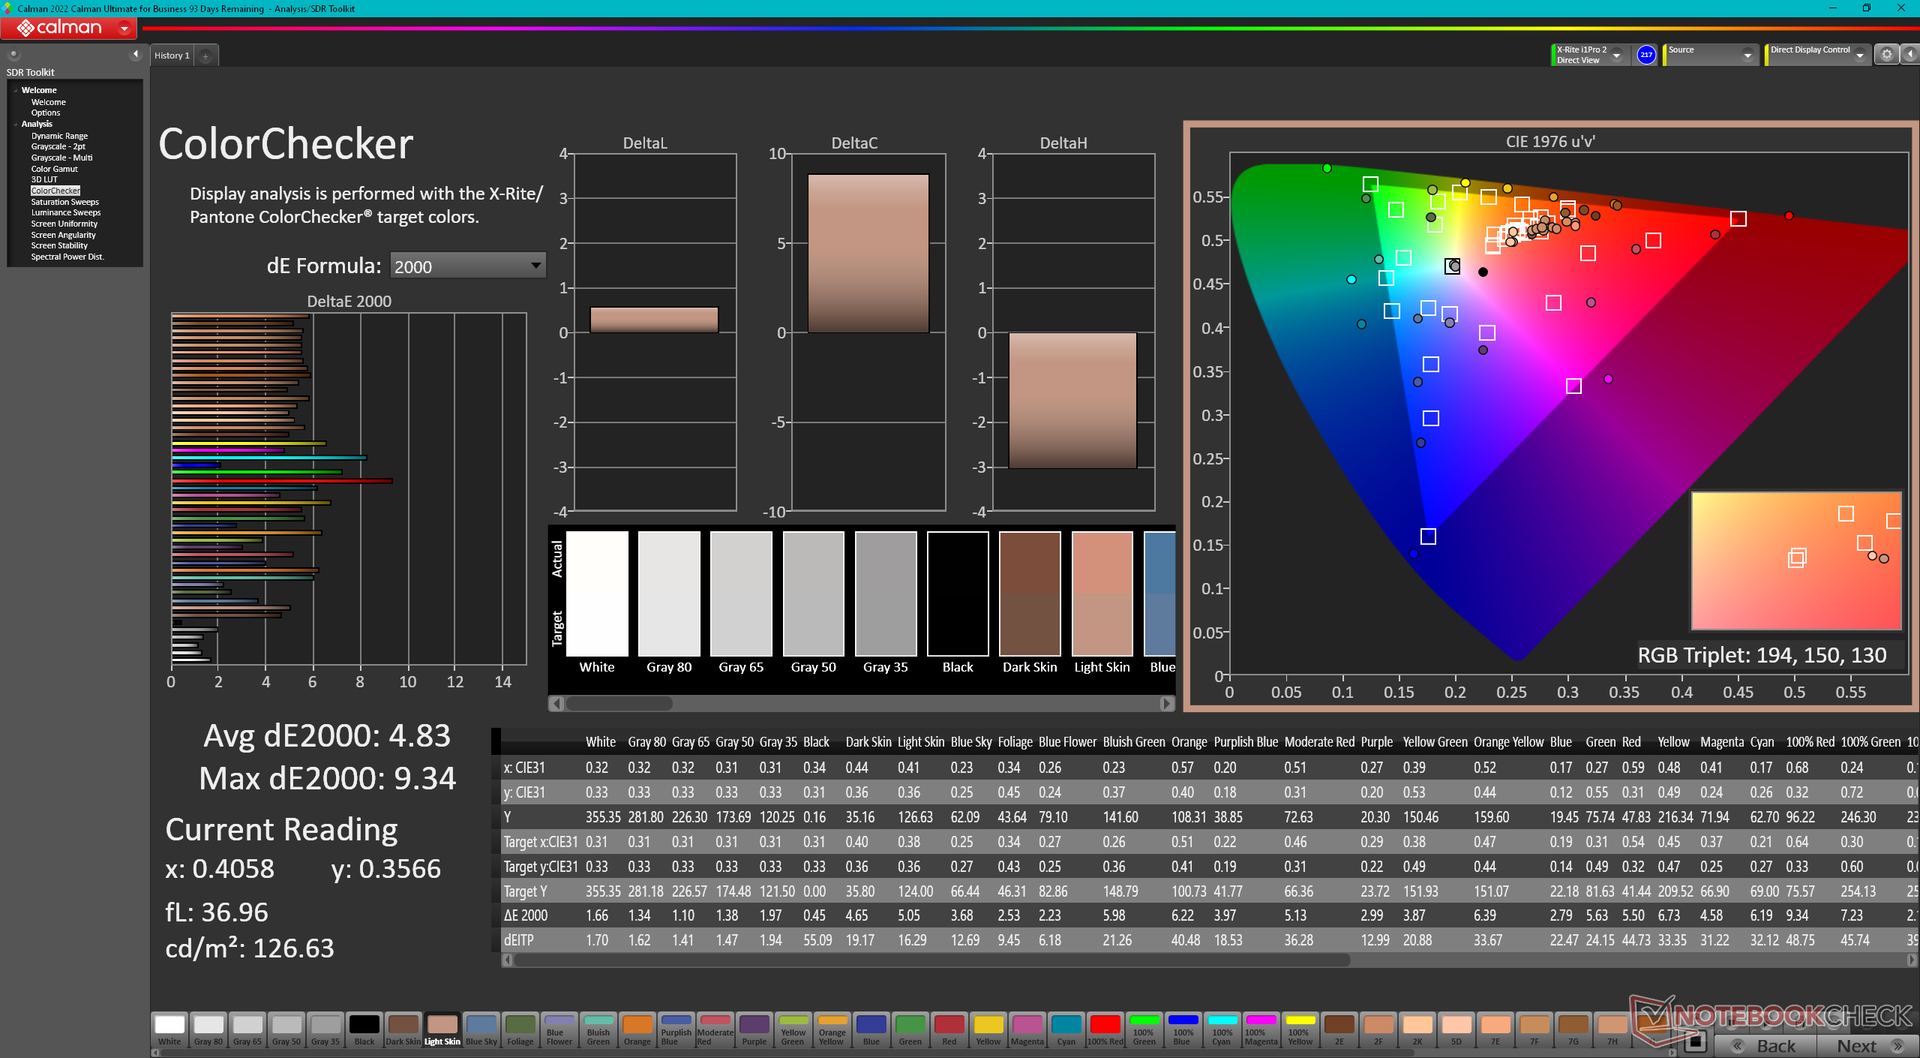
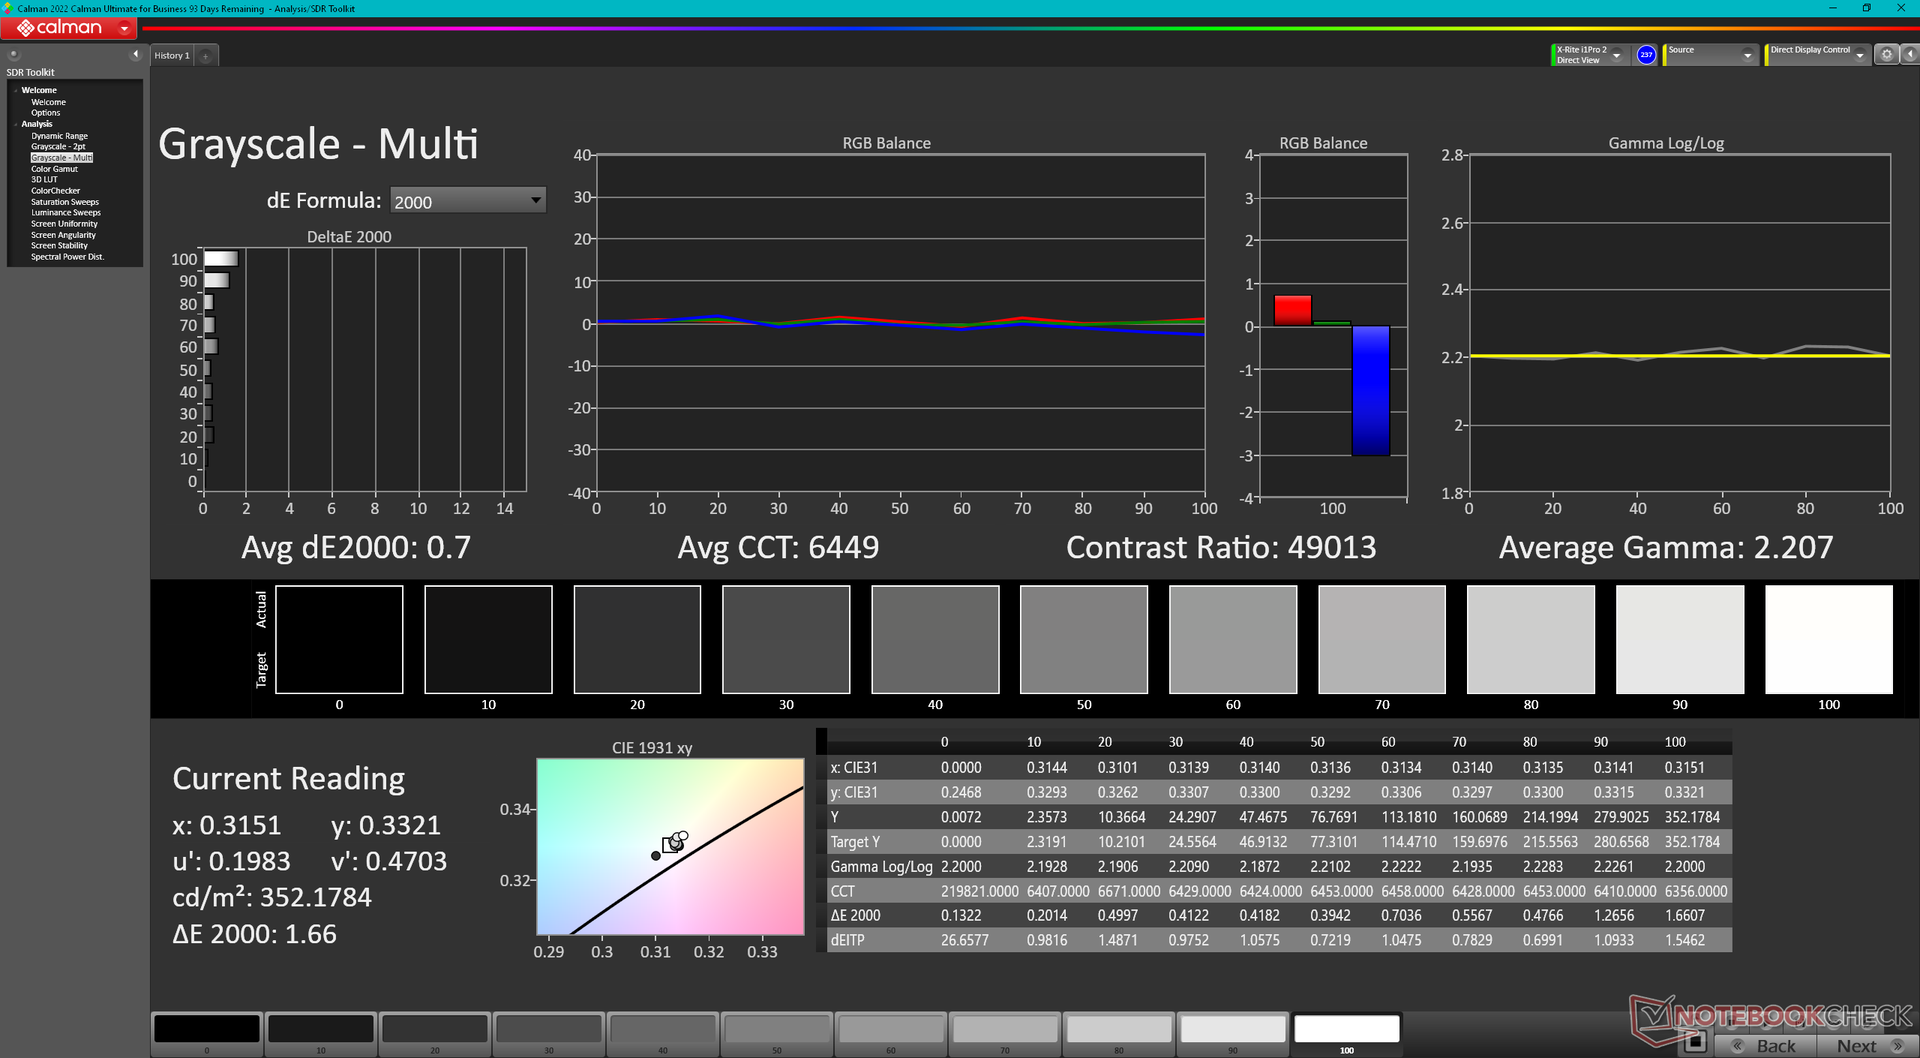
ΔE Color 4.83 | 0.5-29.43 Ø5.1, calibrated: 3.97
ΔE Greyscale 1.8 | 0.57-98 Ø5.3
96.8% AdobeRGB 1998 (Argyll 2.2.0 3D)
100% sRGB (Argyll 2.2.0 3D)
99.7% Display P3 (Argyll 2.2.0 3D)
Gamma: 2.33
| Dell XPS 13 Plus 9320 Core i7-1360P Samsung 134XK04, OLED, 3456x2160, 13.40 | Dell XPS 13 Plus 9320 i7-1280P OLED Samsung 134XK04, OLED, 3456x2160, 13.40 | Dell XPS 13 7390 Core i7-10710U AU Optronics B133ZAN, Dell P/N: 90NTH, IPS, 3840x2160, 13.30 | Framework Laptop 13.5 13th Gen Intel BOE CQ NE135FBM-N41, IPS, 2256x1504, 13.50 | Lenovo ThinkPad X13 Yoga G3 21AW003UGE LP133WQ1-SPF2, IPS LED, 2560x1600, 13.30 | HP Spectre x360 13.5 14t-ef000 SDC4160, OLED, 3000x2000, 13.50 | |
|---|---|---|---|---|---|---|
| Display | 1% | -25% | -20% | -20% | -2% | |
| Display P3 Coverage | 99.7 | 99.5 0% | 63.4 -36% | 68.9 -31% | 68 -32% | 99.9 0% |
| sRGB Coverage | 100 | 100 0% | 93.7 -6% | 97.5 -2% | 98.6 -1% | 100 0% |
| AdobeRGB 1998 Coverage | 96.8 | 98.4 2% | 64.3 -34% | 71.1 -27% | 69.5 -28% | 90.8 -6% |
| Response Times | -32% | -1891% | -1965% | -1617% | -22% | |
| Response Time Grey 50% / Grey 80% * | 2.18 ? | 2.6 ? -19% | 51.6 ? -2267% | 54.9 ? -2418% | 45.9 ? -2006% | 1.9 ? 13% |
| Response Time Black / White * | 2.08 ? | 2.1 ? -1% | 33.6 ? -1515% | 33.5 ? -1511% | 27.6 ? -1227% | 2.16 ? -4% |
| PWM Frequency | 238.6 ? | 59.5 -75% | 60.2 ? -75% | |||
| Screen | 14% | -39% | 2% | 23% | 9% | |
| Brightness middle | 361.7 | 371.8 3% | 408.2 13% | 503 39% | 438 21% | 351.7 -3% |
| Brightness | 367 | 374 2% | 399 9% | 472 29% | 399 9% | 351 -4% |
| Brightness Distribution | 96 | 98 2% | 89 -7% | 87 -9% | 84 -12% | 87 -9% |
| Black Level * | 0.39 | 0.36 | 0.29 | |||
| Colorchecker dE 2000 * | 4.83 | 2.37 51% | 4.6 5% | 3.38 30% | 1.8 63% | 1.78 63% |
| Colorchecker dE 2000 max. * | 9.34 | 6.1 35% | 11.84 -27% | 7.08 24% | 4 57% | 6.14 34% |
| Colorchecker dE 2000 calibrated * | 3.97 | 2.03 49% | 1.21 70% | 0.8 80% | ||
| Greyscale dE 2000 * | 1.8 | 2 -11% | 7.5 -317% | 4.8 -167% | 2.8 -56% | 2.3 -28% |
| Gamma | 2.33 94% | 2.29 96% | 2.12 104% | 2.13 103% | 2.24 98% | 2.11 104% |
| CCT | 6438 101% | 6261 104% | 7966 82% | 6235 104% | 6785 96% | 6683 97% |
| Contrast | 1047 | 1397 | 1510 | |||
| Color Space (Percent of AdobeRGB 1998) | 59.5 | |||||
| Color Space (Percent of sRGB) | 93.5 | |||||
| Total Average (Program / Settings) | -6% /
-1% | -652% /
-344% | -661% /
-331% | -538% /
-261% | -5% /
-2% |
* ... smaller is better
Display Response Times
| ↔ Response Time Black to White | ||
|---|---|---|
| 2.08 ms ... rise ↗ and fall ↘ combined | ↗ 0.98 ms rise | 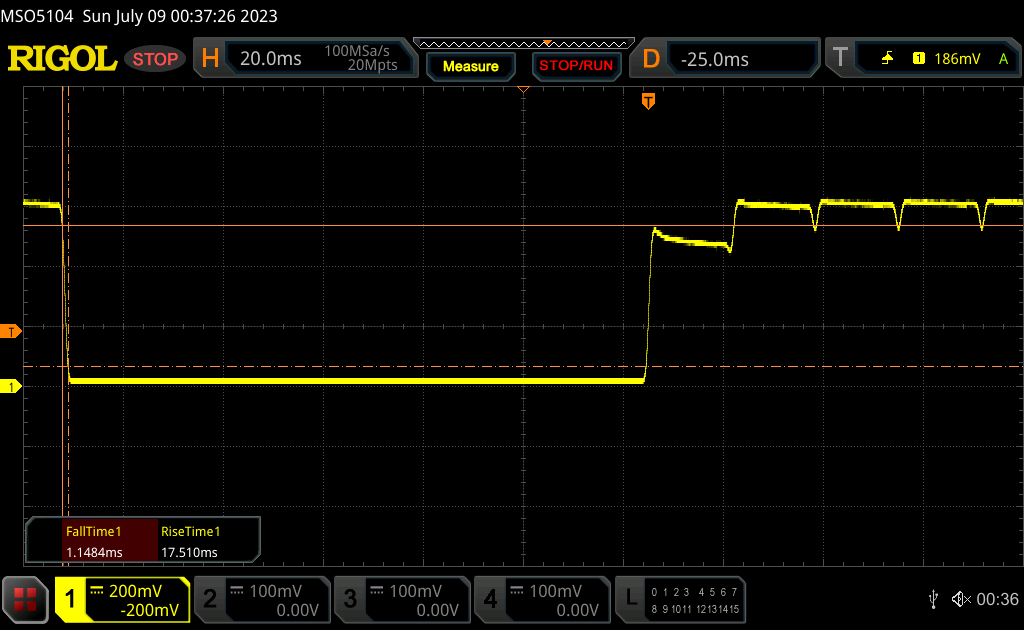 |
| ↘ 1.1 ms fall | ||
| The screen shows very fast response rates in our tests and should be very well suited for fast-paced gaming. In comparison, all tested devices range from 0.1 (minimum) to 240 (maximum) ms. » 5 % of all devices are better. This means that the measured response time is better than the average of all tested devices (21.8 ms). | ||
| ↔ Response Time 50% Grey to 80% Grey | ||
| 2.18 ms ... rise ↗ and fall ↘ combined | ↗ 1.2 ms rise | 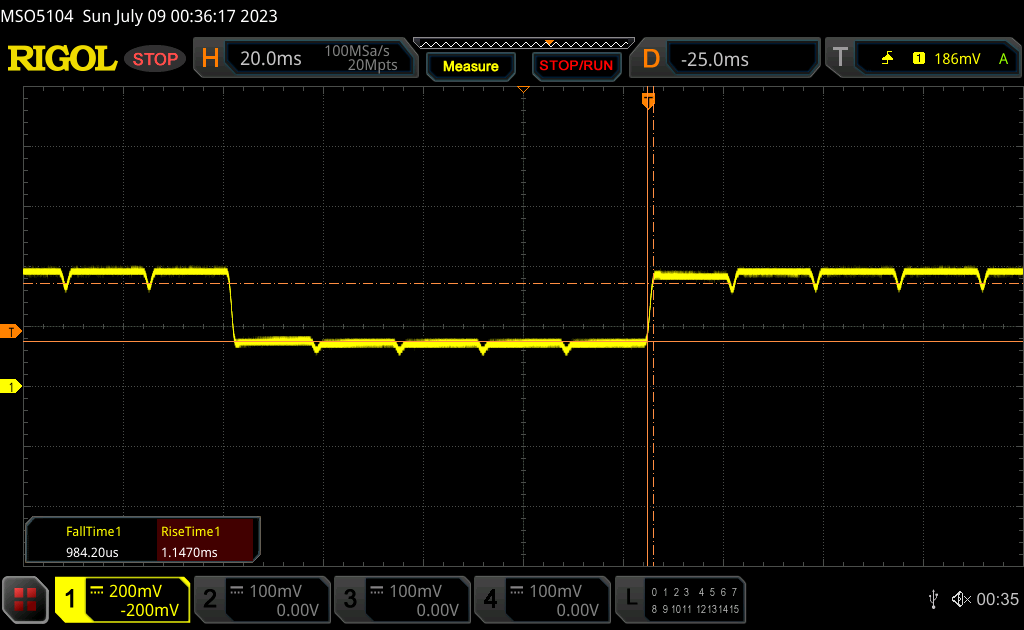 |
| ↘ 0.98 ms fall | ||
| The screen shows very fast response rates in our tests and should be very well suited for fast-paced gaming. In comparison, all tested devices range from 0.2 (minimum) to 636 (maximum) ms. » 5 % of all devices are better. This means that the measured response time is better than the average of all tested devices (34.3 ms). | ||
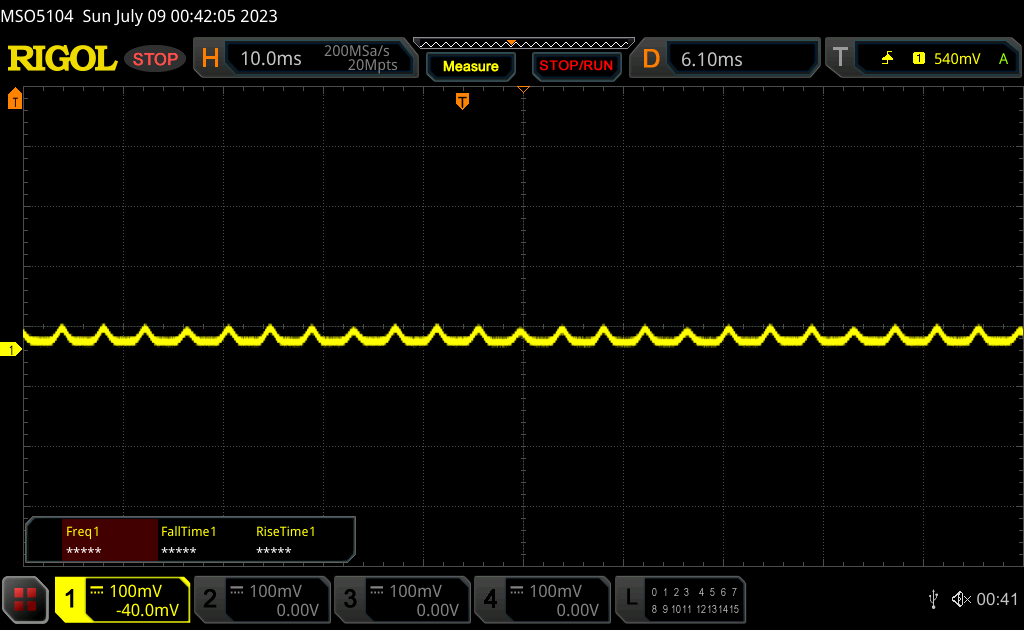
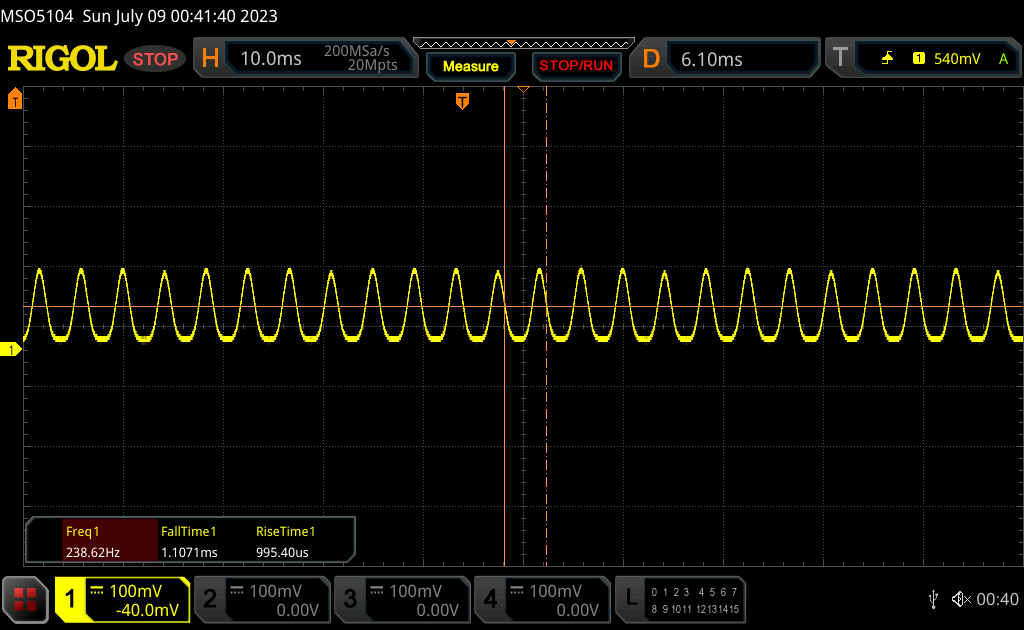
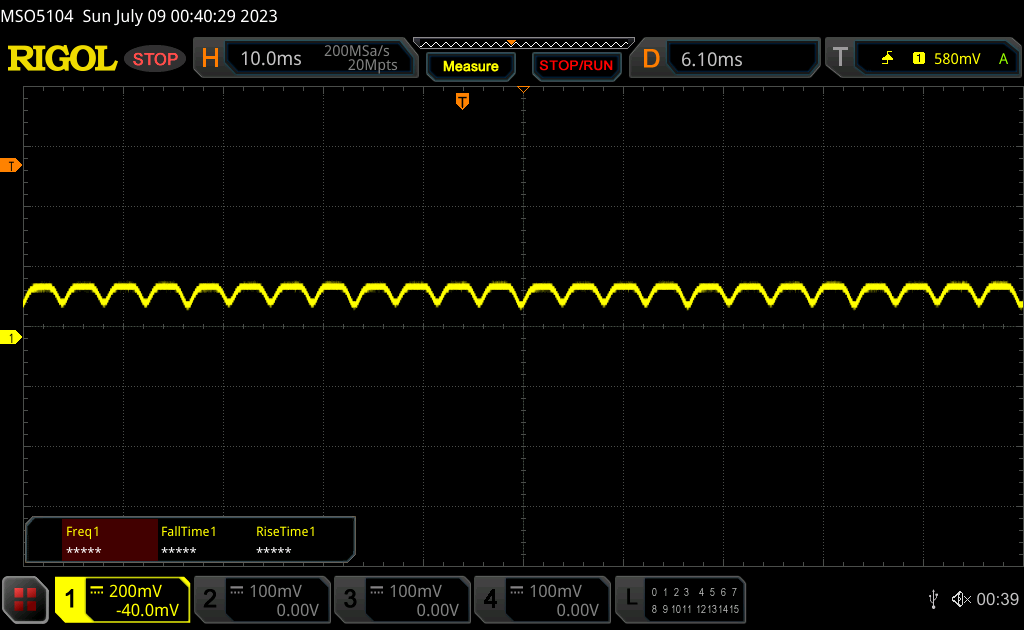
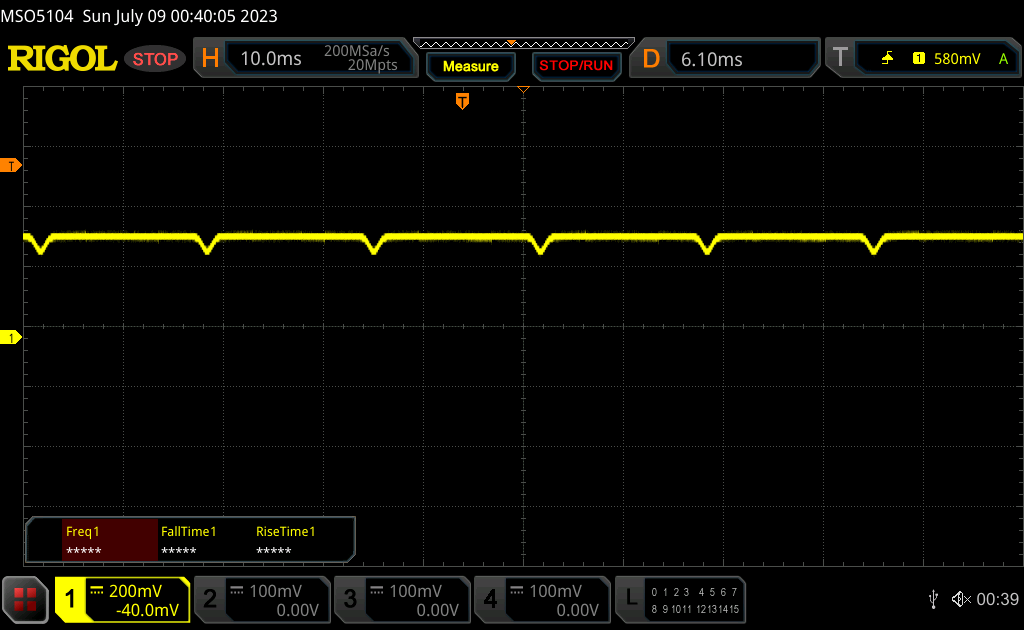
Screen Flickering / PWM (Pulse-Width Modulation)
| Screen flickering / PWM detected | 238.6 Hz | ≤ 100 % brightness setting | 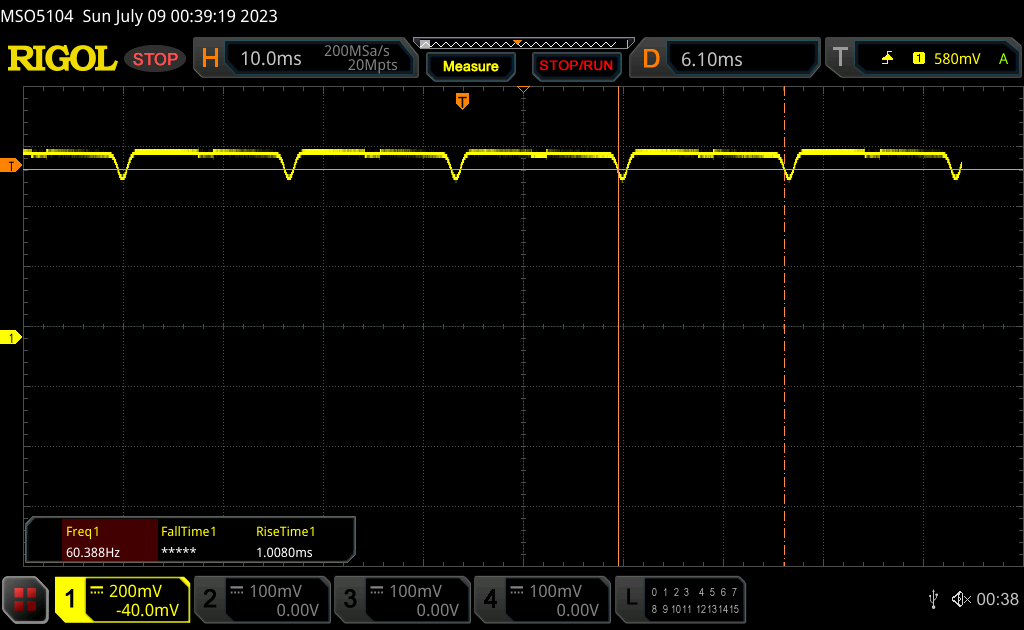 |
The display backlight flickers at 238.6 Hz (Likely utilizing PWM) Flickering detected at a brightness setting of 100 % and below. There should be no flickering or PWM above this brightness setting. The frequency of 238.6 Hz is relatively low, so sensitive users will likely notice flickering and experience eyestrain at the stated brightness setting and below. In comparison: 53 % of all tested devices do not use PWM to dim the display. If PWM was detected, an average of 18732 (minimum: 5 - maximum: 3846000) Hz was measured. | |||
Pulse-width modulation or flickering is still present on most brightness levels. We're able to detect a frequency of 238.6 Hz from 0 percent to 52 percent brightness and 60 Hz from 53 percent brightness to maximum. The alternative IPS options are not expected to have any flickering or PWM.


Performance
Testing Conditions
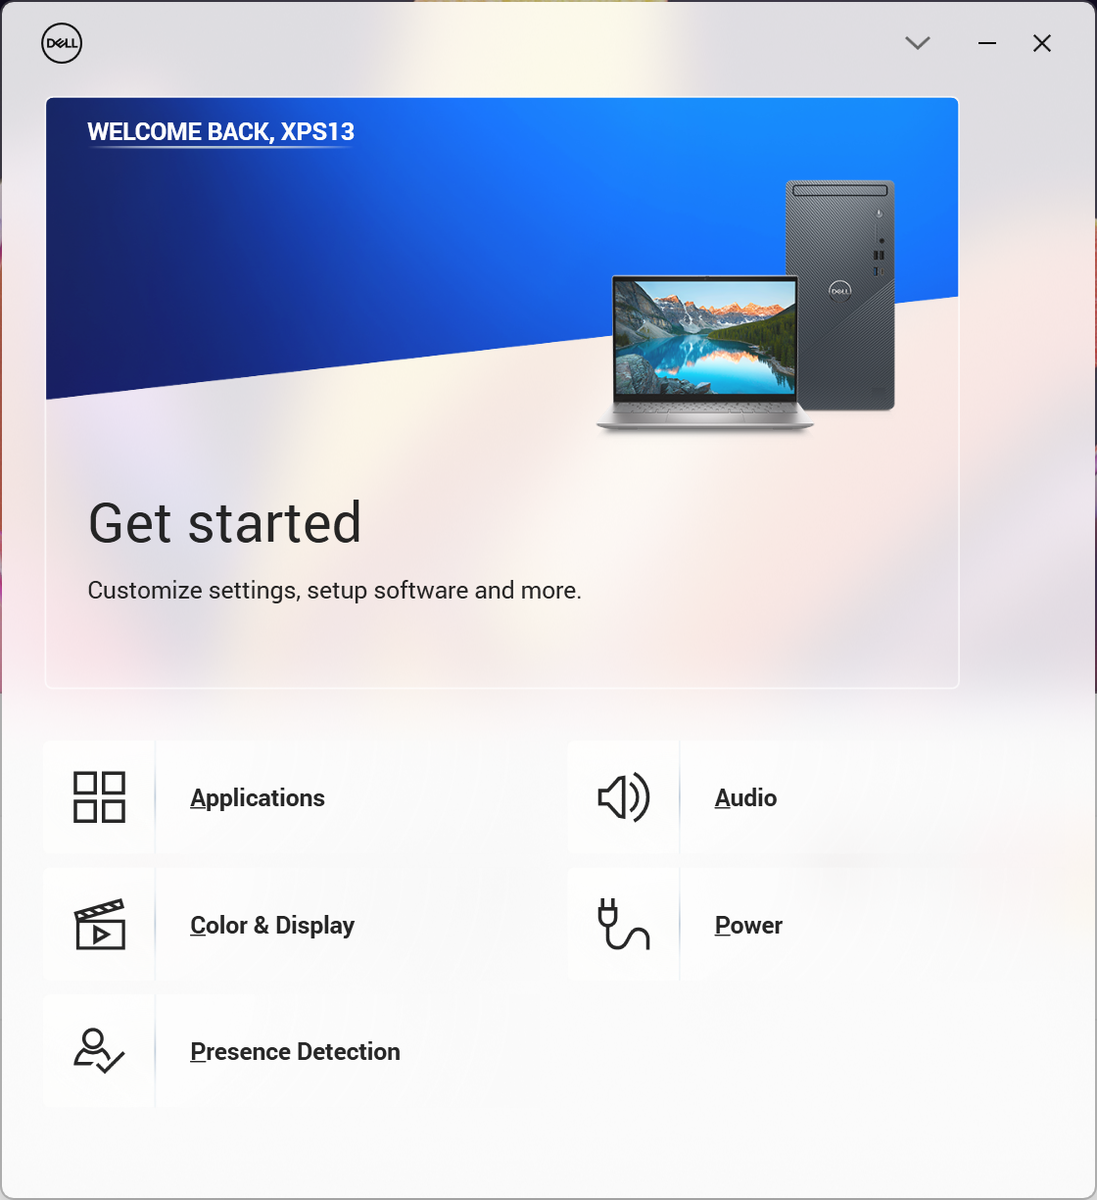
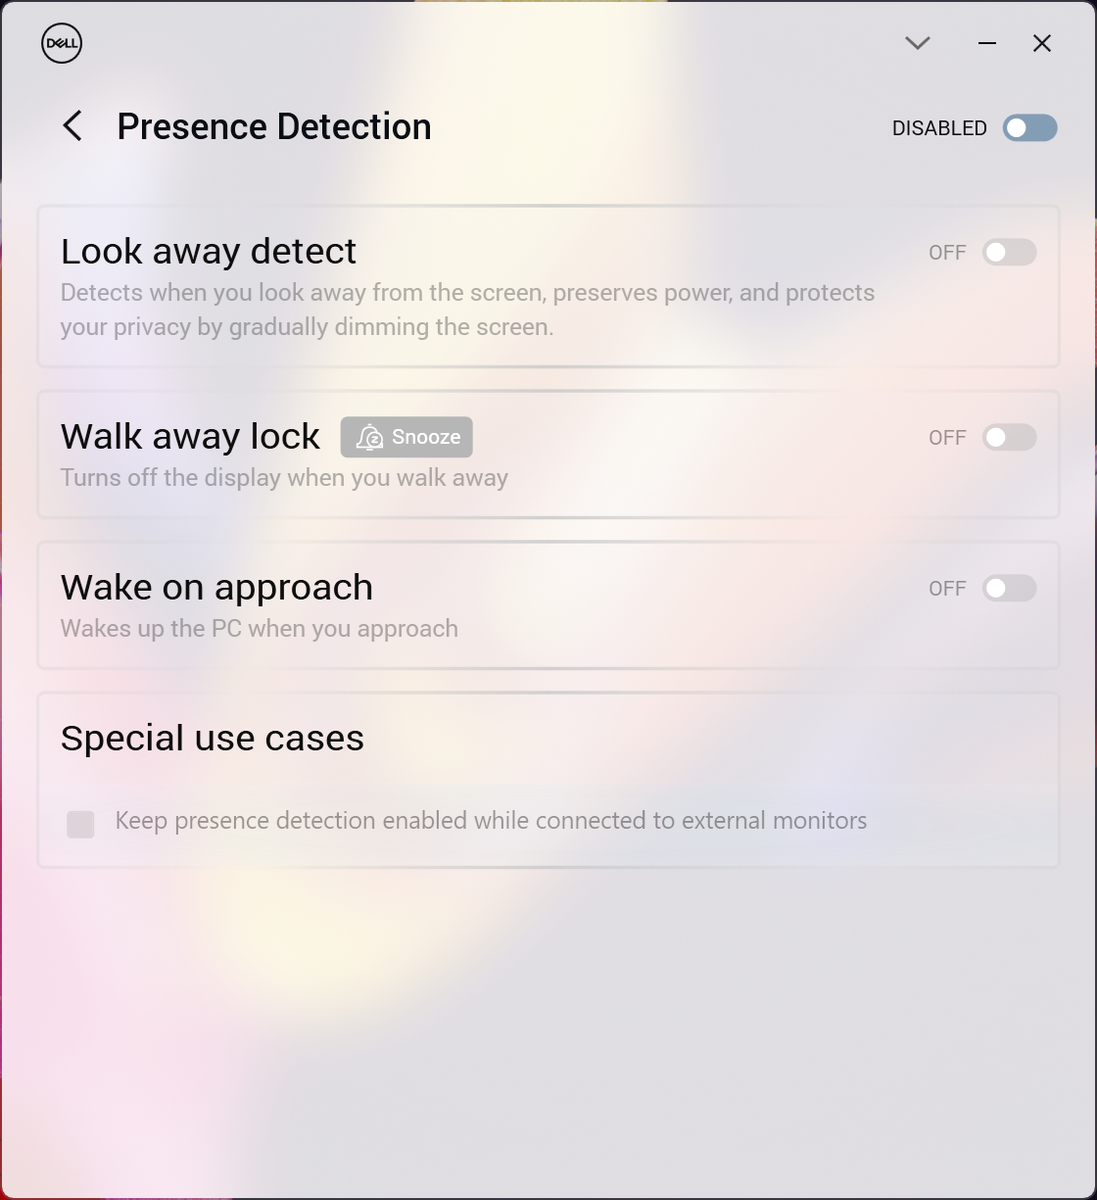
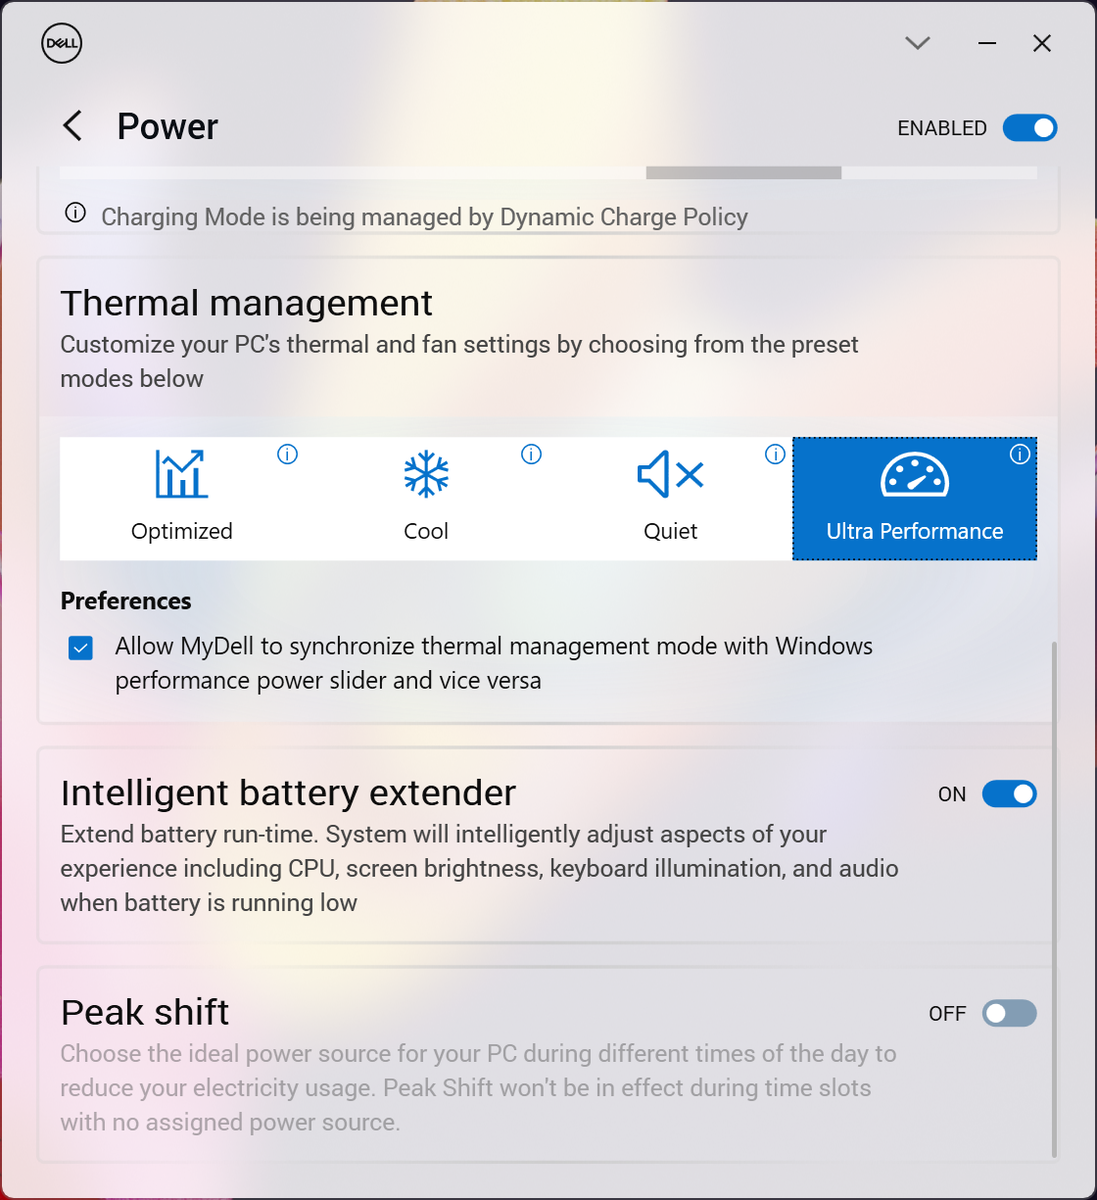
We set our unit to Ultra Performance mode via the redesigned MyDell software prior to running the benchmarks below. MyDell is the XPS equivalent to the Optimizer software that ships with many Latitude models and so it integrates similar features like performance profiles, charging habits, and Presence Detection. The Dell power profiles can conveniently sync with the standard Windows profiles unlike on most other laptops.
Processor
Multi-thread performance from our 13th gen Core i7-1360P is nearly identical to the 12th gen Core i7-1280P in the 2022 XPS 13 Plus. Even their Turbo Boost behaviors are the same as exemplified by the CineBench R15 xT loop test results below. The Lenovo Yoga 9 14IRP G8, which ships with the same Core i7-1360P, is able to sustain slightly faster Turbo Boost clock rates for longer under the same test.
While multi-thread performance hasn't really changed year-over-year, single-thread performance is up by roughly 10 to 15 percent over the Core i7-1280P. This isn't expected to have much of an impact on daily workloads, however, as most modern applications are multi-threaded.
Cinebench R15 Multi Loop
Cinebench R20: CPU (Multi Core) | CPU (Single Core)
Cinebench R23: Multi Core | Single Core
Cinebench R15: CPU Multi 64Bit | CPU Single 64Bit
Blender: v2.79 BMW27 CPU
7-Zip 18.03: 7z b 4 | 7z b 4 -mmt1
Geekbench 5.5: Multi-Core | Single-Core
HWBOT x265 Benchmark v2.2: 4k Preset
LibreOffice : 20 Documents To PDF
R Benchmark 2.5: Overall mean
* ... smaller is better
AIDA64: FP32 Ray-Trace | FPU Julia | CPU SHA3 | CPU Queen | FPU SinJulia | FPU Mandel | CPU AES | CPU ZLib | FP64 Ray-Trace | CPU PhotoWorxx
| Performance Rating | |
| Framework Laptop 13.5 13th Gen Intel | |
| Dell XPS 13 Plus 9320 i7-1280P OLED | |
| Dell XPS 13 Plus 9320 Core i7-1360P | |
| HP Spectre x360 13.5 14t-ef000 | |
| Lenovo ThinkPad X13 Yoga G3 21AW003UGE | |
| AIDA64 / FP32 Ray-Trace | |
| Framework Laptop 13.5 13th Gen Intel | |
| Dell XPS 13 Plus 9320 i7-1280P OLED | |
| Dell XPS 13 Plus 9320 Core i7-1360P | |
| Lenovo ThinkPad X13 Yoga G3 21AW003UGE | |
| HP Spectre x360 13.5 14t-ef000 | |
| AIDA64 / FPU Julia | |
| Framework Laptop 13.5 13th Gen Intel | |
| Dell XPS 13 Plus 9320 i7-1280P OLED | |
| Dell XPS 13 Plus 9320 Core i7-1360P | |
| Lenovo ThinkPad X13 Yoga G3 21AW003UGE | |
| HP Spectre x360 13.5 14t-ef000 | |
| AIDA64 / CPU SHA3 | |
| Framework Laptop 13.5 13th Gen Intel | |
| Dell XPS 13 Plus 9320 i7-1280P OLED | |
| Dell XPS 13 Plus 9320 Core i7-1360P | |
| Lenovo ThinkPad X13 Yoga G3 21AW003UGE | |
| HP Spectre x360 13.5 14t-ef000 | |
| AIDA64 / CPU Queen | |
| Framework Laptop 13.5 13th Gen Intel | |
| Dell XPS 13 Plus 9320 i7-1280P OLED | |
| Dell XPS 13 Plus 9320 Core i7-1360P | |
| Lenovo ThinkPad X13 Yoga G3 21AW003UGE | |
| HP Spectre x360 13.5 14t-ef000 | |
| AIDA64 / FPU SinJulia | |
| Framework Laptop 13.5 13th Gen Intel | |
| Dell XPS 13 Plus 9320 i7-1280P OLED | |
| Dell XPS 13 Plus 9320 Core i7-1360P | |
| Lenovo ThinkPad X13 Yoga G3 21AW003UGE | |
| HP Spectre x360 13.5 14t-ef000 | |
| AIDA64 / FPU Mandel | |
| Framework Laptop 13.5 13th Gen Intel | |
| Dell XPS 13 Plus 9320 i7-1280P OLED | |
| Dell XPS 13 Plus 9320 Core i7-1360P | |
| Lenovo ThinkPad X13 Yoga G3 21AW003UGE | |
| HP Spectre x360 13.5 14t-ef000 | |
| AIDA64 / CPU AES | |
| Framework Laptop 13.5 13th Gen Intel | |
| HP Spectre x360 13.5 14t-ef000 | |
| Dell XPS 13 Plus 9320 i7-1280P OLED | |
| Dell XPS 13 Plus 9320 Core i7-1360P | |
| Lenovo ThinkPad X13 Yoga G3 21AW003UGE | |
| AIDA64 / CPU ZLib | |
| Framework Laptop 13.5 13th Gen Intel | |
| Dell XPS 13 Plus 9320 Core i7-1360P | |
| Dell XPS 13 Plus 9320 i7-1280P OLED | |
| Lenovo ThinkPad X13 Yoga G3 21AW003UGE | |
| HP Spectre x360 13.5 14t-ef000 | |
| AIDA64 / FP64 Ray-Trace | |
| Framework Laptop 13.5 13th Gen Intel | |
| Dell XPS 13 Plus 9320 i7-1280P OLED | |
| Dell XPS 13 Plus 9320 Core i7-1360P | |
| HP Spectre x360 13.5 14t-ef000 | |
| Lenovo ThinkPad X13 Yoga G3 21AW003UGE | |
| AIDA64 / CPU PhotoWorxx | |
| Dell XPS 13 Plus 9320 Core i7-1360P | |
| Dell XPS 13 Plus 9320 i7-1280P OLED | |
| HP Spectre x360 13.5 14t-ef000 | |
| Lenovo ThinkPad X13 Yoga G3 21AW003UGE | |
| Framework Laptop 13.5 13th Gen Intel | |
System Performance
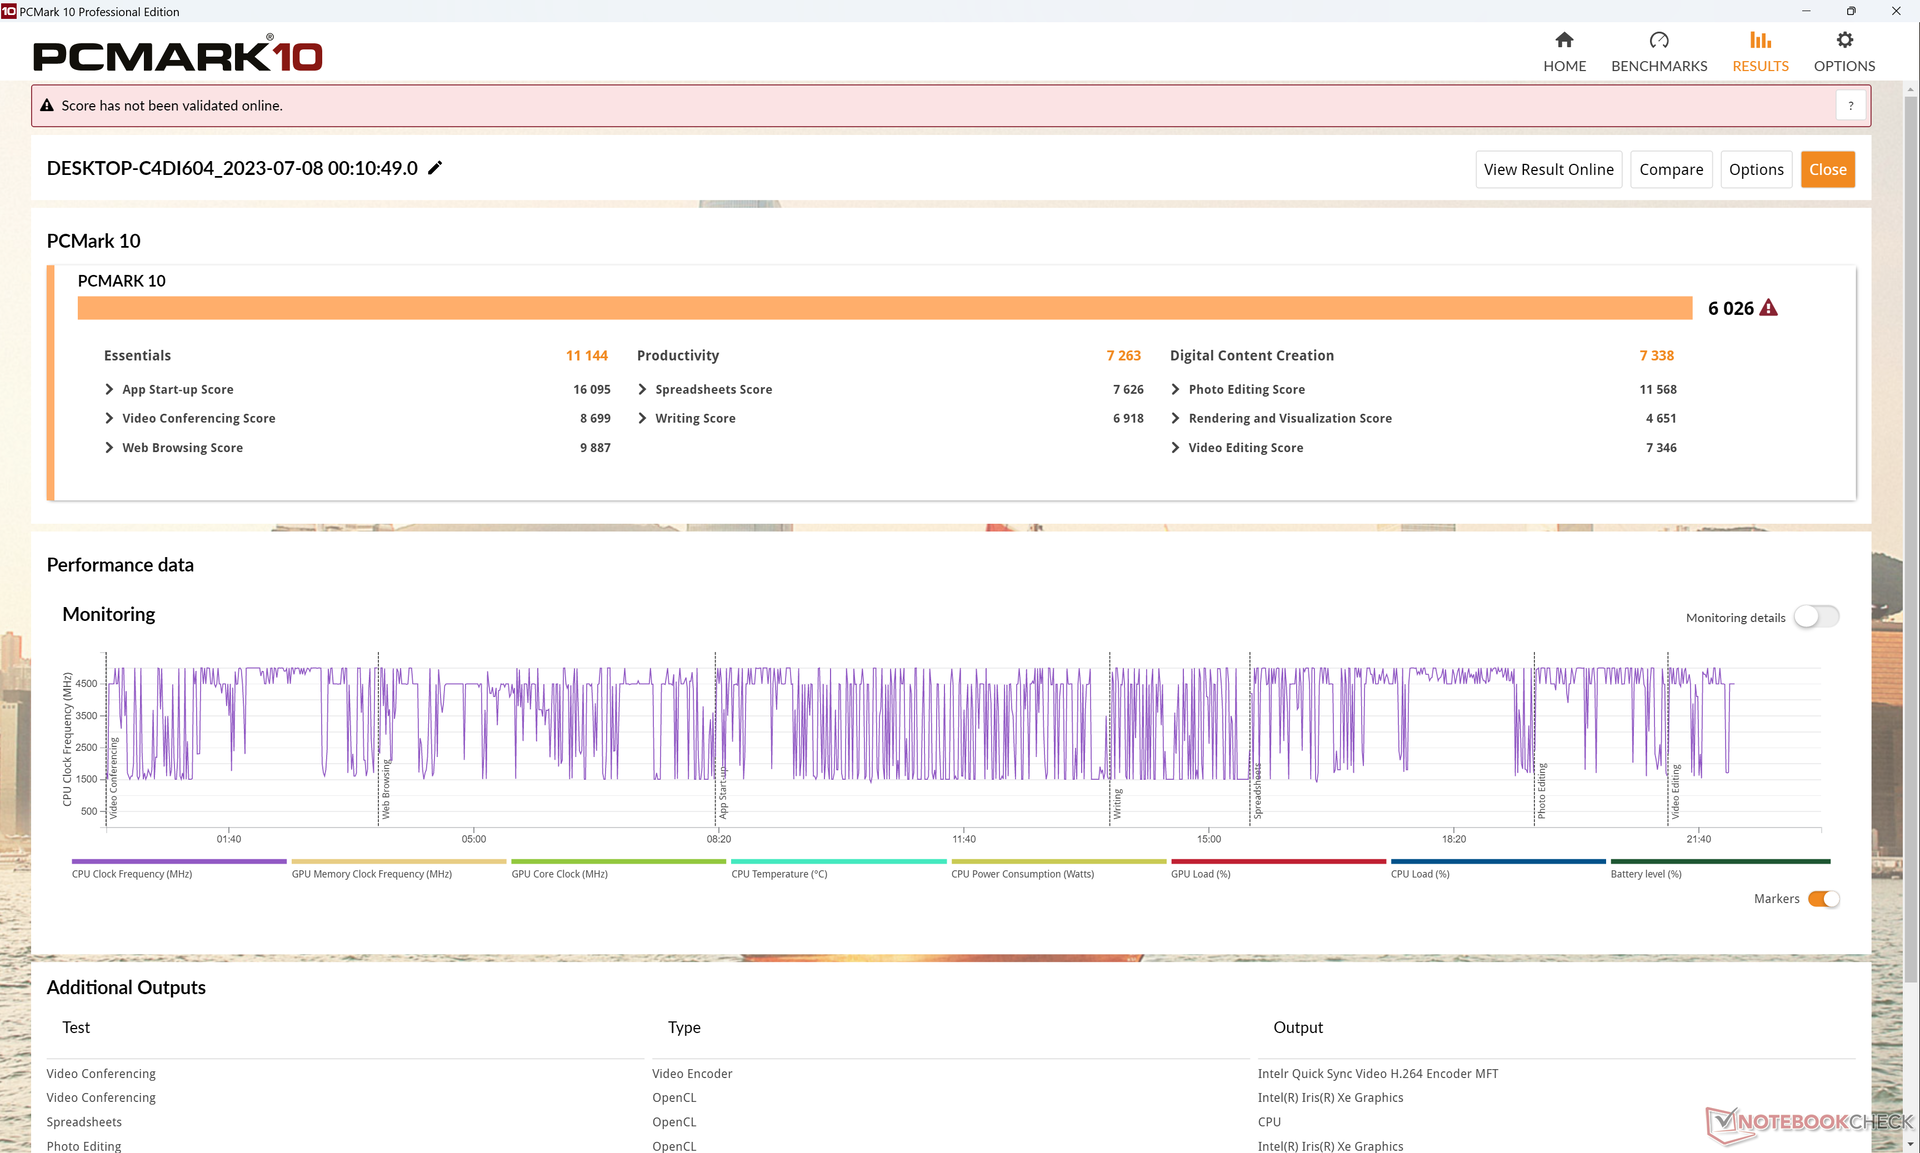
PCMark results are just slightly but consistently ahead of last year's XPS 13 Plus by single-digit percentage points likely due to the faster RAM and slightly faster single-thread performance.
CrossMark: Overall | Productivity | Creativity | Responsiveness
| PCMark 10 Score | 6026 points | |
Help | ||
* ... smaller is better
DPC Latency
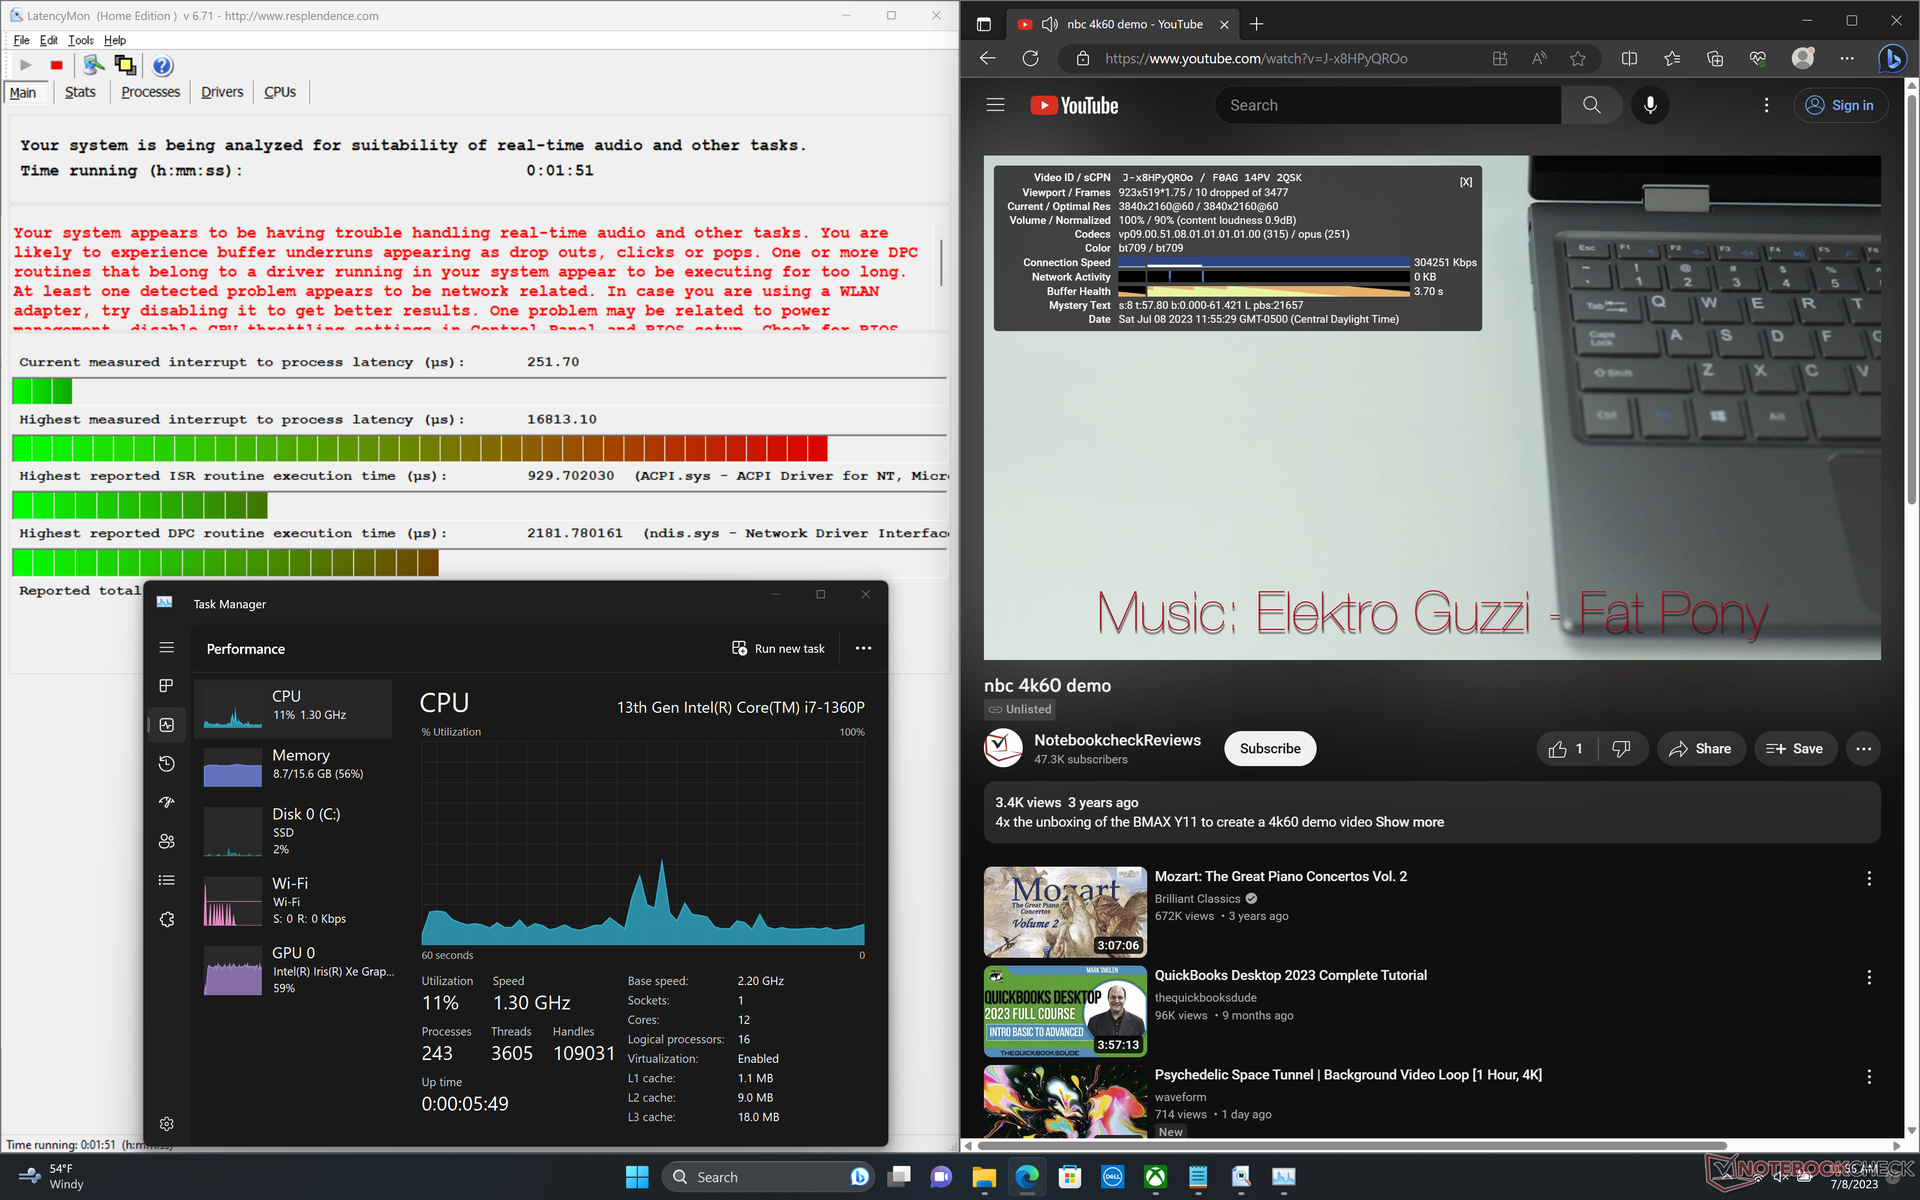
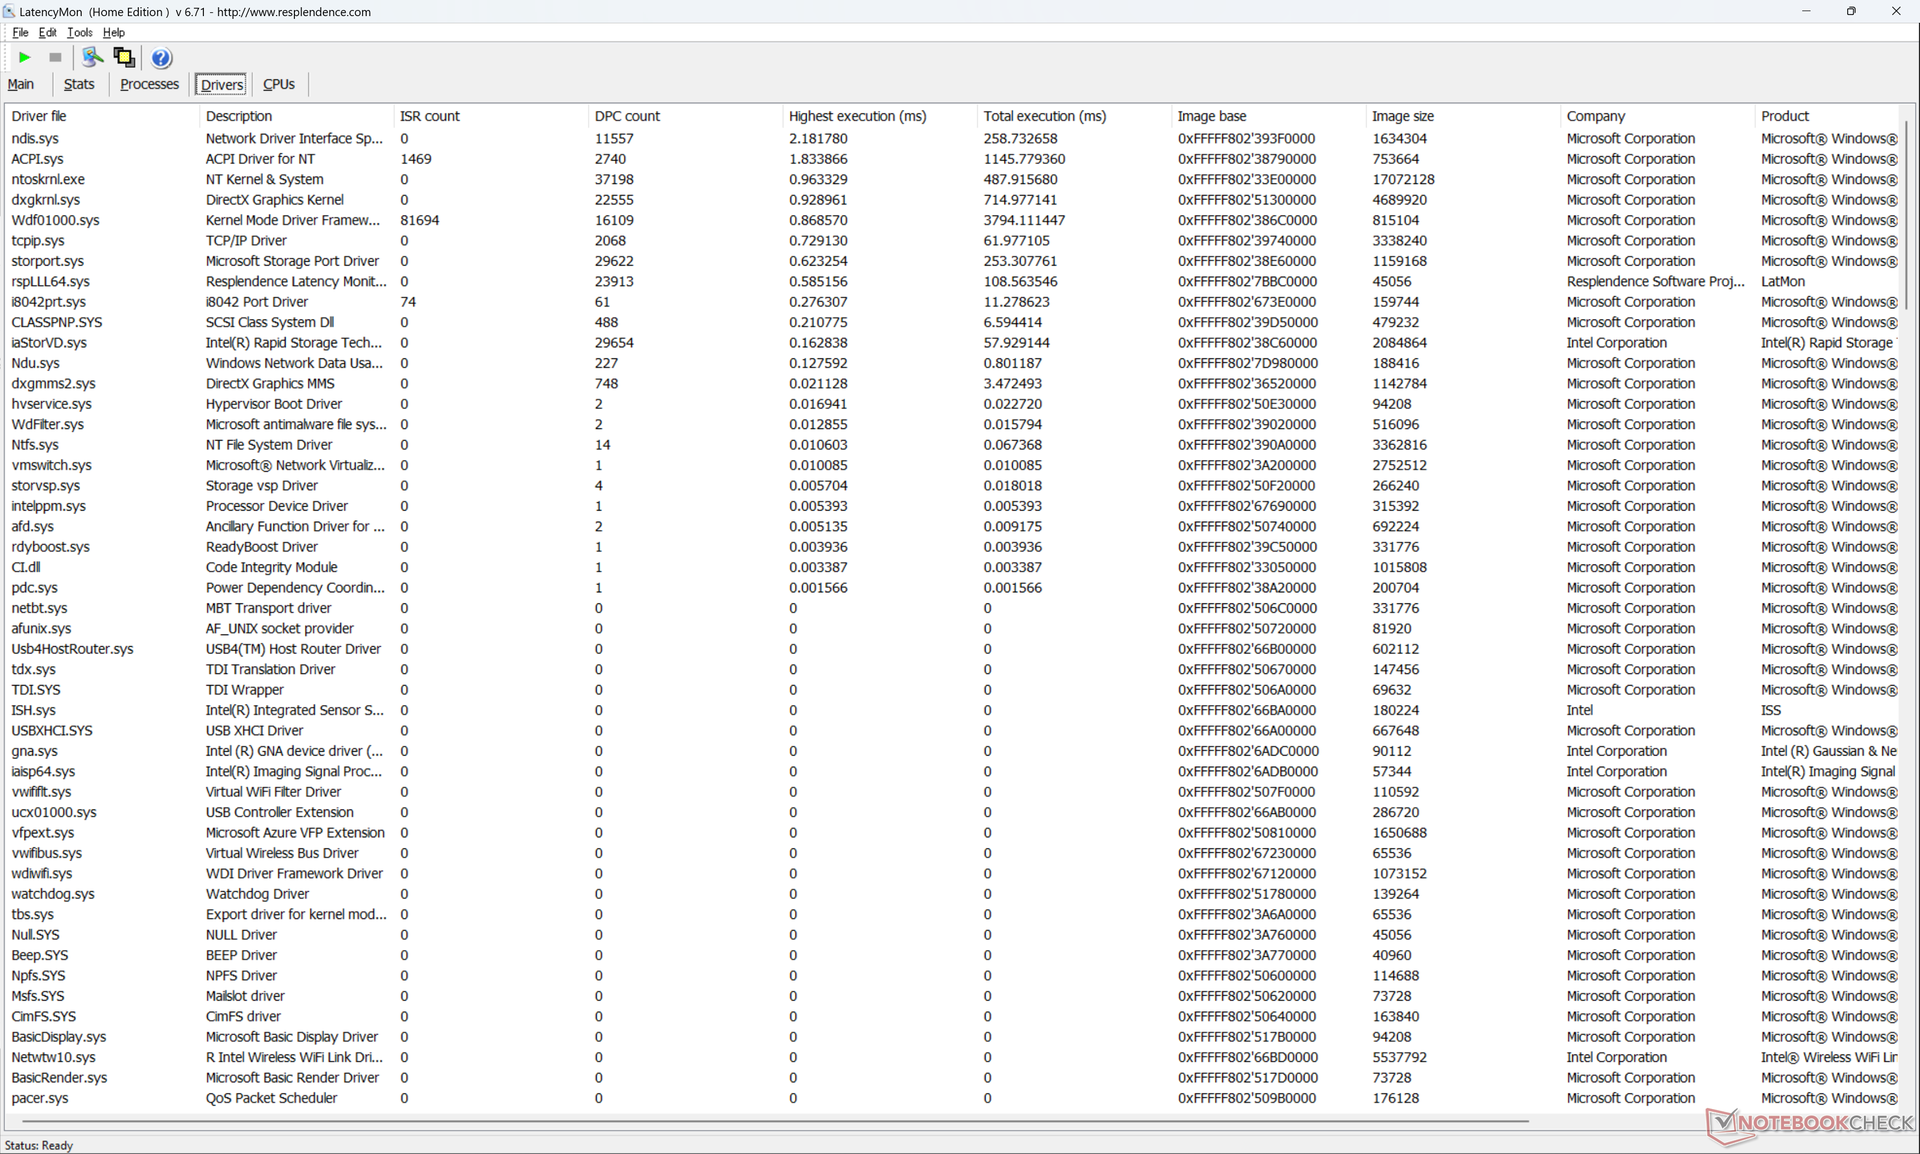
Our unit would exhibit latency issues when opening multiple browser tabs or homepage even after multiple retries. 4K video playback at 60 FPS would be imperfect as well with 10 dropped frames during our minute-long test video. This could potentially be a bug with the new 2023 model as none of our three 2022 test units showed these problems.
| DPC Latencies / LatencyMon - interrupt to process latency (max), Web, Youtube, Prime95 | |
| Dell XPS 13 Plus 9320 Core i7-1360P | |
| Lenovo ThinkPad X13 Yoga G3 21AW003UGE | |
| Dell XPS 13 Plus 9320 i5-1240p | |
| Dell XPS 13 Plus 9320 4K | |
| HP Spectre x360 13.5 14t-ef000 | |
| Dell XPS 13 Plus 9320 i7-1280P OLED | |
| Framework Laptop 13.5 13th Gen Intel | |
* ... smaller is better
Storage Devices
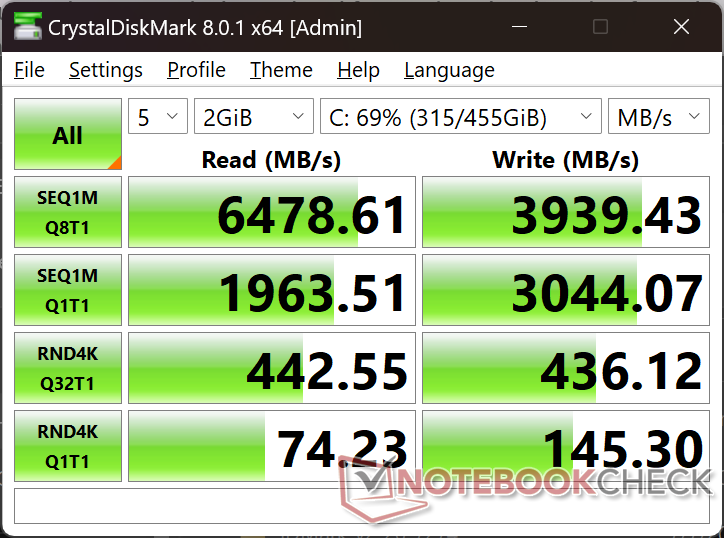
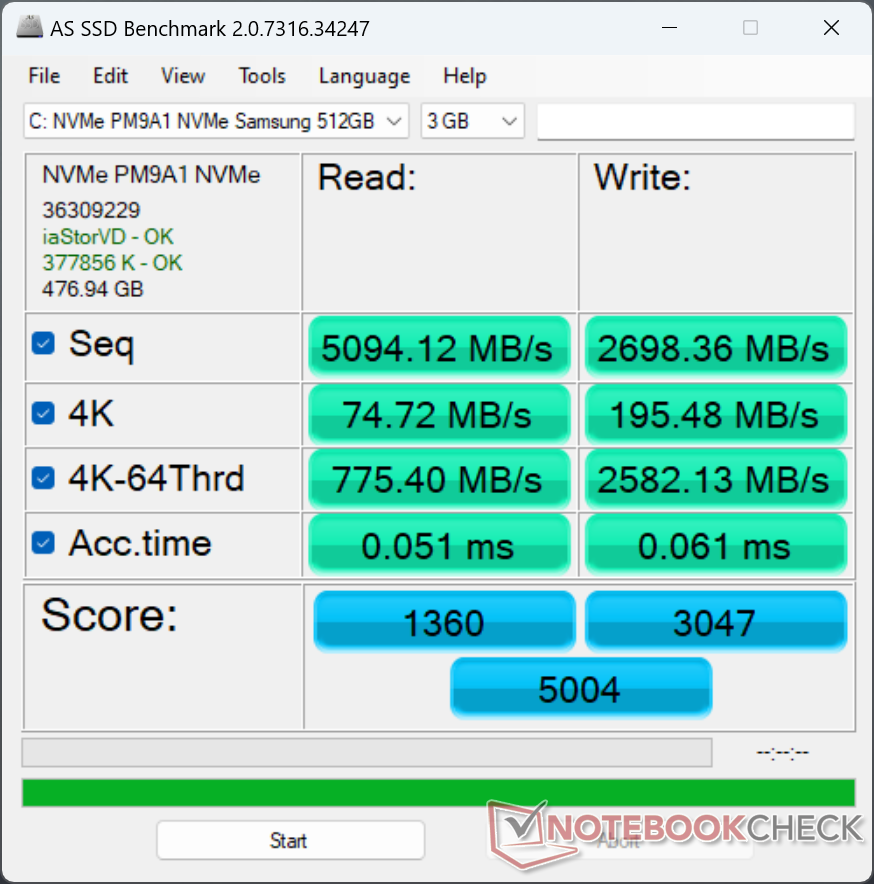
The SSDs in the XPS 13 Plus series may be sourced from Samsung, Micron, or Western Digital. For this particular unit, our SSD is the Samsung PM9A1 PCIe4 x4 offering sequential read and write rates of almost 7000 MB/s and 4000 MB/s, respectively. Unfortunately, the performance of our drive would throttle to as low as 2000 MB/s when stressed as shown by our DiskSpd loop test results below. Repeat testing would not result in any improvements. In contrast, the same drive in our 2022 XPS 13 Plus would not exhibit any performance throttling at all. We're unsure of any specific causes as there have been no changes to the SSD heat spreader as far as we can tell.

* ... smaller is better
Disk Throttling: DiskSpd Read Loop, Queue Depth 8
GPU Performance
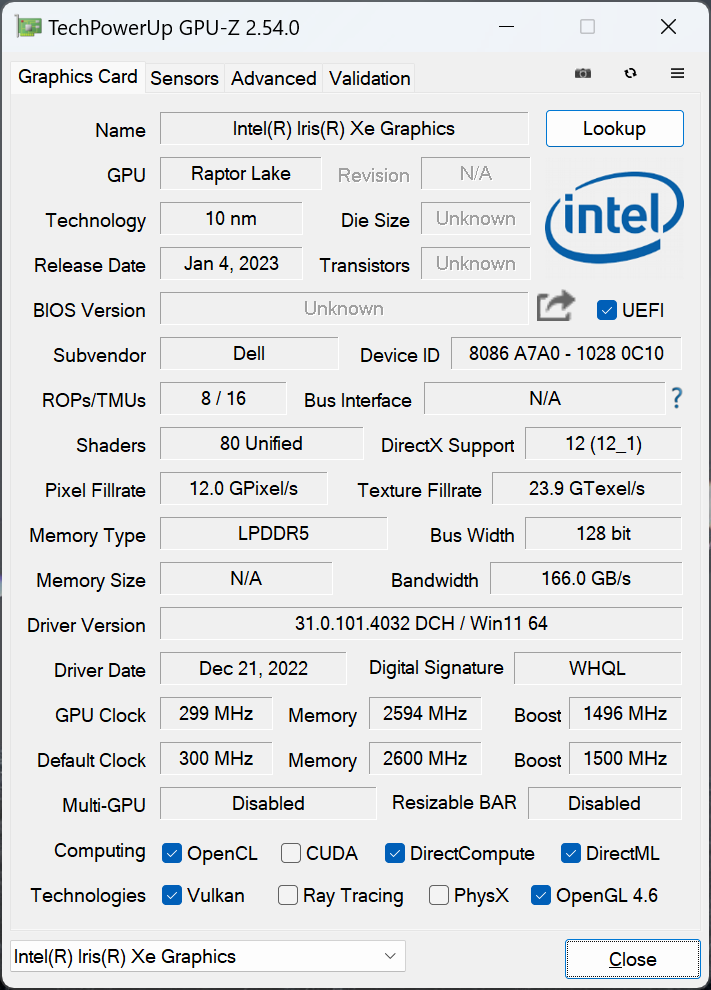
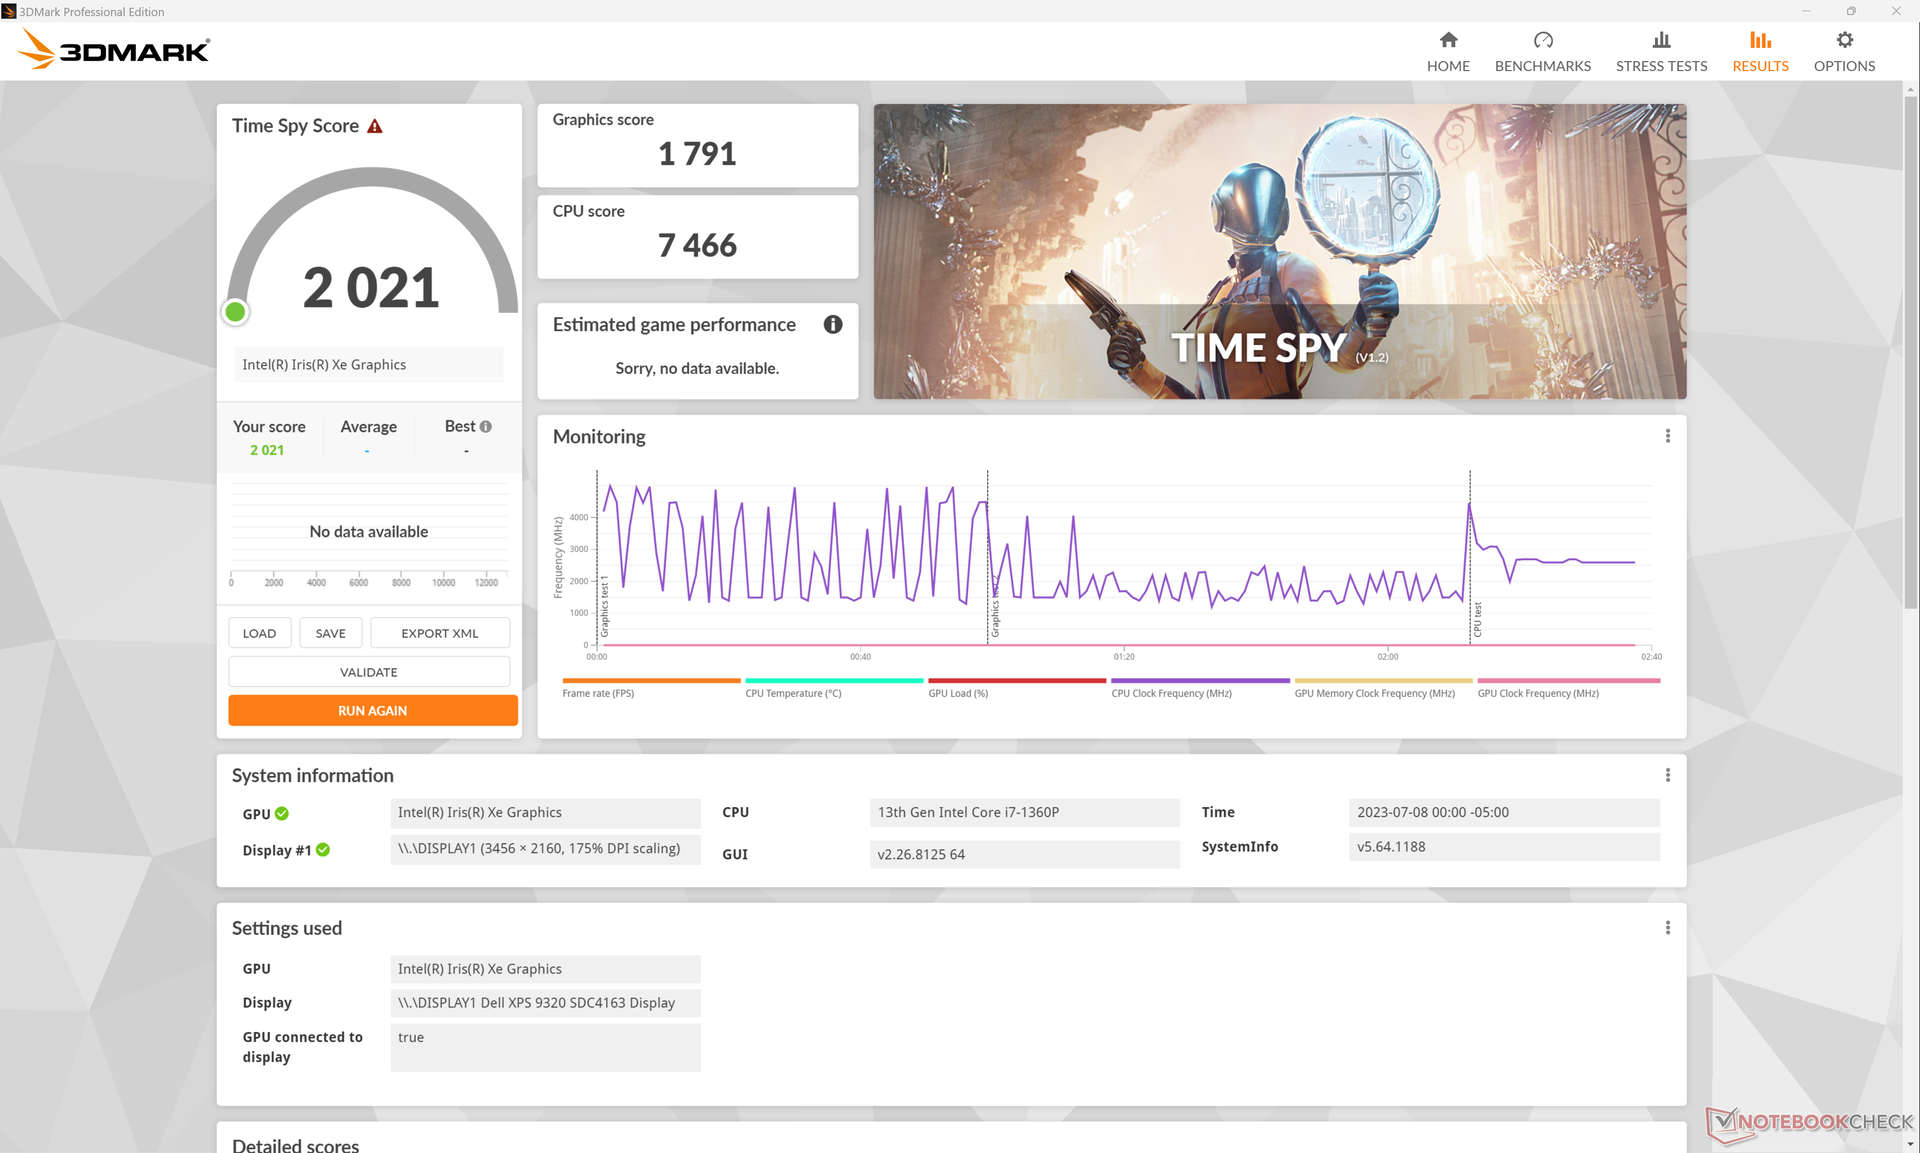
The Iris Xe 96 EUs remains the fastest integrated graphics solution from Intel despite it being a couple of years old. This year's version is slightly faster than last year's by a few percentage points due to the small uptick in memory clock rate, but it still pales in comparison to the competing Radeon 680M or 780M.
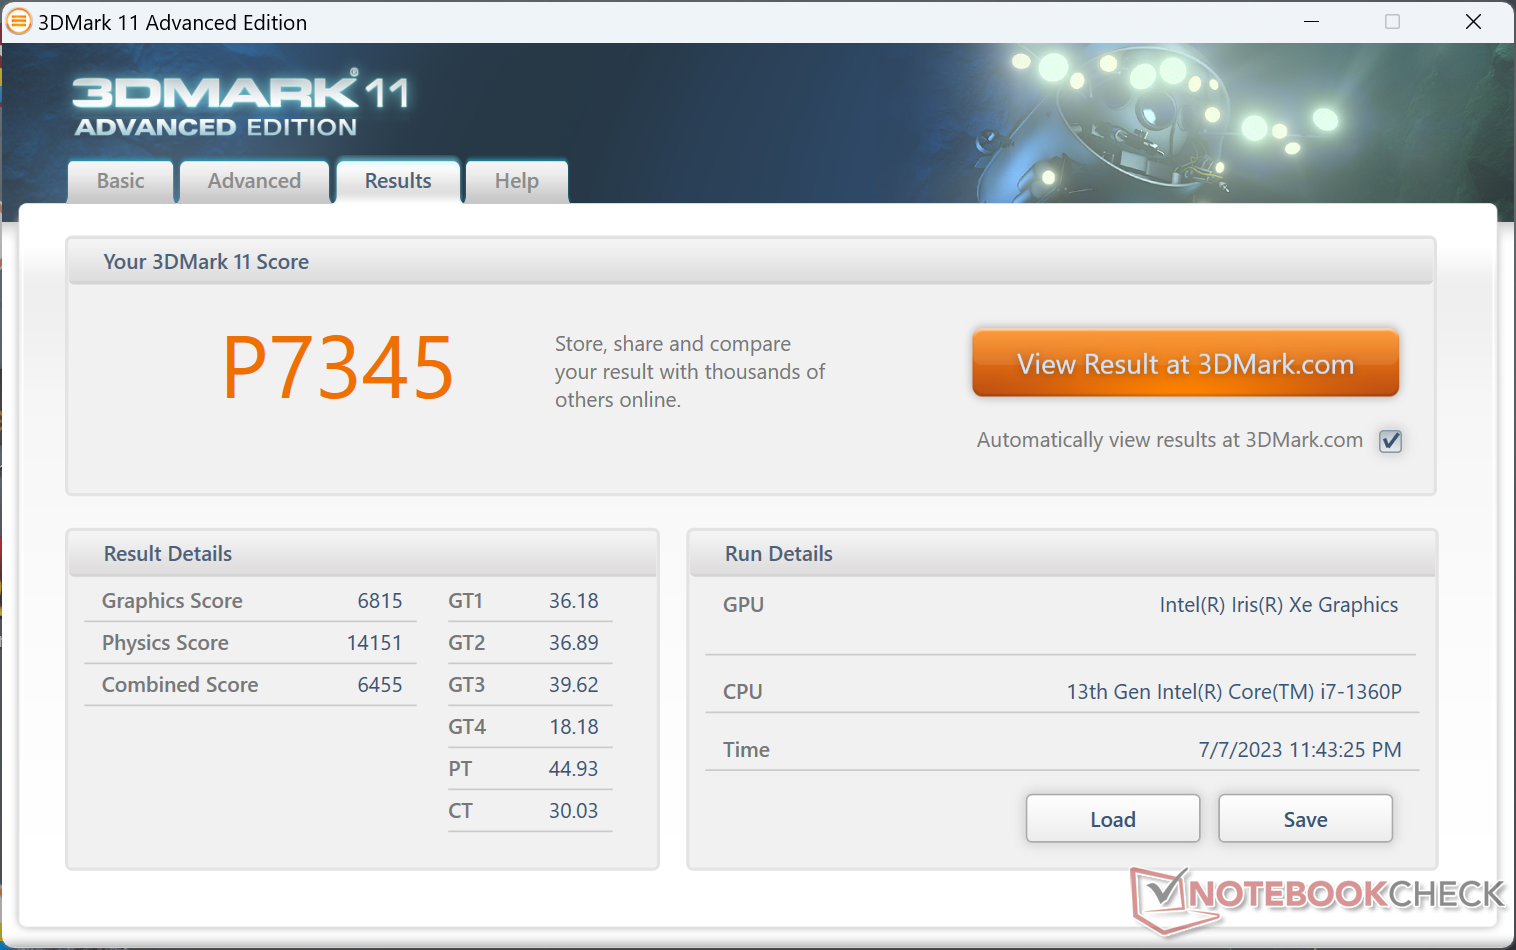

| 3DMark 11 Performance | 7345 points | |
| 3DMark Fire Strike Score | 5514 points | |
| 3DMark Time Spy Score | 2021 points | |
Help | ||
* ... smaller is better
| Cyberpunk 2077 1.6 | |
| 1280x720 Low Preset | |
| Asus Zenbook S 13 OLED | |
| Dell XPS 13 Plus 9320 Core i7-1360P | |
| Average Intel Iris Xe Graphics G7 96EUs (20.6 - 44.7, n=15) | |
| 1920x1080 Low Preset | |
| Asus Zenbook S 13 OLED | |
| HP Spectre x360 13.5 14t-ef000 | |
| Dell XPS 13 Plus 9320 i7-1280P OLED | |
| Dell XPS 13 Plus 9320 Core i7-1360P | |
| Average Intel Iris Xe Graphics G7 96EUs (13 - 25.9, n=40) | |
| 1920x1080 Medium Preset | |
| Asus Zenbook S 13 OLED | |
| HP Spectre x360 13.5 14t-ef000 | |
| Dell XPS 13 Plus 9320 i7-1280P OLED | |
| Dell XPS 13 Plus 9320 Core i7-1360P | |
| Average Intel Iris Xe Graphics G7 96EUs (10.8 - 21.7, n=37) | |
| 1920x1080 High Preset | |
| Asus Zenbook S 13 OLED | |
| HP Spectre x360 13.5 14t-ef000 | |
| Dell XPS 13 Plus 9320 i7-1280P OLED | |
| Dell XPS 13 Plus 9320 Core i7-1360P | |
| Average Intel Iris Xe Graphics G7 96EUs (9.8 - 16.9, n=34) | |
| 1920x1080 Ultra Preset | |
| Asus Zenbook S 13 OLED | |
| HP Spectre x360 13.5 14t-ef000 | |
| Dell XPS 13 Plus 9320 i7-1280P OLED | |
| Dell XPS 13 Plus 9320 Core i7-1360P | |
| Average Intel Iris Xe Graphics G7 96EUs (7.4 - 16.8, n=32) | |
| Tiny Tina's Wonderlands | |
| 1920x1080 Low Preset (DX12) | |
| Framework Laptop 13.5 13th Gen Intel | |
| Dell XPS 13 Plus 9320 Core i7-1360P | |
| Average Intel Iris Xe Graphics G7 96EUs (22.3 - 33.1, n=22) | |
| 1920x1080 Medium Preset (DX12) | |
| Framework Laptop 13.5 13th Gen Intel | |
| Dell XPS 13 Plus 9320 Core i7-1360P | |
| Average Intel Iris Xe Graphics G7 96EUs (17 - 28.2, n=22) | |
| 1920x1080 High Preset (DX12) | |
| Framework Laptop 13.5 13th Gen Intel | |
| Dell XPS 13 Plus 9320 Core i7-1360P | |
| Average Intel Iris Xe Graphics G7 96EUs (10.6 - 18.1, n=21) | |
| 1920x1080 Badass Preset (DX12) | |
| Framework Laptop 13.5 13th Gen Intel | |
| Dell XPS 13 Plus 9320 Core i7-1360P | |
| Average Intel Iris Xe Graphics G7 96EUs (8.4 - 14.3, n=18) | |
| 1280x720 Lowest Preset (DX12) | |
| Dell XPS 13 Plus 9320 Core i7-1360P | |
| Average Intel Iris Xe Graphics G7 96EUs (35.9 - 59.8, n=21) | |
Witcher 3 FPS Chart
| low | med. | high | ultra | QHD | |
| GTA V (2015) | 130.6 | 105.3 | 26.6 | 11.6 | 7.35 |
| The Witcher 3 (2015) | 86.7 | 56.1 | 33.9 | 15.4 | |
| Dota 2 Reborn (2015) | 125.6 | 97.7 | 68.7 | 61.6 | |
| Final Fantasy XV Benchmark (2018) | 44.5 | 25.2 | 17.5 | ||
| X-Plane 11.11 (2018) | 42.7 | 36.2 | 33.2 | ||
| Strange Brigade (2018) | 93.9 | 43.8 | 35.4 | 27.5 | |
| Cyberpunk 2077 1.6 (2022) | 20.8 | 17.3 | 13.6 | 11 | |
| Tiny Tina's Wonderlands (2022) | 29.6 | 23.7 | 15.2 | 12.2 | |
| F1 22 (2022) | 47.5 | 42.8 | 31.9 | 24.1 |
Emissions
System Noise
Though there are no changes to the cooling solution or fan noise levels, we're able to notice a slight coil whine from our test unit when placing an ear near the keyboard keys. The fans are otherwise idling or just barely audible under most light loads like web browsing or word processing.

Noise Level
| Idle |
| 24 / 24 / 24.4 dB(A) |
| Load |
| 37 / 42 dB(A) |
 | ||
30 dB silent 40 dB(A) audible 50 dB(A) loud |
||
min: | ||
| Dell XPS 13 Plus 9320 Core i7-1360P Iris Xe G7 96EUs, i7-1360P, Samsung PM9A1 MZVL2512HCJQ | Dell XPS 13 Plus 9320 i7-1280P OLED Iris Xe G7 96EUs, i7-1280P, WDC PC SN810 512GB | Dell XPS 13 7390 Core i7-10710U UHD Graphics 620, i7-10710U, SK Hynix PC601 NVMe 512 GB | Framework Laptop 13.5 13th Gen Intel Iris Xe G7 96EUs, i7-1370P, WD PC SN740 SDDPNQD-1T00 | Lenovo ThinkPad X13 Yoga G3 21AW003UGE Iris Xe G7 96EUs, i7-1265U, Samsung PM9A1 MZVL2512HCJQ | HP Spectre x360 13.5 14t-ef000 Iris Xe G7 96EUs, i7-1255U, Micron 3400 1TB MTFDKBA1T0TFH | |
|---|---|---|---|---|---|---|
| Noise | 3% | -12% | -6% | -2% | 7% | |
| off / environment * | 23.7 | 23.4 1% | 28 -18% | 23.2 2% | 23.22 2% | 23.5 1% |
| Idle Minimum * | 24 | 23.4 2% | 28 -17% | 23.2 3% | 23.2 3% | 23.5 2% |
| Idle Average * | 24 | 23.4 2% | 28 -17% | 23.2 3% | 23.2 3% | 23.5 2% |
| Idle Maximum * | 24.4 | 23.4 4% | 28 -15% | 23.2 5% | 28.6 -17% | 23.5 4% |
| Load Average * | 37 | 35 5% | 33.7 9% | 45.3 -22% | 39.8 -8% | 27 27% |
| Witcher 3 ultra * | 42.1 | 41.6 1% | 47.9 -14% | 41.8 1% | 36.2 14% | |
| Load Maximum * | 42 | 39.9 5% | 46.5 -11% | 49.2 -17% | 40.6 3% | 42.4 -1% |
* ... smaller is better
Temperature
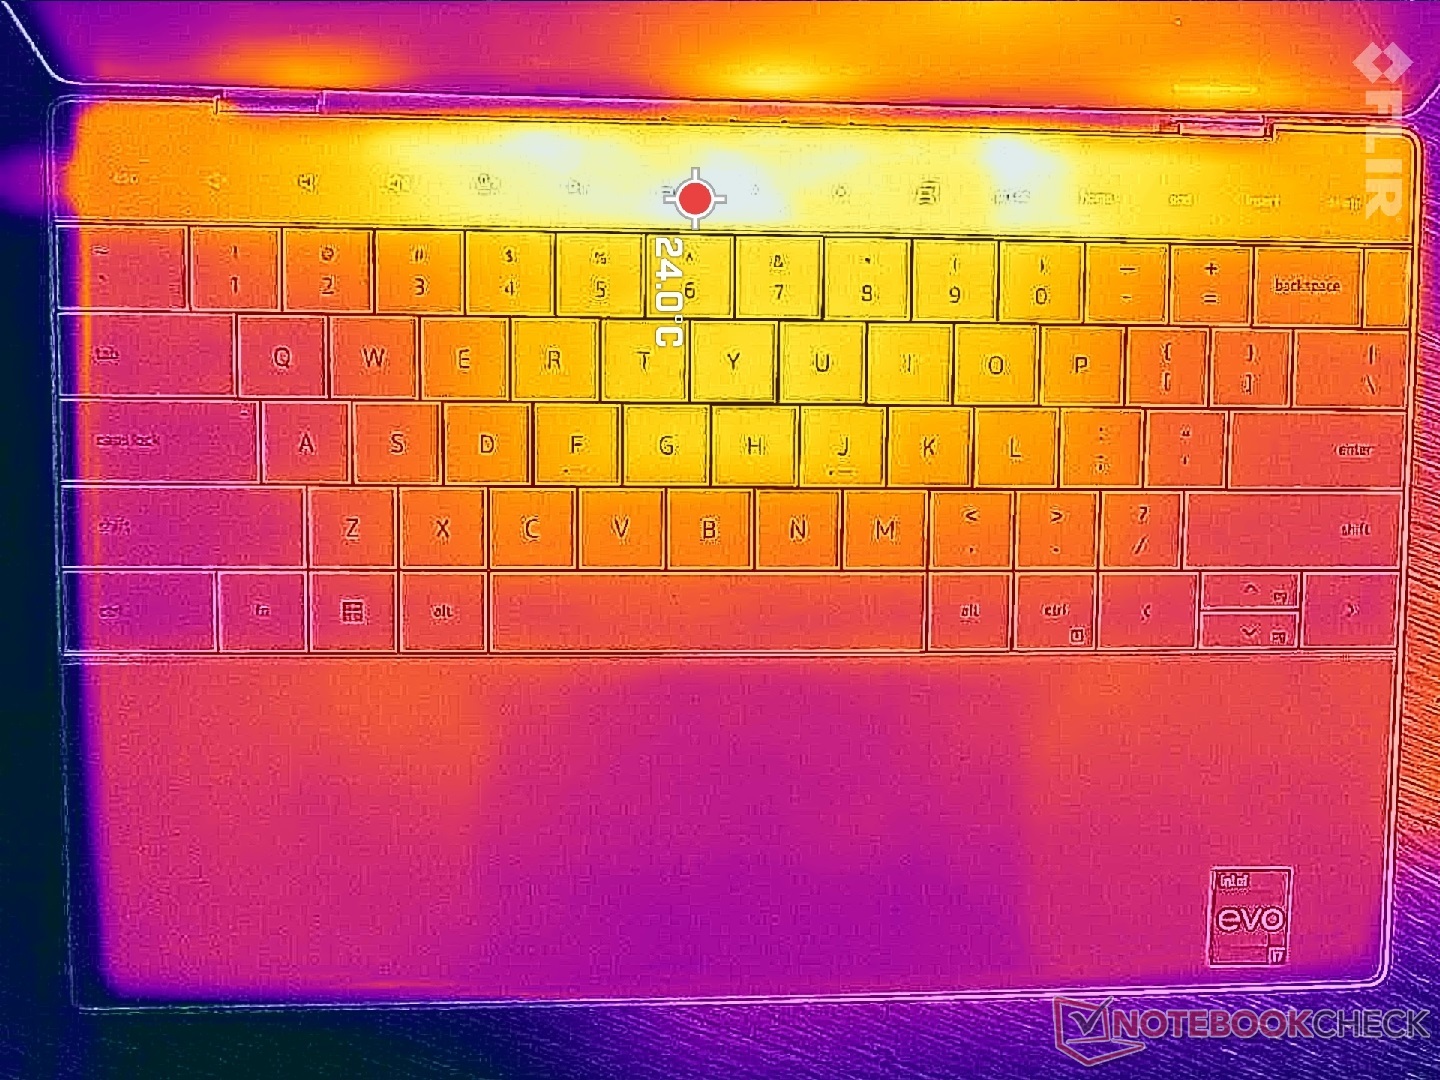
Surface temperatures can be very warm due to the thin profile, Core-P CPU, and lack of any ventilation grilles on the bottom panel. Hot spots can reach up to 45 C compared to just 35 C on the slower HP Dragonfly Folio 13.5 G3.


(±) The maximum temperature on the upper side is 43.8 °C / 111 F, compared to the average of 35.9 °C / 97 F, ranging from 21.4 to 59 °C for the class Subnotebook.
(±) The bottom heats up to a maximum of 44.4 °C / 112 F, compared to the average of 39.4 °C / 103 F
(+) In idle usage, the average temperature for the upper side is 22.4 °C / 72 F, compared to the device average of 30.7 °C / 87 F.
(±) Playing The Witcher 3, the average temperature for the upper side is 32.9 °C / 91 F, compared to the device average of 30.7 °C / 87 F.
(+) The palmrests and touchpad are reaching skin temperature as a maximum (32.6 °C / 90.7 F) and are therefore not hot.
(-) The average temperature of the palmrest area of similar devices was 28.3 °C / 82.9 F (-4.3 °C / -7.8 F).


| Dell XPS 13 Plus 9320 Core i7-1360P Intel Core i7-1360P, Intel Iris Xe Graphics G7 96EUs | Dell XPS 13 Plus 9320 i5-1240p Intel Core i5-1240P, Intel Iris Xe Graphics G7 80EUs | Dell XPS 13 7390 Core i7-10710U Intel Core i7-10710U, Intel UHD Graphics 620 | Framework Laptop 13.5 13th Gen Intel Intel Core i7-1370P, Intel Iris Xe Graphics G7 96EUs | Lenovo ThinkPad X13 Yoga G3 21AW003UGE Intel Core i7-1265U, Intel Iris Xe Graphics G7 96EUs | HP Spectre x360 13.5 14t-ef000 Intel Core i7-1255U, Intel Iris Xe Graphics G7 96EUs | |
|---|---|---|---|---|---|---|
| Heat | -41% | -13% | 1% | -25% | 14% | |
| Maximum Upper Side * | 43.8 | 47.6 -9% | 44.6 -2% | 38.2 13% | 52.2 -19% | 36.4 17% |
| Maximum Bottom * | 44.4 | 57 -28% | 49.2 -11% | 41.4 7% | 50.2 -13% | 37 17% |
| Idle Upper Side * | 24 | 38.8 -62% | 28.2 -18% | 25.8 -8% | 32 -33% | 20.8 13% |
| Idle Bottom * | 25.2 | 41 -63% | 30.2 -20% | 27.6 -10% | 33.6 -33% | 22.6 10% |
* ... smaller is better
Stress Test
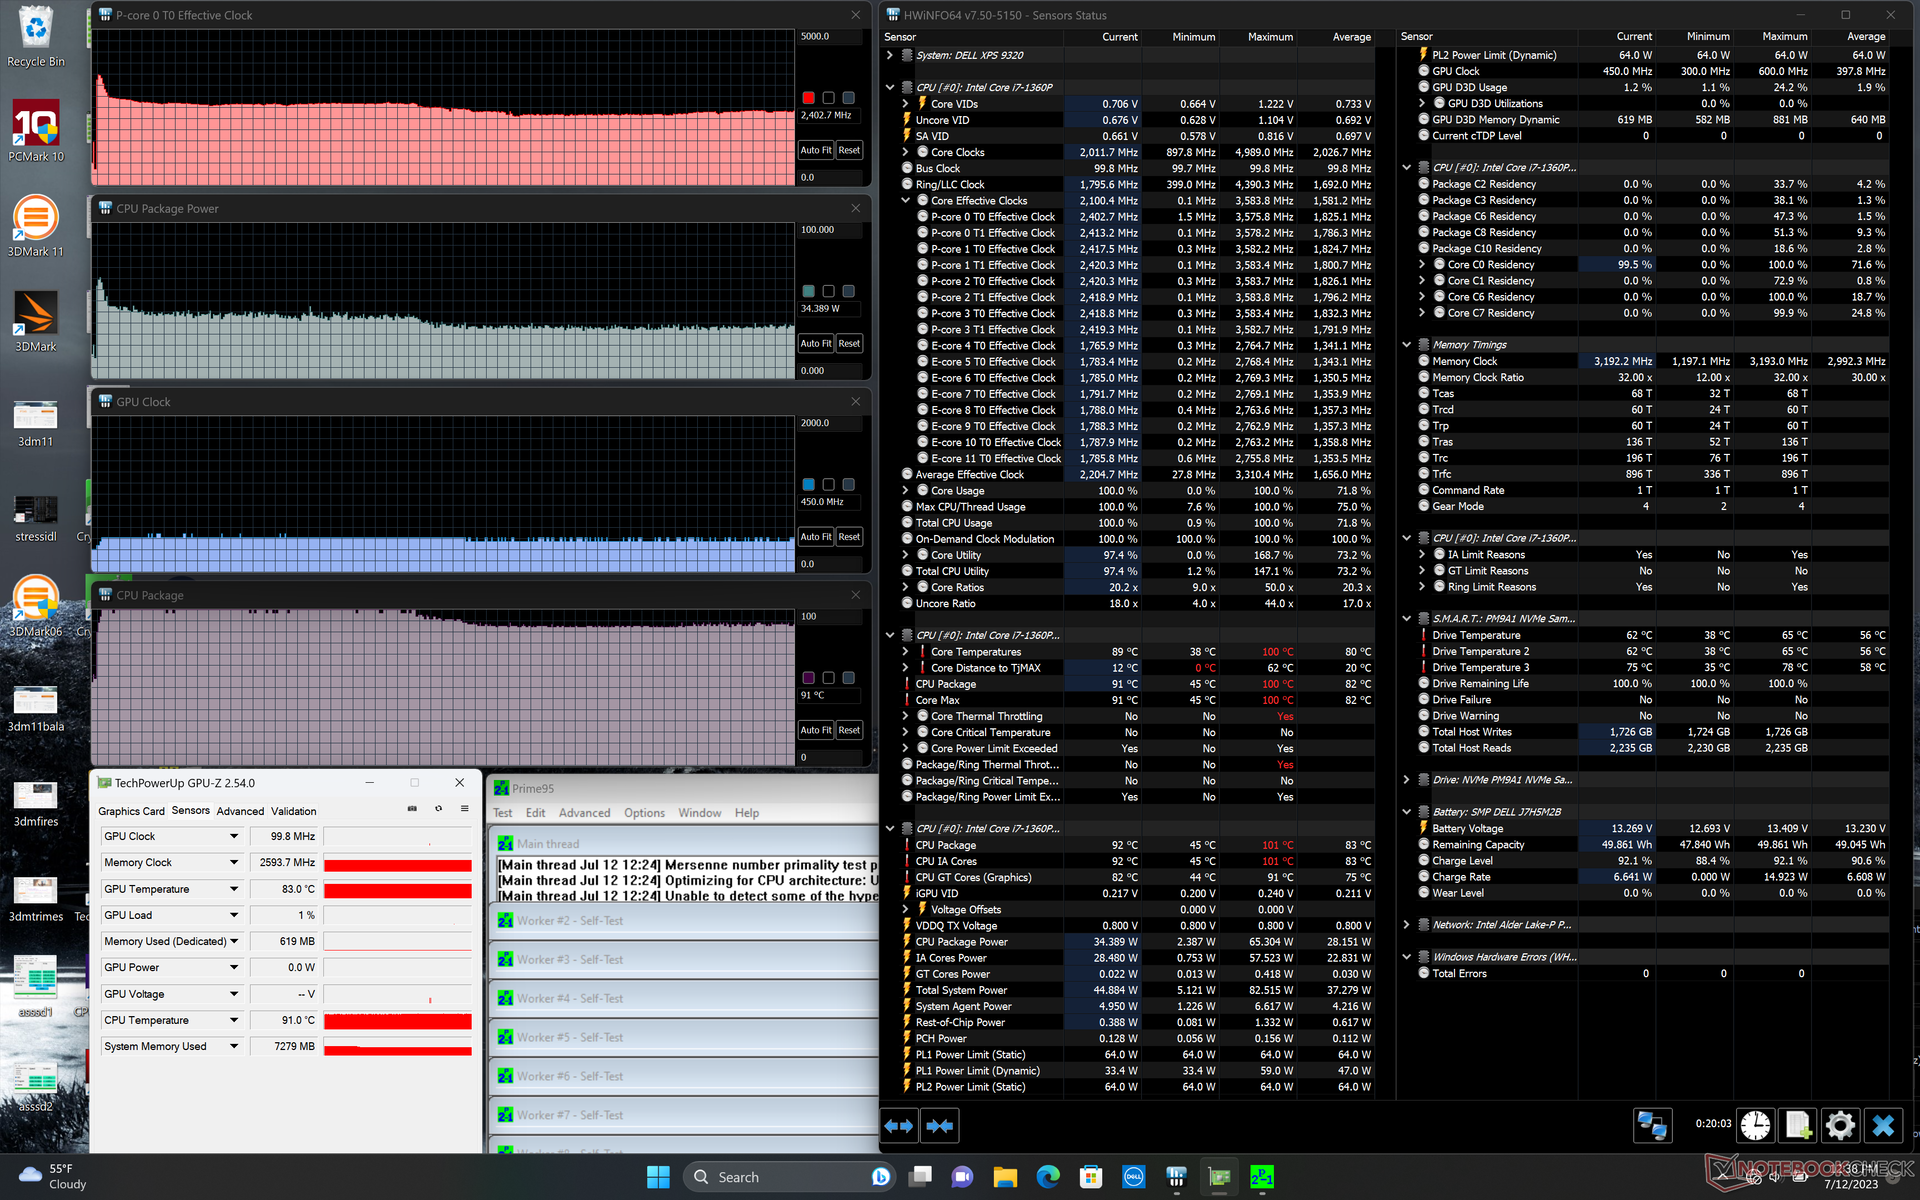
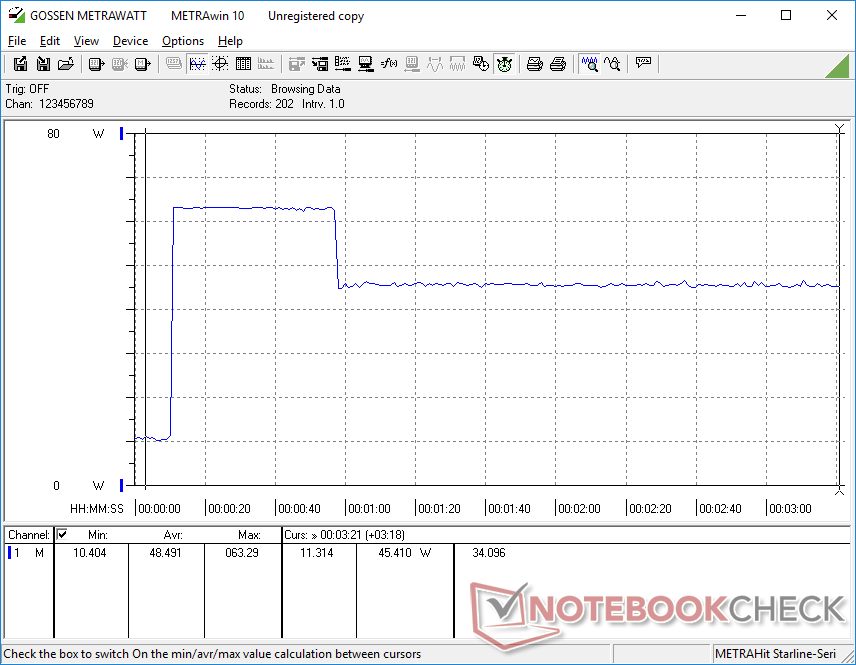
When stressed under Prime95, the PL2 and PL1 limits of the Core i7-1360P are exactly the same as what we observed on last year's Core i7-1280P-powered XPS 13 Plus at 64 W and 34 W, respectively. Clock rates would boost up to 3.6 GHz for the first second or so before falling and eventually stabilizing at 2.3 GHz and 90 C. The very warm CPU temperature is partly responsible for the high surface temperatures mentioned above.
Running on batteries does not impact performance. A 3DMark 11 test on battery power would result in essentially the same scores as on mains.
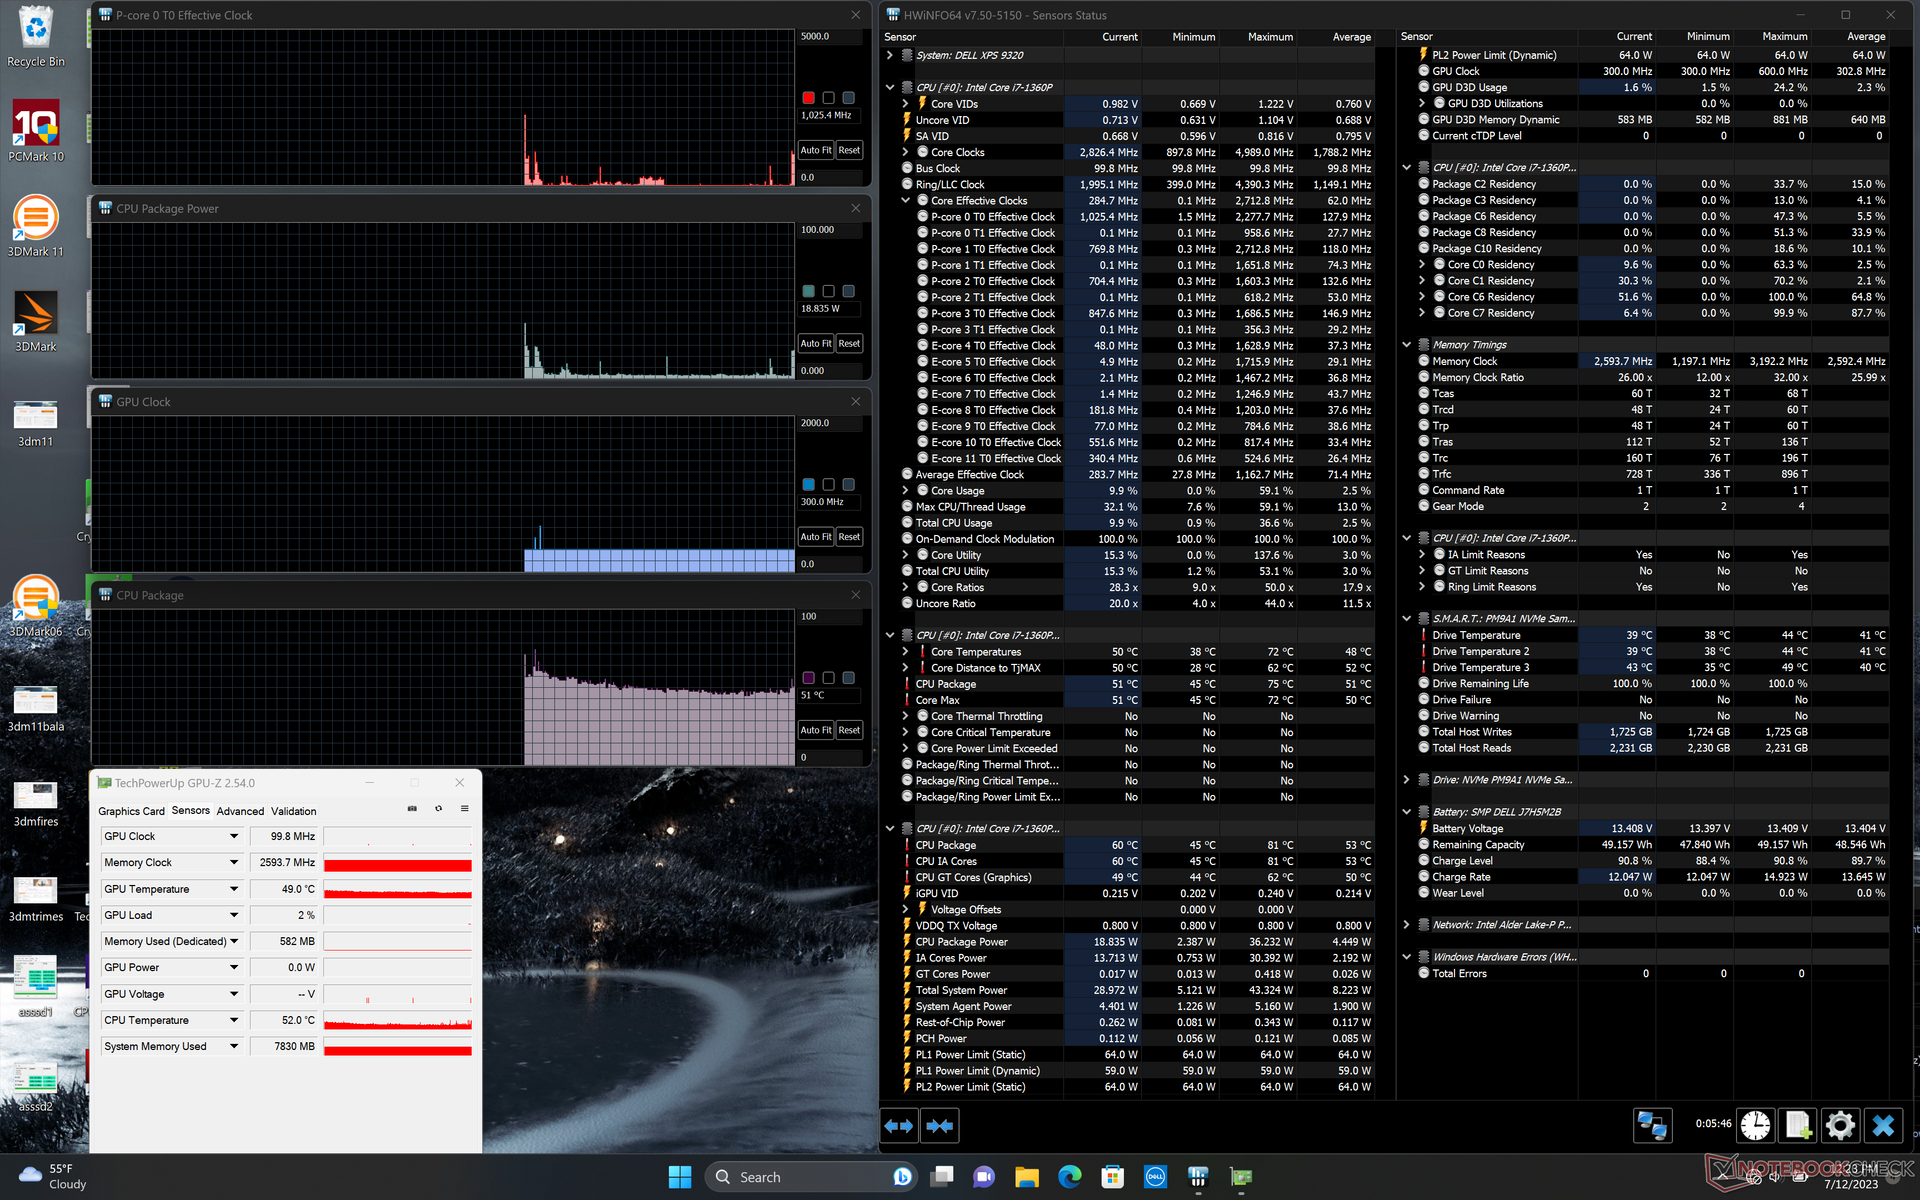
| CPU Clock (GHz) | GPU Clock (MHz) | Average CPU Temperature (°C) | |
| System Idle | -- | -- | 51 |
| Prime95 Stress | 2.4 | -- | 91 |
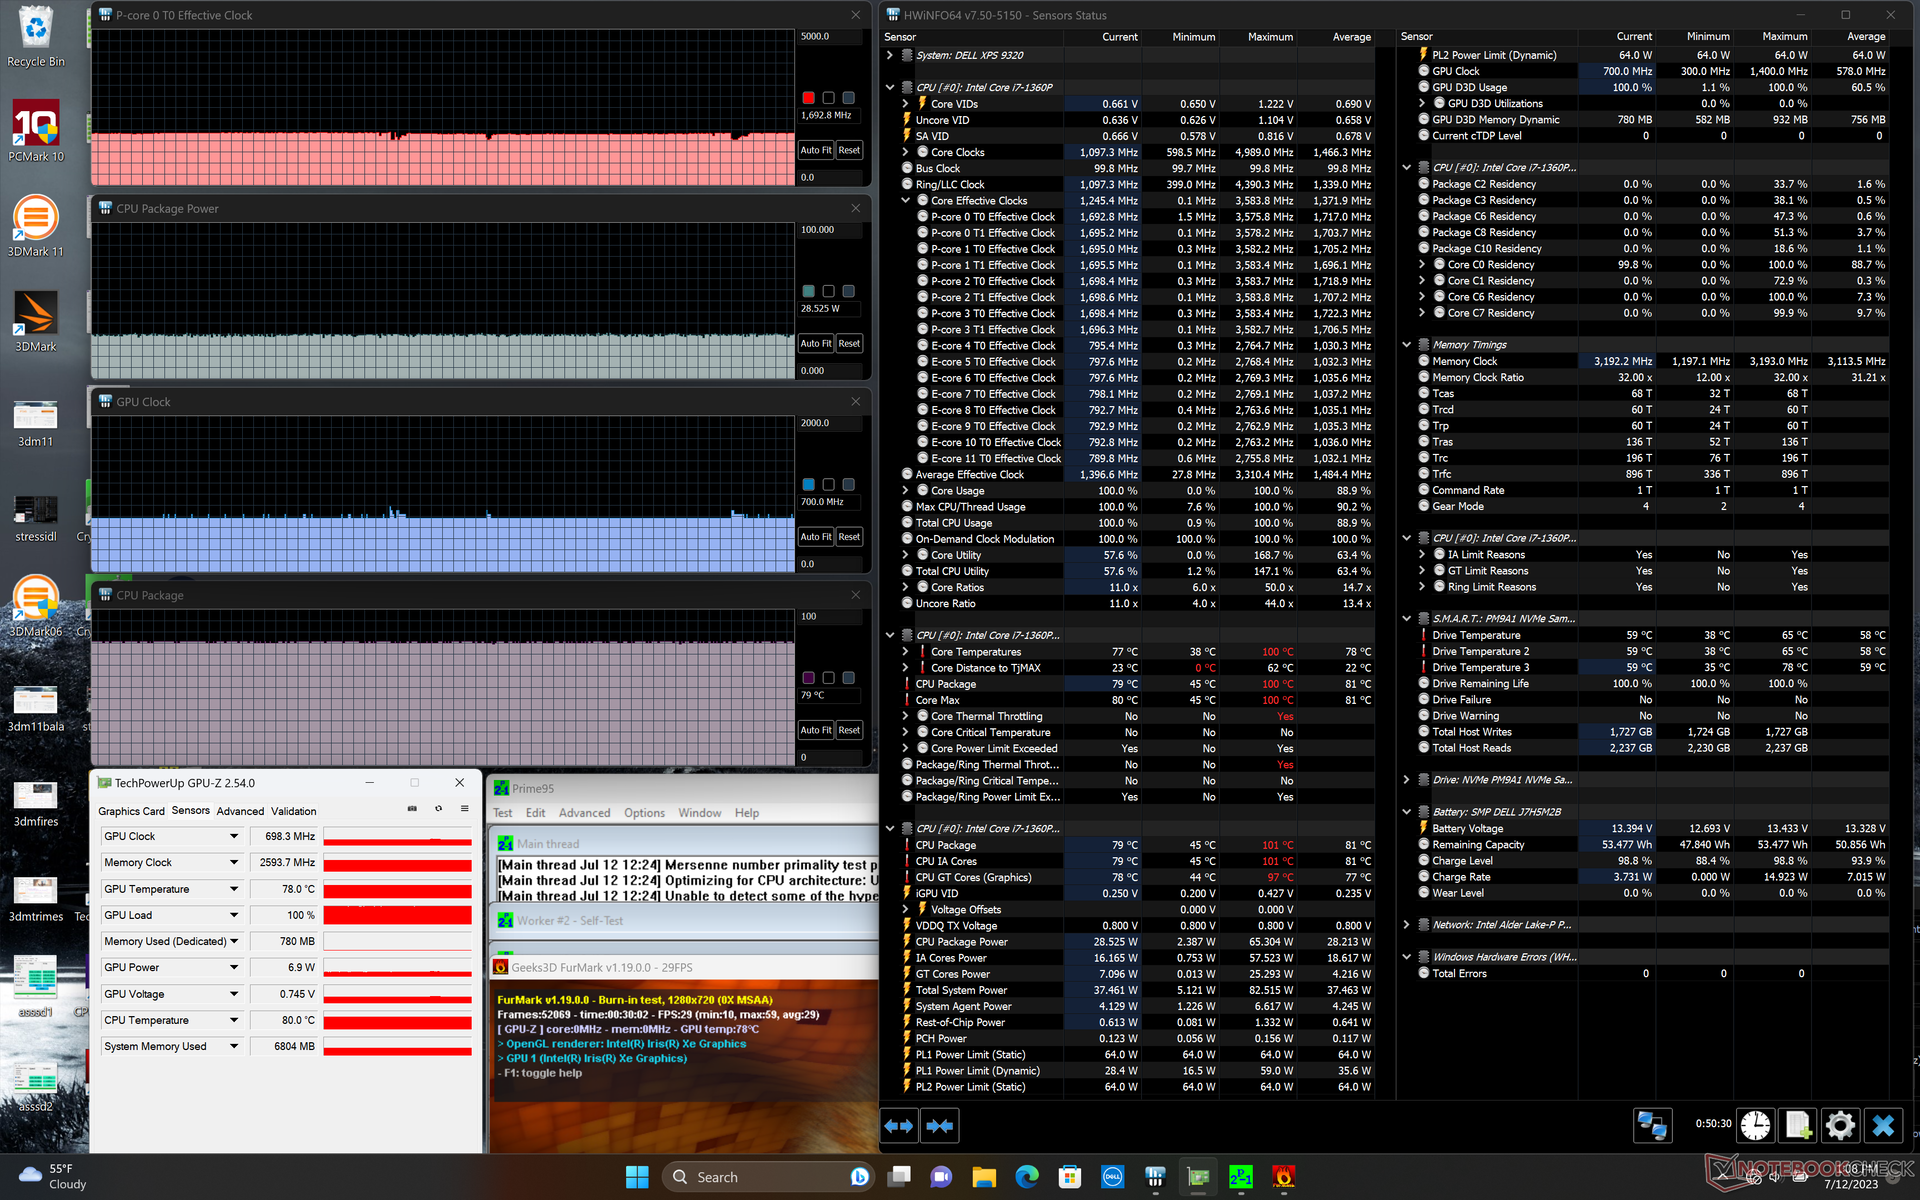
| Prime95 + FurMark Stress | 1.7 | 700 | 79 |
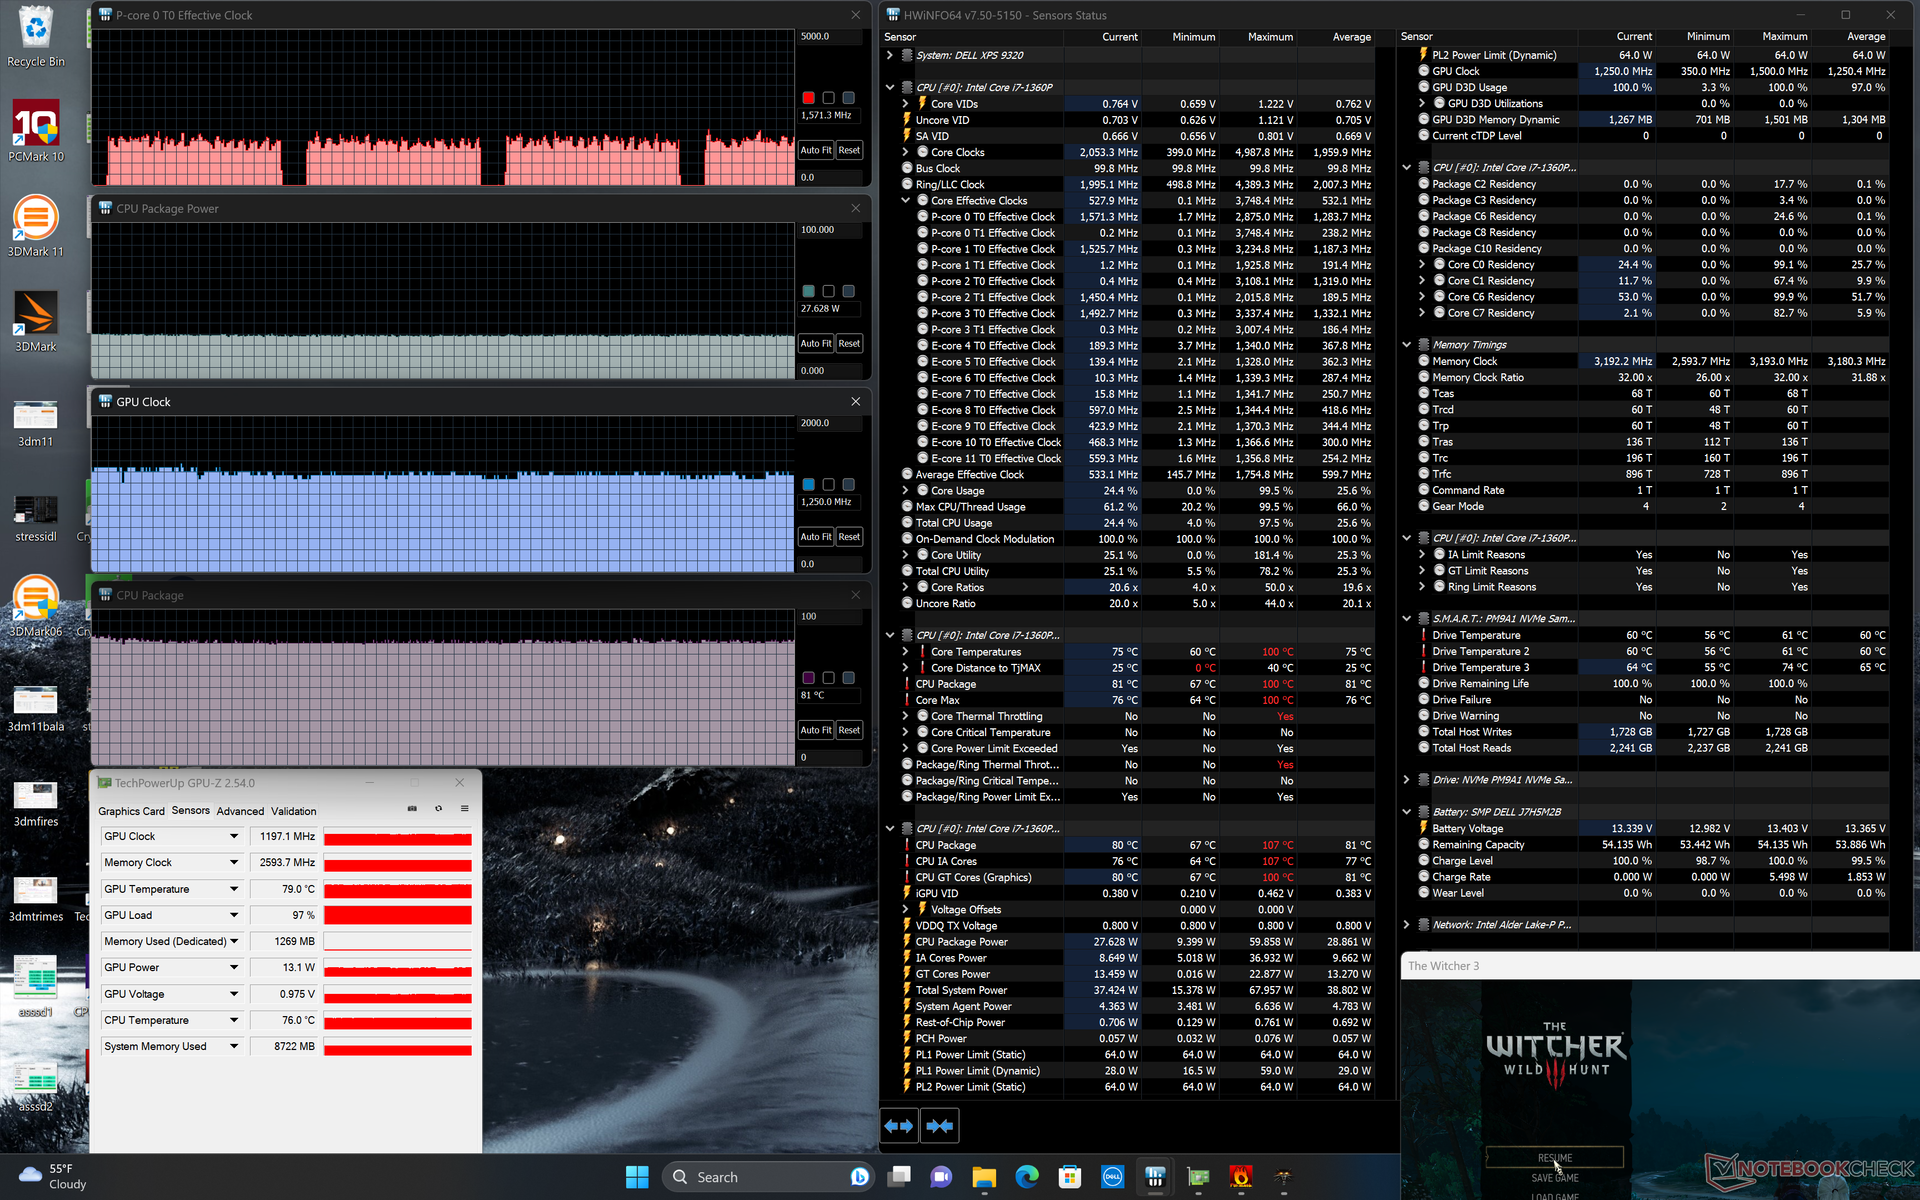
| Witcher 3 Stress | ~1.6 | 1250 | 81 |
Speakers

Dell XPS 13 Plus 9320 Core i7-1360P audio analysis
(±) | speaker loudness is average but good (77.7 dB)
Bass 100 - 315 Hz
(±) | reduced bass - on average 10.8% lower than median
(±) | linearity of bass is average (10.2% delta to prev. frequency)
Mids 400 - 2000 Hz
(+) | balanced mids - only 3.6% away from median
(+) | mids are linear (3.8% delta to prev. frequency)
Highs 2 - 16 kHz
(+) | balanced highs - only 3.6% away from median
(±) | linearity of highs is average (7.4% delta to prev. frequency)
Overall 100 - 16.000 Hz
(+) | overall sound is linear (13.2% difference to median)
Compared to same class
» 15% of all tested devices in this class were better, 4% similar, 81% worse
» The best had a delta of 5%, average was 19%, worst was 53%
Compared to all devices tested
» 9% of all tested devices were better, 2% similar, 88% worse
» The best had a delta of 4%, average was 26%, worst was 134%
Apple MacBook Pro 16 2021 M1 Pro audio analysis
(+) | speakers can play relatively loud (84.7 dB)
Bass 100 - 315 Hz
(+) | good bass - only 3.8% away from median
(+) | bass is linear (5.2% delta to prev. frequency)
Mids 400 - 2000 Hz
(+) | balanced mids - only 1.3% away from median
(+) | mids are linear (2.1% delta to prev. frequency)
Highs 2 - 16 kHz
(+) | balanced highs - only 1.9% away from median
(+) | highs are linear (2.7% delta to prev. frequency)
Overall 100 - 16.000 Hz
(+) | overall sound is linear (4.6% difference to median)
Compared to same class
» 0% of all tested devices in this class were better, 0% similar, 100% worse
» The best had a delta of 5%, average was 18%, worst was 45%
Compared to all devices tested
» 0% of all tested devices were better, 0% similar, 100% worse
» The best had a delta of 4%, average was 26%, worst was 134%
Energy Management
Power Consumption
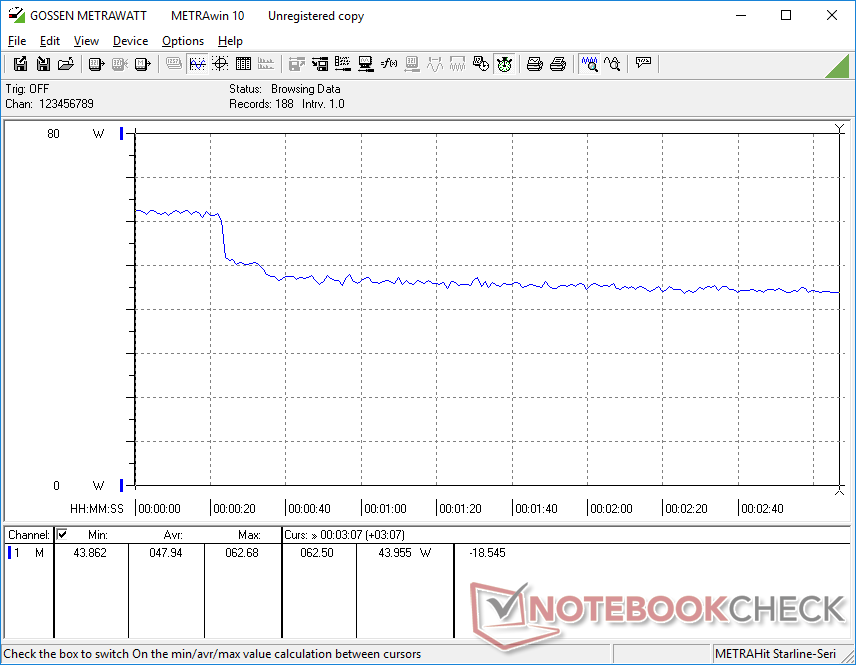
Idling on desktop can draw between 6 W and 14 W which is a wider range than on most other subnotebooks due to the more demanding OLED display. As detailed in our article here, certain colors will demand more power on an OLED panel whereas power consumption is independent of color on IPS.
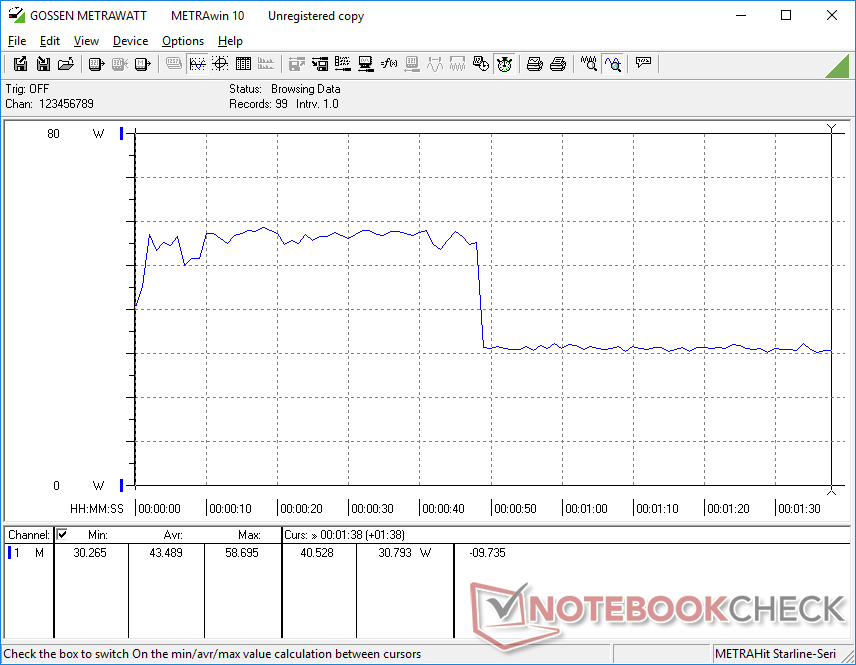
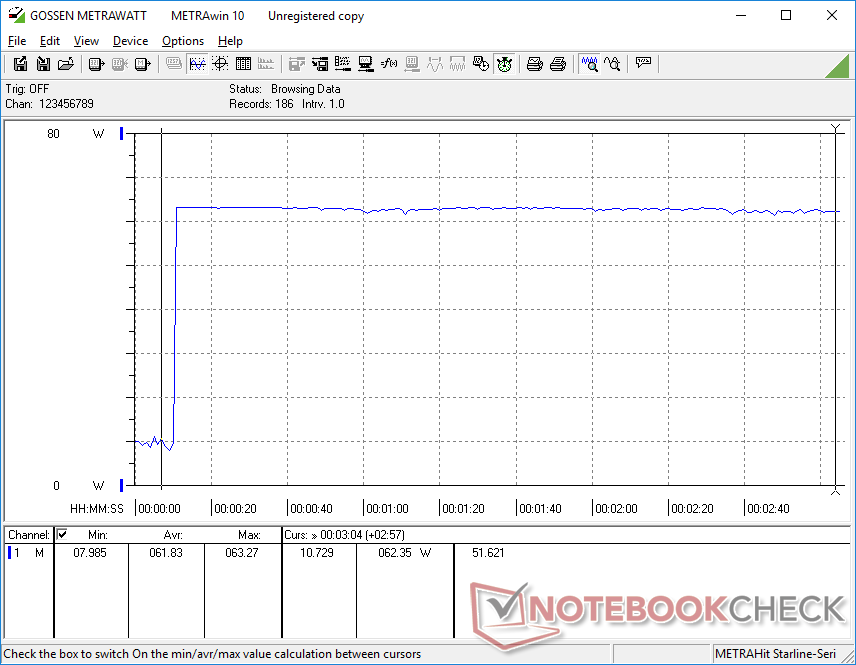
Overall power consumption is otherwise similar to last year's model despite the newer generation CPU. Running Prime95, for example, would demand about 63 W from each system meaning the performance-per-watt benefits of the 13th gen Core i7-1360P are not any better than on the 12th gen Core i7-1280P.
| Off / Standby | |
| Idle | |
| Load |
|
| Dell XPS 13 Plus 9320 Core i7-1360P i7-1360P, Iris Xe G7 96EUs, Samsung PM9A1 MZVL2512HCJQ, OLED, 3456x2160, 13.40 | Dell XPS 13 Plus 9320 i7-1280P OLED i7-1280P, Iris Xe G7 96EUs, WDC PC SN810 512GB, OLED, 3456x2160, 13.40 | Dell XPS 13 7390 Core i7-10710U i7-10710U, UHD Graphics 620, SK Hynix PC601 NVMe 512 GB, IPS, 3840x2160, 13.30 | Framework Laptop 13.5 13th Gen Intel i7-1370P, Iris Xe G7 96EUs, WD PC SN740 SDDPNQD-1T00, IPS, 2256x1504, 13.50 | Lenovo ThinkPad X13 Yoga G3 21AW003UGE i7-1265U, Iris Xe G7 96EUs, Samsung PM9A1 MZVL2512HCJQ, IPS LED, 2560x1600, 13.30 | HP Spectre x360 13.5 14t-ef000 i7-1255U, Iris Xe G7 96EUs, Micron 3400 1TB MTFDKBA1T0TFH, OLED, 3000x2000, 13.50 | |
|---|---|---|---|---|---|---|
| Power Consumption | -5% | 16% | 10% | 7% | 16% | |
| Idle Minimum * | 6.9 | 6.5 6% | 4.7 32% | 2.9 58% | 4.6 33% | 4 42% |
| Idle Average * | 7.4 | 7.8 -5% | 8.3 -12% | 6.3 15% | 7.9 -7% | 4.9 34% |
| Idle Maximum * | 13.6 | 13 4% | 9 34% | 9.9 27% | 8.9 35% | 12.5 8% |
| Load Average * | 43.5 | 56.6 -30% | 42 3% | 56.2 -29% | 56.1 -29% | 48.1 -11% |
| Witcher 3 ultra * | 48 | 49.2 -3% | 56.6 -18% | 40.4 16% | 35.8 25% | |
| Load Maximum * | 63.3 | 63 -0% | 49 23% | 60.8 4% | 66.1 -4% | 65.2 -3% |
* ... smaller is better
Power Consumption Witcher 3 / Stresstest
Power Consumption external Monitor
Battery Life
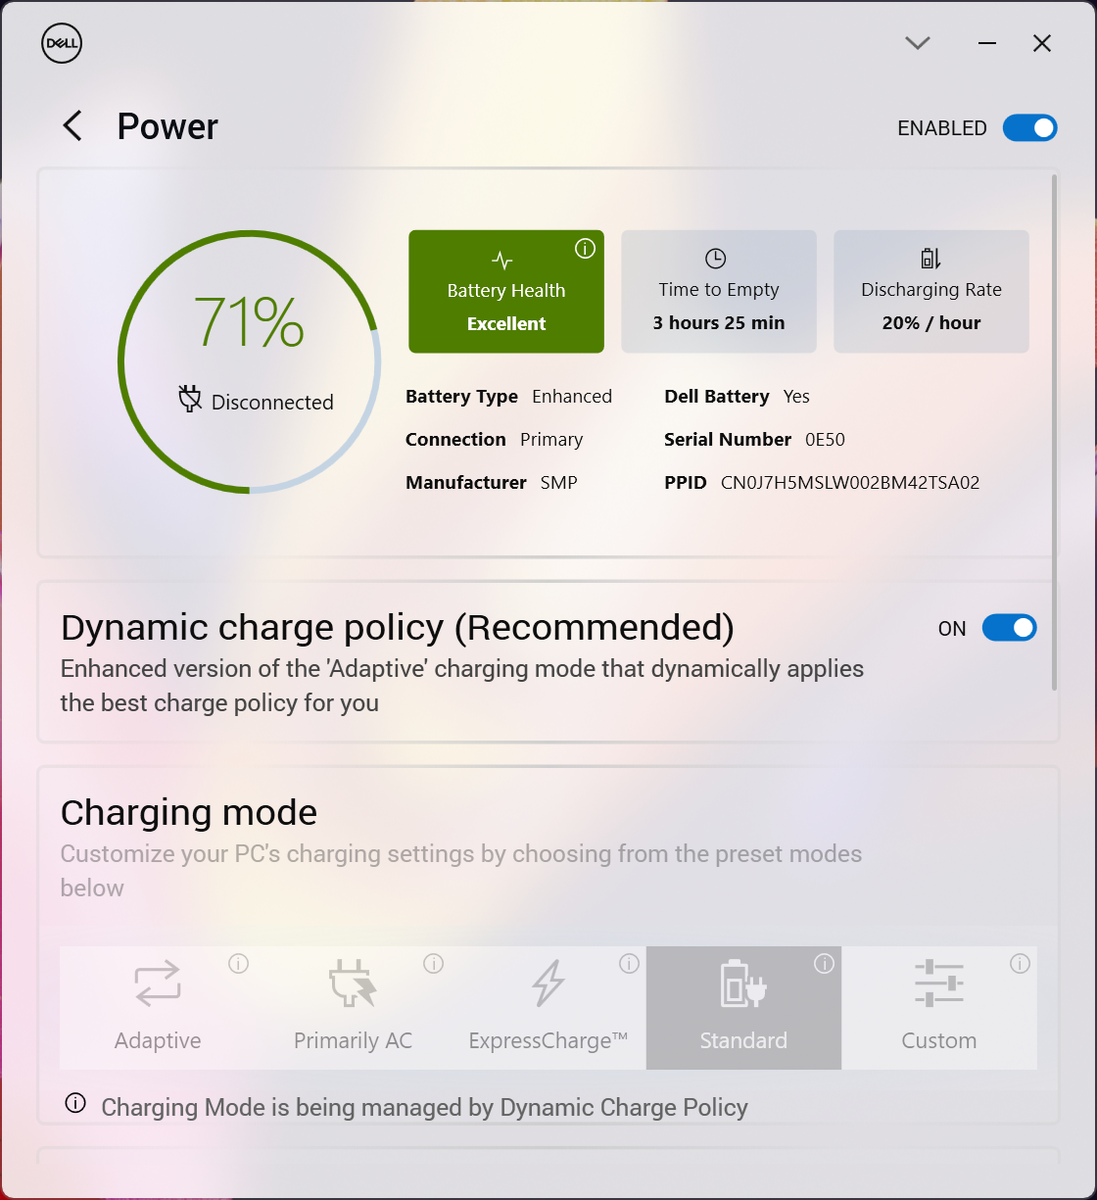
Runtimes are nearly identical to last year's Core i7-1260P configuration at about 7.5 hours of real-world browsing usage.
Charging from empty to full capacity with the included adapter takes a little over 2 hours.
| Dell XPS 13 Plus 9320 Core i7-1360P i7-1360P, Iris Xe G7 96EUs, 55 Wh | Dell XPS 13 Plus 9320 i7-1280P OLED i7-1280P, Iris Xe G7 96EUs, 55 Wh | Dell XPS 13 7390 Core i7-10710U i7-10710U, UHD Graphics 620, 52 Wh | Framework Laptop 13.5 13th Gen Intel i7-1370P, Iris Xe G7 96EUs, 61 Wh | Lenovo ThinkPad X13 Yoga G3 21AW003UGE i7-1265U, Iris Xe G7 96EUs, 52.8 Wh | HP Spectre x360 13.5 14t-ef000 i7-1255U, Iris Xe G7 96EUs, 66 Wh | |
|---|---|---|---|---|---|---|
| Battery Runtime | -21% | 15% | 21% | 12% | 10% | |
| WiFi v1.3 | 436 | 346 -21% | 501 15% | 527 21% | 487 12% | 481 10% |
| Load | 115 | 133 | ||||
| Reader / Idle | 1223 |
Pros
Cons
Verdict — Skip The 2023 Version And Just Get The 2022 Version
The XPS 13 Plus design was introduced just last year and so this year's refresh is expectedly minor. It would be unrealistic to assume any dramatic updates to the chassis or internals at this point in time, but the 2023 refresh is unfortunately forgettable considering that it barely offers any advantages in terms of processor performance or performance-per-watt over the previous year. Furthermore, other aspects seem inconsistent such as frame skips during video playback and the throttling SSD. All the main advantages and disadvantages of the original XPS 13 Plus 9320 still apply to the 2023 version.
The 13th Core i7-1360P feels like a rebrand of the 12th gen Core i7-1280P. Interested buyers may want to consider the original 2022 XPS 13 Plus 9320 instead of the newer 2023 version as a result.
If you're in the market for the XPS 13 Plus 9320, then we recommend the original 2022 model as it is less expensive with essentially the same performance as the 2023 iteration. Buyers can instead invest the saved dollars on more tangible features like more RAM, more storage, or a higher resolution display.
Price and Availability
Dell is now shipping the XPS 13 Plus 9320 starting at $1150 USD for the base FHD configuration configuration up to $1750 for the 4K UHD configuration.
Dell XPS 13 Plus 9320 Core i7-1360P
-
07/16/2023 v7
Allen Ngo
More articles related to this device
Dell XPS 13 Plus 9320 Core i7-1360P (XPS 13 Series)Related Articles


Transparency
The present review sample was made available to the author as a loan by the manufacturer or a shop for the purposes of review. The lender had no influence on this review, nor did the manufacturer receive a copy of this review before publication. There was no obligation to publish this review.
Pricecompare
