 Deutsch
 English
 Español
 Français
 Italiano
 Nederlands
 Polski
 Português
 Русский
 Türkçe
 Svenska
 Chinese
 Magyar
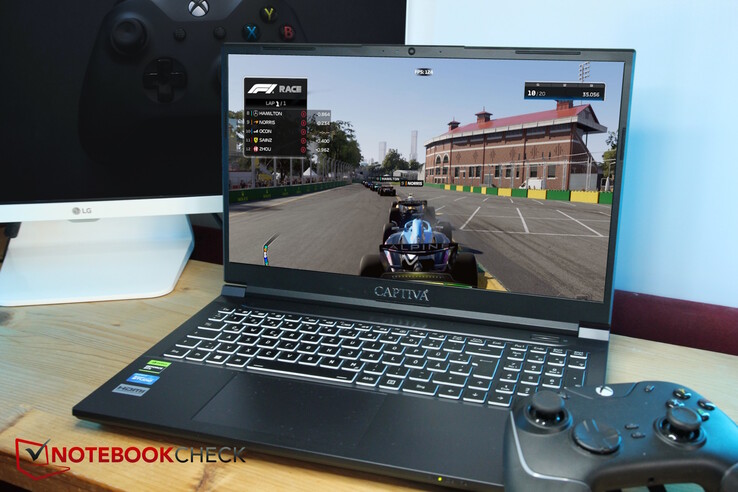
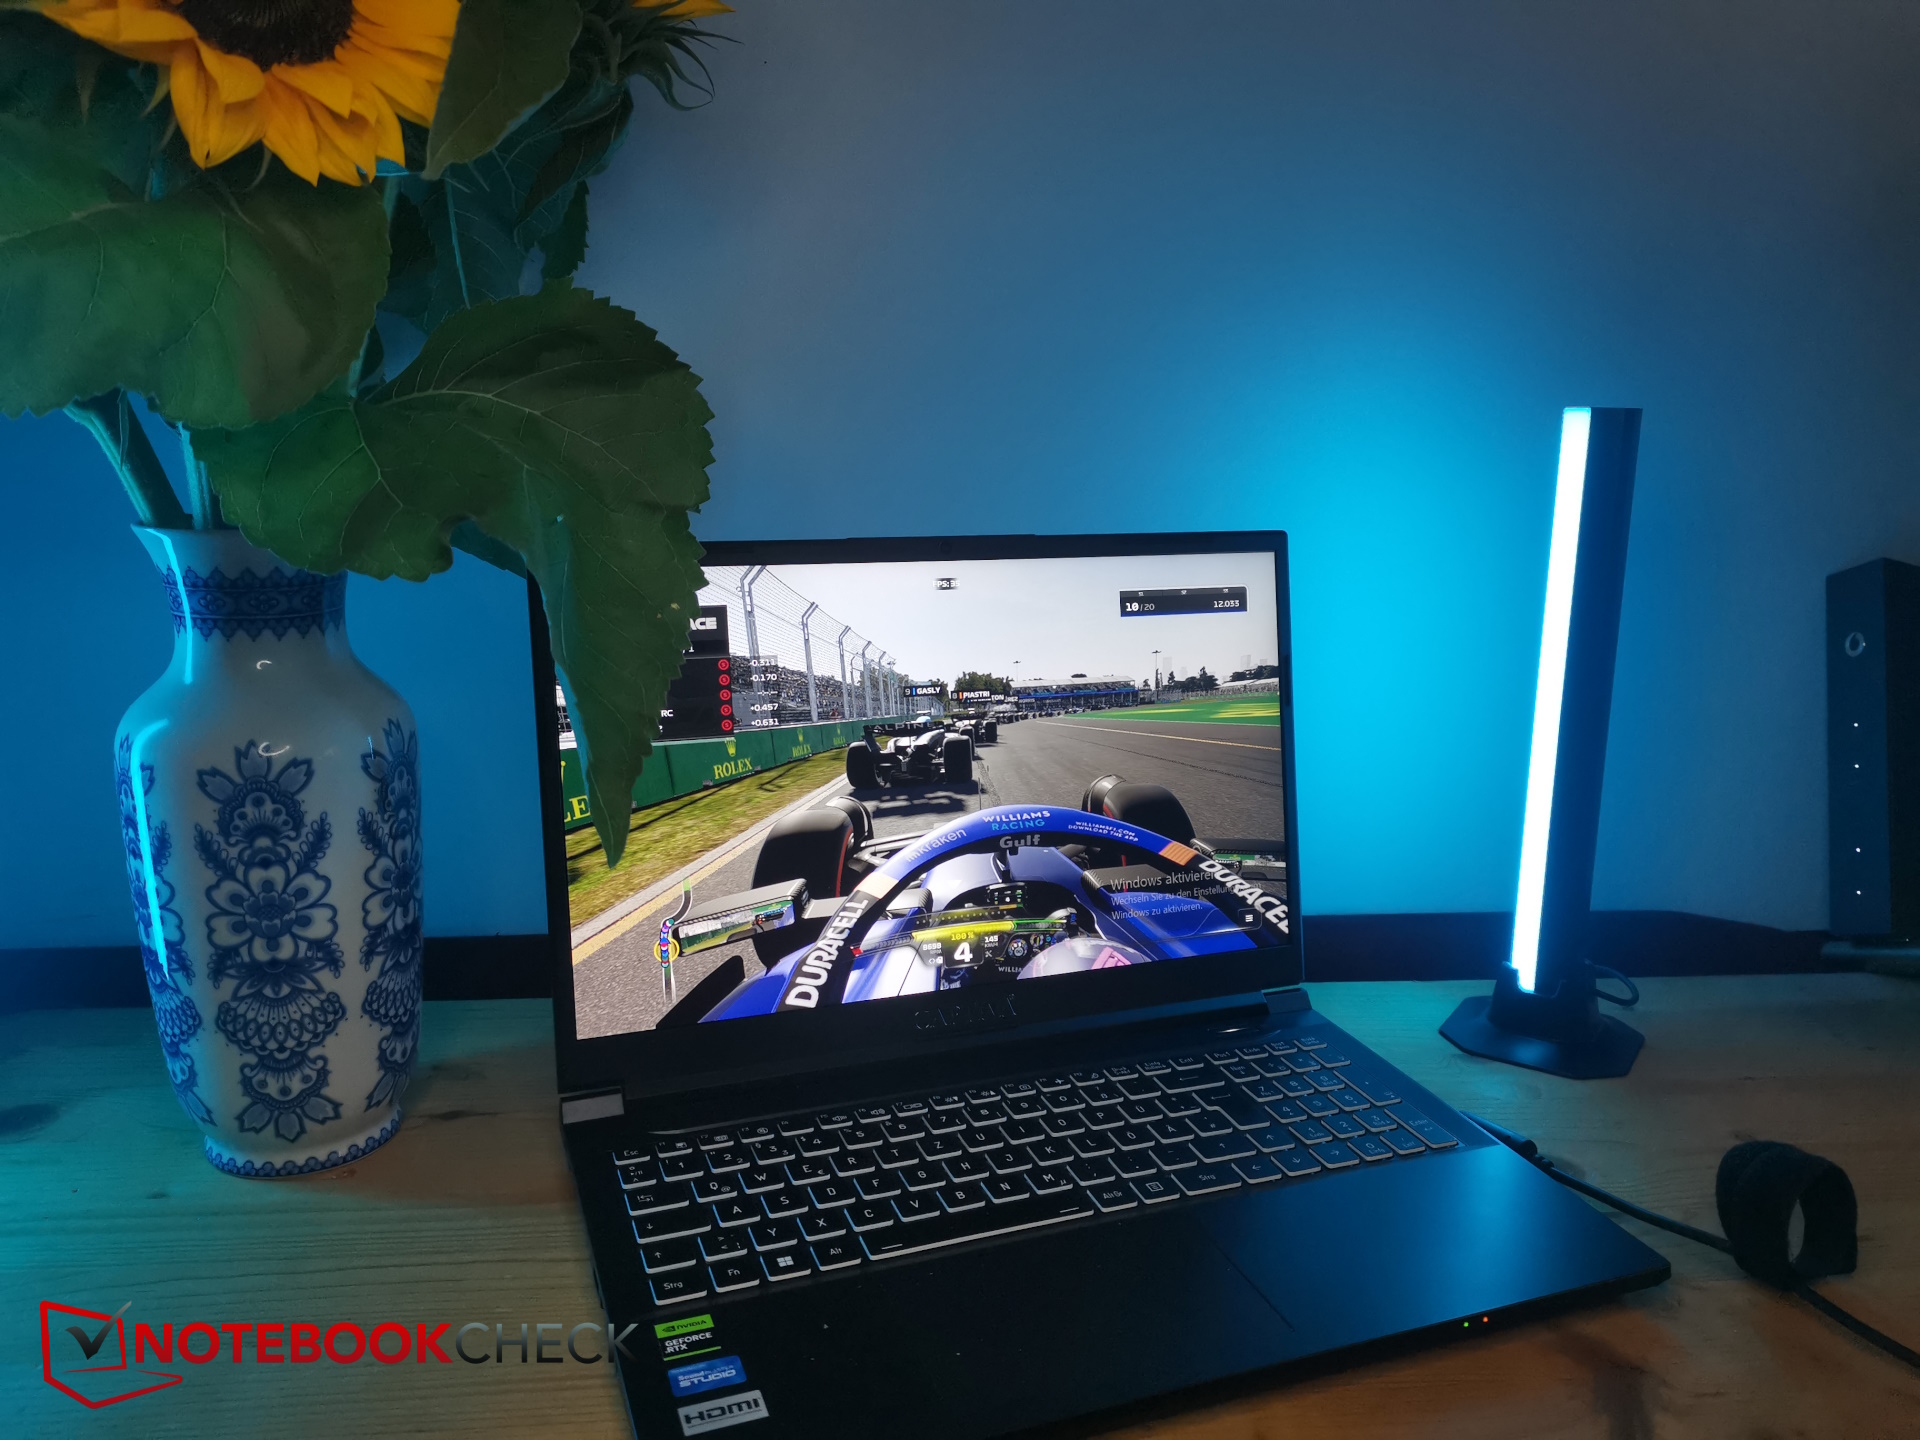
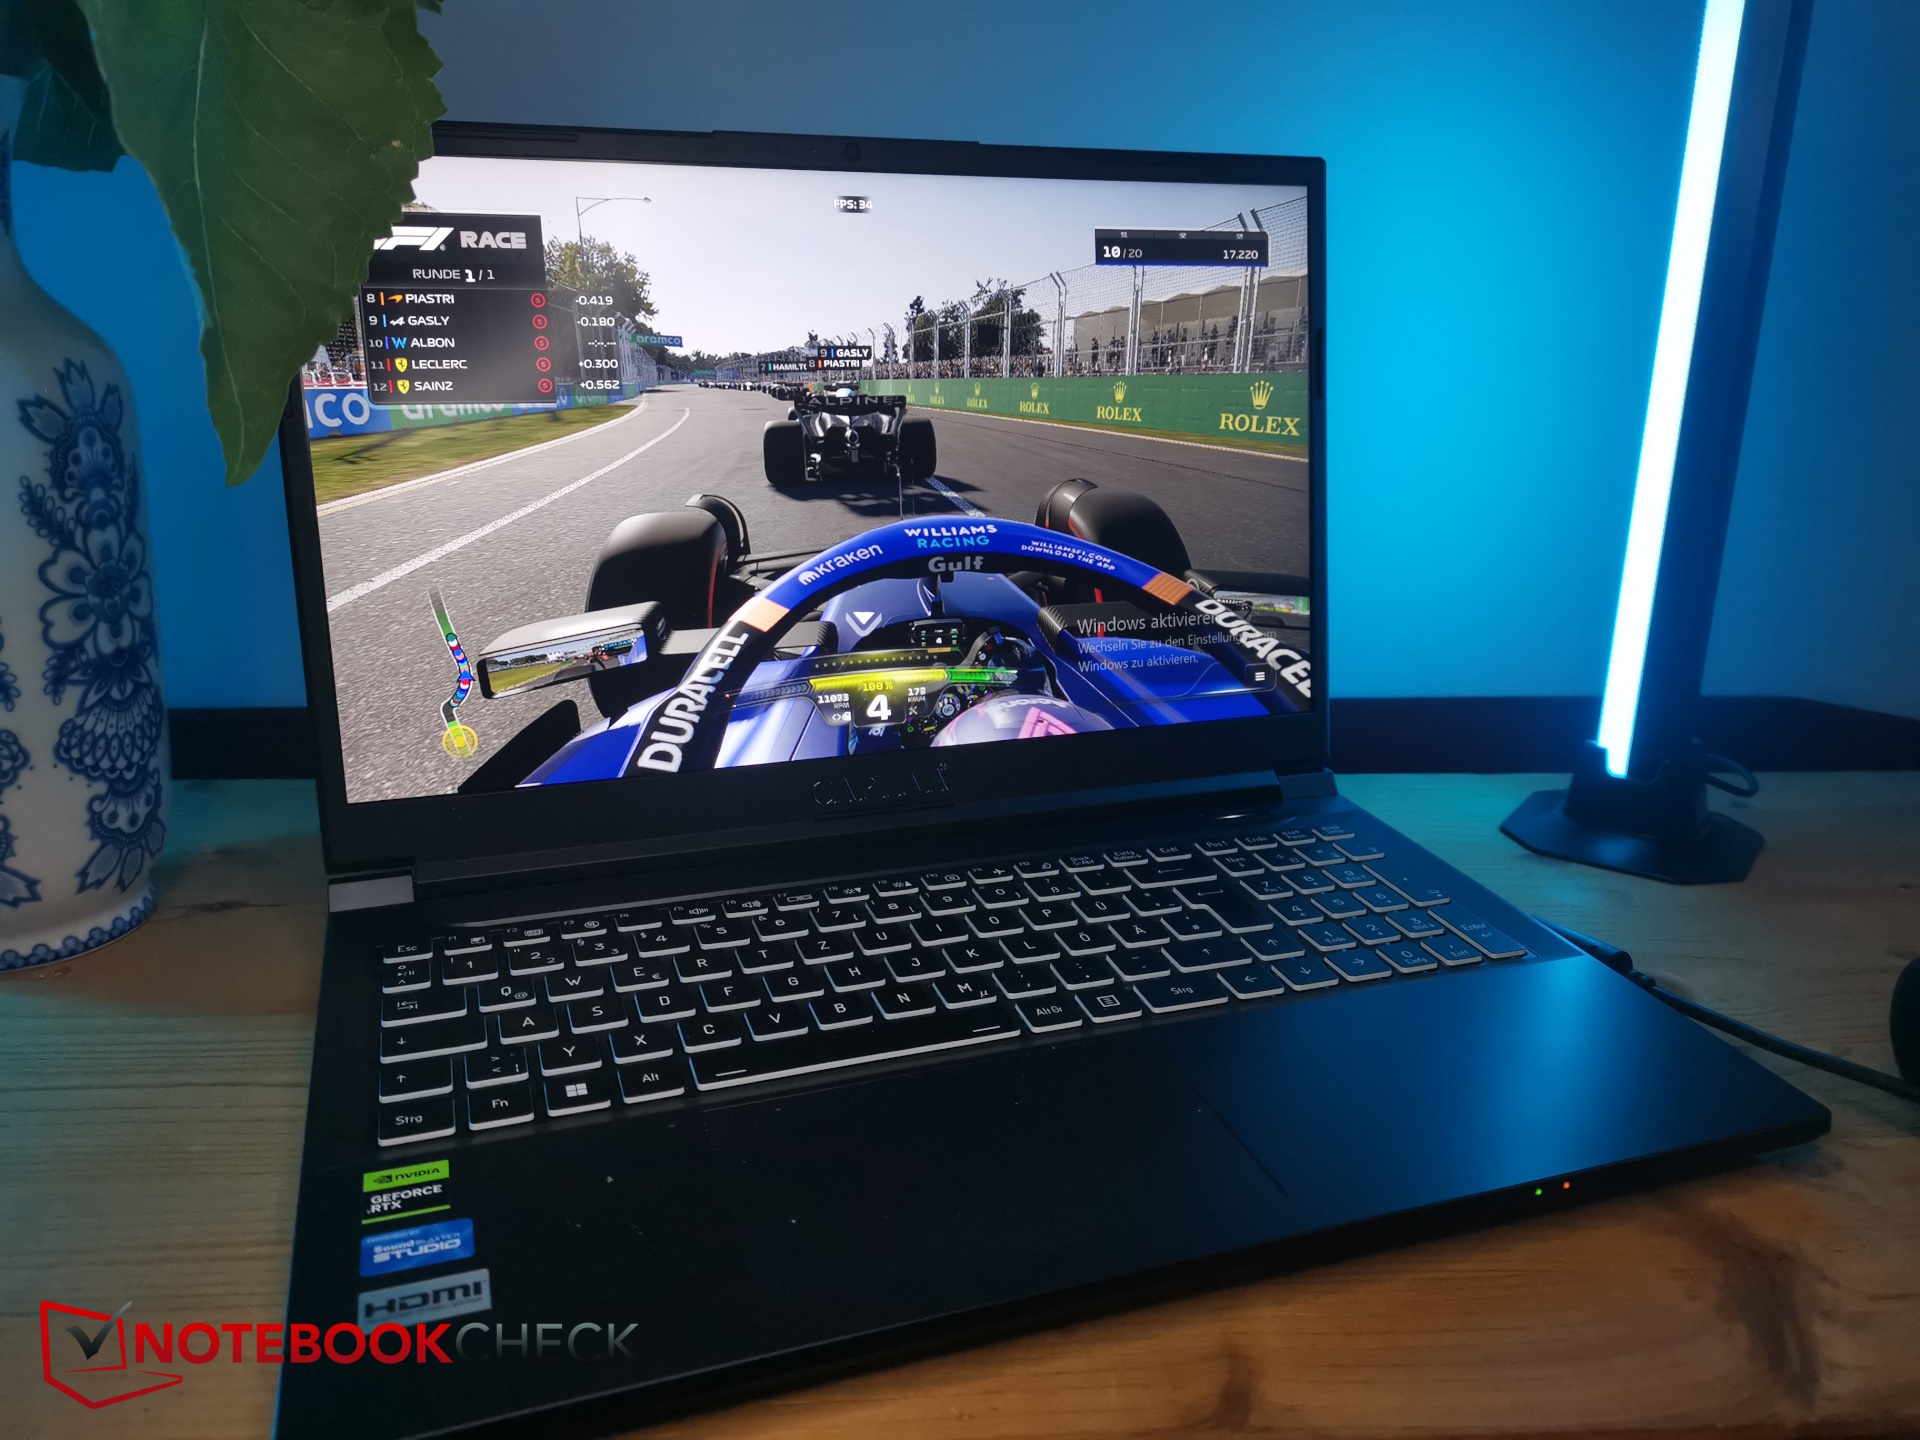
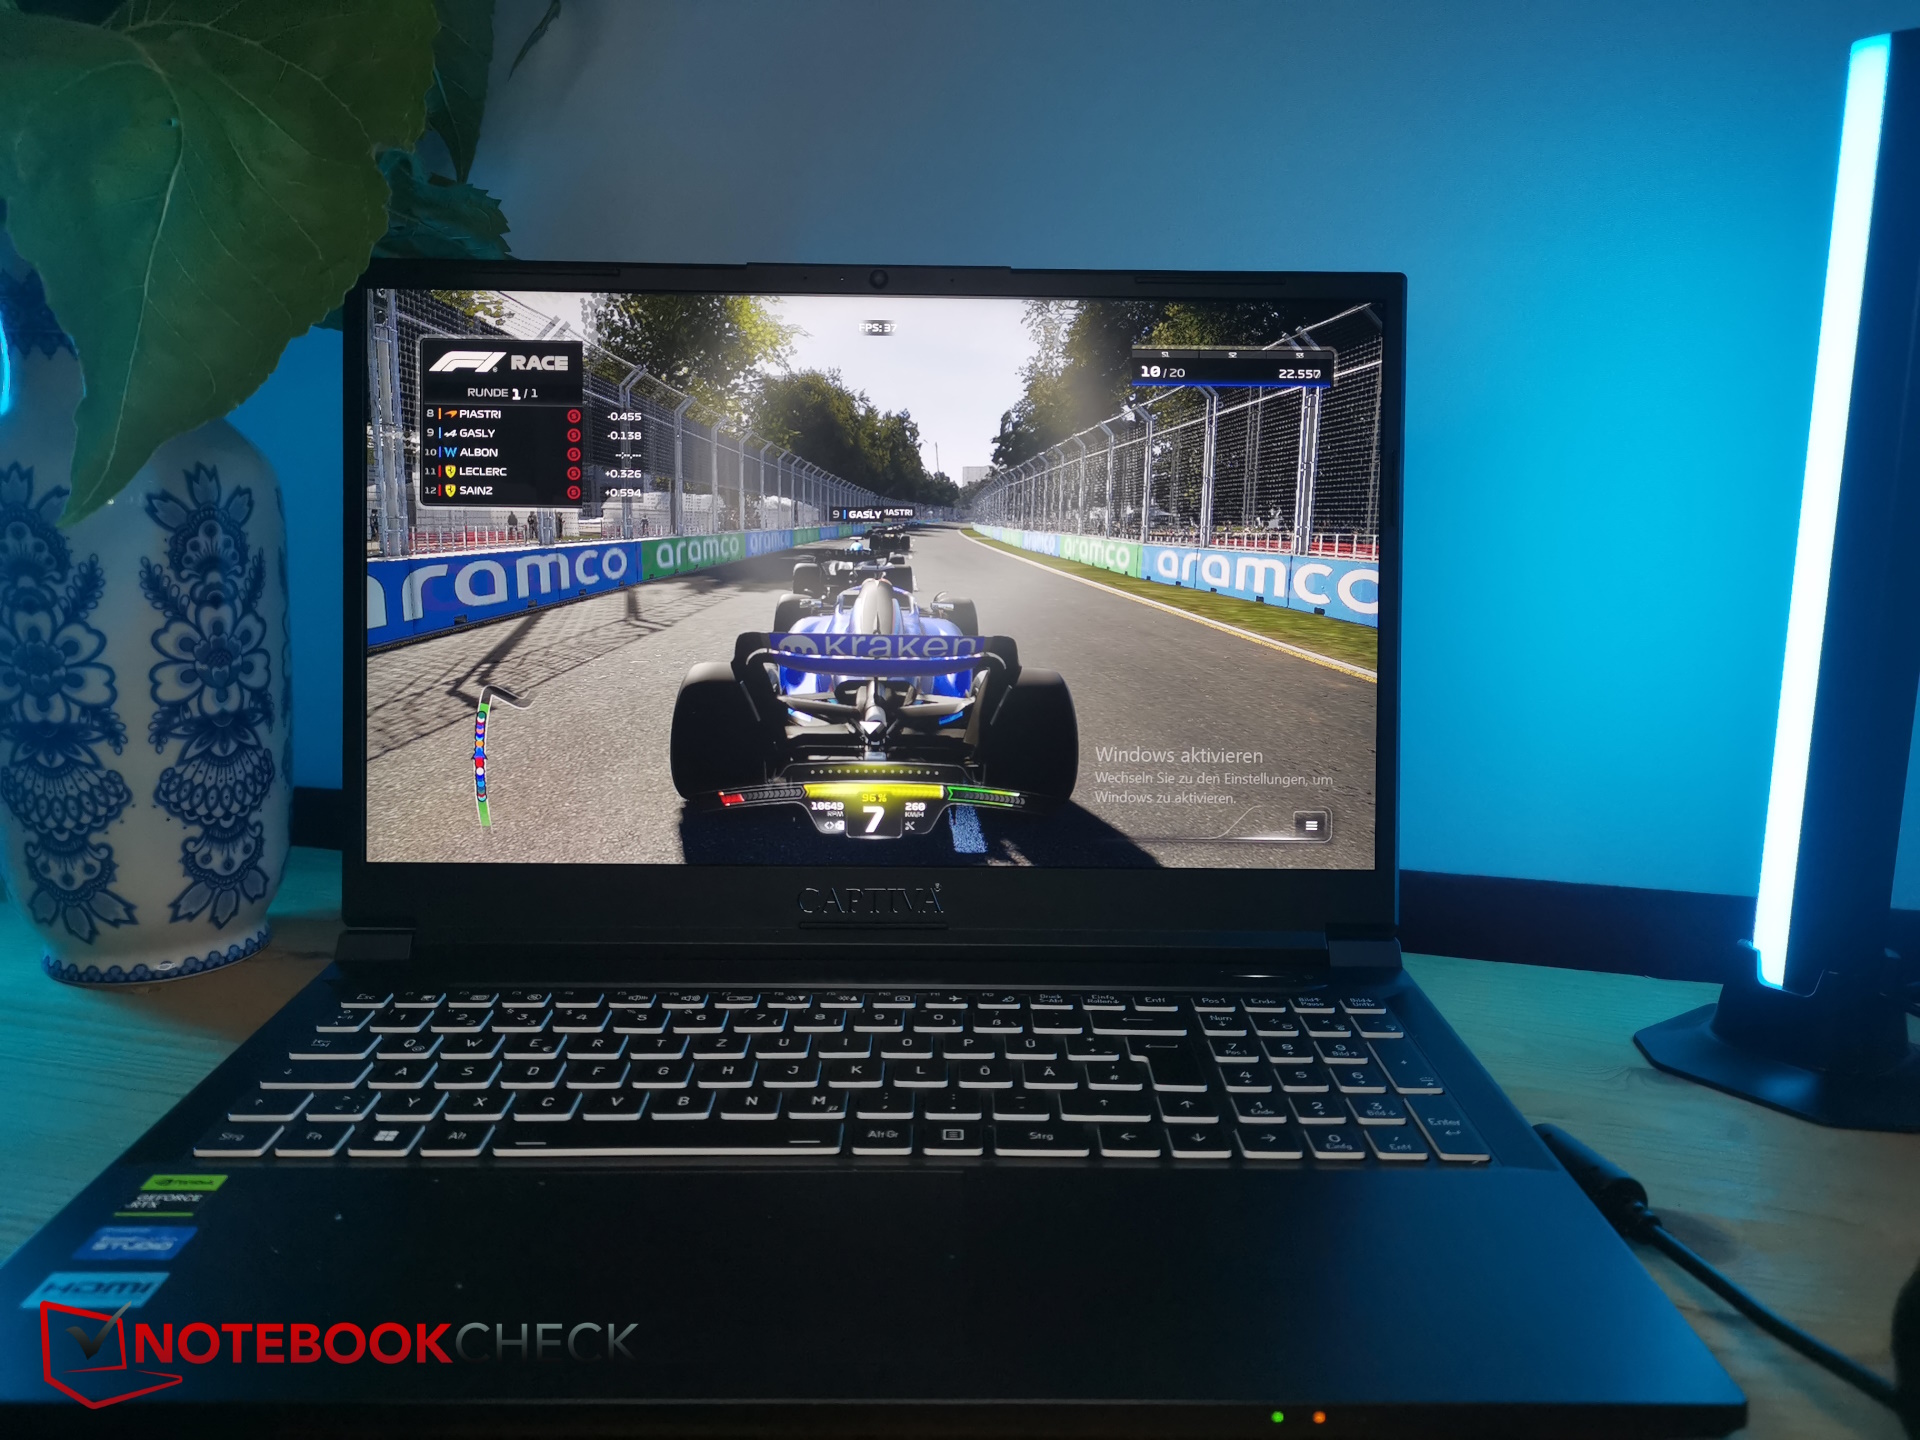
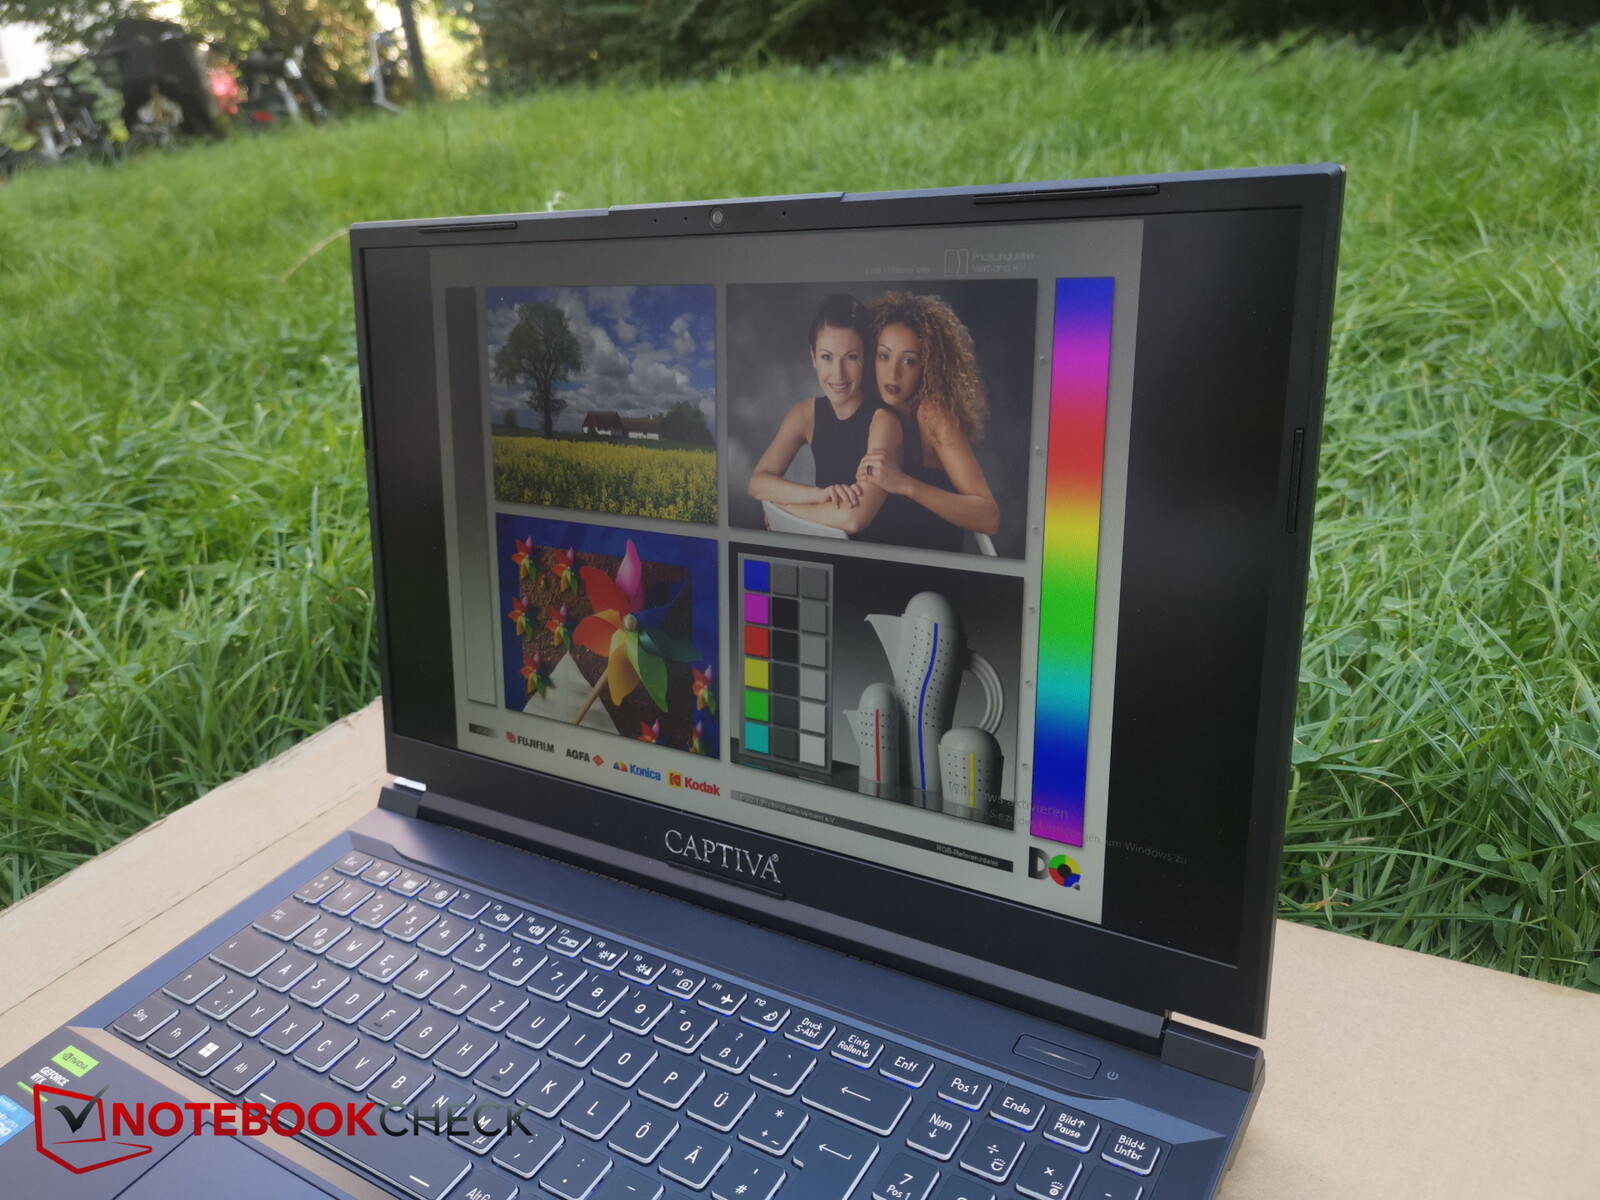
Captiva Advanced Gaming I74-121 (Clevo V150RND) review: An inexpensive gaming laptop with a powerful RTX 4060
On a select few online shops you can begin to see (gaming) laptops from Captiva, but who is this manufacturer? Captiva is a subsidiary company of Ecom Trading GmbH, a German IT wholesaler based in Dachau. By the sounds of it, most of their laptops are manufactured in China. As we have never previously tested laptops from Captiva, it is high time we did so!
You can find 17-inch and 15-inch versions of the Captiva laptop which mainly differ in hardware setup. Only the 17-inch ones optionally come with an i9-13900HX - the 15-inch devices only come with an i5-13500H installed. In addition, our test sample is fitted with an RTX 4060. Alternatively, you can get the laptop with an RTX 4070 and the 17-inch version can also be had with an RTX 4080.
Our configuration retails for around US$1,800. Competitors include other introductory gaming laptops like the MSI Cyborg 15, Dell G15 5530, Lenovo Legion Slim 5 16APH8, Lenovo LOQ 15 and the Schenker XMG Core 15 M22.
Possible competitors compared
Rating | Date | Model | Weight | Height | Size | Resolution | Best Price |
|---|---|---|---|---|---|---|---|
| 85.7 % | 09/2023 | Captiva Advanced Gaming I74-121 i5-13500H, NVIDIA GeForce RTX 4060 Laptop GPU | 2.3 kg | 29 mm | 15.60" | 1920x1080 | |
| 82.4 % | 04/2023 | MSI Cyborg 15 A12VF i7-12650H, NVIDIA GeForce RTX 4060 Laptop GPU | 2 kg | 22.9 mm | 15.60" | 1920x1080 | |
| 84.2 % | 06/2023 | Dell G15 5530 i7-13650HX, NVIDIA GeForce RTX 4060 Laptop GPU | 3 kg | 26.95 mm | 15.60" | 1920x1080 | |
| 87.7 % | 08/2023 | Lenovo Legion Slim 5 16APH8 R7 7840HS, NVIDIA GeForce RTX 4060 Laptop GPU | 2.4 kg | 25.2 mm | 16.00" | 2560x1600 | |
| 85.7 % | 07/2023 | Lenovo LOQ 15APH8 R7 7840HS, NVIDIA GeForce RTX 4050 Laptop GPU | 2.5 kg | 25.2 mm | 15.60" | 1920x1080 | |
| 87.9 % | 01/2023 | SCHENKER XMG Core 15 (M22) R7 6800H, GeForce RTX 3060 Laptop GPU | 2.1 kg | 23 mm | 15.60" | 2560x1440 |
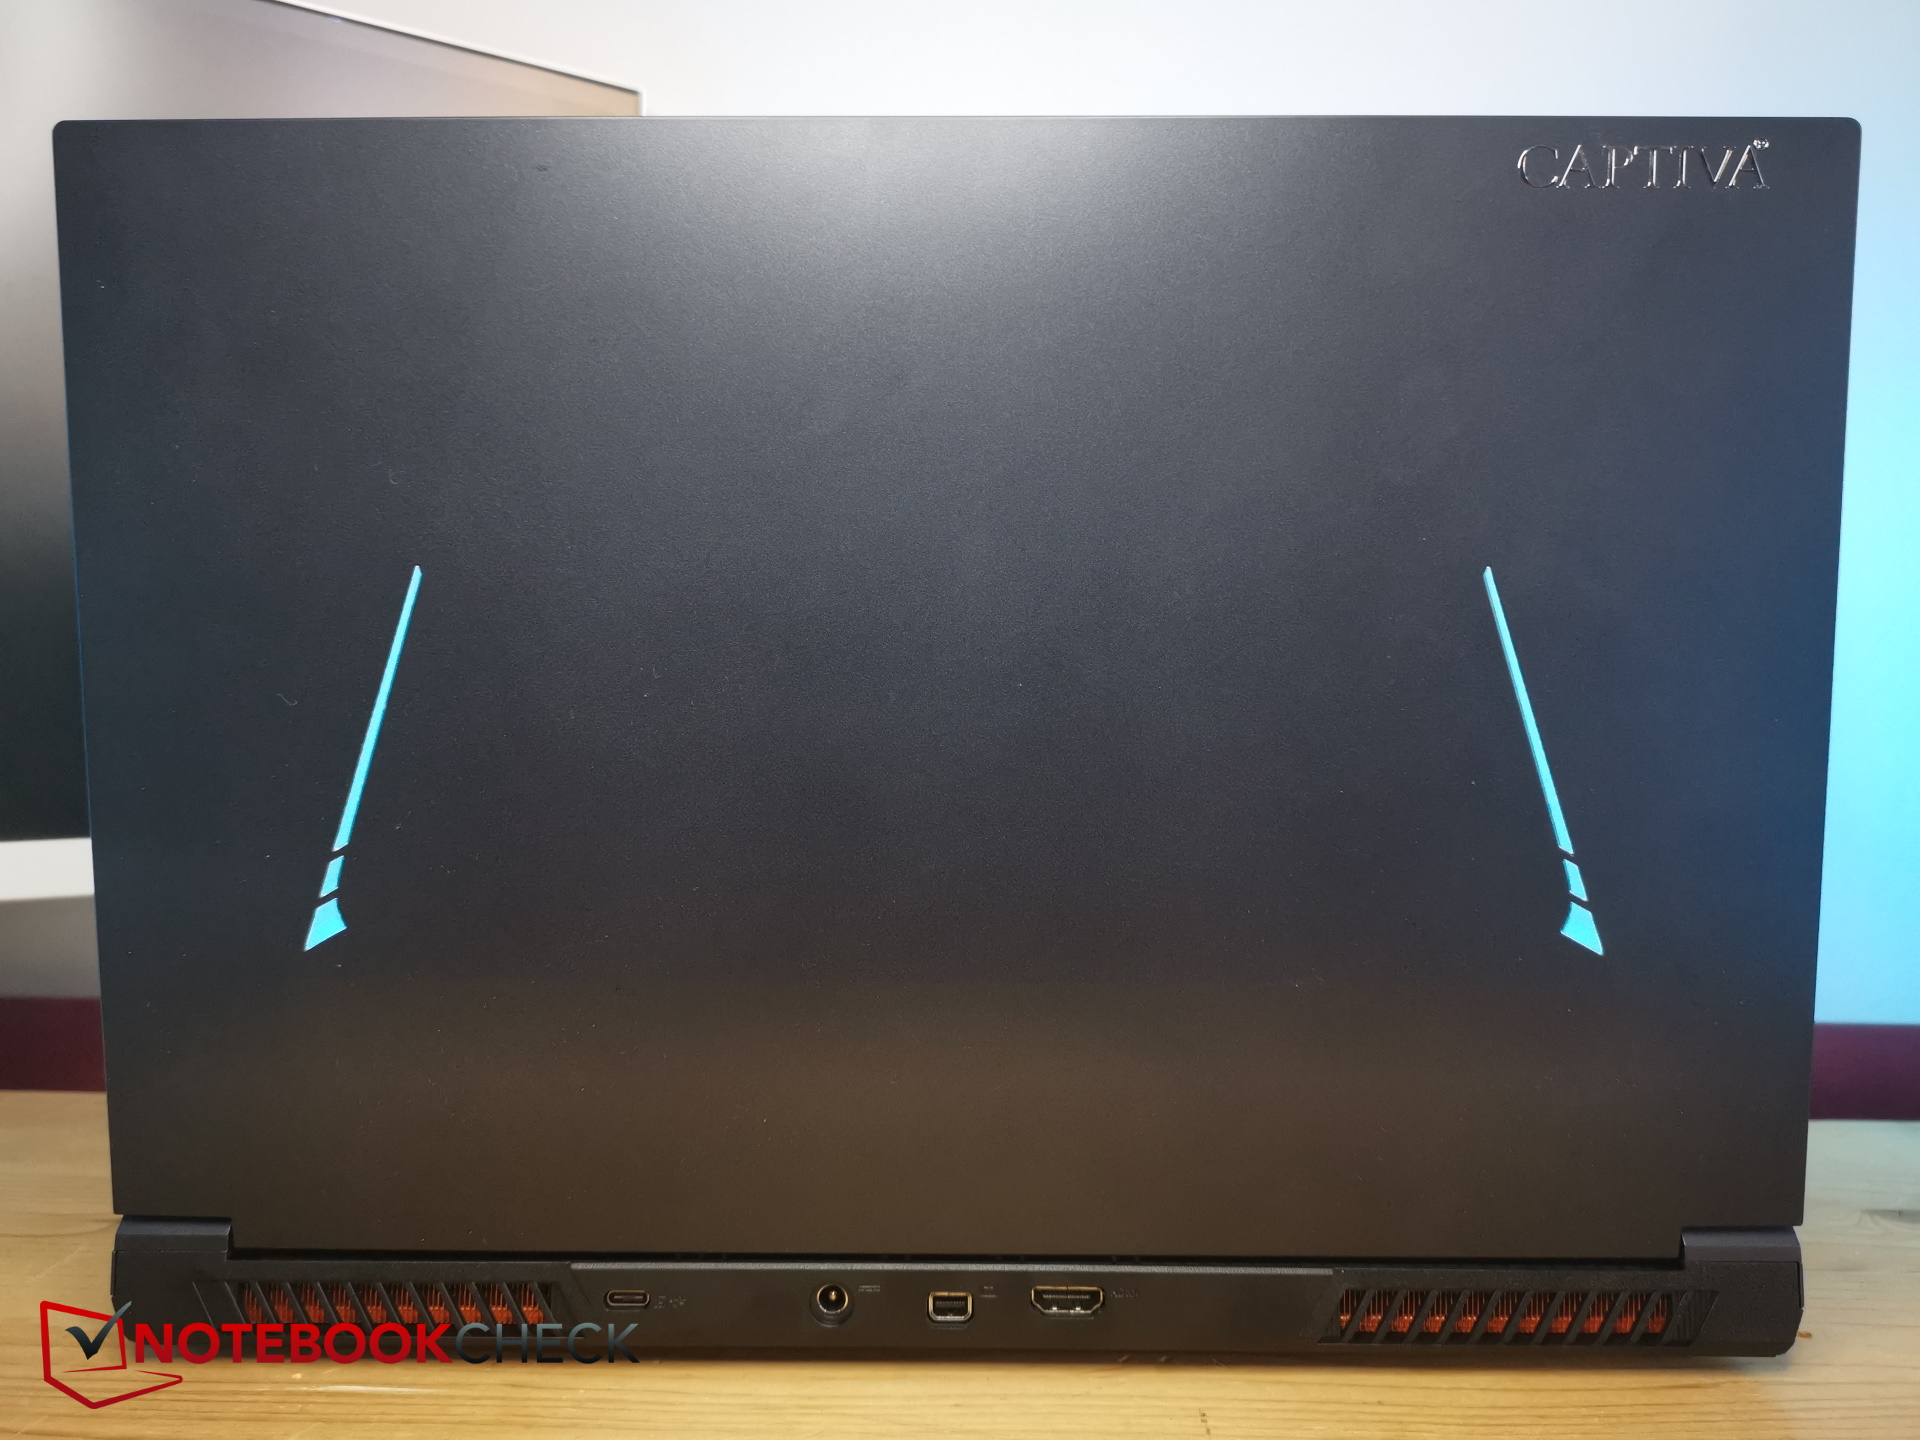
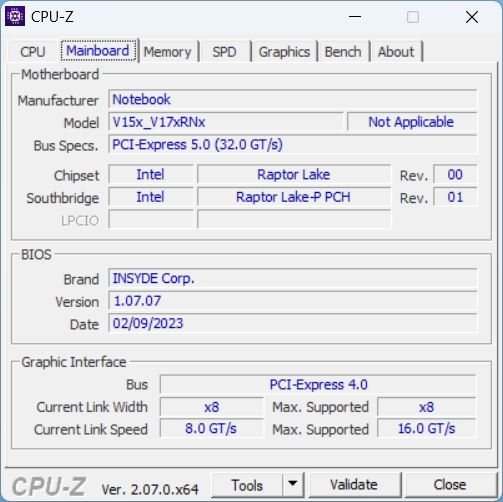
Case - The Captiva barebone is a secret (Clevo)
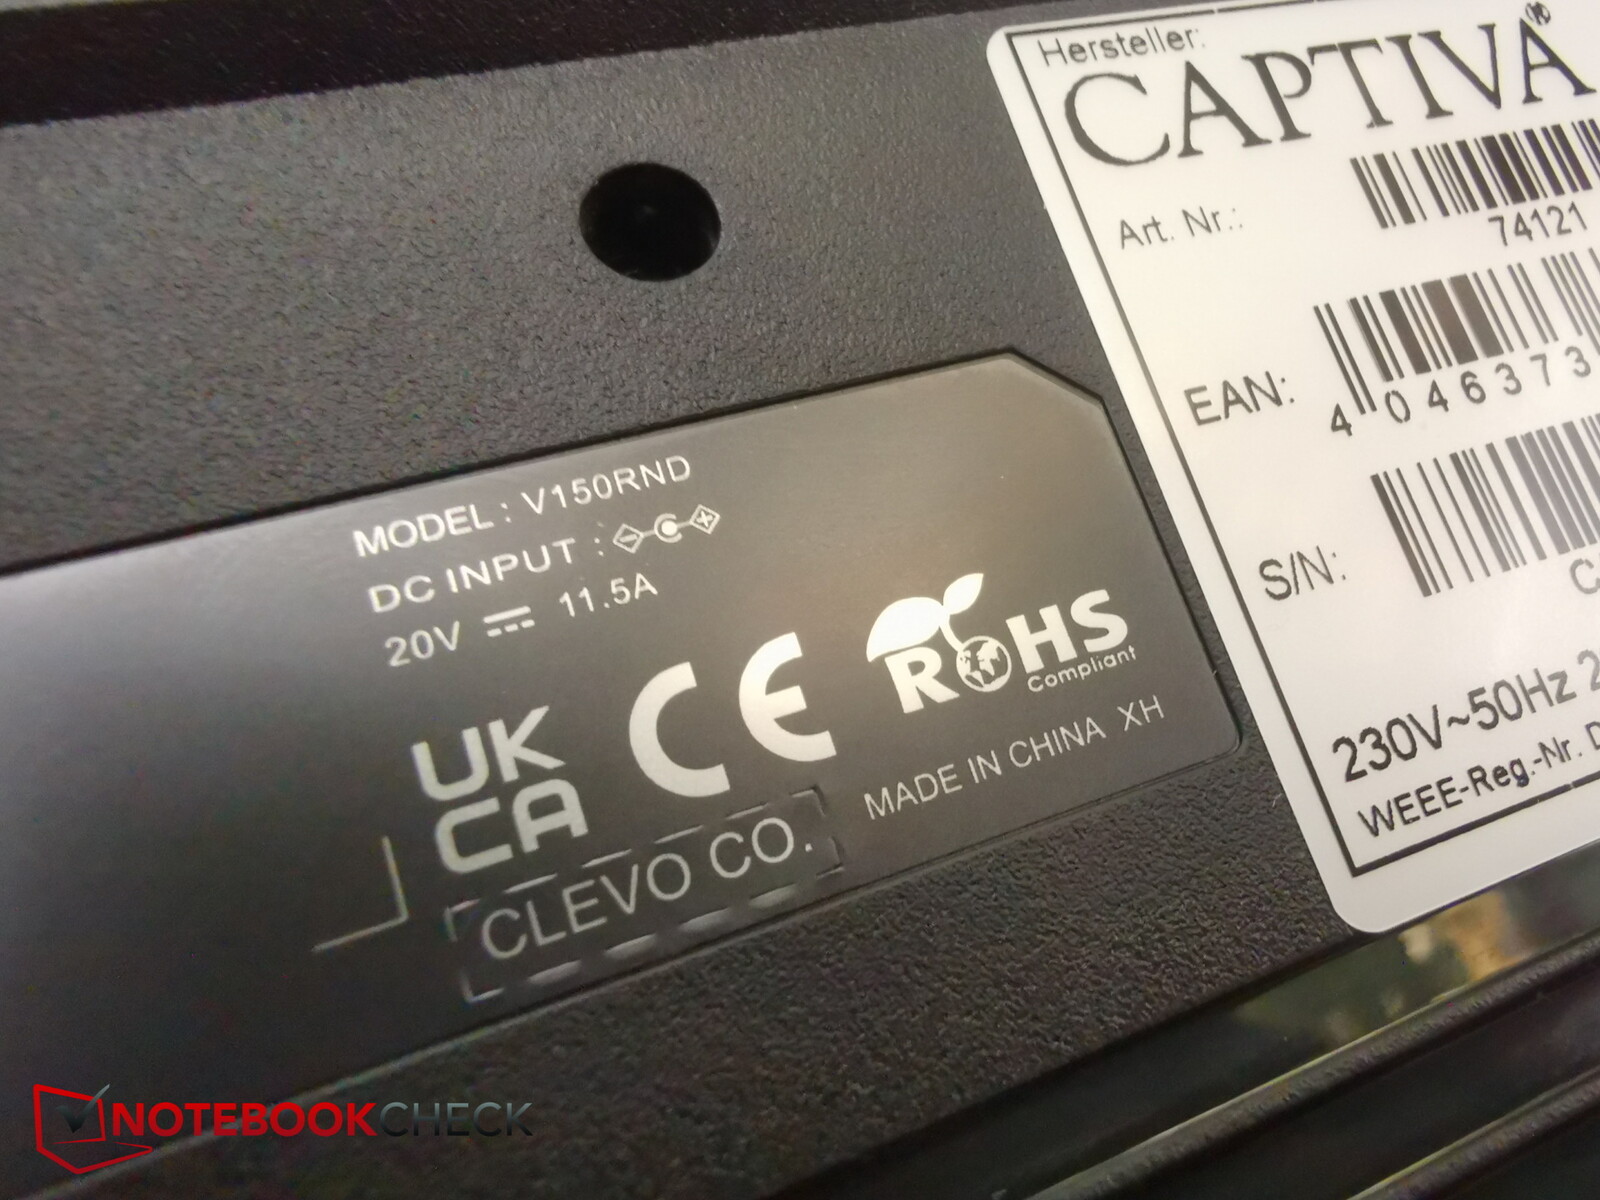
When asked, Captiva refused to tell us which barebone is used - apparently they are made "especially for Captiva". However, a sticker on the bottom reveals to us that the manufacturer Clevo is involved. It is unclear to us why Captiva is withholding this information. We identified the Clevo barebone as being the Clevo V150RND.
The inner case of the laptop is reminiscent of the Gigabyte G5 when it is folded open. Its keyboard is slightly recessed and the layout is similar, too - although, it doesn't seem to be the exact same one.
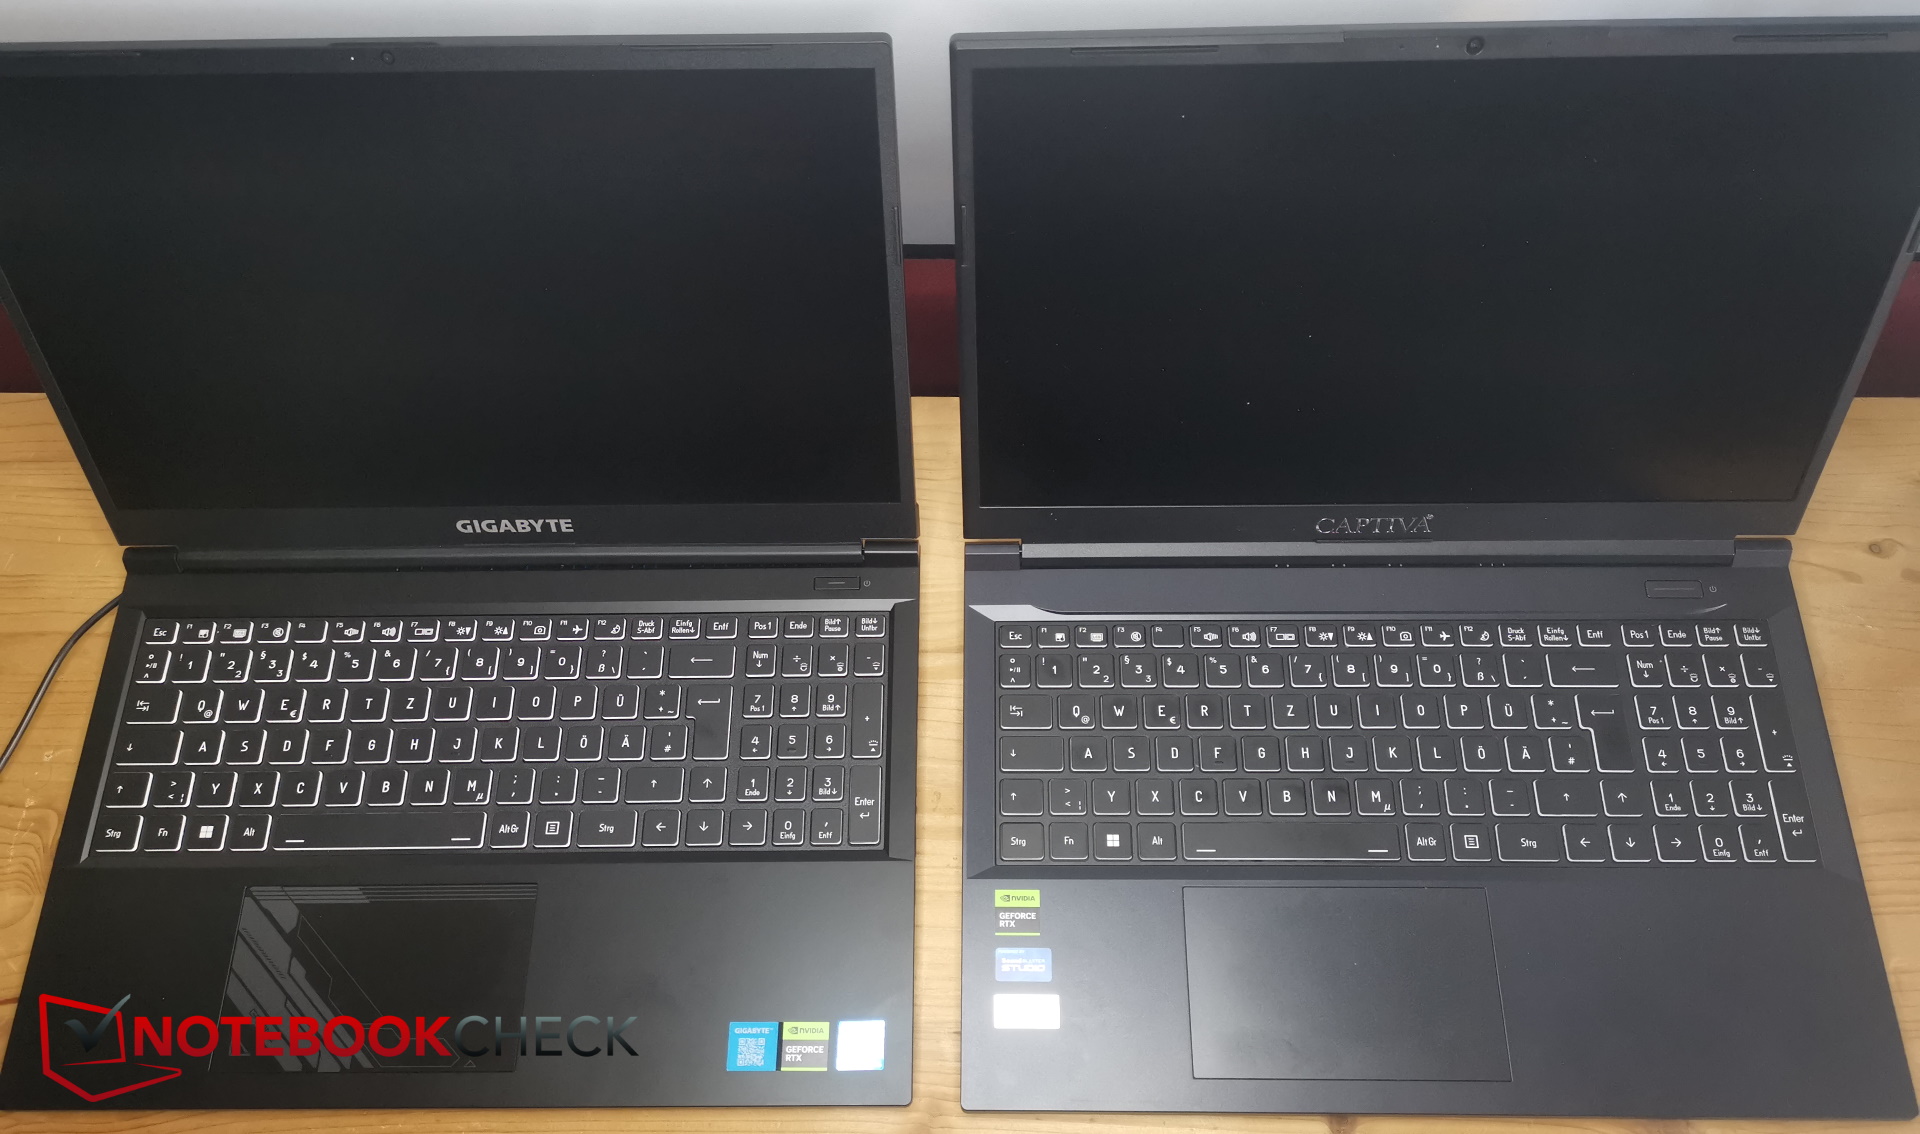
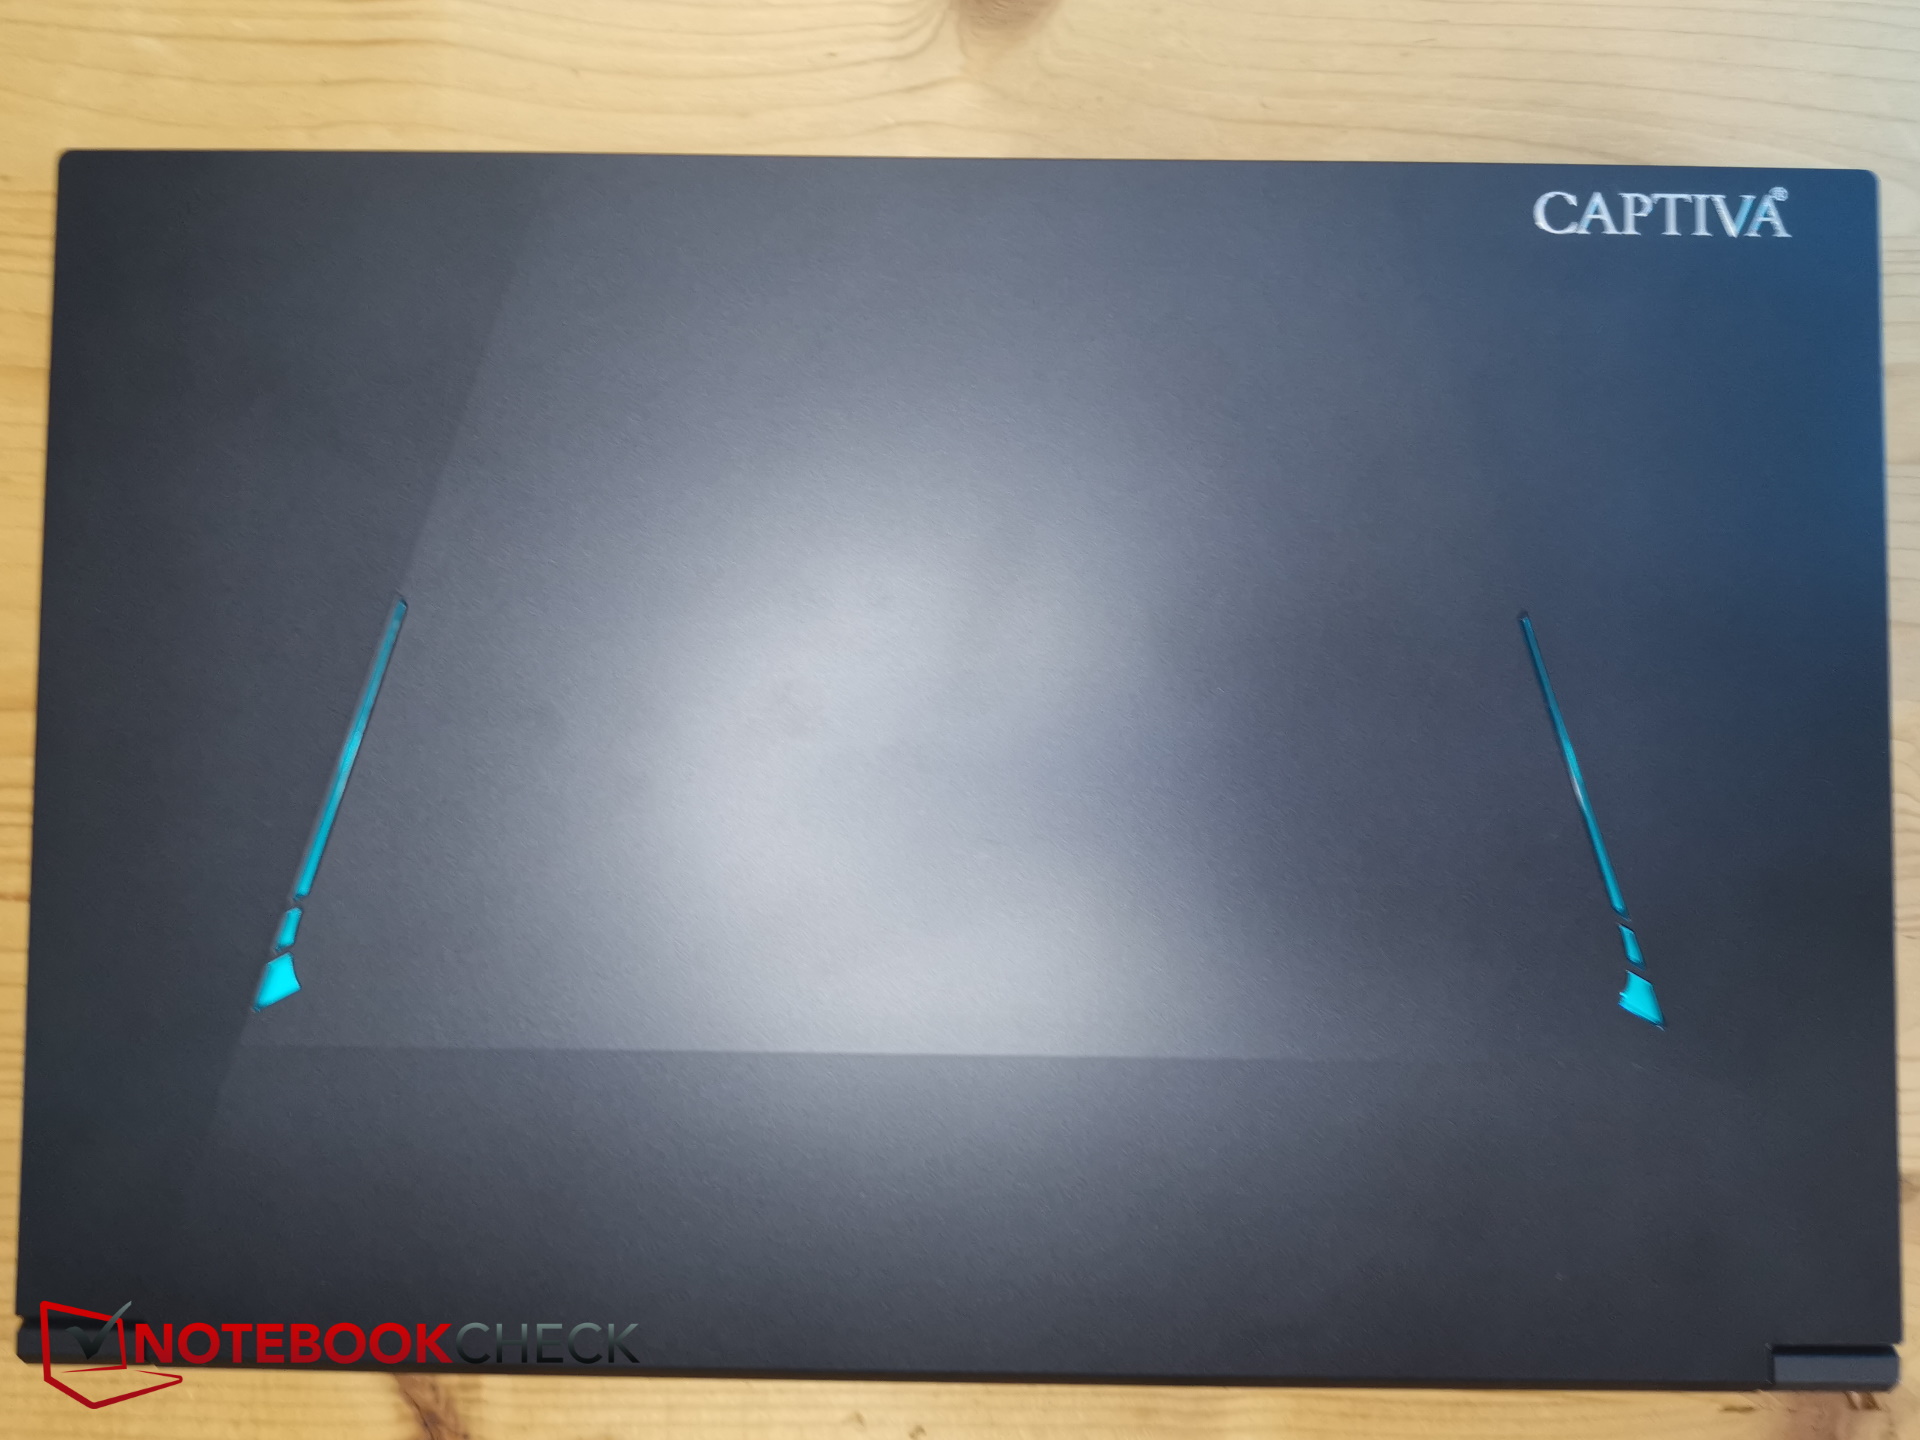
On the outside, both models look quite different, even if their footprints are similar. The Captiva laptop is quite a bit thicker than the G5. On the top, there are blue, slanted LED strips set into the matte black surface - in one corner, the silver "Captiva" lettering shines. Furthermore, the top of the I74-121 isn't totally even - instead, it has a slight bend or curve.
Plastic is the only material used but its base is still stiff enough and you can't elicit any cracking noises from it when you try to bend it. We didn't note any unusual gaps and its build is generally quite good.
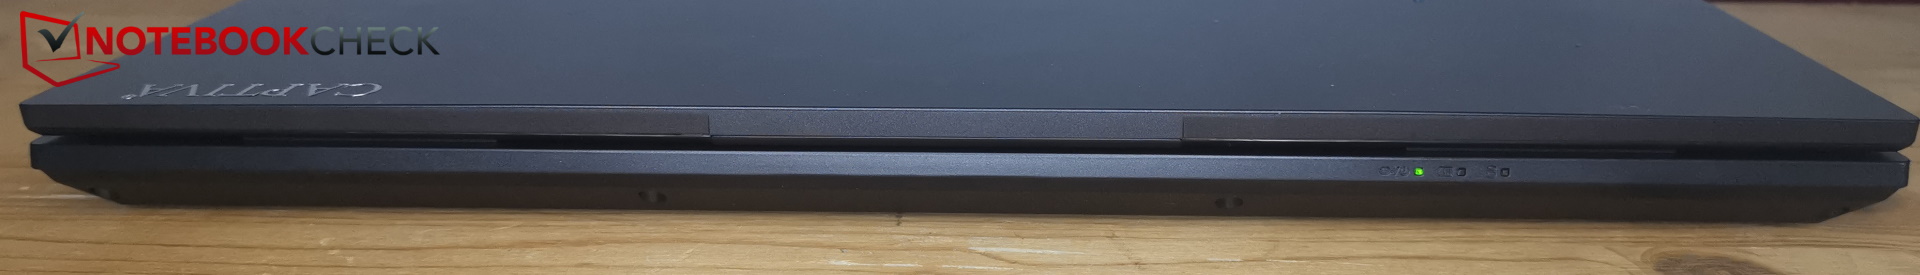
The wide hinge is good but not excellent - it only allows for a maximum opening angle of 135 to 140 degrees.
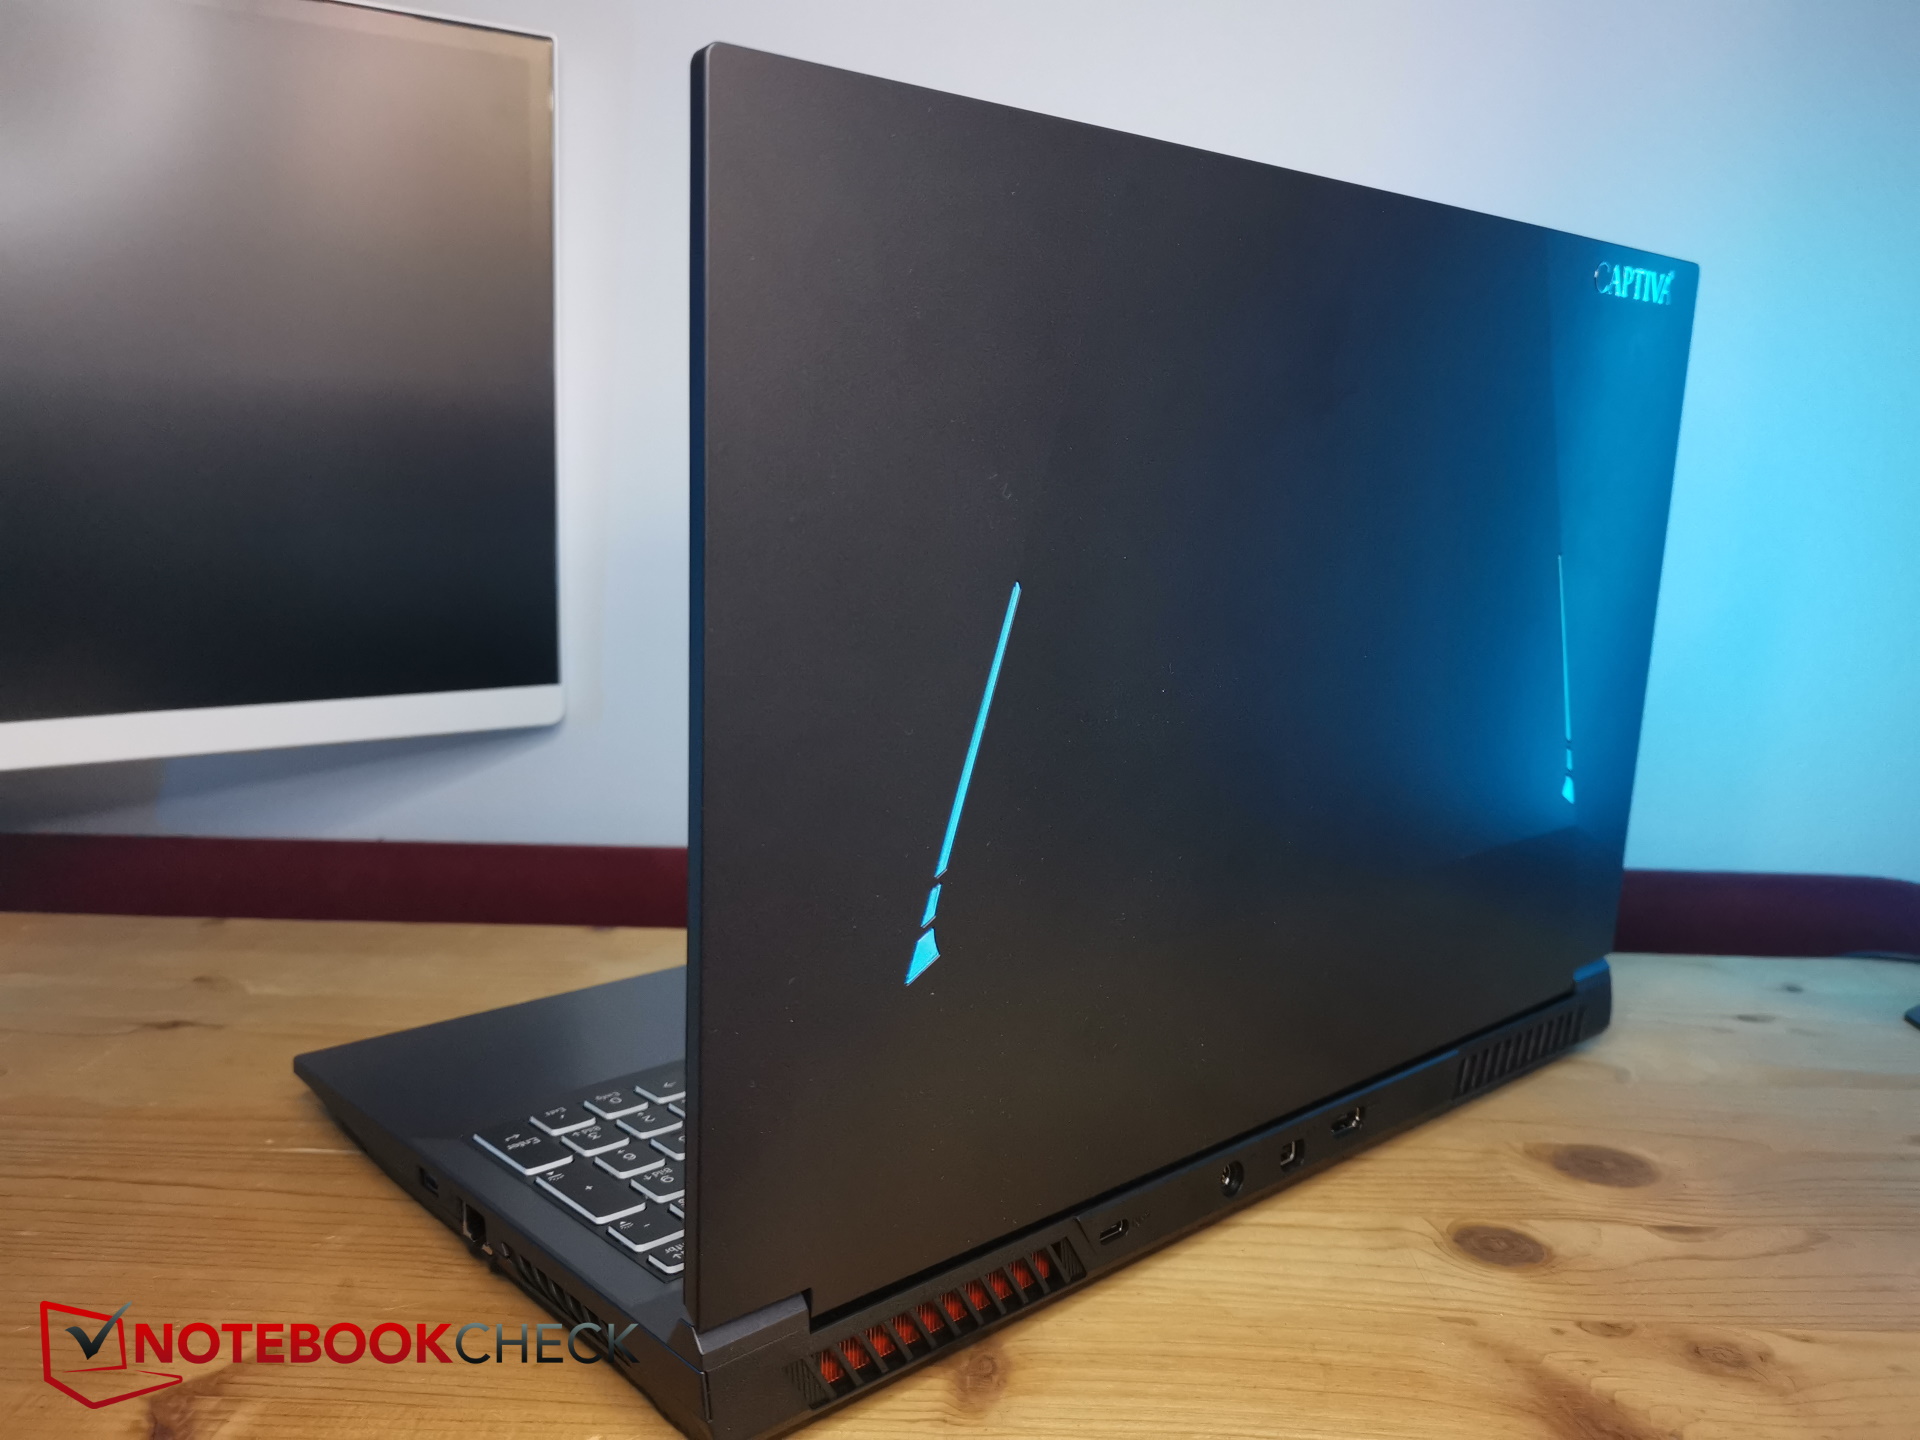
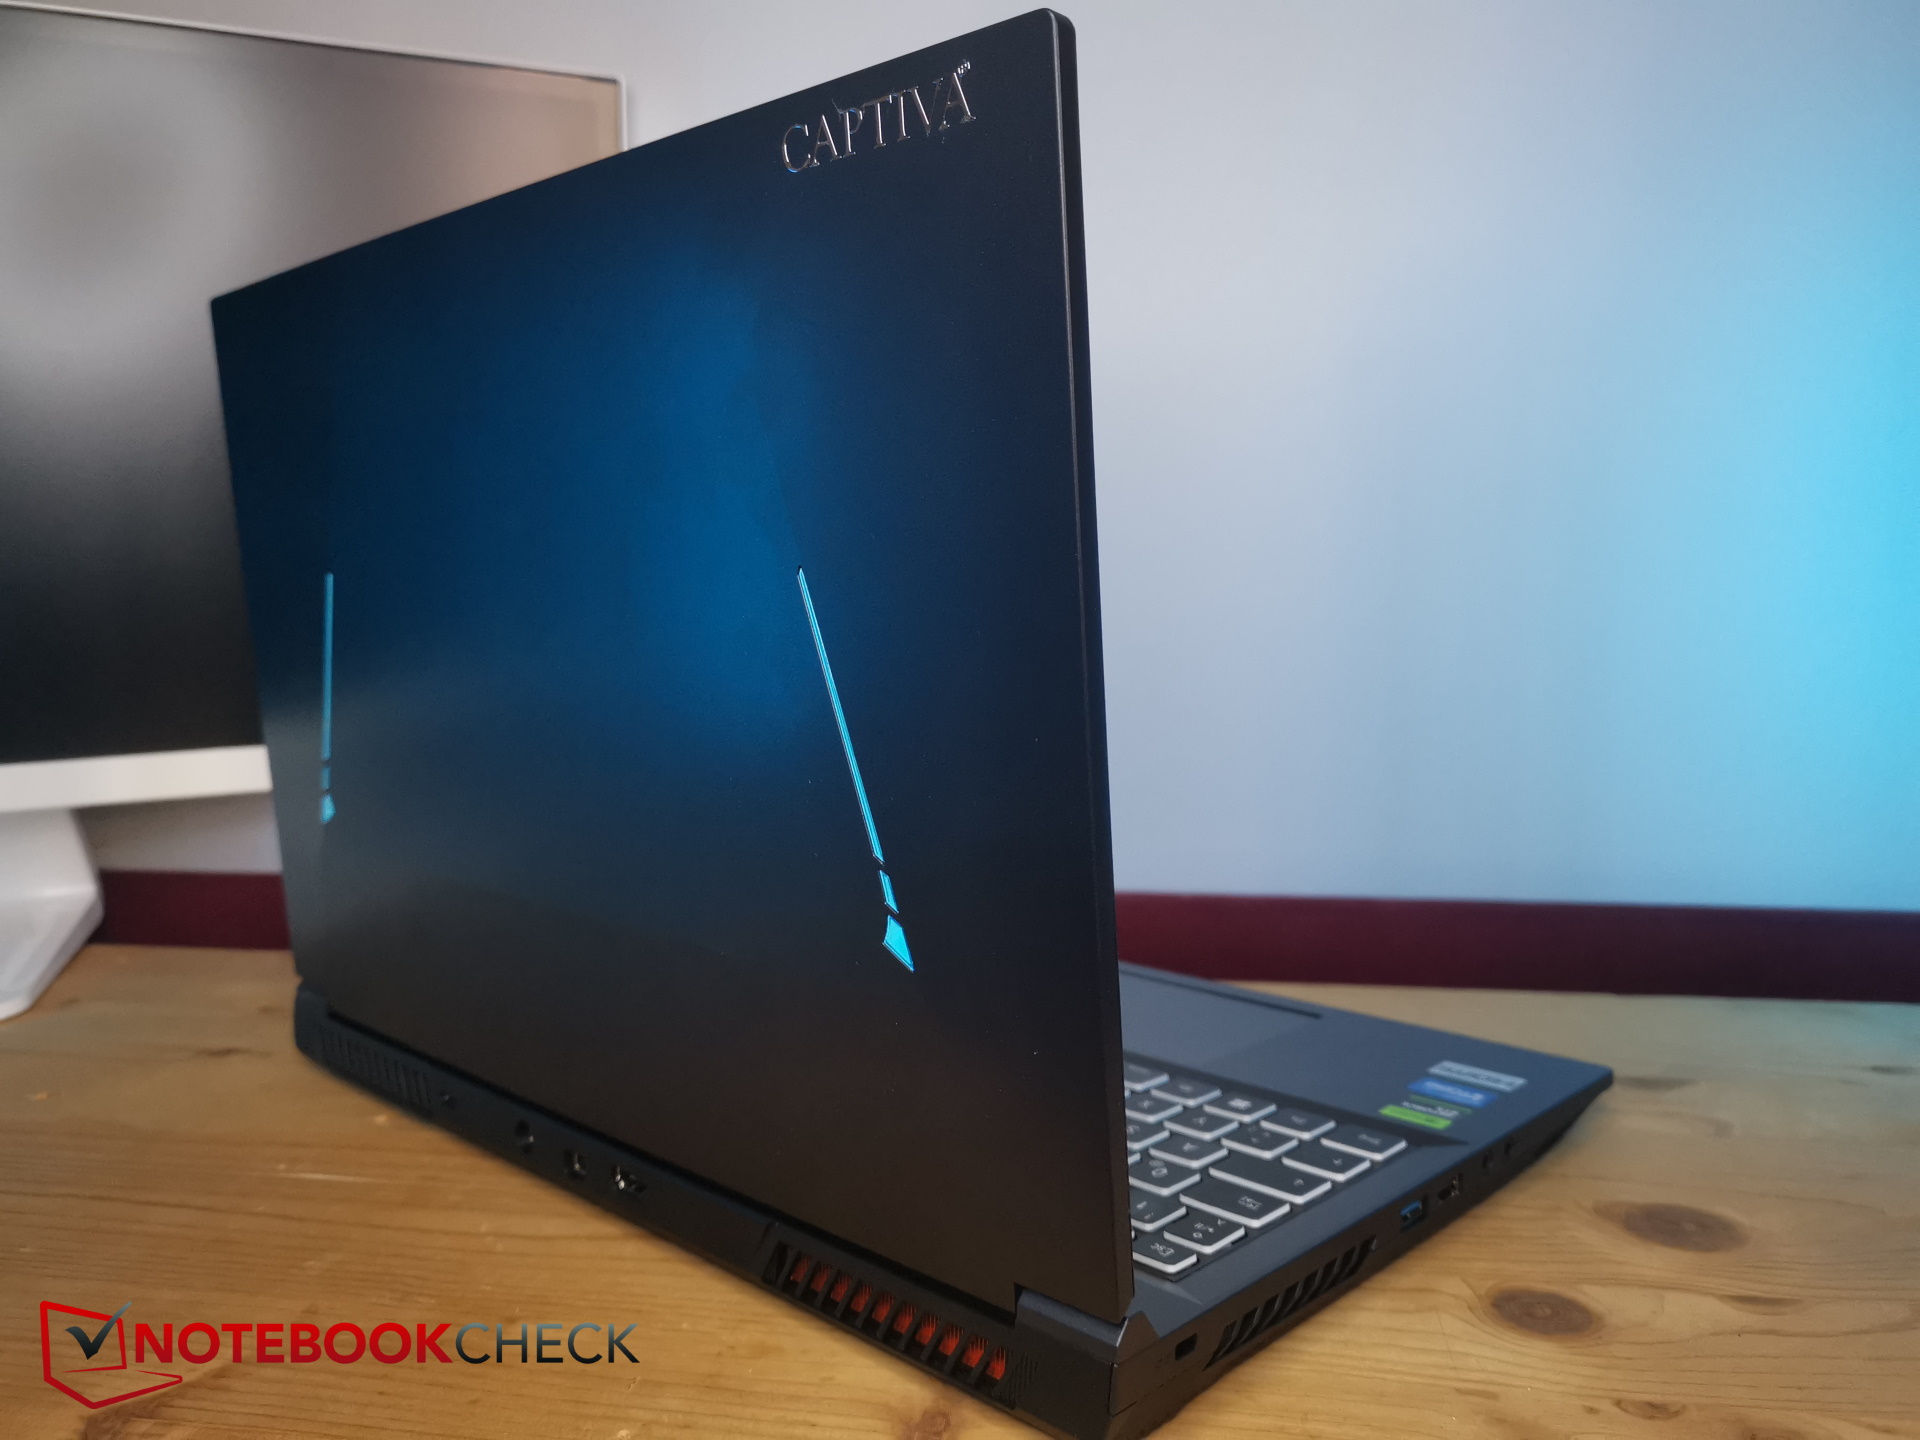
As a result of its minimalist design, the Captiva laptop is one of the smallest devices within the comparison field, especially when it comes to depth. In turn, it is also one of the thickest laptops in this comparison. The manufacturer has stated a thickness of 28 mm but we measured at least 29 mm along the middle edge on the back of the device.
It has an average weight - the Schenker and MSI devices are slightly lighter and the rest is heavier, especially the Dell G15.
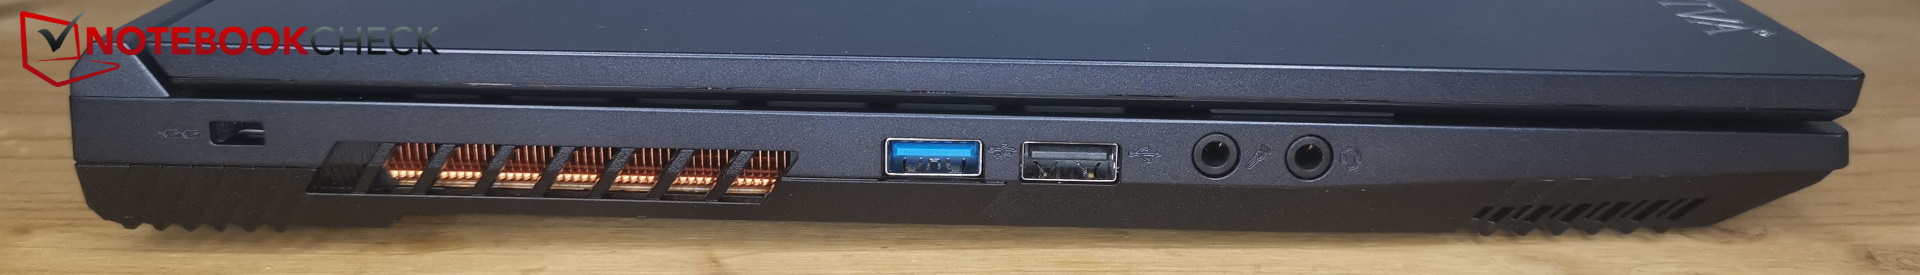
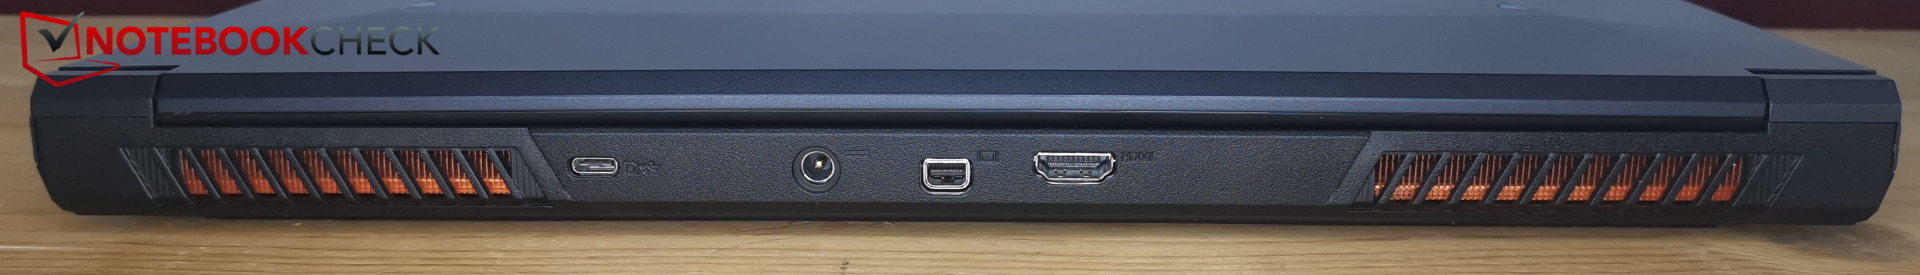
Connectivity - Slightly outdated
At first glance, the laptop features all the most important connectivity options. Upon second glance, it is clear that this isn't the case - or at least that they are outdated.
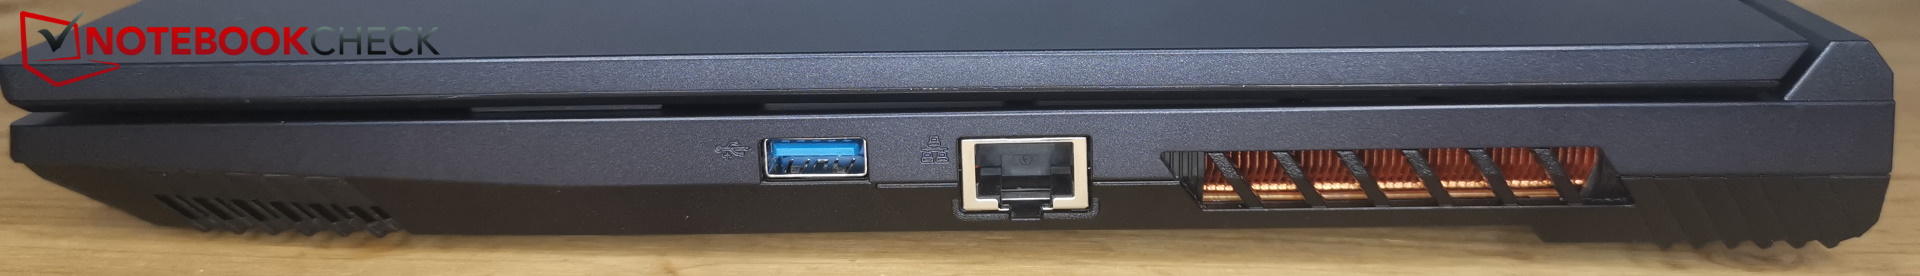
One of its USB-A ports is still type 2.0, Thunderbolt is missing and it also doesn't have an SD card reader. At least, the laptop is VR-ready thanks to its MiniDP connection. One of the two USB-A 3.2 ports has Gen2 speed and the other one only Gen1. Which one is the faster connection cannot be identified from the outside.
Both the USB-A ports on the left side are placed very close together, meaning thick USB sticks can't be connected next to each other. All the other ports have enough space in between. However, the network connection is on the right side - a bit annoying if you use a mouse with your right hand.
Communication
The Captiva laptop's Intel AX211 module supports WiFi 6E, meaning it can receive and output using 2.4 GHz, 6 GHz and 6GHz frequencies. Using 6 GHz, its transfer speeds are good, although, when using 5 GHz, the laptop is the weakest within the comparison field.
| Networking | |
| iperf3 transmit AXE11000 | |
| MSI Cyborg 15 A12VF | |
| Dell G15 5530 | |
| Lenovo Legion Slim 5 16APH8 | |
| Average of class Gaming (648 - 1780, n=126, last 2 years) | |
| Average Intel Wi-Fi 6E AX211 (591 - 1861, n=136) | |
| SCHENKER XMG Core 15 (M22) | |
| Lenovo LOQ 15APH8 | |
| Captiva Advanced Gaming I74-121 | |
| iperf3 receive AXE11000 | |
| MSI Cyborg 15 A12VF | |
| Dell G15 5530 | |
| Lenovo Legion Slim 5 16APH8 | |
| Average of class Gaming (685 - 1890, n=133, last 2 years) | |
| Average Intel Wi-Fi 6E AX211 (826 - 1890, n=136) | |
| SCHENKER XMG Core 15 (M22) | |
| Captiva Advanced Gaming I74-121 | |
| Lenovo LOQ 15APH8 | |
| iperf3 transmit AXE11000 6GHz | |
| Lenovo Legion Slim 5 16APH8 | |
| Captiva Advanced Gaming I74-121 | |
| Average of class Gaming (843 - 1878, n=63, last 2 years) | |
| Average Intel Wi-Fi 6E AX211 (713 - 1851, n=143) | |
| SCHENKER XMG Core 15 (M22) | |
| iperf3 receive AXE11000 6GHz | |
| Captiva Advanced Gaming I74-121 | |
| Average of class Gaming (853 - 1857, n=65, last 2 years) | |
| Average Intel Wi-Fi 6E AX211 (883 - 1857, n=142) | |
| Lenovo Legion Slim 5 16APH8 | |
| SCHENKER XMG Core 15 (M22) | |
Webcam
Its webcam isn't entirely up-to-date either. Instead of a modern Full HD webcam, the laptop uses an outdated HD webcam with a resolution of 720p.
Its color deviation is nice and low but even in good lighting conditions, the picture is quite grainy and doesn't show much detail.


Safety
TPM is on board thanks to the Intel chip and the device features a Kensington lock - but as is the case in lots of gaming laptops, the Captiva device doesn't feature a fingerprint scanner.
Scope of delivery and warranty
Aside from the laptop itself and the proprietary power supply, the scope of delivery includes all the usual paperwork, 2 small screws as well as a driver CD. The latter is a bit useless seeing as how the laptop doesn't have a CD drive - a driver USB stick like the one Schenker includes would've made much more sense.
Maintenance
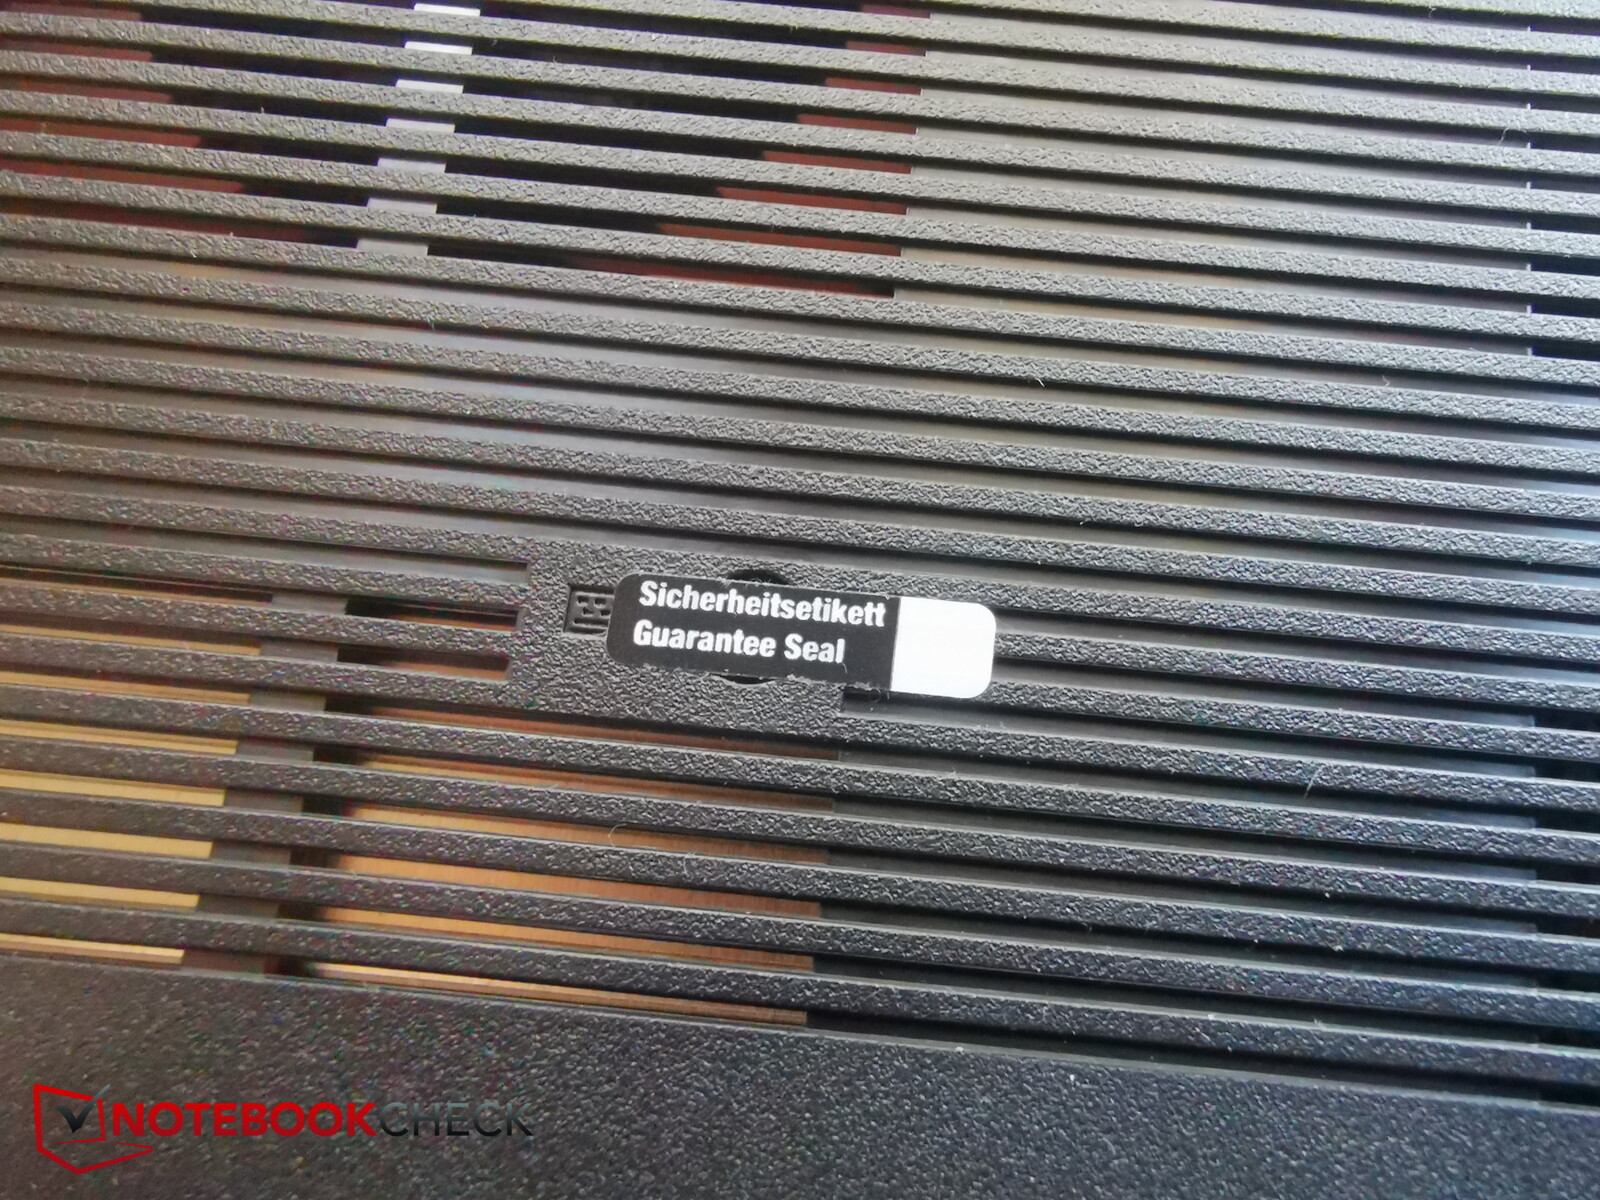
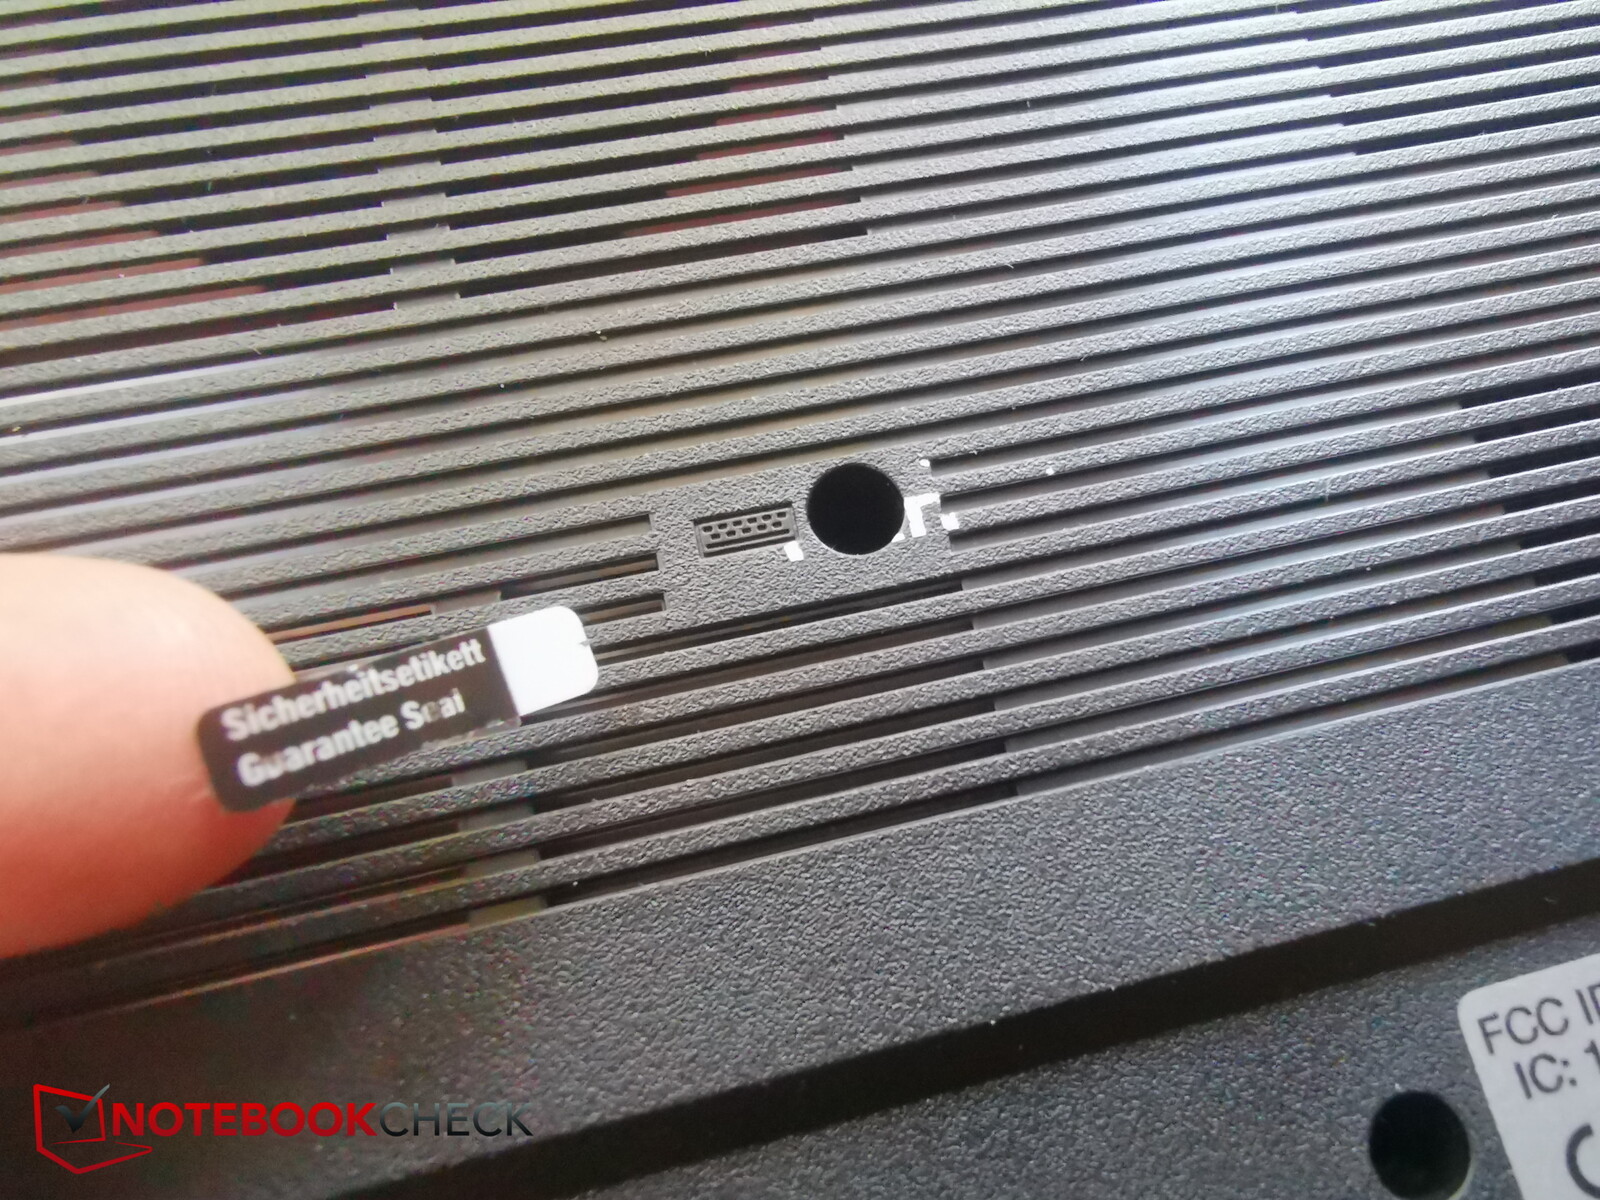
From the 14 cross screws in total (which are all thankfully the same size), one is situated beneath a warranty seal. According to Captiva, the warranty expires as soon as you open up the device. The manufacturer gave us permission to break the seal.
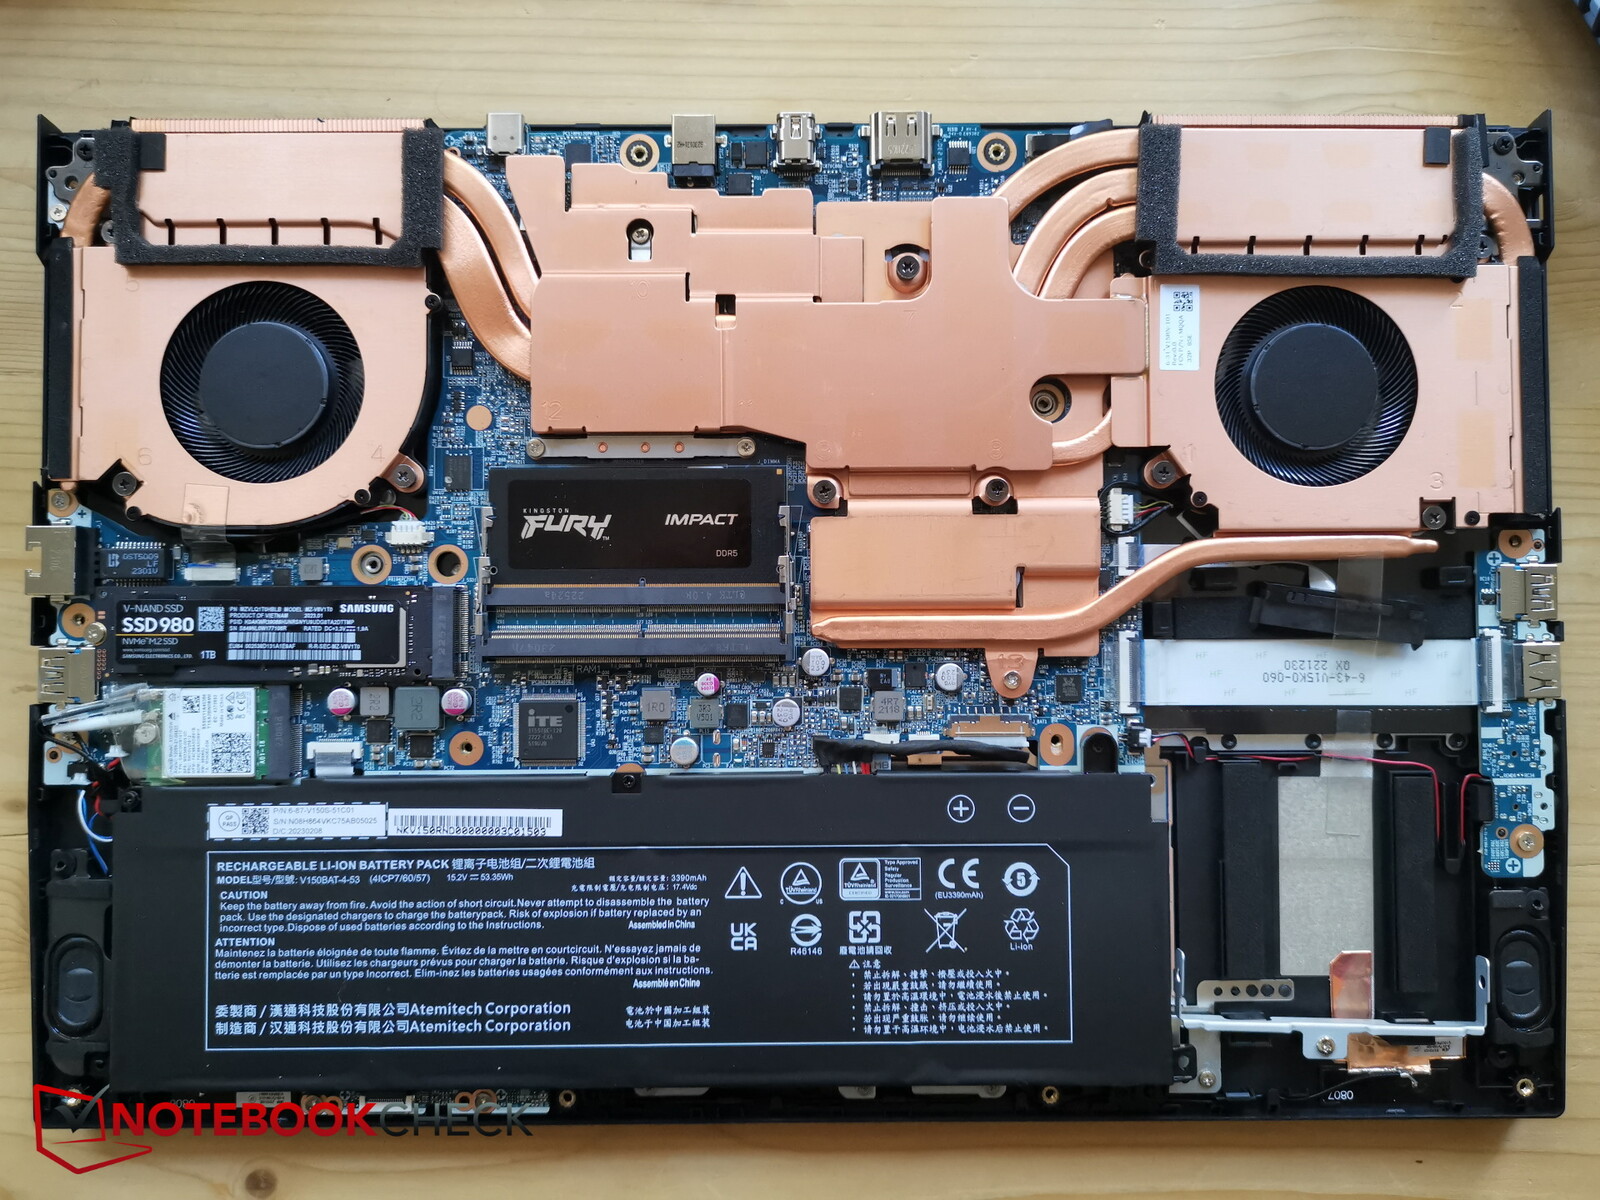
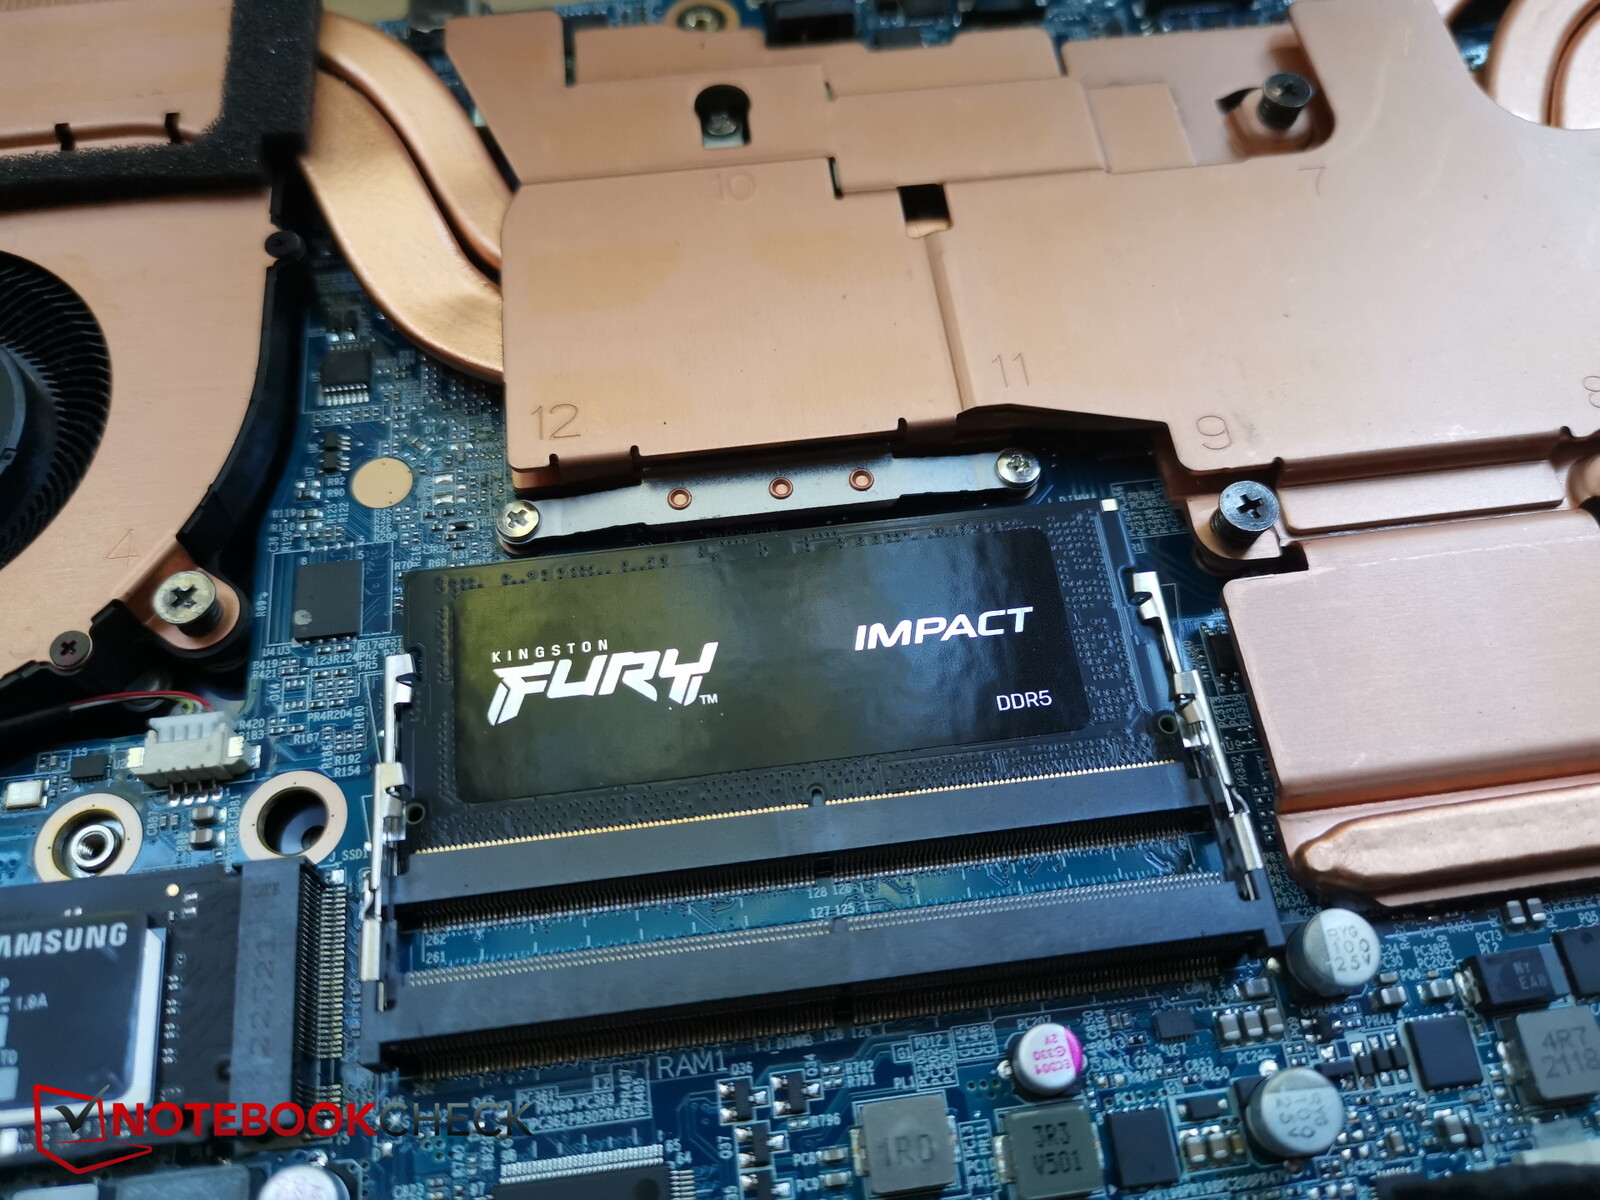
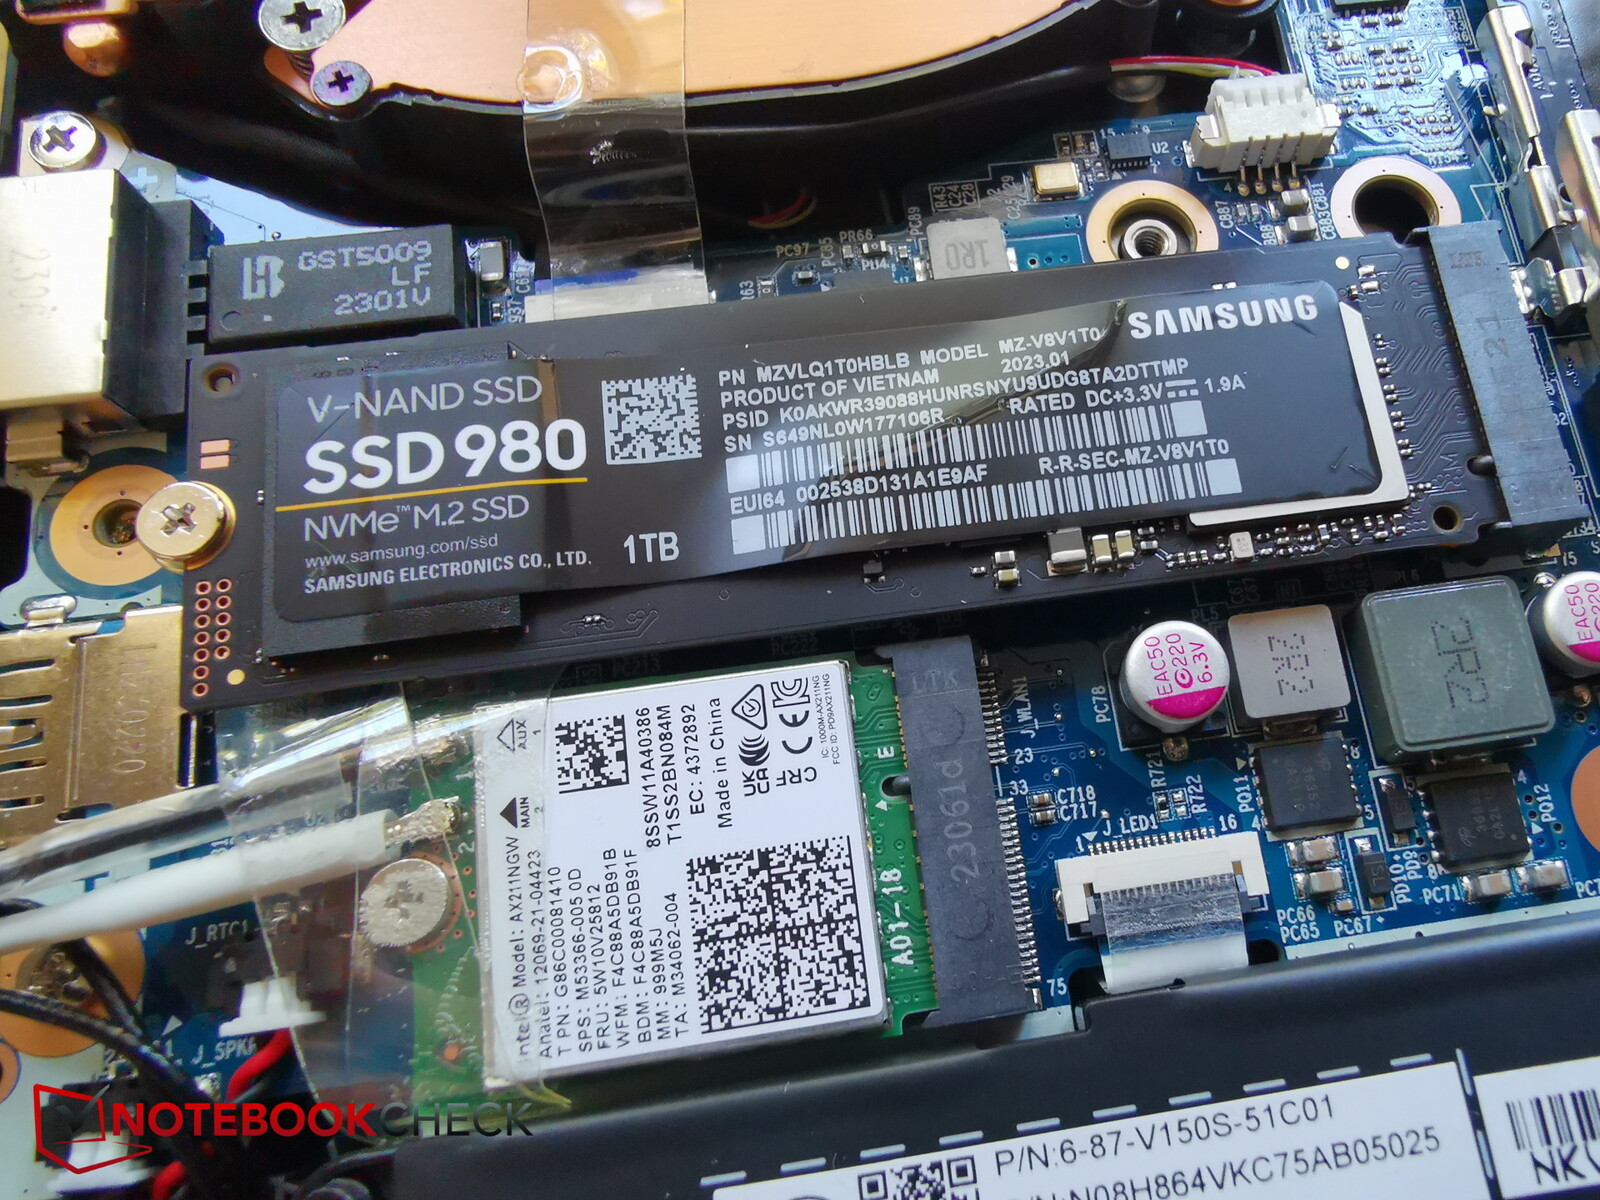
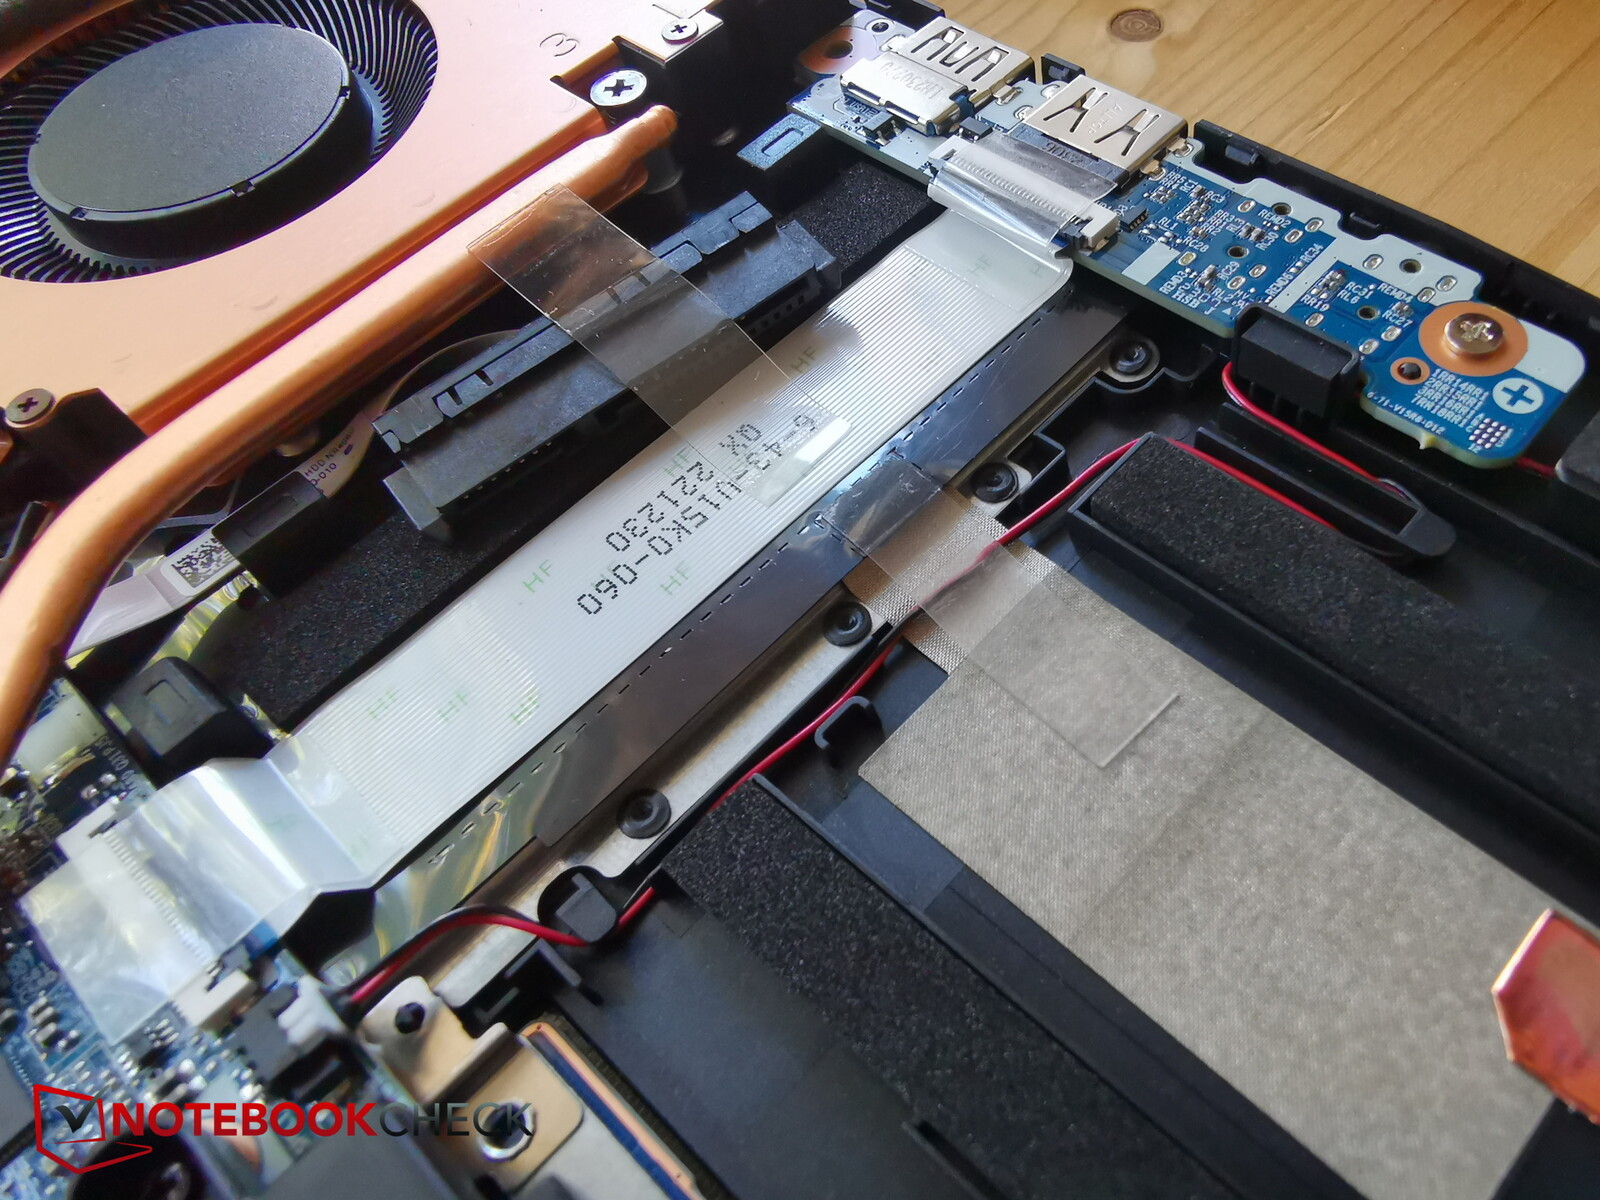
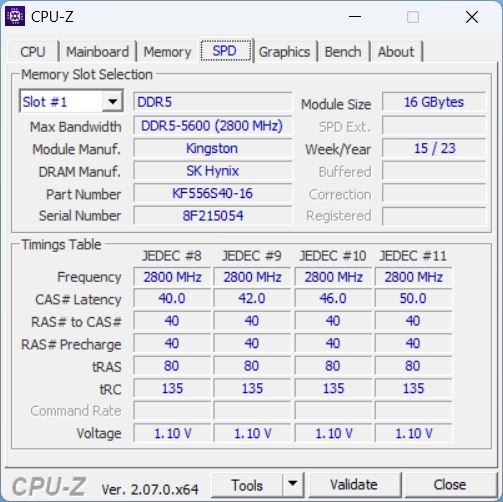
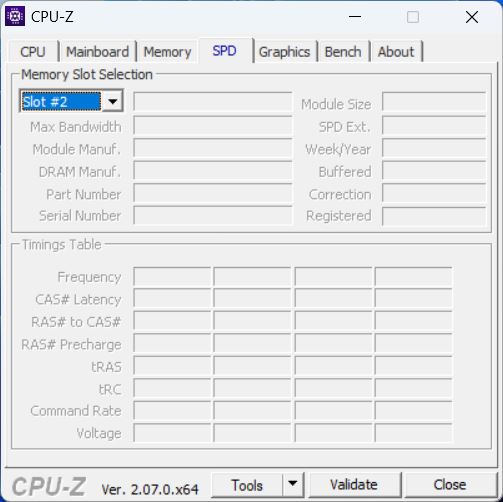
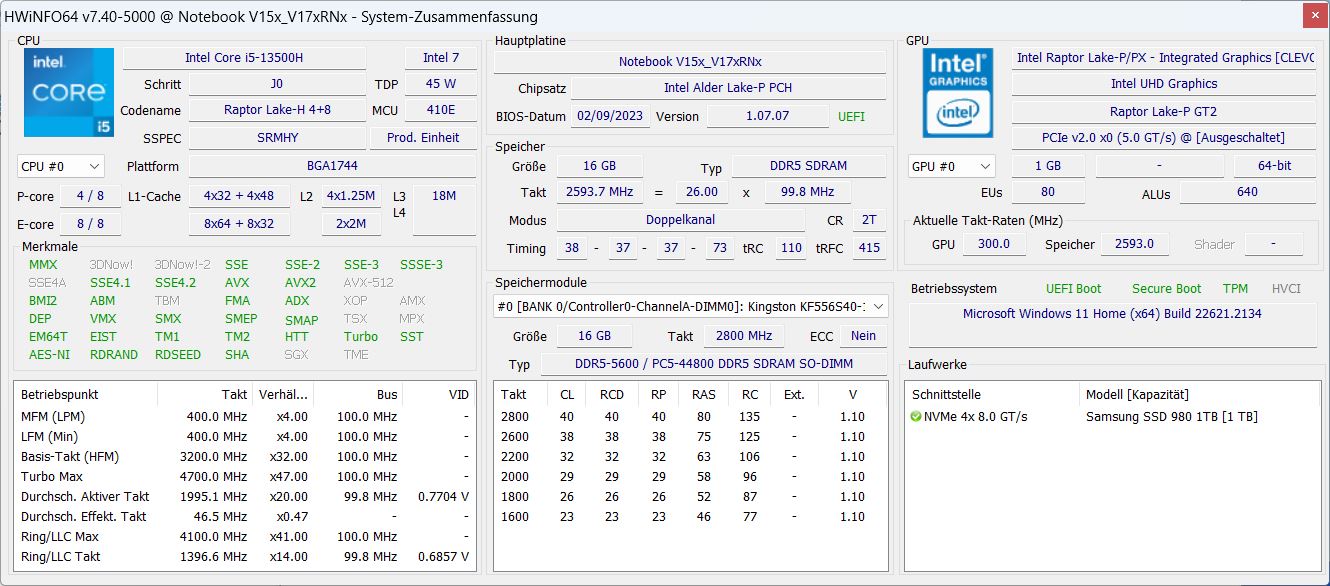
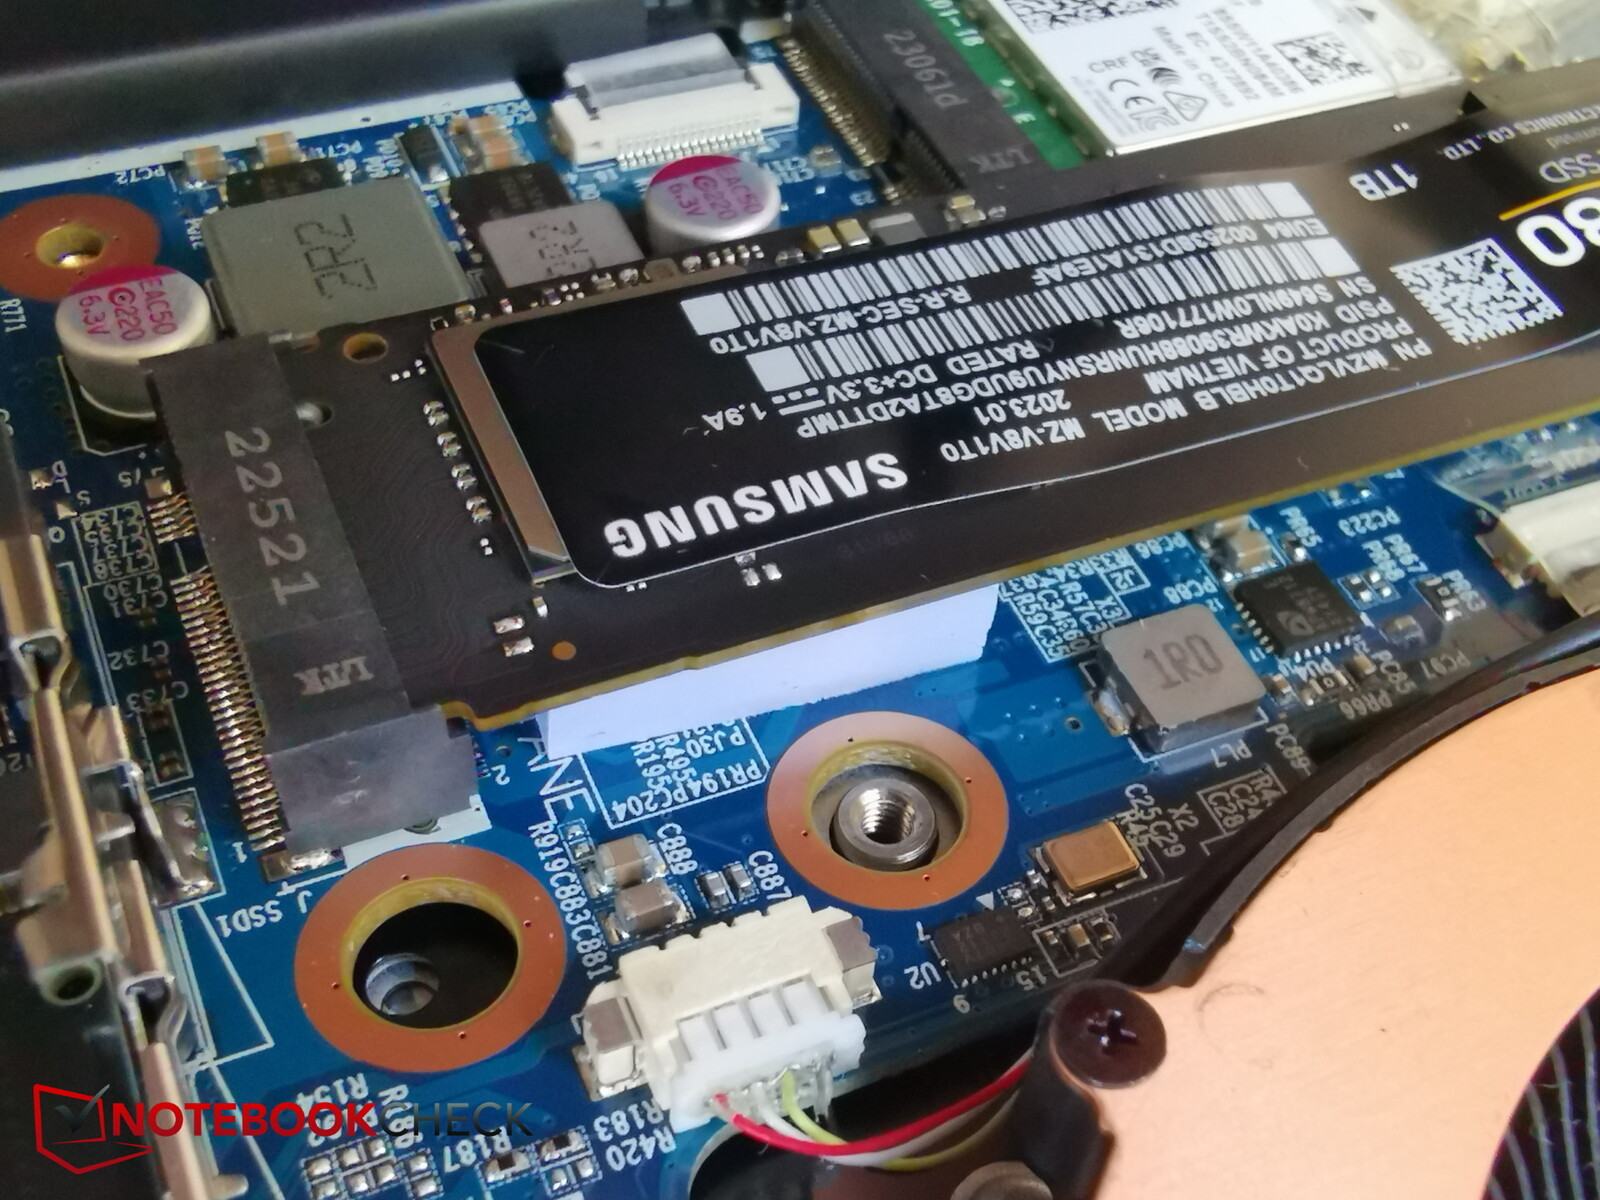
After removing the screws, it is super easy to take off the bottom plate without the need for any tools. Underneath, you can see the cooling system consisting of two fans and lots of copper in between, the two RAM banks of which one is unoccupied, the swappable SSD as well as the swappable WiFi module.
Instead of a second NVMe slot, there is a SATA slot which can accommodate 2.5-inch drives. Apart from the warranty seal, it is very easy to conduct maintenance work on this laptop.
Input devices - Solid and fit for everyday use
Keyboard
Its keyboard layout is functional and without any issues. The arrow keys are the normal size (ca. 15 x 15 mm), the number pad has smaller keys (15 x 12.6 mm) and seamlessly connects on the right side. On the top right, there is an extra button for the power.
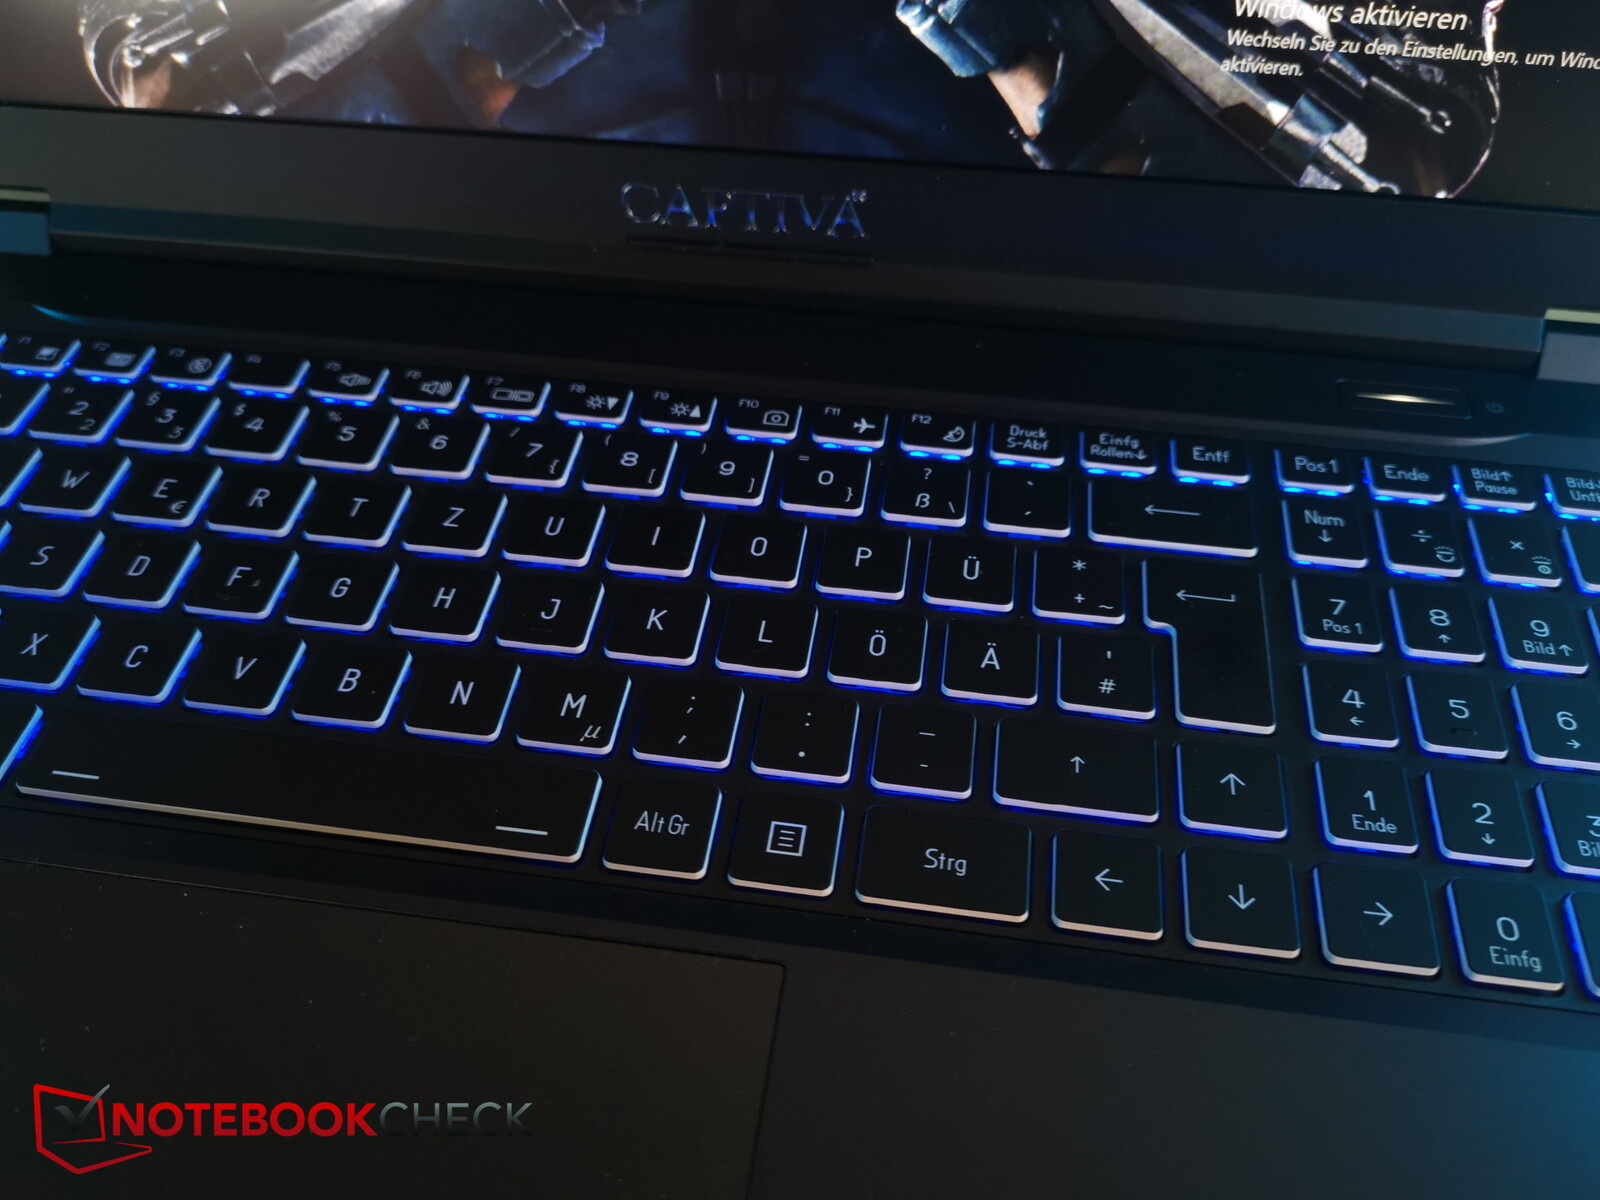
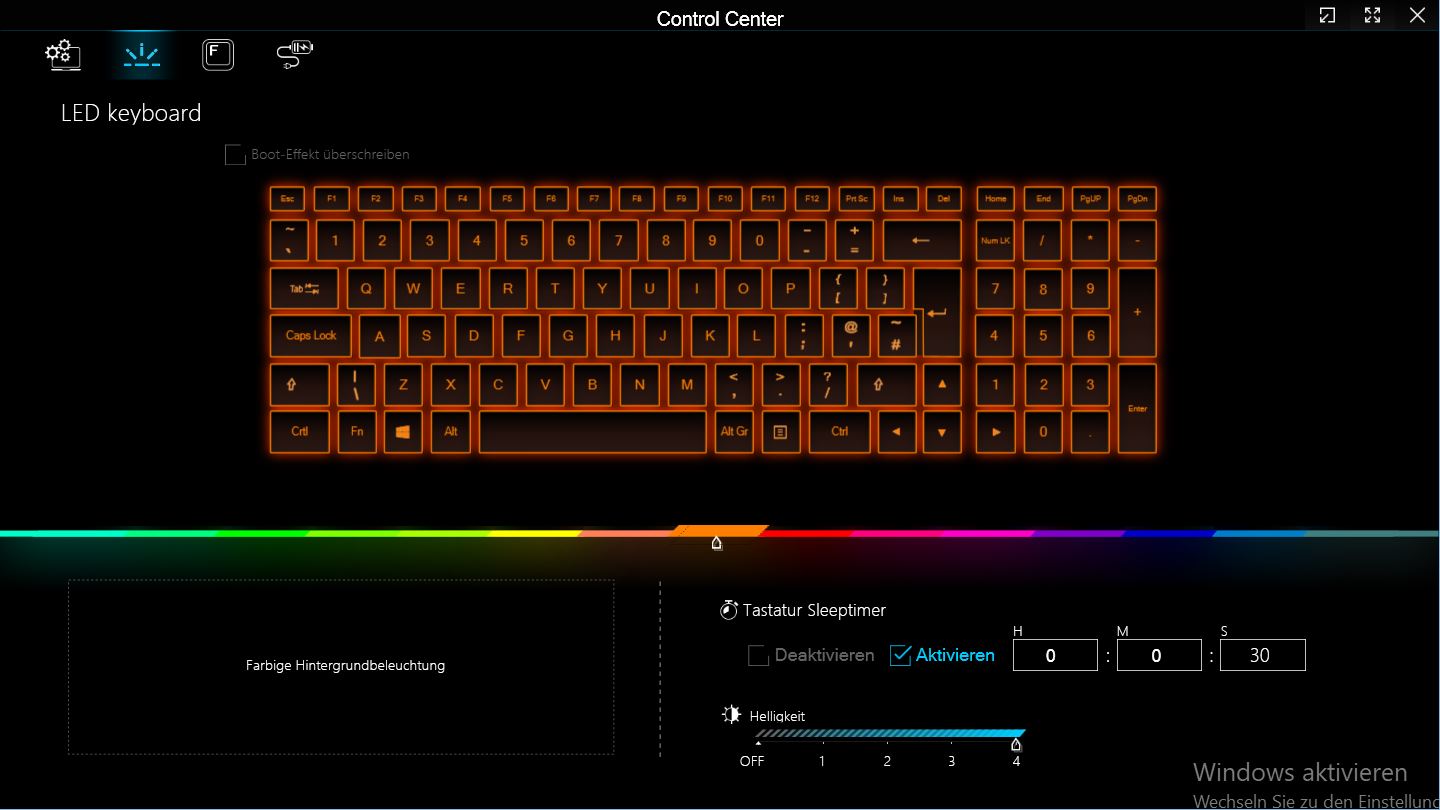
The keys have a comfortable, not-too-short lift with decent feedback. Noises produced by typing are very moderate. Furthermore, the key labelling is very legible and it is supported in darker lighting conditions through its one-zone multicolor backlighting.
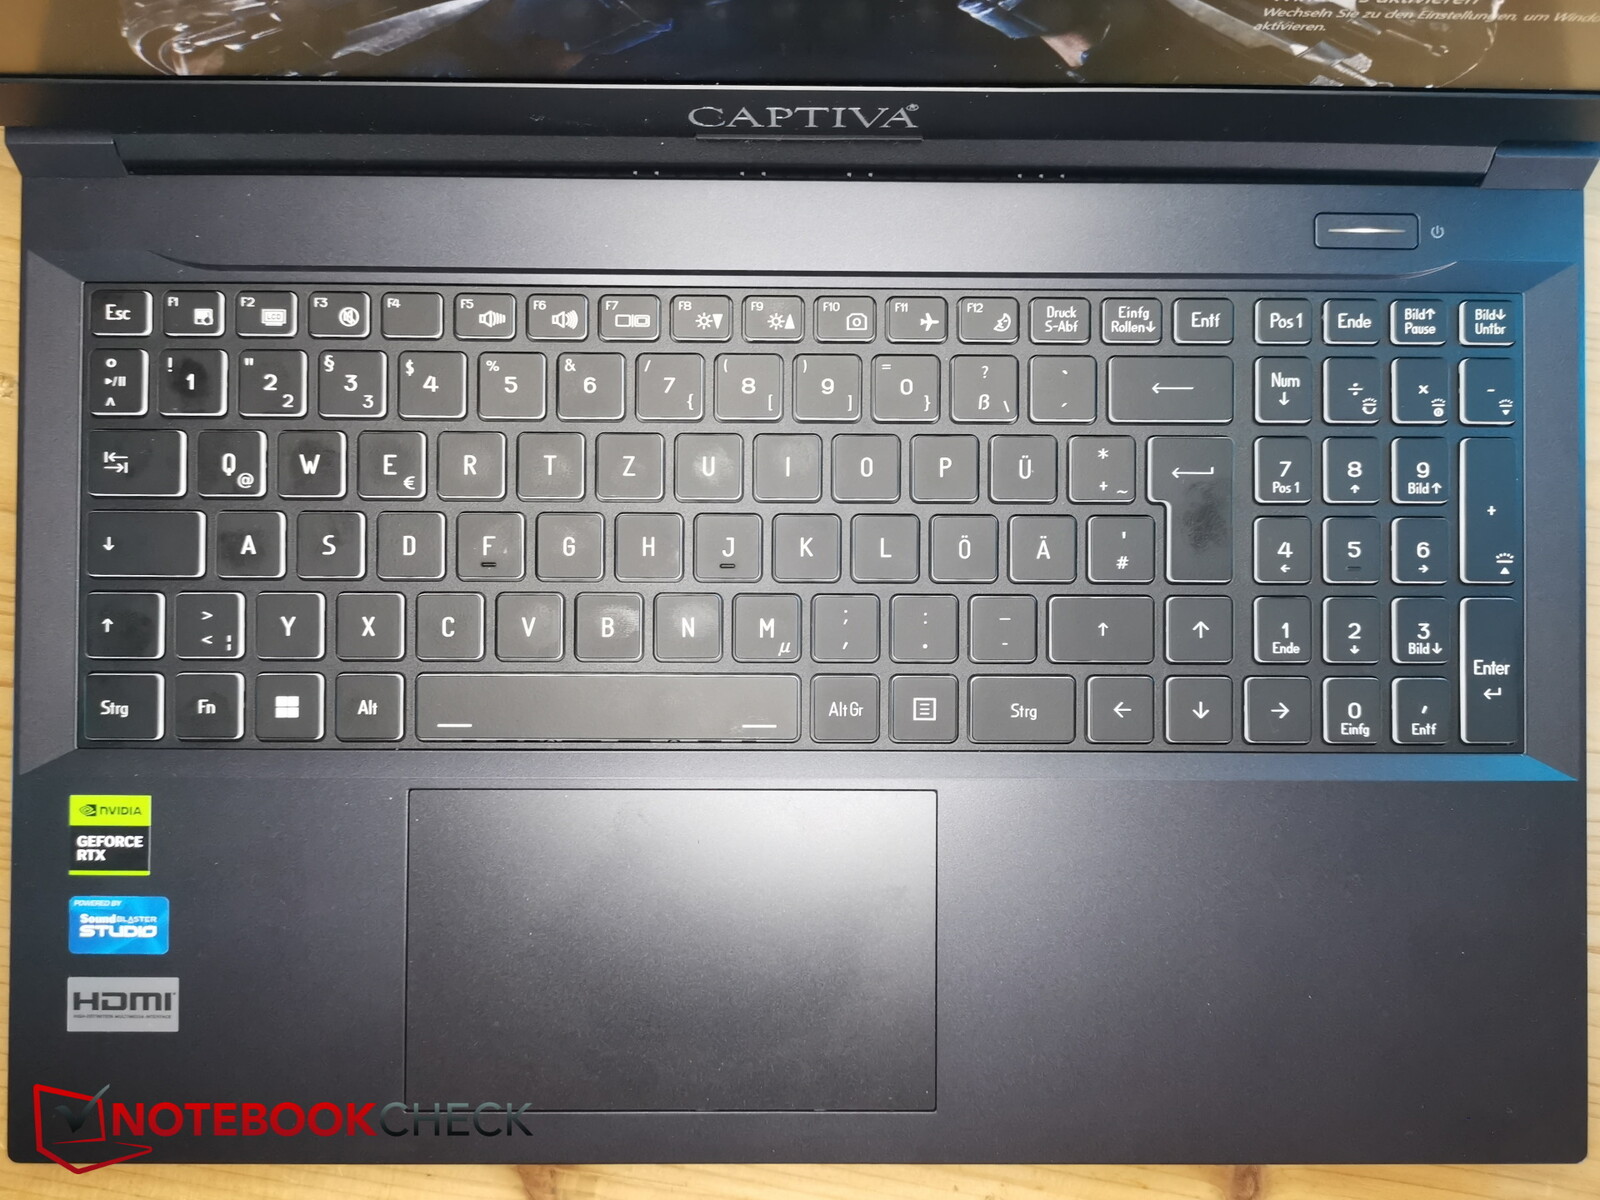
Touchpad
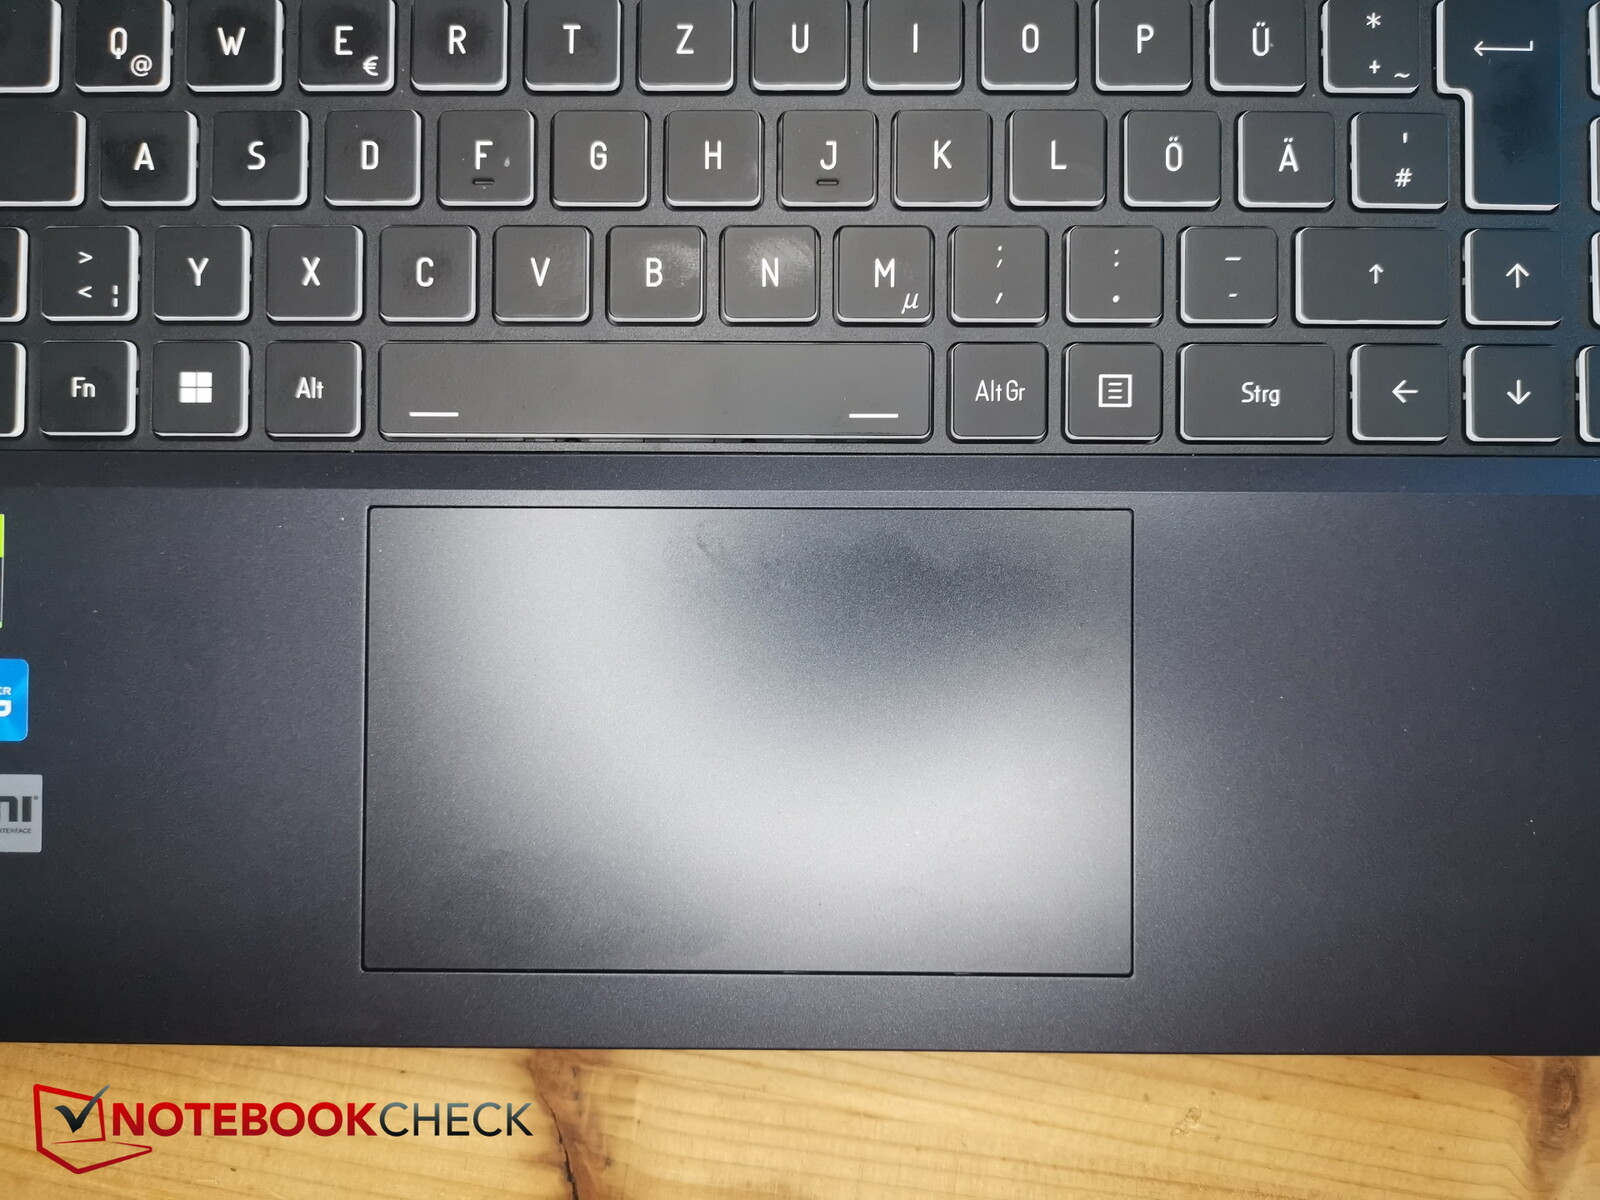
As a result of the number pad, the touchpad (12 x 7.2 cm) is situated slightly to the left, which feels right. It can stick a bit during slow movement or if your hands are sweating but in normal situations, your fingers glide smoothly over the surface.
The integrated keys also have nice levels of feedback - the click noise is a bit louder but it isn't annoying.
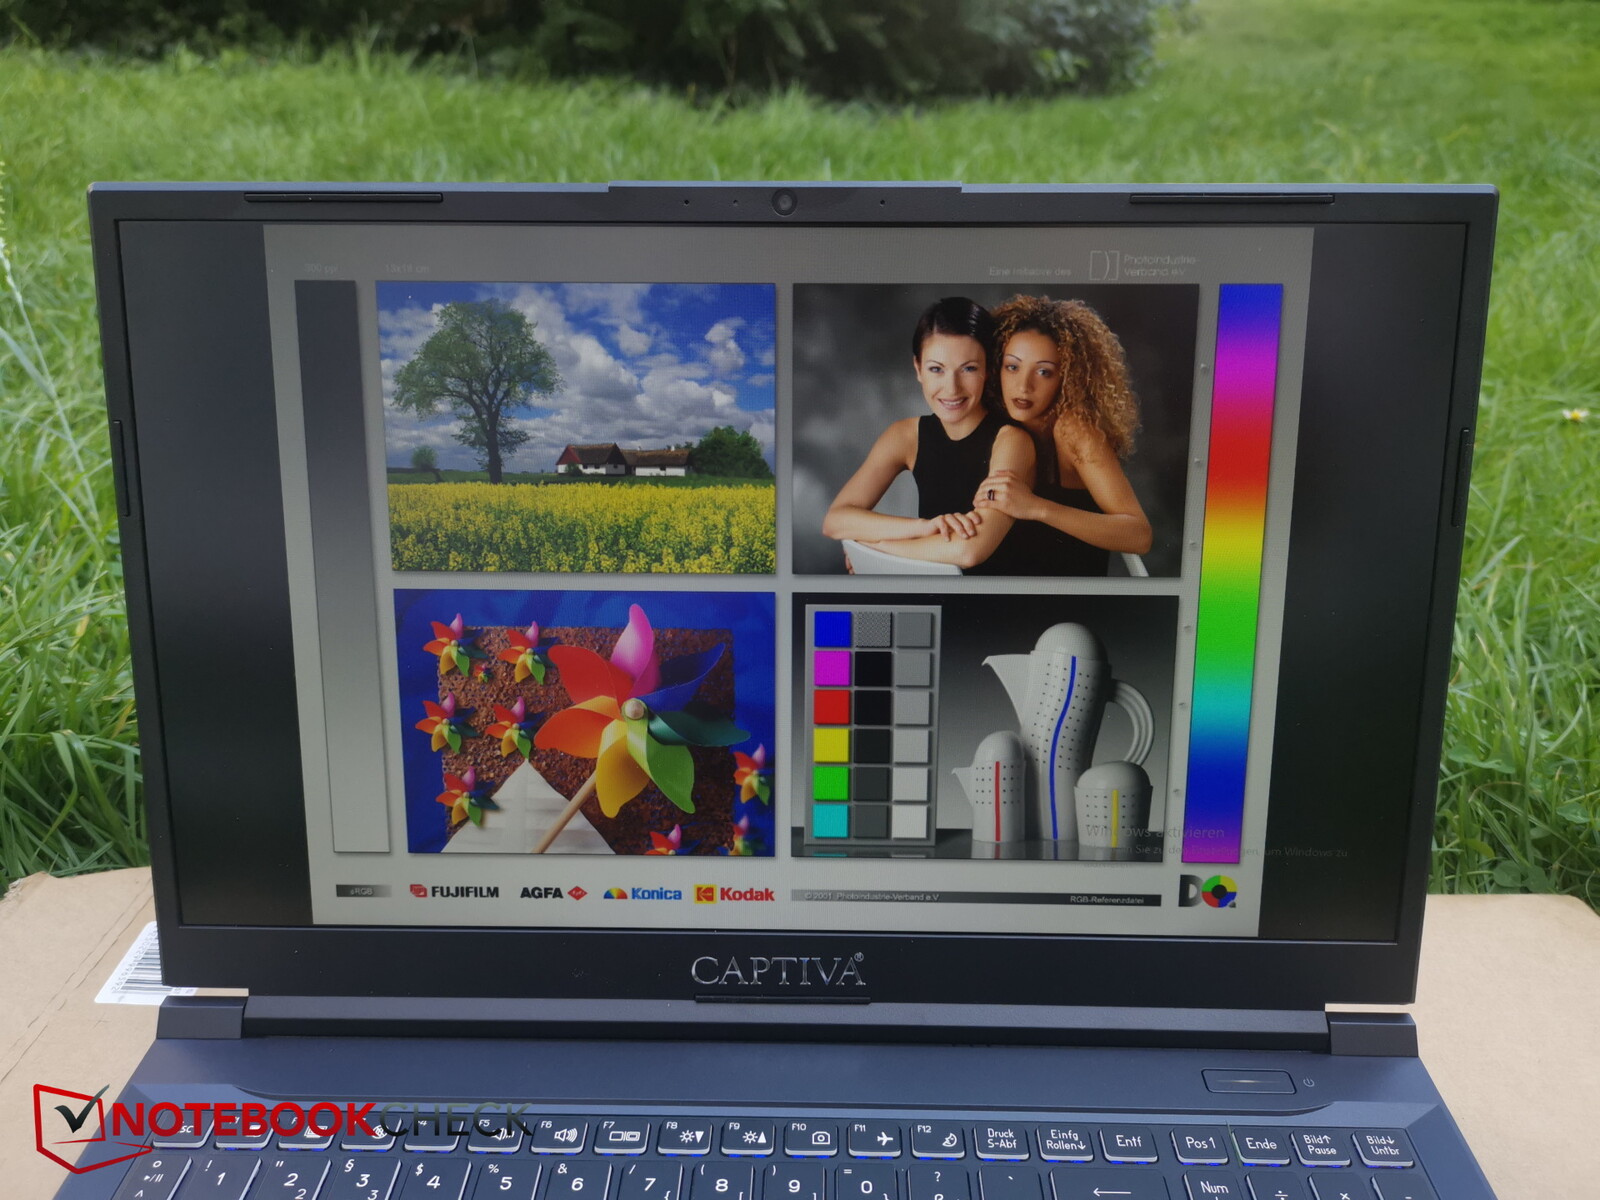
Display - The Advanced Gaming only has Full HD
Captiva has installed a 144 Hz Full HD panel from BOE into the laptop. We tested the same panel within the Gigabyte A5 K1. Here, the display is a little brighter (324 vs. 281 nits) but in turn, its black value and contrast are slightly poorer. Its illumination of 90 per cent is even enough.
The panel's reaction speeds are good, we didn't note any PWM flickering and there is only a small amount of backlight bleeding which is barely noticeable.
| |||||||||||||||||||||||||
Brightness Distribution: 90 %
Center on Battery: 346 cd/m²
Contrast: 989:1 (Black: 0.35 cd/m²)
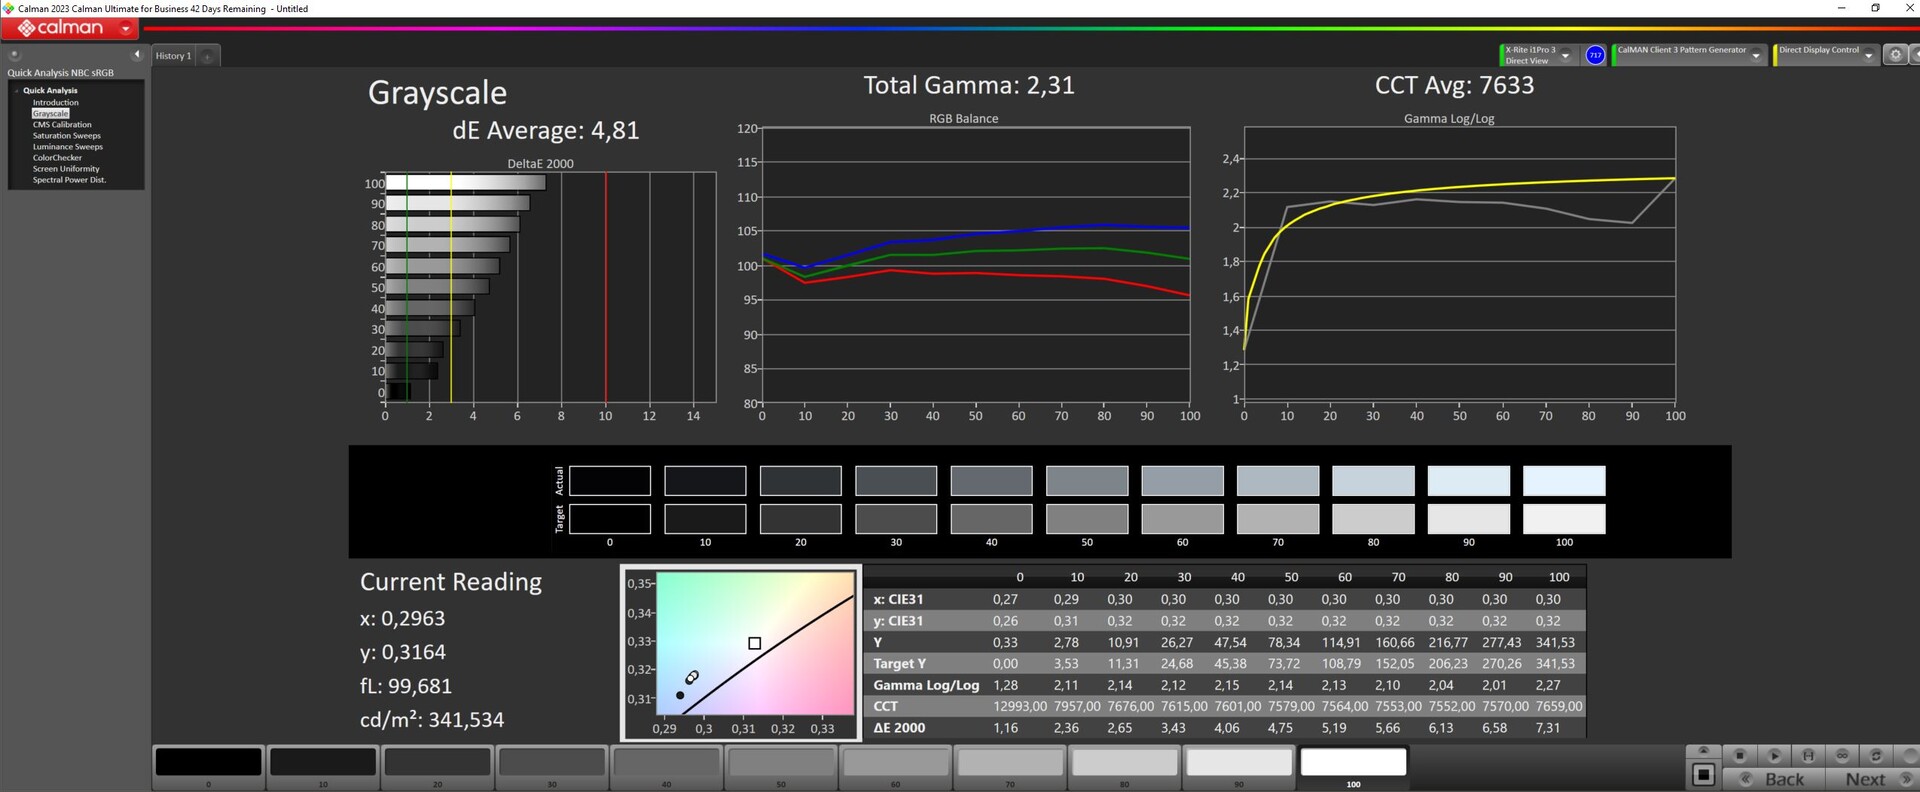
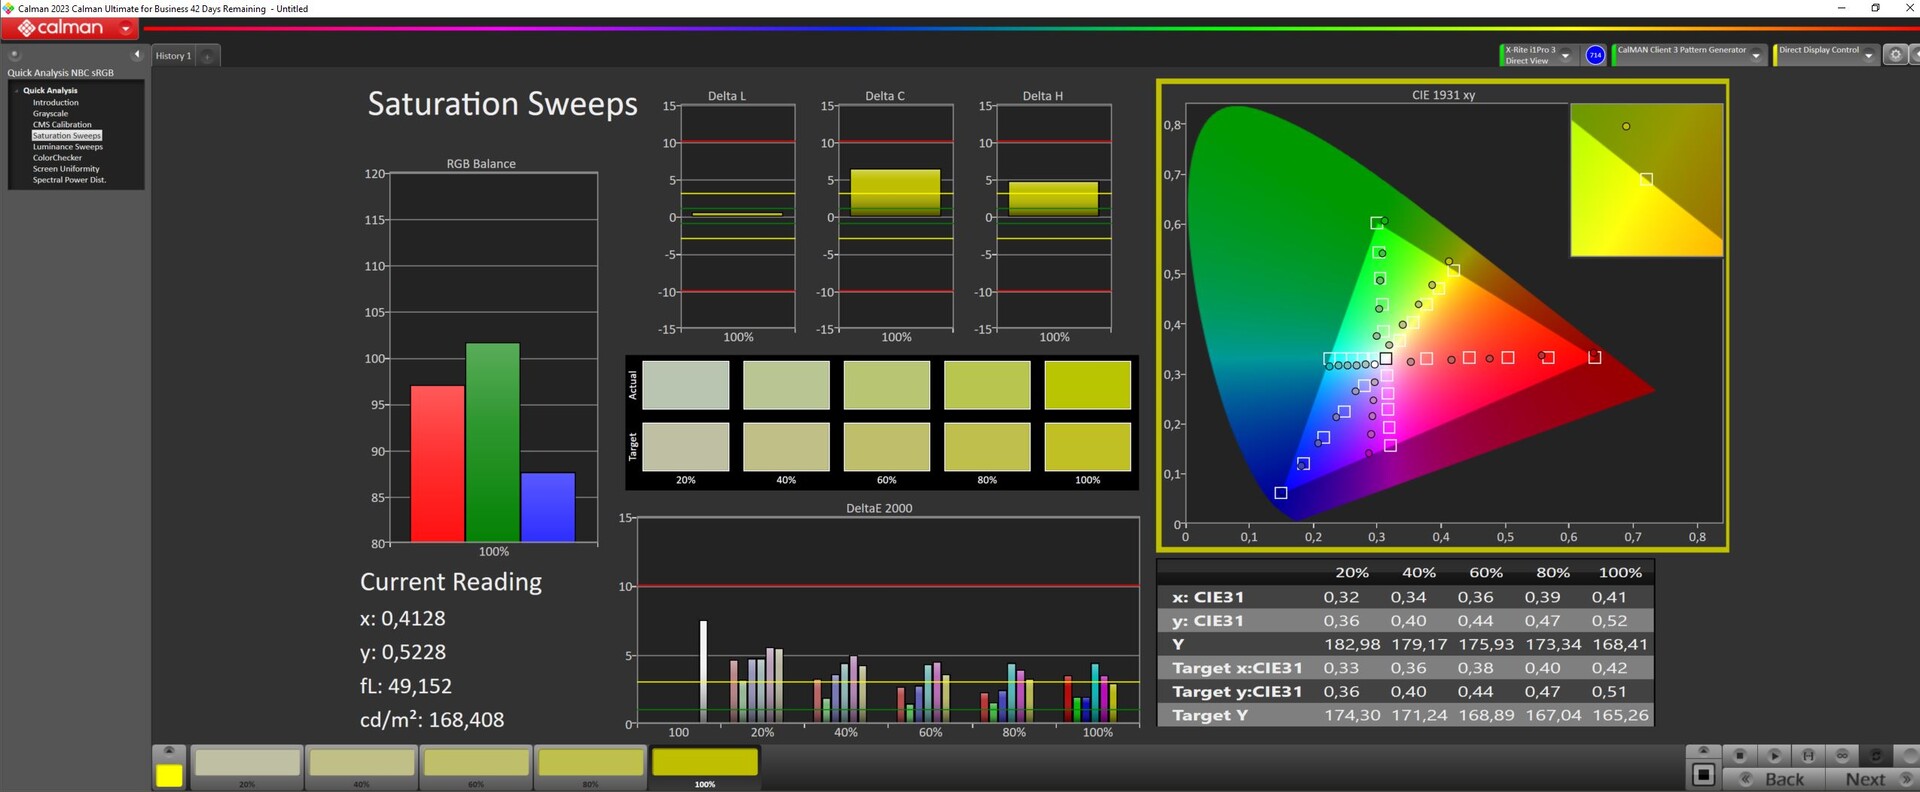
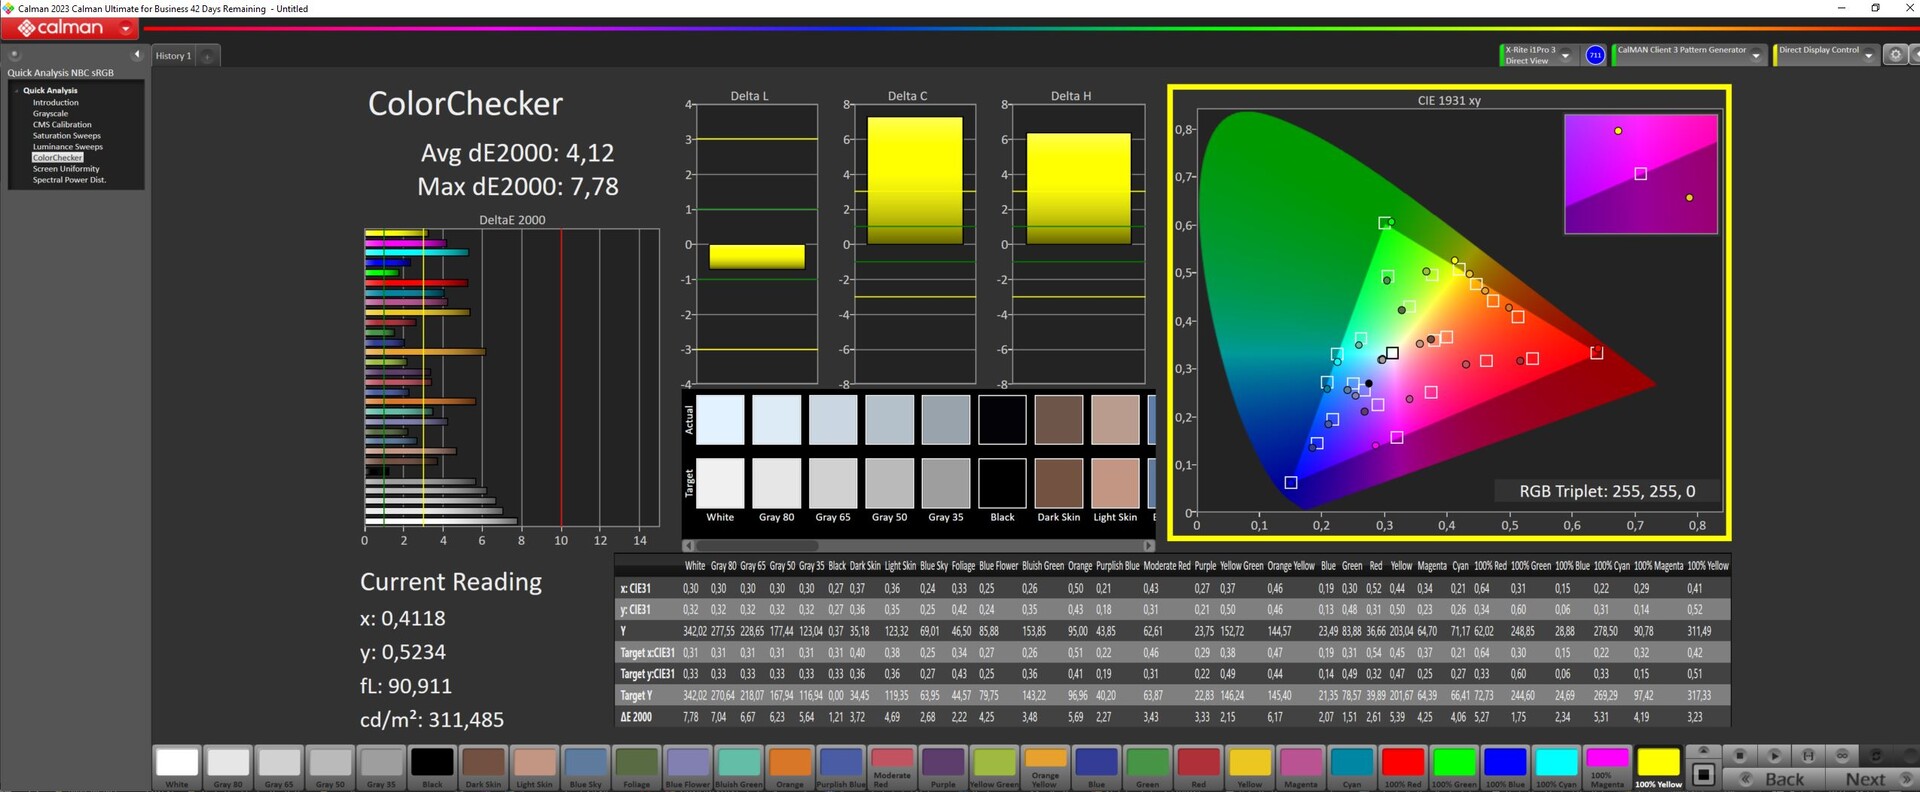
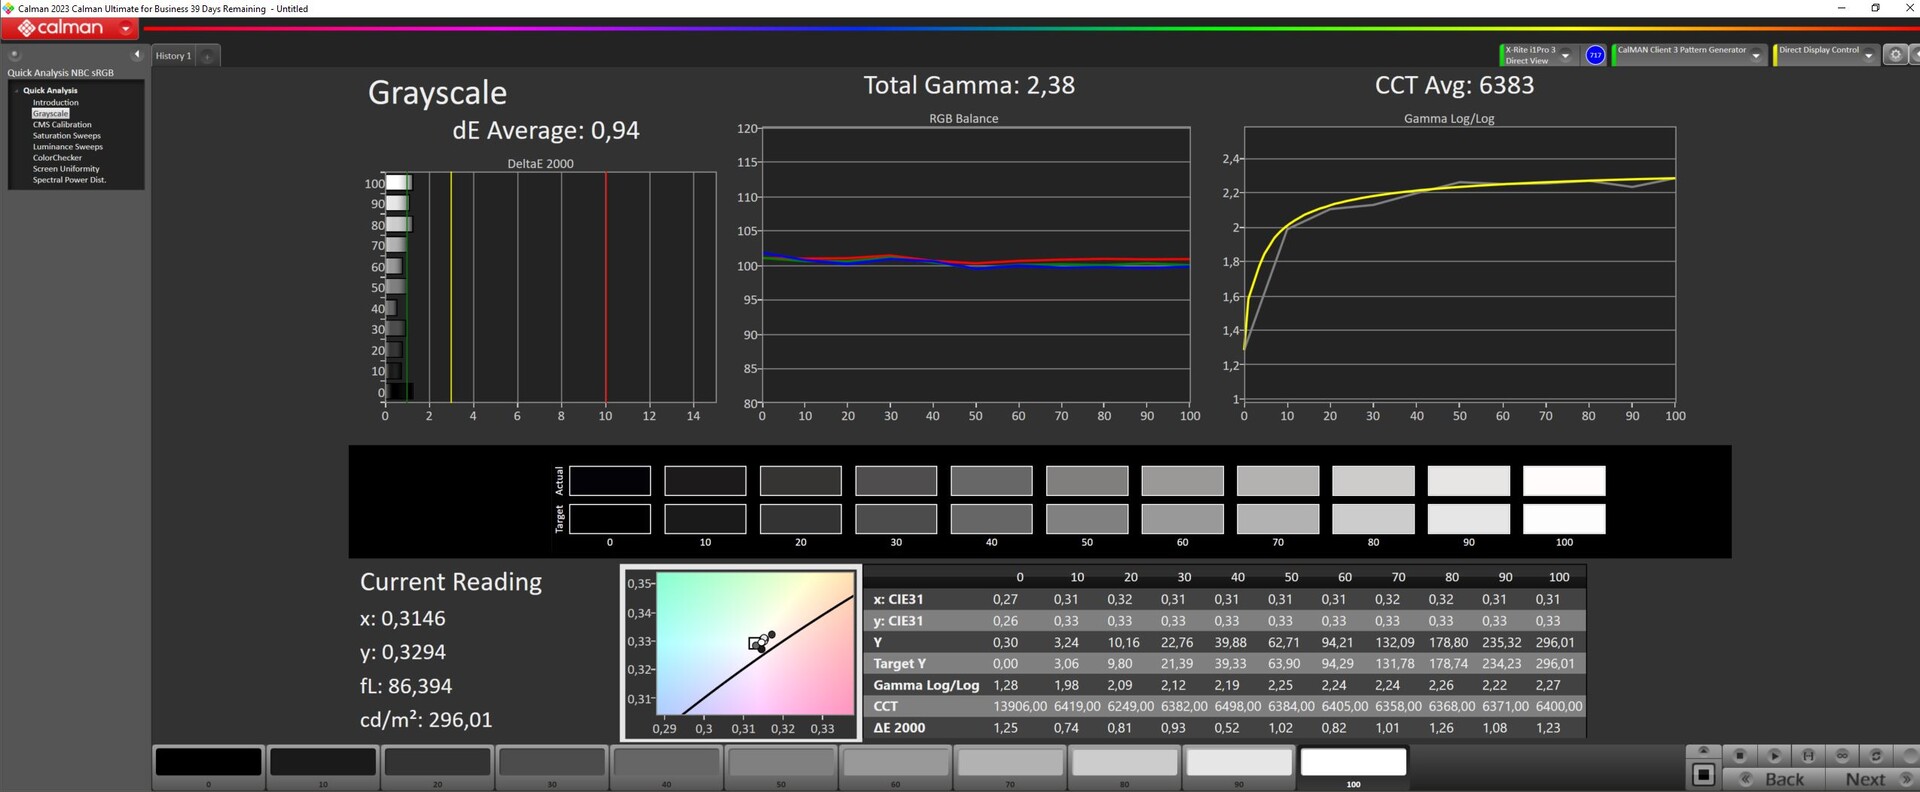
ΔE Color 4.12 | 0.5-29.43 Ø5.1, calibrated: 1.22
ΔE Greyscale 4.81 | 0.57-98 Ø5.3
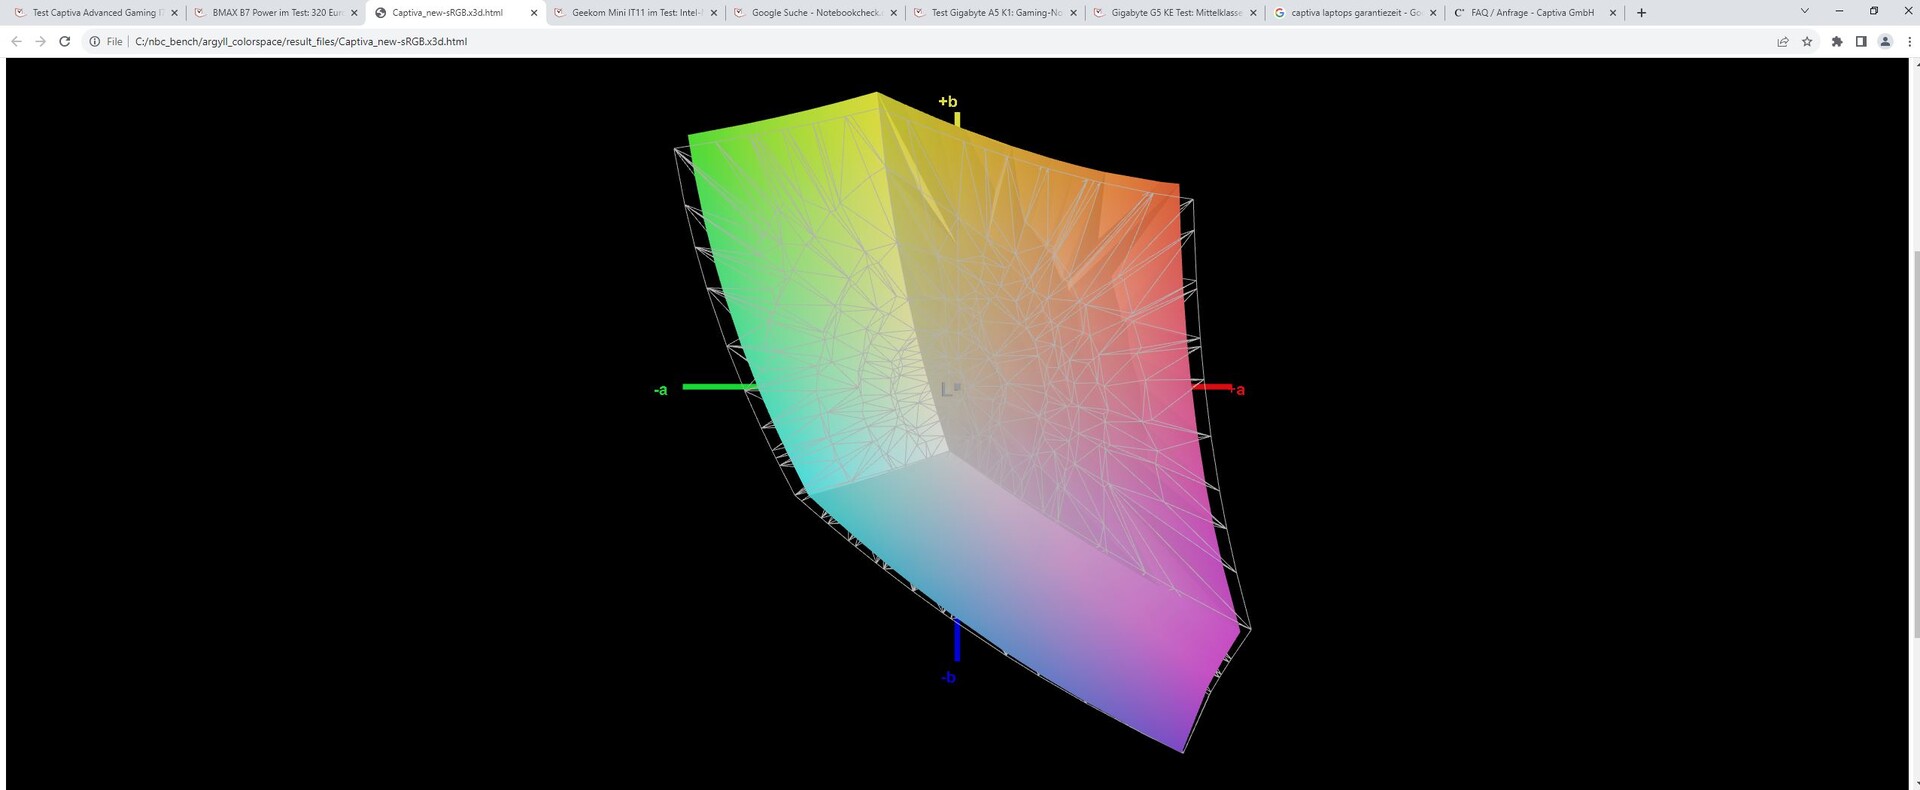
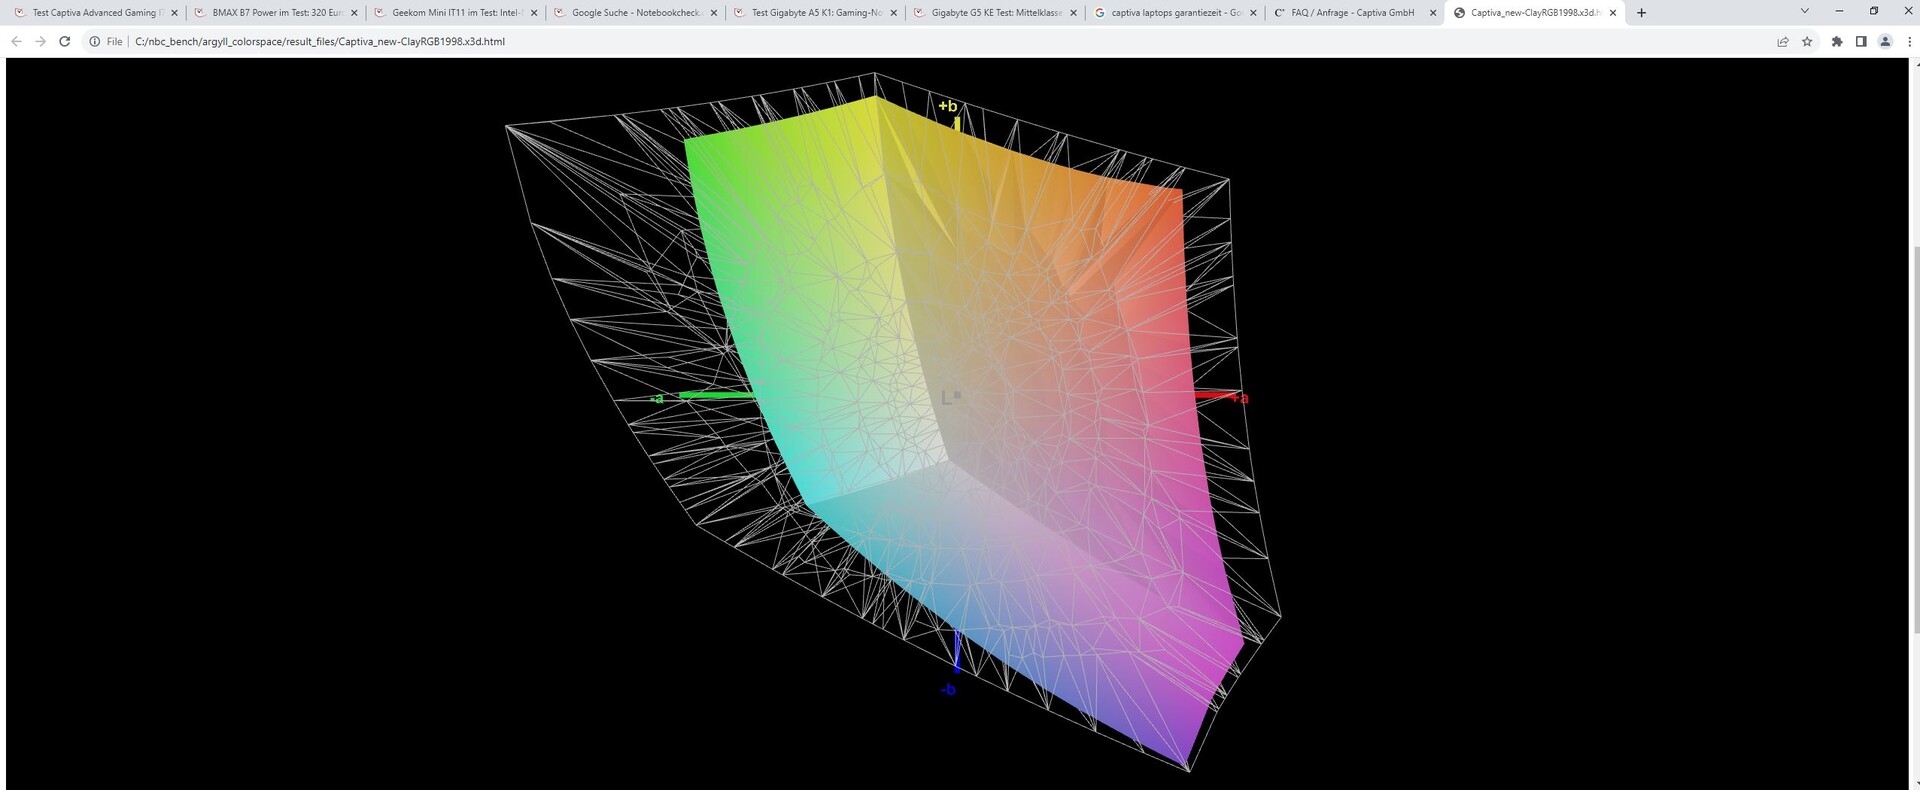
66% AdobeRGB 1998 (Argyll 2.2.0 3D)
93.2% sRGB (Argyll 2.2.0 3D)
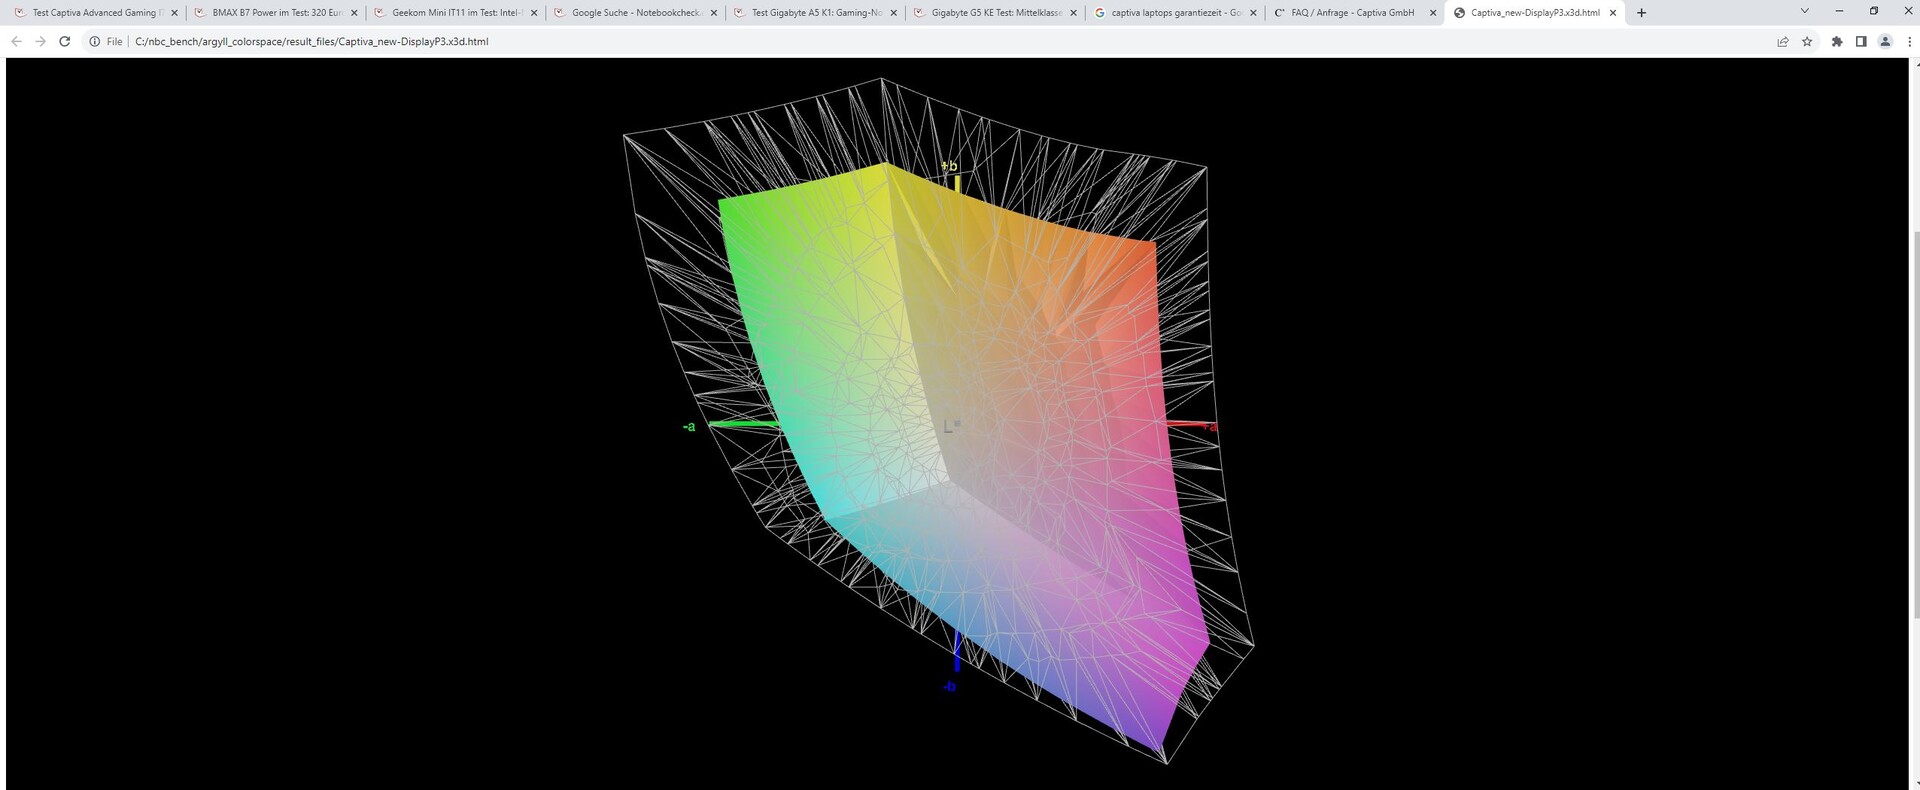
64% Display P3 (Argyll 2.2.0 3D)
Gamma: 2.31
| Captiva Advanced Gaming I74-121 BOE08B3, IPS, 1920x1080, 15.60 | MSI Cyborg 15 A12VF AU Optronics B156HAN15.1, IPS, 1920x1080, 15.60 | Dell G15 5530 AUO B156HAN, IPS, 1920x1080, 15.60 | Lenovo Legion Slim 5 16APH8 BOE NJ NE160QDM-NYC, IPS, 2560x1600, 16.00 | Lenovo LOQ 15APH8 BOE NJ NE156FHM-NX3, IPS, 1920x1080, 15.60 | SCHENKER XMG Core 15 (M22) CSOT MNF601CA1-1, IPS, 2560x1440, 15.60 | |
|---|---|---|---|---|---|---|
| Display | -34% | 11% | 7% | -36% | 7% | |
| Display P3 Coverage | 64 | 42.3 -34% | 73.1 14% | 69.3 8% | 40.2 -37% | 68.8 8% |
| sRGB Coverage | 93.2 | 62.6 -33% | 98.4 6% | 100 7% | 60.2 -35% | 99.3 7% |
| AdobeRGB 1998 Coverage | 66 | 43.7 -34% | 74.4 13% | 70 6% | 41.5 -37% | 69.9 6% |
| Response Times | -213% | 31% | -59% | -490% | -111% | |
| Response Time Grey 50% / Grey 80% * | 5 ? | 22 ? -340% | 3.39 ? 32% | 10.7 ? -114% | 42.7 ? -754% | 16 ? -220% |
| Response Time Black / White * | 7.55 ? | 14 ? -85% | 5.35 ? 29% | 7.8 ? -3% | 24.5 ? -225% | 7.6 ? -1% |
| PWM Frequency | 21620 ? | |||||
| Screen | -19% | -0% | 27% | -14% | -0% | |
| Brightness middle | 346 | 247 -29% | 320 -8% | 371.6 7% | 346.2 0% | 378 9% |
| Brightness | 324 | 234 -28% | 316 -2% | 343 6% | 329 2% | 371 15% |
| Brightness Distribution | 90 | 89 -1% | 94 4% | 84 -7% | 81 -10% | 93 3% |
| Black Level * | 0.35 | 0.25 29% | 0.21 40% | 0.44 -26% | 0.31 11% | 0.33 6% |
| Contrast | 989 | 988 0% | 1524 54% | 845 -15% | 1117 13% | 1145 16% |
| Colorchecker dE 2000 * | 4.12 | 3.78 8% | 4.55 -10% | 1.52 63% | 4.19 -2% | 2.84 31% |
| Colorchecker dE 2000 max. * | 7.78 | 6.42 17% | 9.83 -26% | 2.68 66% | 19.19 -147% | 5.51 29% |
| Colorchecker dE 2000 calibrated * | 1.22 | 3.94 -223% | 1.51 -24% | 0.33 73% | 1.66 -36% | 2.75 -125% |
| Greyscale dE 2000 * | 4.81 | 2.16 55% | 6.2 -29% | 1.2 75% | 2.6 46% | 4.08 15% |
| Gamma | 2.31 95% | 2.33 94% | 2.07 106% | 2.1 105% | 2.19 100% | 2.4 92% |
| CCT | 7633 85% | 6906 94% | 6479 100% | 6503 100% | 6749 96% | 5841 111% |
| Total Average (Program / Settings) | -89% /
-50% | 14% /
7% | -8% /
10% | -180% /
-87% | -35% /
-14% |
* ... smaller is better
The BOE panel doesn't have a terribly great color space coverage. Even sRGB is only covered by 93 per cent, DisplayP3 and AdobeRGB by about 65 per cent.
Ex works, the panel is calibrated sub-optimally and its color deviations are quite high. A calibration with the help of an XRite color measurement device and Calman software lowered the color and grayscale DeltaE values significantly. Before, deviations were above 4 and after, they measured around 1.
Our calibrated icc profile can be downloaded for free if you scroll slightly further up.


Display Response Times
| ↔ Response Time Black to White | ||
|---|---|---|
| 7.55 ms ... rise ↗ and fall ↘ combined | ↗ 3.7 ms rise | 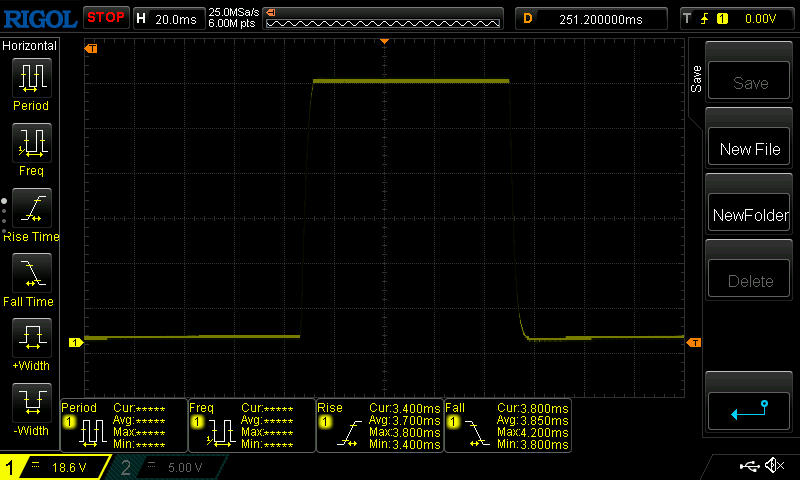 |
| ↘ 3.85 ms fall | ||
| The screen shows very fast response rates in our tests and should be very well suited for fast-paced gaming. In comparison, all tested devices range from 0.1 (minimum) to 240 (maximum) ms. » 15 % of all devices are better. This means that the measured response time is better than the average of all tested devices (21.8 ms). | ||
| ↔ Response Time 50% Grey to 80% Grey | ||
| 5 ms ... rise ↗ and fall ↘ combined | ↗ 2.422 ms rise | 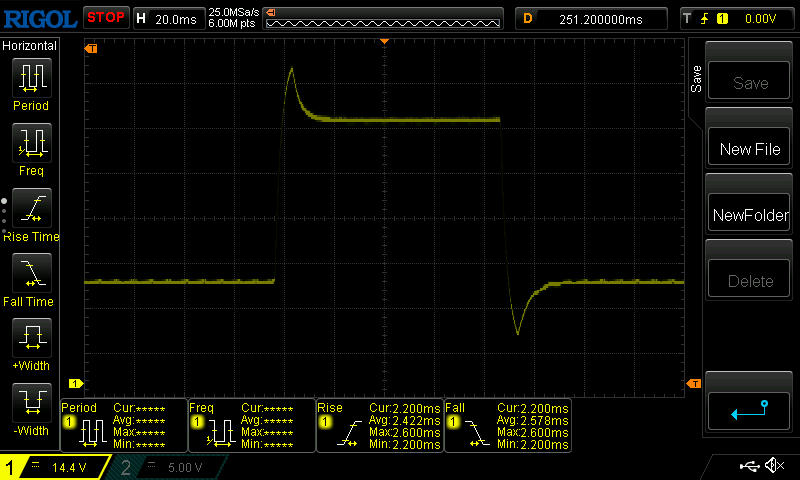 |
| ↘ 2.578 ms fall | ||
| The screen shows very fast response rates in our tests and should be very well suited for fast-paced gaming. In comparison, all tested devices range from 0.2 (minimum) to 636 (maximum) ms. » 10 % of all devices are better. This means that the measured response time is better than the average of all tested devices (34.3 ms). | ||
Screen Flickering / PWM (Pulse-Width Modulation)
| Screen flickering / PWM not detected | 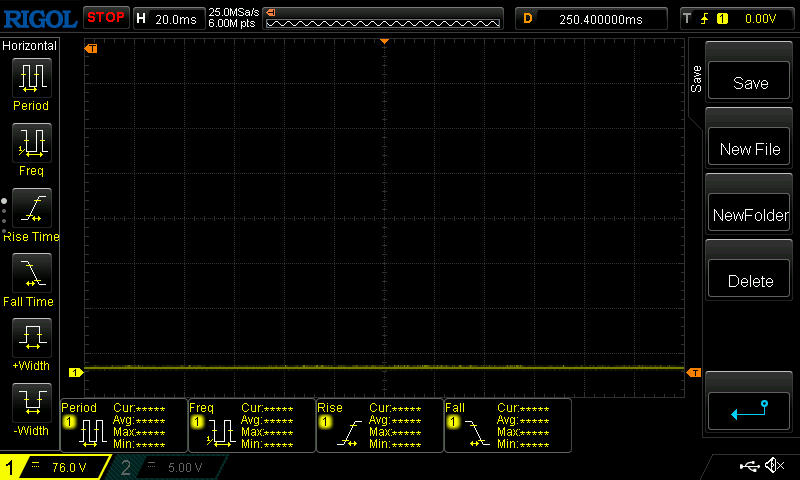 | ||
In comparison: 53 % of all tested devices do not use PWM to dim the display. If PWM was detected, an average of 18719 (minimum: 5 - maximum: 3846000) Hz was measured. | |||
Outside, you can read from the screen just fine in the shade. Its matte surface prevents most reflections and its brightness is sufficient at over 300 nits. You will definitely have to avoid direct sunlight, however.

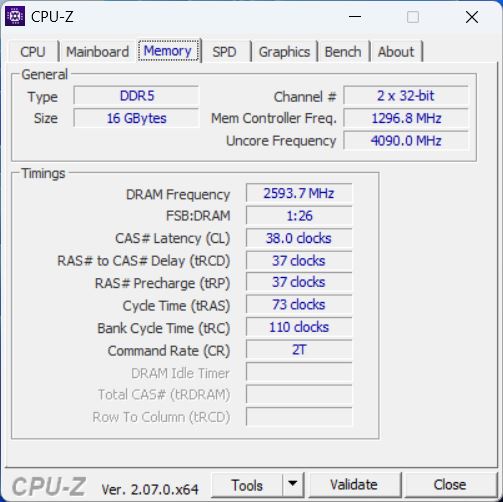
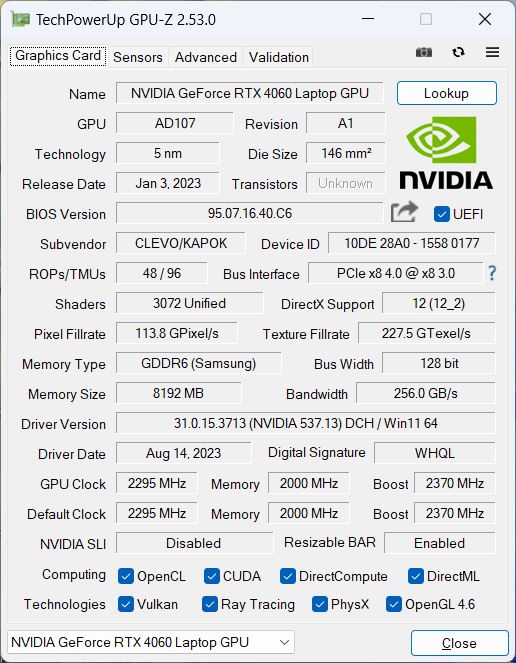
Performance - The i5-13500H with an RTX 4060 (140 W)
Our 15-inch model is fitted with a Core i5-13500H, an RTX 4060, 16 GB RAM and a 1-TB SSD, making it an introductory level to mid-range gaming laptop. Its 16:9 Full HD display and its relatively low price suggest it can be classed more as a budget device.
Alternatively, you can get the laptop with an RTX 4070 instead of an RTX 4060 - but only the 17-inch models give you the option to choose an RTX 4080 as well as the significantly faster Intel HX processors.
Testing conditions
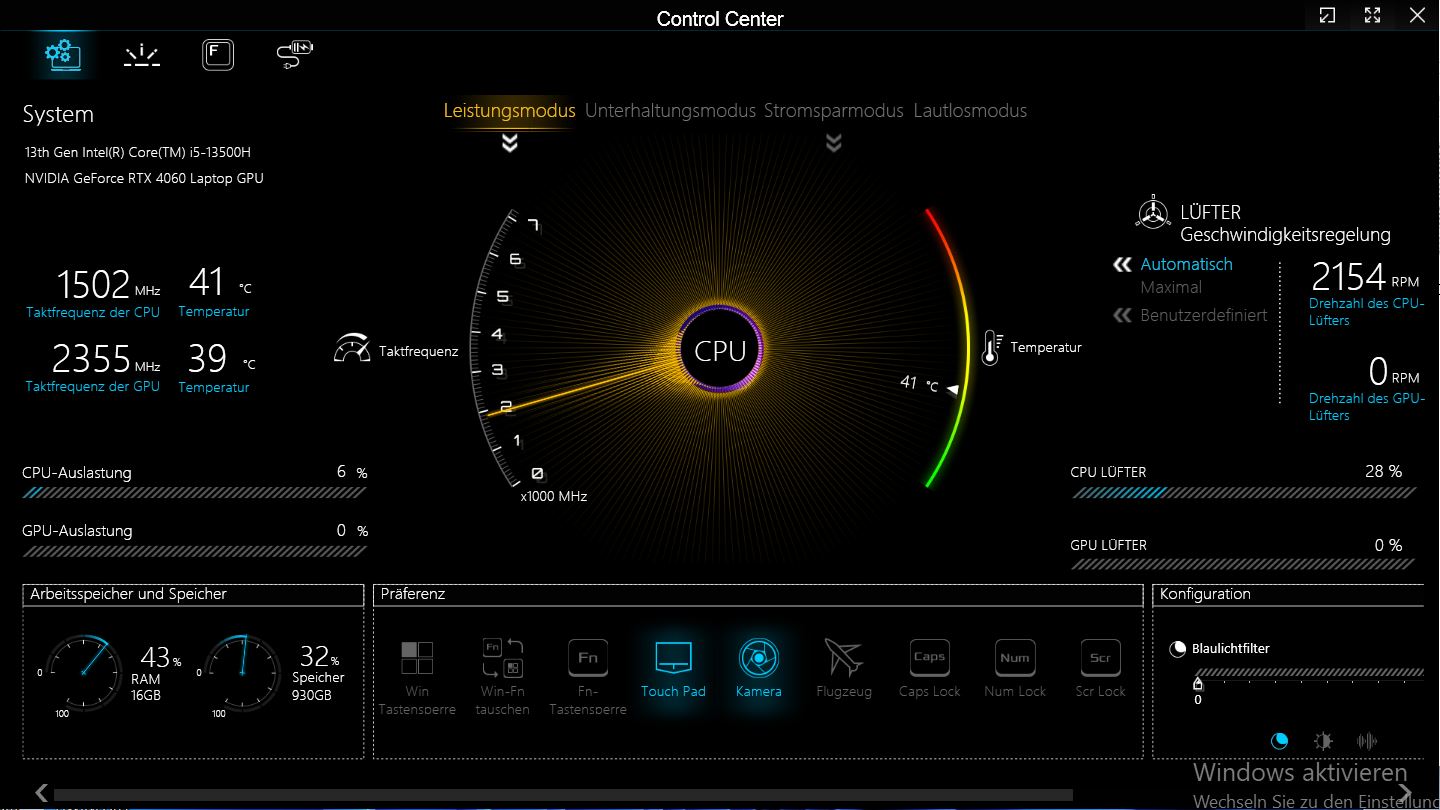
Control Center is installed onto the Captiva. There are the usual settings to control performance, keyboard, webcam and so on. Four performance modes can be chosen from: performance mode, entertainment mode, power-saving mode and silent mode.
To achieve the best benchmark results, we selected the performance mode, however, we will also be speaking a bit more about the other modes during our tests.
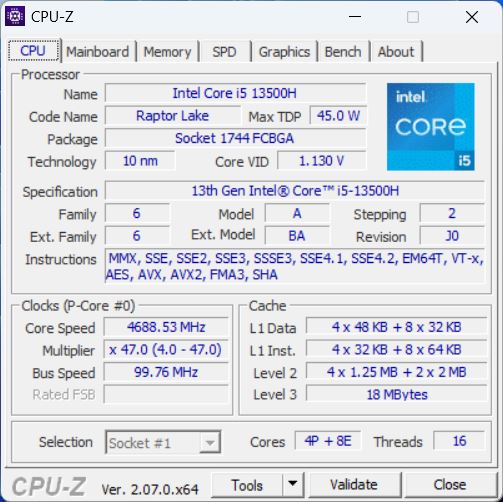
Processor
The Intel Core i5-13500H is a mid-range CPU from the Raptor Lake H series released in January 2023. The CPU features four performance cores and eight efficiency cores. This adds up to 16 threads, as only the P-cores support hyper-threading - they clock at 2.6 to 4.7 GHz (single-core boost, multicore-boost allows for a maximum of 4.6 GHz). The E-cores clock at 1.9 to 3.5 GHz.
In our Cinebench R15 loop, its performance remained very stable and we didn't note any drop in performance after the first runs.
Over the course of all the CPU tests, the i5-13500H in the Captiva achieved slightly above-average results compared to all the other laptops with the same CPU in our database. The Dell G15 with its HX CPU is still quite a bit faster but the Lenovo devices with current AMD CPUs only had a slight advantage in speed.
In battery mode, the TGP sinks to around 20 watts and the CPU's performance drops by about 50 per cent.
Cinebench R15 Multi continuous test
Cinebench R23: Multi Core | Single Core
Cinebench R20: CPU (Multi Core) | CPU (Single Core)
Cinebench R15: CPU Multi 64Bit | CPU Single 64Bit
Blender: v2.79 BMW27 CPU
7-Zip 18.03: 7z b 4 | 7z b 4 -mmt1
Geekbench 5.5: Multi-Core | Single-Core
HWBOT x265 Benchmark v2.2: 4k Preset
LibreOffice : 20 Documents To PDF
R Benchmark 2.5: Overall mean
| Cinebench R23 / Multi Core | |
| Dell G15 5530 | |
| Average of class Gaming (2435 - 34521, n=241, last 2 years) | |
| Lenovo Legion Slim 5 16APH8 | |
| Lenovo LOQ 15APH8 | |
| Captiva Advanced Gaming I74-121 | |
| Average Intel Core i5-13500H (13542 - 16335, n=3) | |
| SCHENKER XMG Core 15 (M22) | |
| MSI Cyborg 15 A12VF | |
| Cinebench R23 / Single Core | |
| Dell G15 5530 | |
| Lenovo Legion Slim 5 16APH8 | |
| Lenovo LOQ 15APH8 | |
| Captiva Advanced Gaming I74-121 | |
| MSI Cyborg 15 A12VF | |
| Average Intel Core i5-13500H (1712 - 1783, n=3) | |
| Average of class Gaming (527 - 2169, n=239, last 2 years) | |
| SCHENKER XMG Core 15 (M22) | |
| Cinebench R20 / CPU (Multi Core) | |
| Dell G15 5530 | |
| Average of class Gaming (930 - 13769, n=239, last 2 years) | |
| Lenovo Legion Slim 5 16APH8 | |
| Lenovo LOQ 15APH8 | |
| Captiva Advanced Gaming I74-121 | |
| Average Intel Core i5-13500H (5108 - 6212, n=3) | |
| SCHENKER XMG Core 15 (M22) | |
| MSI Cyborg 15 A12VF | |
| Cinebench R20 / CPU (Single Core) | |
| Dell G15 5530 | |
| Lenovo Legion Slim 5 16APH8 | |
| Lenovo LOQ 15APH8 | |
| Captiva Advanced Gaming I74-121 | |
| MSI Cyborg 15 A12VF | |
| Average Intel Core i5-13500H (661 - 687, n=3) | |
| Average of class Gaming (169 - 825, n=239, last 2 years) | |
| SCHENKER XMG Core 15 (M22) | |
| Cinebench R15 / CPU Multi 64Bit | |
| Dell G15 5530 | |
| Average of class Gaming (400 - 5663, n=245, last 2 years) | |
| Lenovo LOQ 15APH8 | |
| Lenovo Legion Slim 5 16APH8 | |
| Captiva Advanced Gaming I74-121 | |
| SCHENKER XMG Core 15 (M22) | |
| Average Intel Core i5-13500H (2234 - 2475, n=3) | |
| MSI Cyborg 15 A12VF | |
| Cinebench R15 / CPU Single 64Bit | |
| Lenovo Legion Slim 5 16APH8 | |
| Lenovo LOQ 15APH8 | |
| Dell G15 5530 | |
| Captiva Advanced Gaming I74-121 | |
| Average of class Gaming (79.2 - 312, n=244, last 2 years) | |
| Average Intel Core i5-13500H (249 - 261, n=3) | |
| SCHENKER XMG Core 15 (M22) | |
| MSI Cyborg 15 A12VF | |
| Blender / v2.79 BMW27 CPU | |
| MSI Cyborg 15 A12VF | |
| Average Intel Core i5-13500H (205 - 263, n=4) | |
| Average of class Gaming (91 - 1259, n=237, last 2 years) | |
| SCHENKER XMG Core 15 (M22) | |
| Captiva Advanced Gaming I74-121 | |
| Lenovo LOQ 15APH8 | |
| Lenovo Legion Slim 5 16APH8 | |
| Dell G15 5530 | |
| 7-Zip 18.03 / 7z b 4 | |
| Dell G15 5530 | |
| Average of class Gaming (11386 - 140932, n=236, last 2 years) | |
| Lenovo Legion Slim 5 16APH8 | |
| SCHENKER XMG Core 15 (M22) | |
| Lenovo LOQ 15APH8 | |
| Captiva Advanced Gaming I74-121 | |
| MSI Cyborg 15 A12VF | |
| Average Intel Core i5-13500H (50846 - 57276, n=4) | |
| 7-Zip 18.03 / 7z b 4 -mmt1 | |
| Lenovo Legion Slim 5 16APH8 | |
| Lenovo LOQ 15APH8 | |
| Average of class Gaming (2685 - 7581, n=237, last 2 years) | |
| Captiva Advanced Gaming I74-121 | |
| Dell G15 5530 | |
| SCHENKER XMG Core 15 (M22) | |
| MSI Cyborg 15 A12VF | |
| Average Intel Core i5-13500H (5606 - 5885, n=4) | |
| Geekbench 5.5 / Multi-Core | |
| Dell G15 5530 | |
| Average of class Gaming (1946 - 22200, n=243, last 2 years) | |
| Lenovo Legion Slim 5 16APH8 | |
| MSI Cyborg 15 A12VF | |
| Average Intel Core i5-13500H (9312 - 11465, n=4) | |
| Captiva Advanced Gaming I74-121 | |
| SCHENKER XMG Core 15 (M22) | |
| Lenovo LOQ 15APH8 | |
| Geekbench 5.5 / Single-Core | |
| Lenovo Legion Slim 5 16APH8 | |
| Dell G15 5530 | |
| Lenovo LOQ 15APH8 | |
| MSI Cyborg 15 A12VF | |
| Captiva Advanced Gaming I74-121 | |
| Average of class Gaming (158 - 2139, n=243, last 2 years) | |
| Average Intel Core i5-13500H (1674 - 1762, n=4) | |
| SCHENKER XMG Core 15 (M22) | |
| HWBOT x265 Benchmark v2.2 / 4k Preset | |
| Dell G15 5530 | |
| Lenovo Legion Slim 5 16APH8 | |
| Average of class Gaming (3 - 37.6, n=240, last 2 years) | |
| SCHENKER XMG Core 15 (M22) | |
| Captiva Advanced Gaming I74-121 | |
| Lenovo LOQ 15APH8 | |
| MSI Cyborg 15 A12VF | |
| MSI Cyborg 15 A12VF | |
| Average Intel Core i5-13500H (14.6 - 17.9, n=4) | |
| LibreOffice / 20 Documents To PDF | |
| SCHENKER XMG Core 15 (M22) | |
| Captiva Advanced Gaming I74-121 | |
| Average of class Gaming (32.8 - 332, n=235, last 2 years) | |
| Average Intel Core i5-13500H (44 - 54.3, n=3) | |
| Dell G15 5530 | |
| Lenovo LOQ 15APH8 | |
| MSI Cyborg 15 A12VF | |
| Lenovo Legion Slim 5 16APH8 | |
| R Benchmark 2.5 / Overall mean | |
| Average of class Gaming (0.375 - 4.47, n=237, last 2 years) | |
| Captiva Advanced Gaming I74-121 | |
| Average Intel Core i5-13500H (0.471 - 0.491, n=4) | |
| SCHENKER XMG Core 15 (M22) | |
| MSI Cyborg 15 A12VF | |
| Lenovo LOQ 15APH8 | |
| Lenovo Legion Slim 5 16APH8 | |
| Dell G15 5530 | |
* ... smaller is better
AIDA64: FP32 Ray-Trace | FPU Julia | CPU SHA3 | CPU Queen | FPU SinJulia | FPU Mandel | CPU AES | CPU ZLib | FP64 Ray-Trace | CPU PhotoWorxx
| AIDA64 / FP32 Ray-Trace | |
| Lenovo LOQ 15APH8 | |
| Lenovo Legion Slim 5 16APH8 | |
| Dell G15 5530 | |
| SCHENKER XMG Core 15 (M22) | |
| Average of class Gaming (2585 - 55084, n=233, last 2 years) | |
| Captiva Advanced Gaming I74-121 | |
| Average Intel Core i5-13500H (11081 - 15390, n=4) | |
| MSI Cyborg 15 A12VF | |
| AIDA64 / FPU Julia | |
| Lenovo LOQ 15APH8 | |
| Lenovo Legion Slim 5 16APH8 | |
| SCHENKER XMG Core 15 (M22) | |
| Dell G15 5530 | |
| Average of class Gaming (12439 - 234848, n=233, last 2 years) | |
| Captiva Advanced Gaming I74-121 | |
| MSI Cyborg 15 A12VF | |
| Average Intel Core i5-13500H (56813 - 74251, n=4) | |
| AIDA64 / CPU SHA3 | |
| Lenovo LOQ 15APH8 | |
| Lenovo Legion Slim 5 16APH8 | |
| Dell G15 5530 | |
| Average of class Gaming (629 - 9930, n=233, last 2 years) | |
| Captiva Advanced Gaming I74-121 | |
| SCHENKER XMG Core 15 (M22) | |
| Average Intel Core i5-13500H (2768 - 3623, n=4) | |
| MSI Cyborg 15 A12VF | |
| AIDA64 / CPU Queen | |
| Lenovo Legion Slim 5 16APH8 | |
| Lenovo LOQ 15APH8 | |
| Dell G15 5530 | |
| Average of class Gaming (15371 - 186519, n=233, last 2 years) | |
| SCHENKER XMG Core 15 (M22) | |
| Captiva Advanced Gaming I74-121 | |
| MSI Cyborg 15 A12VF | |
| Average Intel Core i5-13500H (79924 - 85727, n=4) | |
| AIDA64 / FPU SinJulia | |
| Lenovo Legion Slim 5 16APH8 | |
| Lenovo LOQ 15APH8 | |
| SCHENKER XMG Core 15 (M22) | |
| Average of class Gaming (2137 - 30810, n=233, last 2 years) | |
| Dell G15 5530 | |
| MSI Cyborg 15 A12VF | |
| Captiva Advanced Gaming I74-121 | |
| Average Intel Core i5-13500H (7249 - 8086, n=4) | |
| AIDA64 / FPU Mandel | |
| Lenovo LOQ 15APH8 | |
| Lenovo Legion Slim 5 16APH8 | |
| SCHENKER XMG Core 15 (M22) | |
| Dell G15 5530 | |
| Average of class Gaming (7135 - 124377, n=233, last 2 years) | |
| Captiva Advanced Gaming I74-121 | |
| Average Intel Core i5-13500H (27820 - 38336, n=4) | |
| MSI Cyborg 15 A12VF | |
| AIDA64 / CPU AES | |
| Captiva Advanced Gaming I74-121 | |
| Average Intel Core i5-13500H (99649 - 120493, n=4) | |
| Average of class Gaming (18146 - 328679, n=233, last 2 years) | |
| Dell G15 5530 | |
| Lenovo LOQ 15APH8 | |
| Lenovo Legion Slim 5 16APH8 | |
| SCHENKER XMG Core 15 (M22) | |
| MSI Cyborg 15 A12VF | |
| AIDA64 / CPU ZLib | |
| Dell G15 5530 | |
| Lenovo LOQ 15APH8 | |
| Lenovo Legion Slim 5 16APH8 | |
| Average of class Gaming (150.9 - 2231, n=233, last 2 years) | |
| Captiva Advanced Gaming I74-121 | |
| SCHENKER XMG Core 15 (M22) | |
| MSI Cyborg 15 A12VF | |
| Average Intel Core i5-13500H (782 - 987, n=4) | |
| AIDA64 / FP64 Ray-Trace | |
| Lenovo LOQ 15APH8 | |
| Lenovo Legion Slim 5 16APH8 | |
| Dell G15 5530 | |
| SCHENKER XMG Core 15 (M22) | |
| Average of class Gaming (1437 - 29473, n=233, last 2 years) | |
| Captiva Advanced Gaming I74-121 | |
| Average Intel Core i5-13500H (5955 - 8495, n=4) | |
| MSI Cyborg 15 A12VF | |
| AIDA64 / CPU PhotoWorxx | |
| Dell G15 5530 | |
| MSI Cyborg 15 A12VF | |
| Average of class Gaming (8341 - 60161, n=234, last 2 years) | |
| Lenovo Legion Slim 5 16APH8 | |
| SCHENKER XMG Core 15 (M22) | |
| Average Intel Core i5-13500H (20212 - 37618, n=4) | |
| Captiva Advanced Gaming I74-121 | |
| Lenovo LOQ 15APH8 | |
System Performance
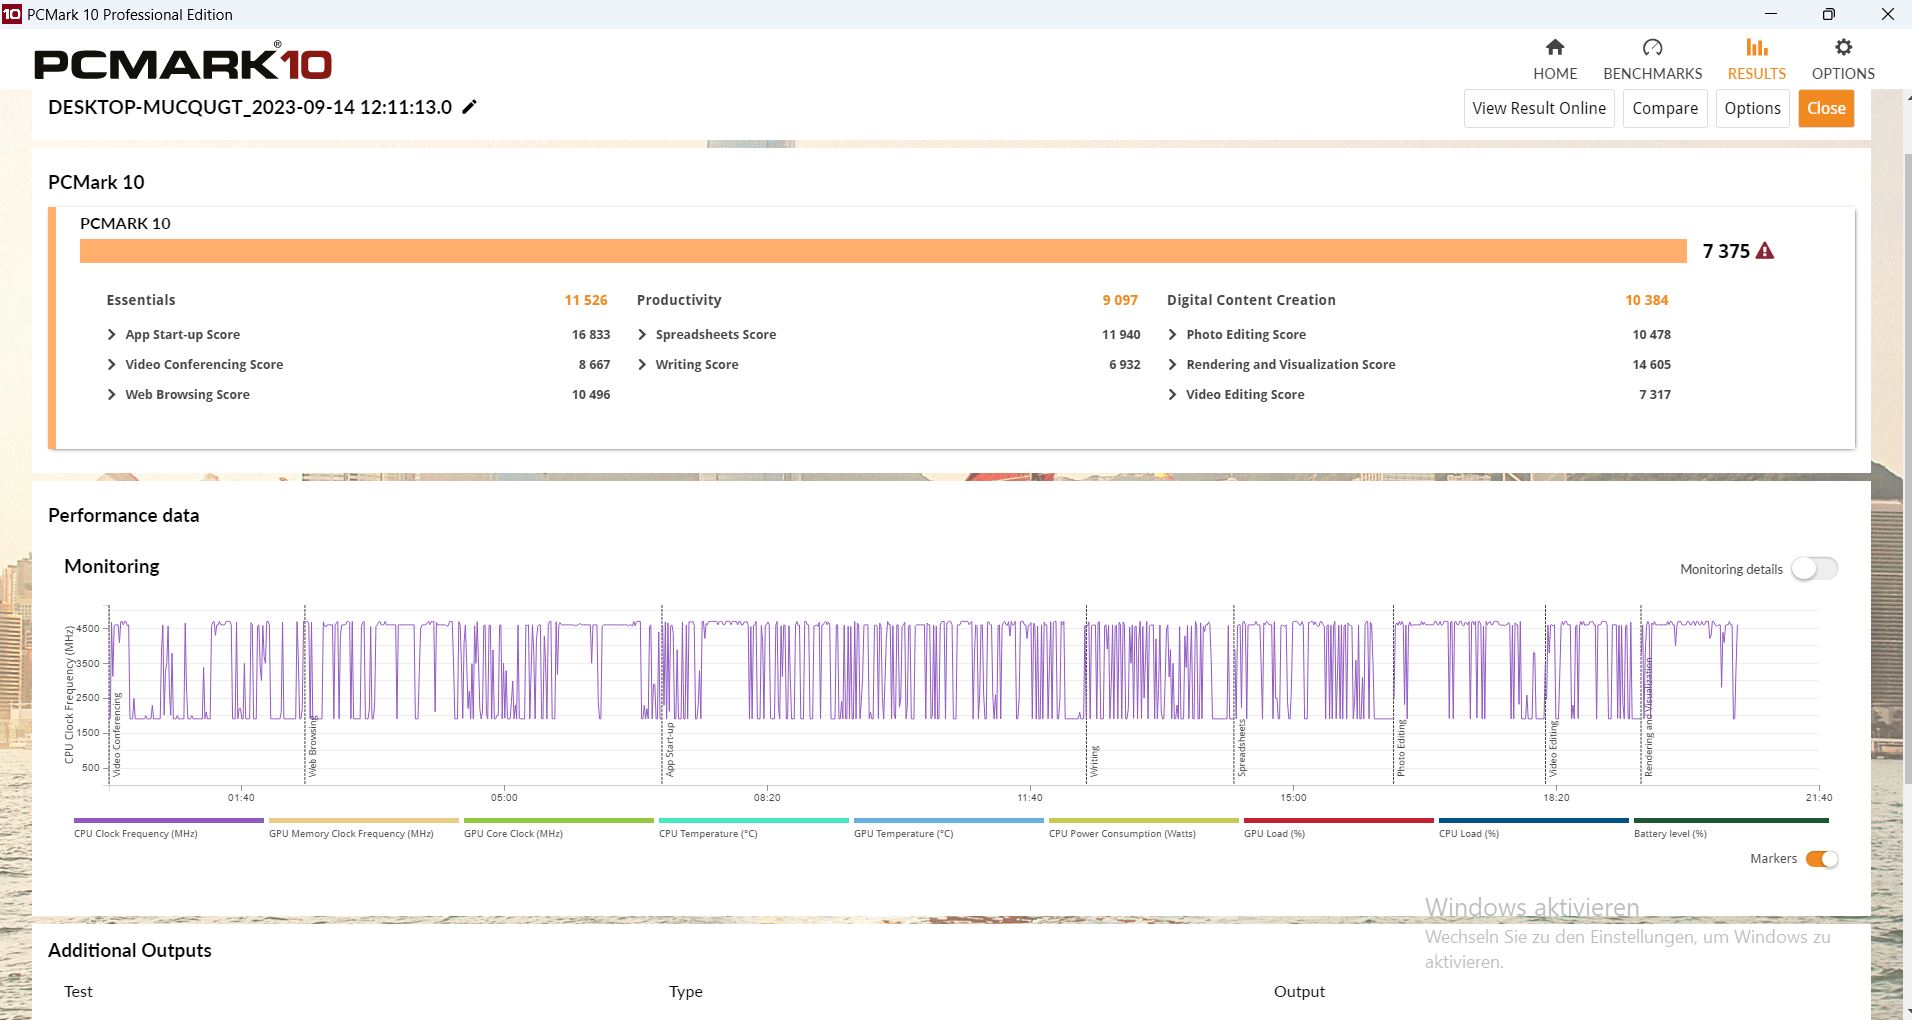
The Captiva laptop's PCMark score was as expected. In the Essentials subtest, it even came out on top. In turn, the laptop weakened in productivity, which is likely due to its slightly slower RAM, as shown by AIDA. All-in-all, the device achieved upper average results for a gaming laptop.
CrossMark: Overall | Productivity | Creativity | Responsiveness
| PCMark 10 / Essentials | |
| Captiva Advanced Gaming I74-121 | |
| Average Intel Core i5-13500H, NVIDIA GeForce RTX 4060 Laptop GPU | |
| Lenovo Legion Slim 5 16APH8 | |
| Dell G15 5530 | |
| SCHENKER XMG Core 15 (M22) | |
| MSI Cyborg 15 A12VF | |
| Average of class Gaming (7334 - 12176, n=200, last 2 years) | |
| Lenovo LOQ 15APH8 | |
| PCMark 10 / Productivity | |
| Lenovo Legion Slim 5 16APH8 | |
| Dell G15 5530 | |
| Lenovo LOQ 15APH8 | |
| MSI Cyborg 15 A12VF | |
| Average of class Gaming (6161 - 11833, n=200, last 2 years) | |
| SCHENKER XMG Core 15 (M22) | |
| Captiva Advanced Gaming I74-121 | |
| Average Intel Core i5-13500H, NVIDIA GeForce RTX 4060 Laptop GPU | |
| PCMark 10 / Digital Content Creation | |
| Lenovo Legion Slim 5 16APH8 | |
| Lenovo LOQ 15APH8 | |
| Average of class Gaming (5288 - 16424, n=200, last 2 years) | |
| Captiva Advanced Gaming I74-121 | |
| Average Intel Core i5-13500H, NVIDIA GeForce RTX 4060 Laptop GPU | |
| SCHENKER XMG Core 15 (M22) | |
| MSI Cyborg 15 A12VF | |
| Dell G15 5530 | |
| CrossMark / Productivity | |
| Average of class Gaming (907 - 2166, n=158, last 2 years) | |
| Lenovo Legion Slim 5 16APH8 | |
| Dell G15 5530 | |
| MSI Cyborg 15 A12VF | |
| Captiva Advanced Gaming I74-121 | |
| Average Intel Core i5-13500H, NVIDIA GeForce RTX 4060 Laptop GPU | |
| Lenovo LOQ 15APH8 | |
| SCHENKER XMG Core 15 (M22) | |
| CrossMark / Creativity | |
| Dell G15 5530 | |
| Average of class Gaming (1027 - 2514, n=158, last 2 years) | |
| Lenovo Legion Slim 5 16APH8 | |
| MSI Cyborg 15 A12VF | |
| SCHENKER XMG Core 15 (M22) | |
| Captiva Advanced Gaming I74-121 | |
| Average Intel Core i5-13500H, NVIDIA GeForce RTX 4060 Laptop GPU | |
| Lenovo LOQ 15APH8 | |
| CrossMark / Responsiveness | |
| Average of class Gaming (1029 - 2275, n=158, last 2 years) | |
| MSI Cyborg 15 A12VF | |
| Captiva Advanced Gaming I74-121 | |
| Average Intel Core i5-13500H, NVIDIA GeForce RTX 4060 Laptop GPU | |
| Dell G15 5530 | |
| Lenovo Legion Slim 5 16APH8 | |
| Lenovo LOQ 15APH8 | |
| SCHENKER XMG Core 15 (M22) | |
| PCMark 10 Score | 7375 points | |
Help | ||
| AIDA64 / Memory Copy | |
| Lenovo Legion Slim 5 16APH8 | |
| Dell G15 5530 | |
| MSI Cyborg 15 A12VF | |
| Average of class Gaming (18074 - 88014, n=233, last 2 years) | |
| SCHENKER XMG Core 15 (M22) | |
| Average Intel Core i5-13500H (36916 - 57830, n=4) | |
| Captiva Advanced Gaming I74-121 | |
| Lenovo LOQ 15APH8 | |
| AIDA64 / Memory Read | |
| Dell G15 5530 | |
| MSI Cyborg 15 A12VF | |
| Lenovo Legion Slim 5 16APH8 | |
| Average of class Gaming (20318 - 89096, n=233, last 2 years) | |
| Average Intel Core i5-13500H (41676 - 65633, n=4) | |
| SCHENKER XMG Core 15 (M22) | |
| Captiva Advanced Gaming I74-121 | |
| Lenovo LOQ 15APH8 | |
| AIDA64 / Memory Write | |
| Lenovo Legion Slim 5 16APH8 | |
| Dell G15 5530 | |
| Average of class Gaming (15975 - 103259, n=233, last 2 years) | |
| MSI Cyborg 15 A12VF | |
| SCHENKER XMG Core 15 (M22) | |
| Average Intel Core i5-13500H (36826 - 60439, n=4) | |
| Captiva Advanced Gaming I74-121 | |
| Lenovo LOQ 15APH8 | |
| AIDA64 / Memory Latency | |
| Lenovo LOQ 15APH8 | |
| Lenovo Legion Slim 5 16APH8 | |
| Average Intel Core i5-13500H (86.2 - 95.4, n=4) | |
| MSI Cyborg 15 A12VF | |
| Dell G15 5530 | |
| Captiva Advanced Gaming I74-121 | |
| SCHENKER XMG Core 15 (M22) | |
| Average of class Gaming (76.2 - 136.8, n=230, last 2 years) | |
* ... smaller is better
DPC latency
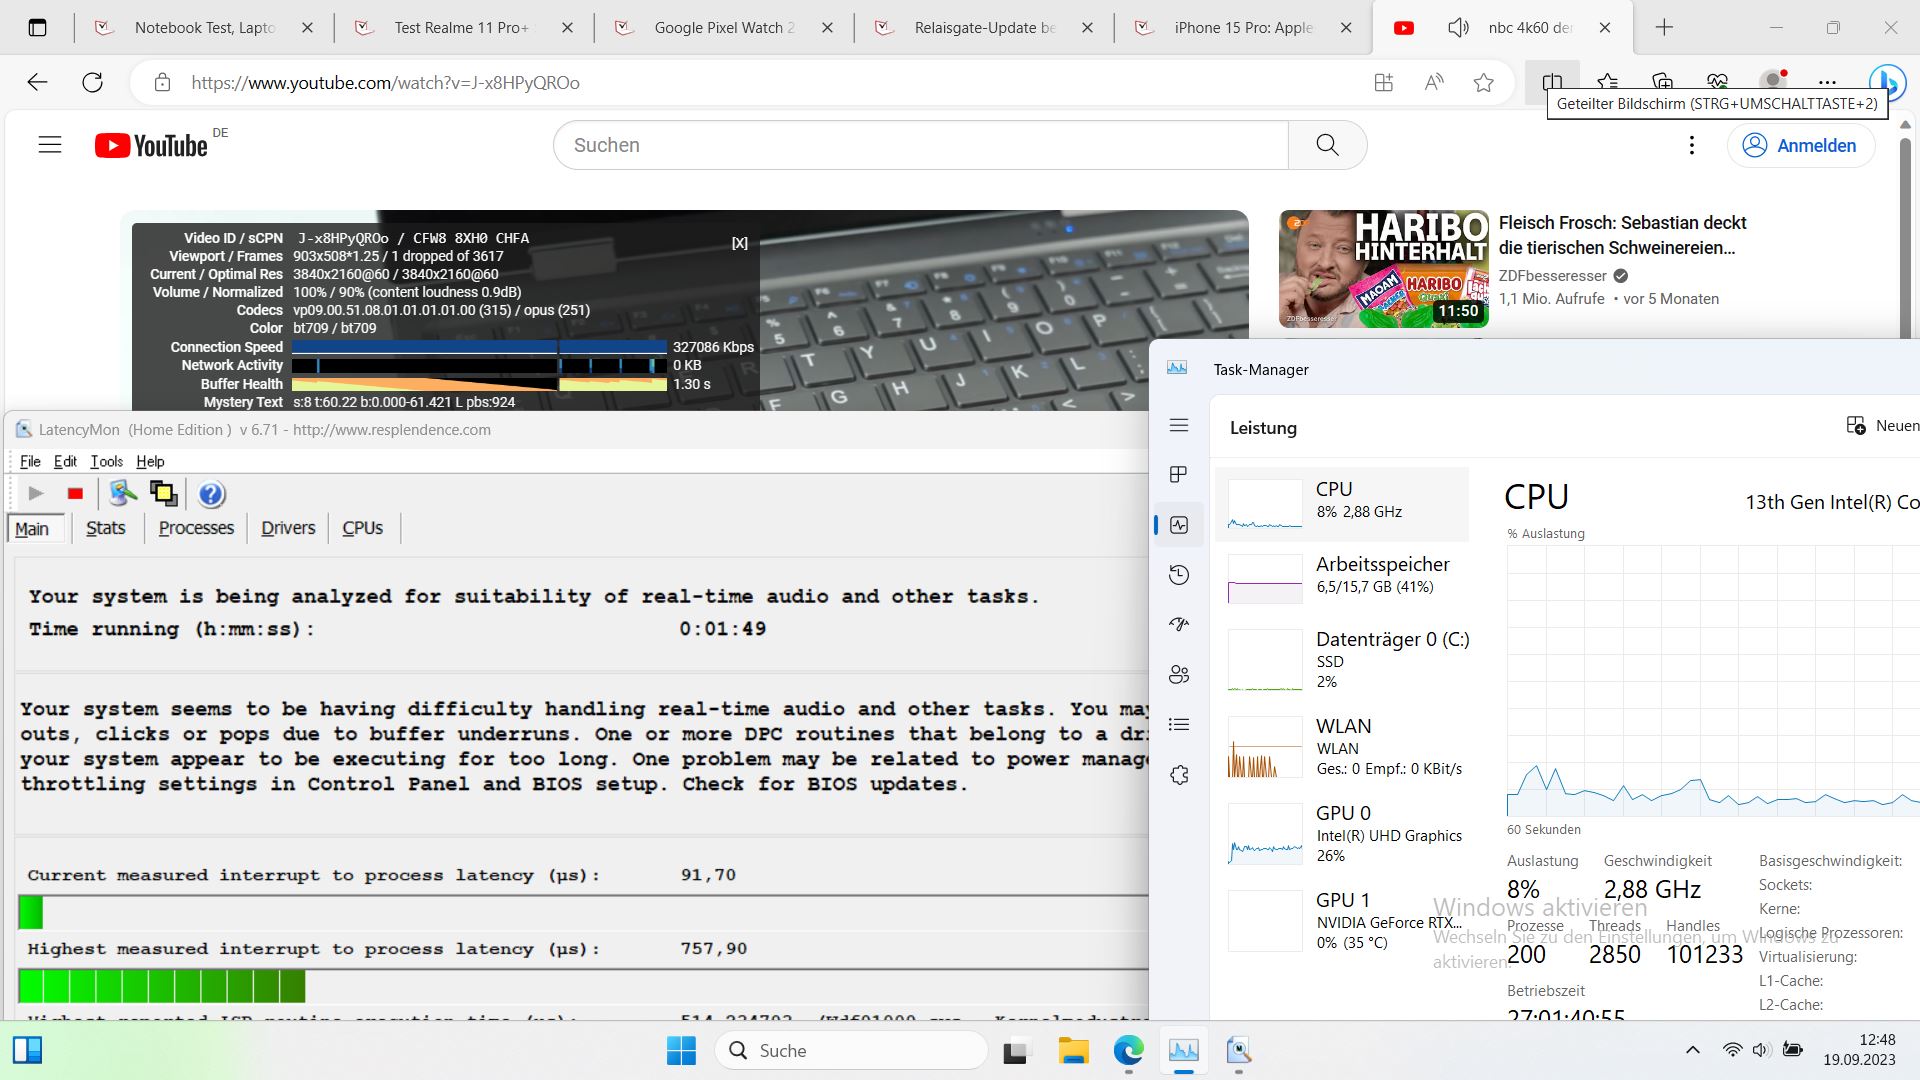
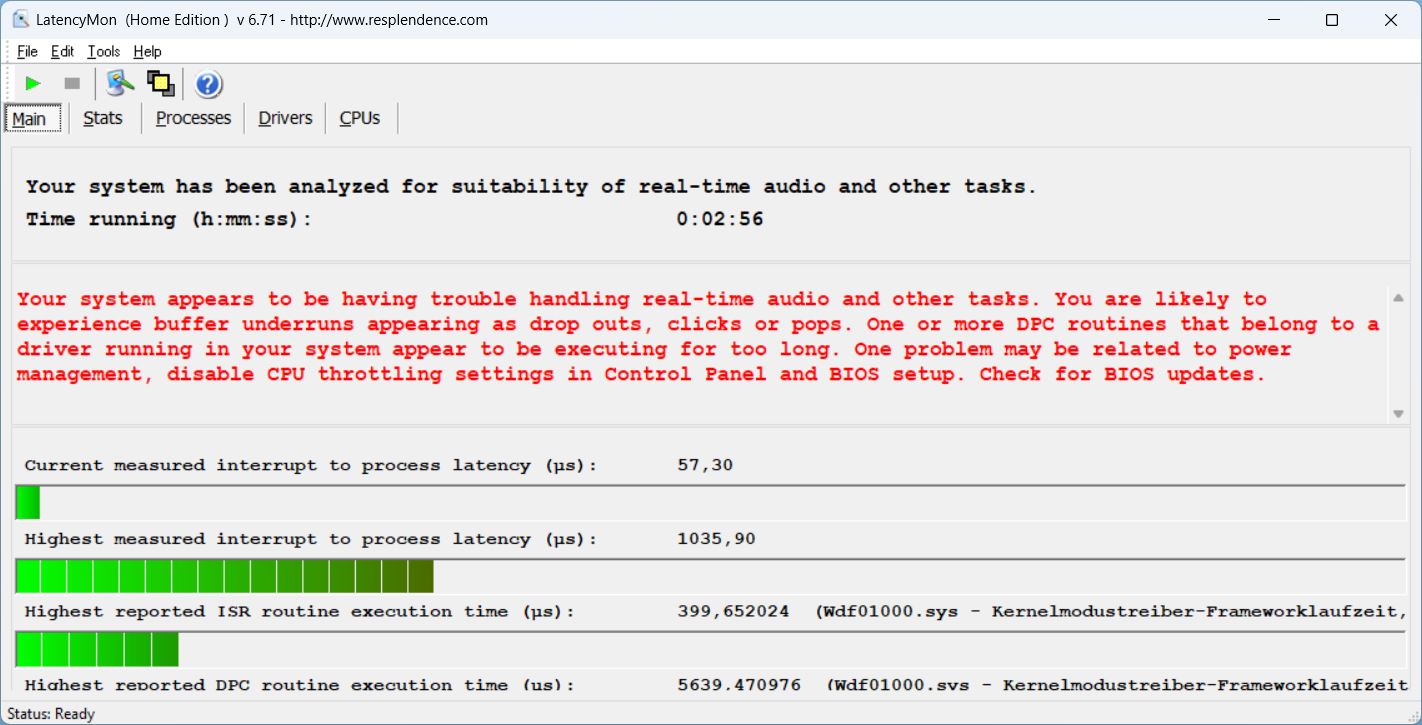
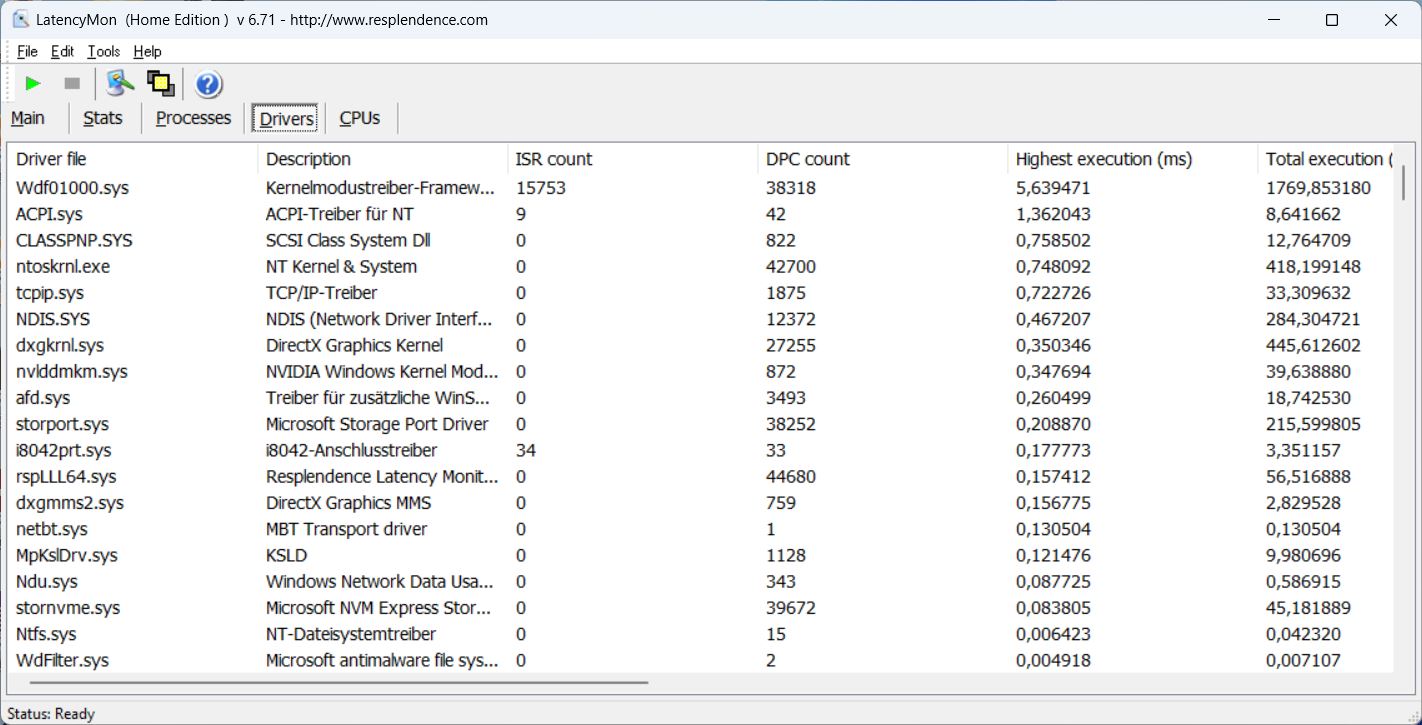
When opening multiple browser tabs or our website, the Captiva showed no issues - even with multiple tabs. The first small issues were seen when opening our 4K/60 fps YouTube video. The latencies were relatively low - with the exception of one dropped frame, the video was played smoothly.
| DPC Latencies / LatencyMon - interrupt to process latency (max), Web, Youtube, Prime95 | |
| Dell G15 5530 | |
| SCHENKER XMG Core 15 (M22) | |
| Lenovo LOQ 15APH8 | |
| MSI Cyborg 15 A12VF | |
| Captiva Advanced Gaming I74-121 | |
| Lenovo Legion Slim 5 16APH8 | |
* ... smaller is better
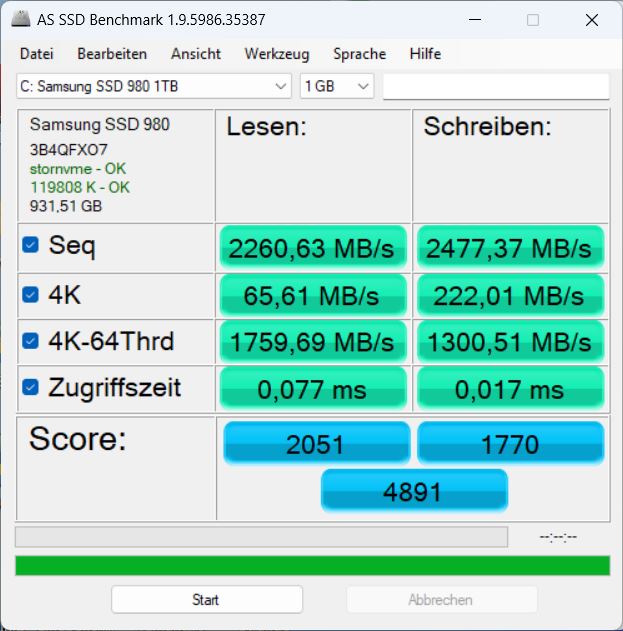
Storage devices
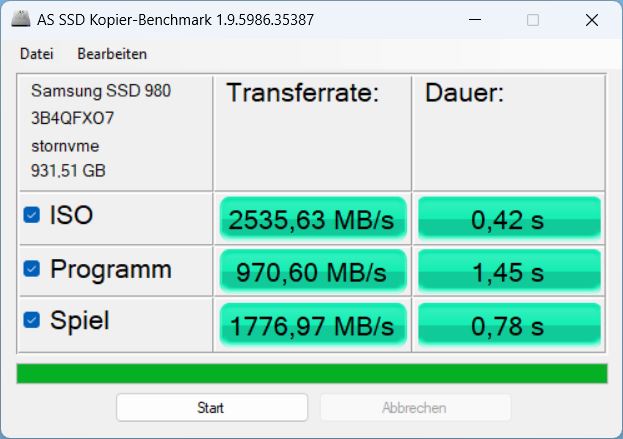
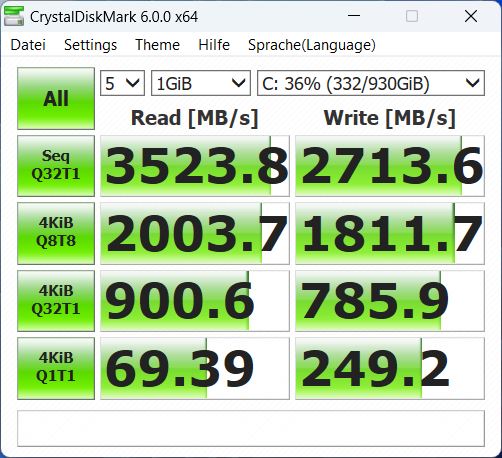
Captiva doesn't show any weaknesses when it comes to mass storage. In our test model, a very well-known Samsung SSD 980 with 1 TB of storage is installed. It may still be from the PCIe 3.0 generation, but it is one of its best models. By now, there are also some faster SSDs (as our comparison shows), but this storage device still achieved upper average results.
Inside the Captiva, the SSD performed about 10 per cent faster than the average model (Samsung 980 1 TB) from our database and in addition, its performance was constant over a longer period of time and thermal throttling was never an issue.

* ... smaller is better
Reading continuous performance: DiskSpd Read Loop, Queue Depth 8
Graphics card
The Captiva relies on the Nvidia Geforce RTX 4060 as a graphics card and it has access to up to 140 watts including Dynamic Boost.
While the processor's performance was in the lower average field, the laptop's 3DMark benchmark results led it to come out on top - only the Dell G15 was able to keep up. The LOQ 15 and the Cyborg 15 with the same GPU were clearly beaten.
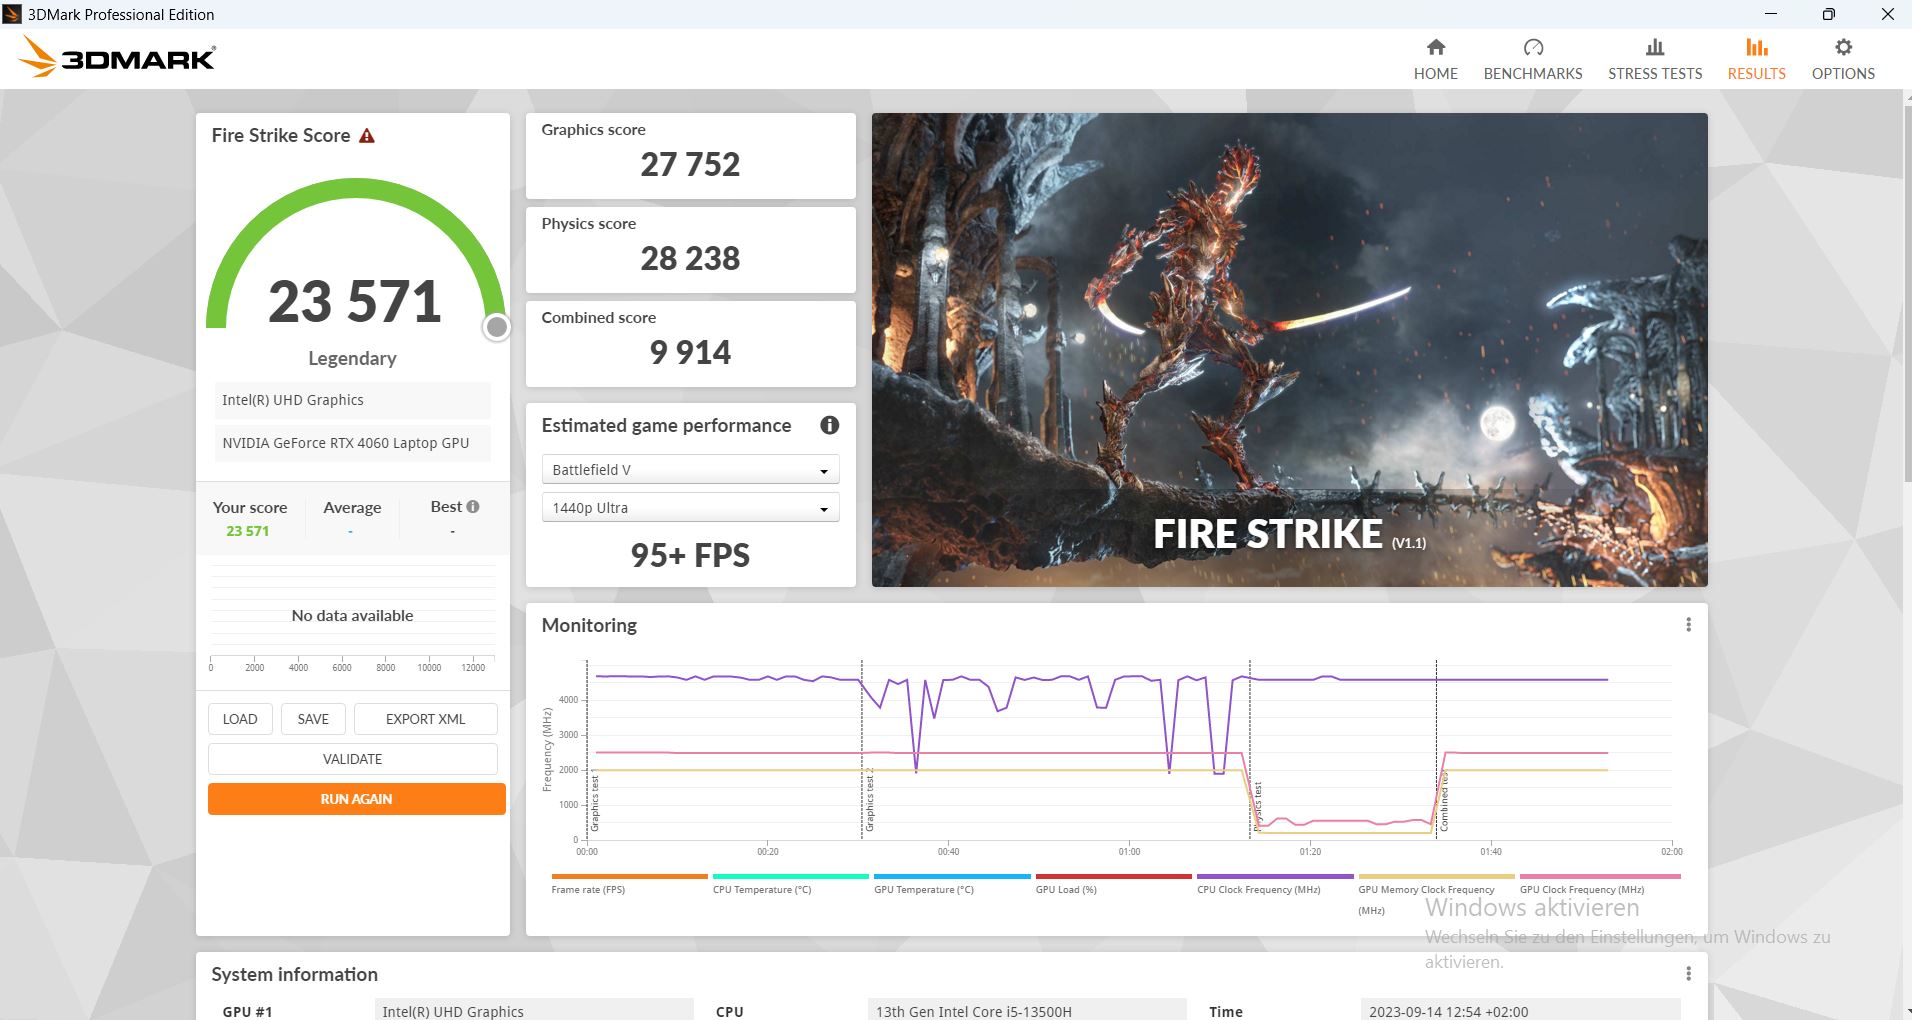
Away from a power socket, its 3D performance sinks considerably. From an initial 23,571 points achieved during the Fire Strike test, it now only achieved 6,693 points. This is a whopping 72 per cent less!

| 3DMark 11 - 1280x720 Performance GPU | |
| Average of class Gaming (1029 - 72070, n=236, last 2 years) | |
| Dell G15 5530 | |
| Captiva Advanced Gaming I74-121 | |
| Average NVIDIA GeForce RTX 4060 Laptop GPU (28136 - 37796, n=29) | |
| Lenovo LOQ 15APH8 | |
| Lenovo Legion Slim 5 16APH8 | |
| SCHENKER XMG Core 15 (M22) | |
| MSI Cyborg 15 A12VF | |
| 3DMark | |
| 1280x720 Cloud Gate Standard Graphics | |
| Captiva Advanced Gaming I74-121 | |
| Dell G15 5530 | |
| Average NVIDIA GeForce RTX 4060 Laptop GPU (81407 - 180228, n=20) | |
| MSI Cyborg 15 A12VF | |
| Average of class Gaming (15902 - 193851, n=161, last 2 years) | |
| SCHENKER XMG Core 15 (M22) | |
| 1920x1080 Fire Strike Graphics | |
| Average of class Gaming (781 - 53059, n=244, last 2 years) | |
| Captiva Advanced Gaming I74-121 | |
| Dell G15 5530 | |
| Average NVIDIA GeForce RTX 4060 Laptop GPU (20533 - 27752, n=27) | |
| Lenovo Legion Slim 5 16APH8 | |
| Lenovo LOQ 15APH8 | |
| SCHENKER XMG Core 15 (M22) | |
| MSI Cyborg 15 A12VF | |
| 2560x1440 Time Spy Graphics | |
| Average of class Gaming (224 - 22547, n=242, last 2 years) | |
| Dell G15 5530 | |
| Captiva Advanced Gaming I74-121 | |
| Average NVIDIA GeForce RTX 4060 Laptop GPU (7484 - 10855, n=27) | |
| Lenovo LOQ 15APH8 | |
| Lenovo Legion Slim 5 16APH8 | |
| SCHENKER XMG Core 15 (M22) | |
| MSI Cyborg 15 A12VF | |
| 3DMark 11 Performance | 30608 points | |
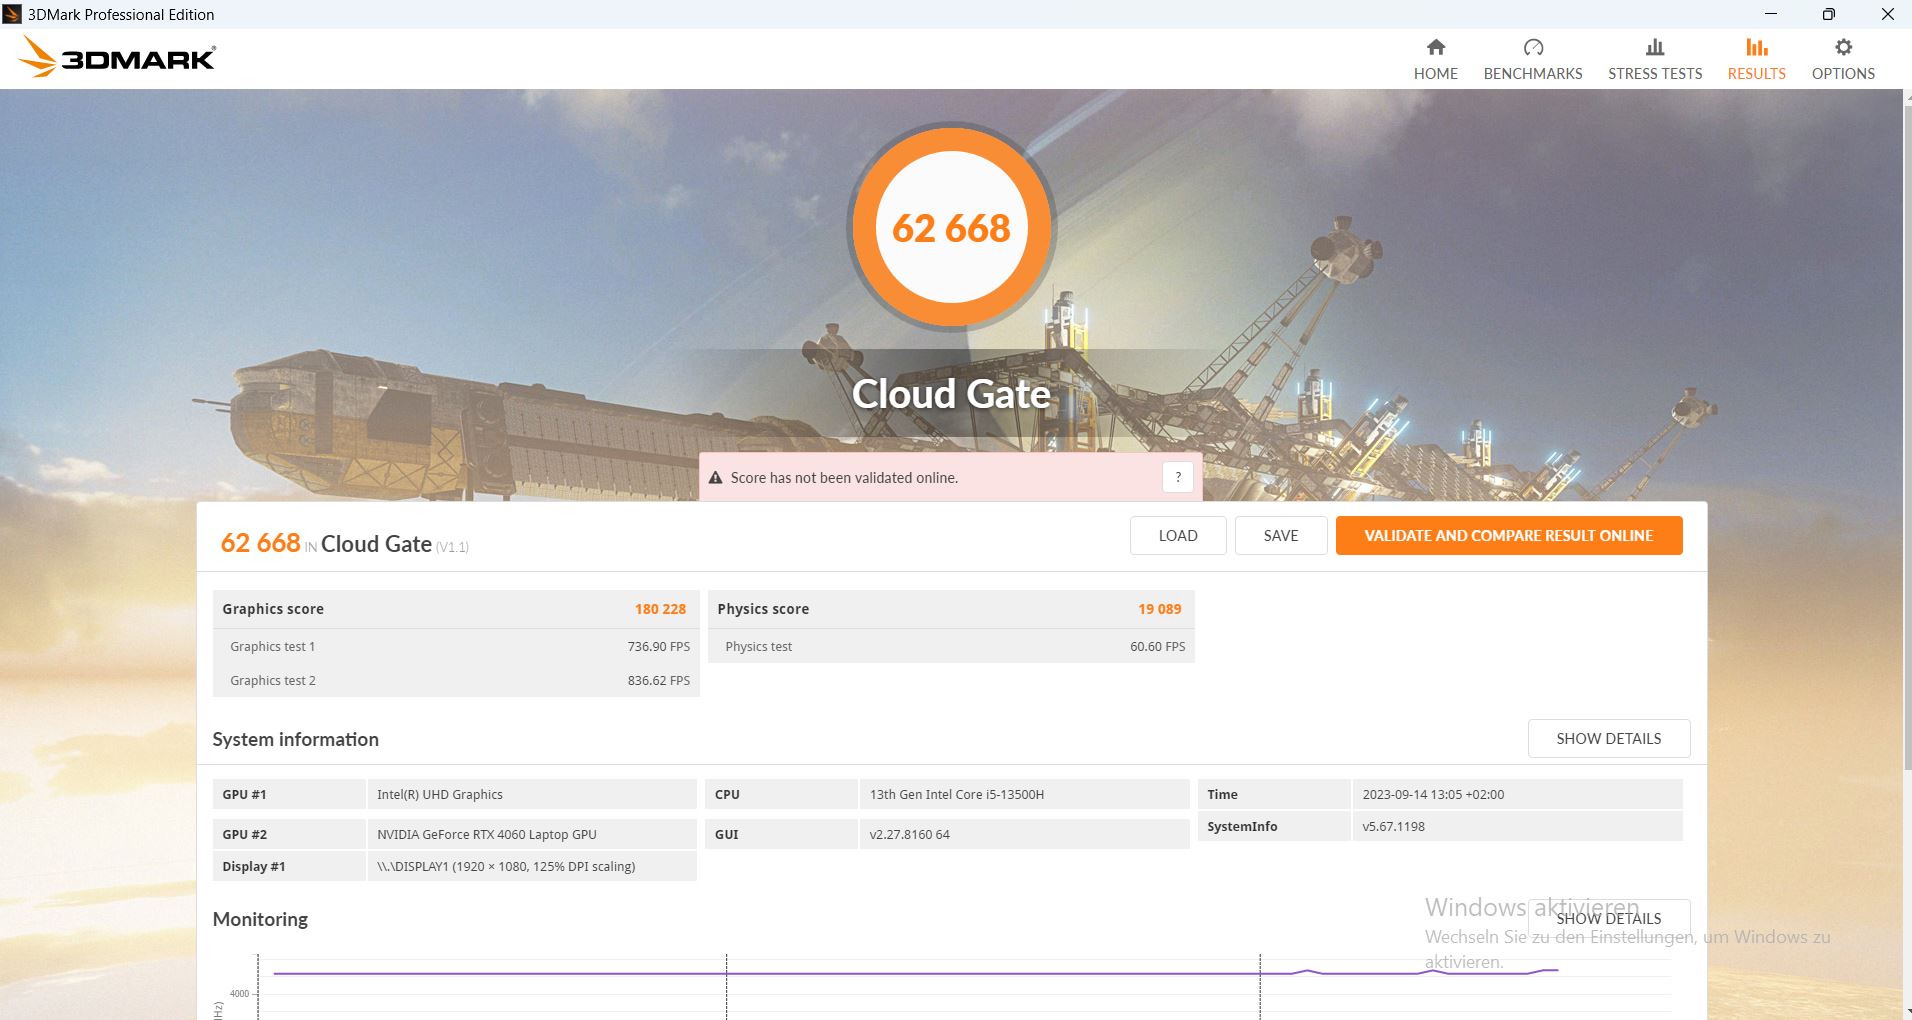
| 3DMark Cloud Gate Standard Score | 62668 points | |
| 3DMark Fire Strike Score | 23571 points | |
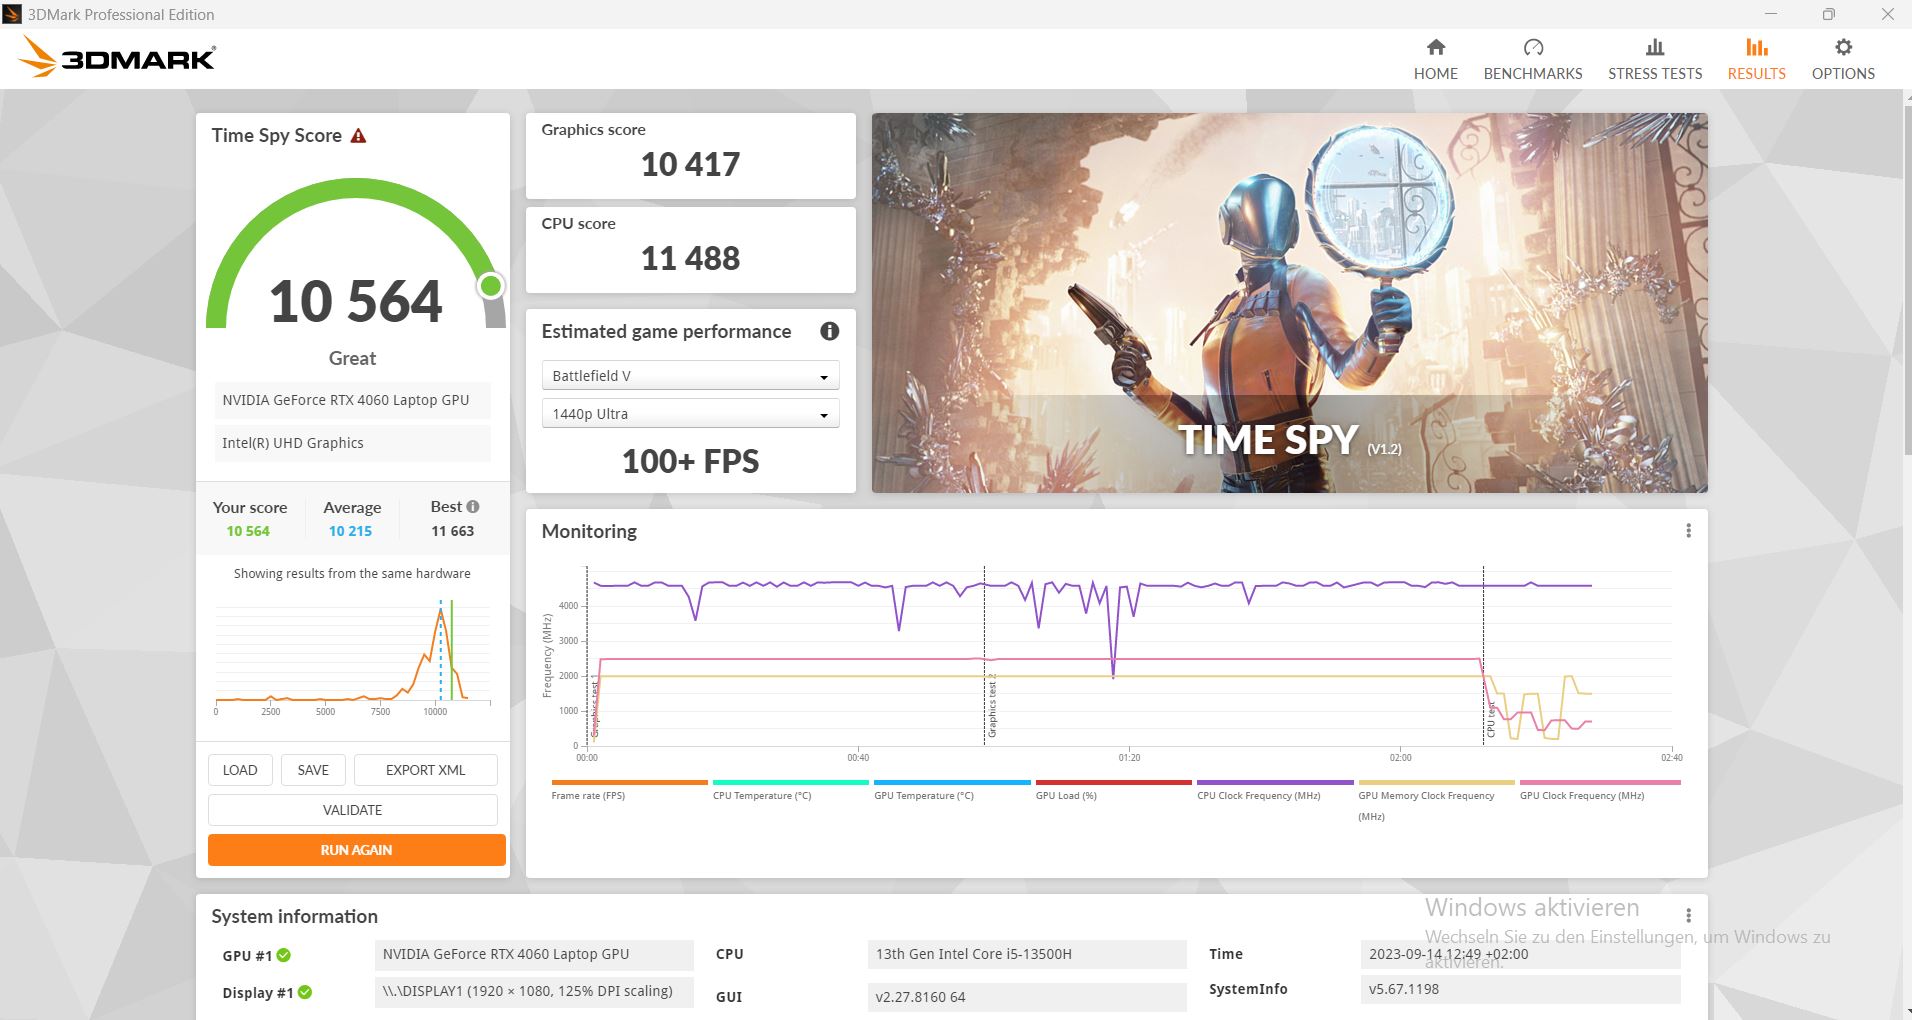
| 3DMark Time Spy Score | 10564 points | |
Help | ||
| Blender | |
| v3.3 Classroom HIP/AMD | |
| SCHENKER XMG Core 15 (M22) | |
| Average of class Gaming (51 - 668, n=14, last 2 years) | |
| v3.3 Classroom OPTIX/RTX | |
| SCHENKER XMG Core 15 (M22) | |
| MSI Cyborg 15 A12VF | |
| Lenovo LOQ 15APH8 | |
| Average NVIDIA GeForce RTX 4060 Laptop GPU (19 - 28, n=25) | |
| Average of class Gaming (9 - 142, n=140, last 2 years) | |
| Captiva Advanced Gaming I74-121 | |
| Lenovo Legion Slim 5 16APH8 | |
| Dell G15 5530 | |
| v3.3 Classroom CUDA | |
| SCHENKER XMG Core 15 (M22) | |
| MSI Cyborg 15 A12VF | |
| Lenovo LOQ 15APH8 | |
| Average NVIDIA GeForce RTX 4060 Laptop GPU (40 - 53, n=25) | |
| Lenovo Legion Slim 5 16APH8 | |
| Captiva Advanced Gaming I74-121 | |
| Dell G15 5530 | |
| Average of class Gaming (16 - 175, n=145, last 2 years) | |
| v3.3 Classroom CPU | |
| MSI Cyborg 15 A12VF | |
| SCHENKER XMG Core 15 (M22) | |
| Captiva Advanced Gaming I74-121 | |
| Average NVIDIA GeForce RTX 4060 Laptop GPU (189 - 452, n=25) | |
| Average of class Gaming (144 - 907, n=156, last 2 years) | |
| Lenovo LOQ 15APH8 | |
| Lenovo Legion Slim 5 16APH8 | |
| Dell G15 5530 | |
* ... smaller is better
Gaming Performance
The Captiva was in a close duel with the Dell G15 in all things gaming, too - the latter just managing to come out on top. This is likely due to its better CPU performance in games with the corresponding focus.
In total, the Captiva is capable of smoothly running almost all current games in very high resolutions and it came out just above the average of all laptops featuring the same GPU which we have stored in our database.
| Performance Rating - Percent | |
| Dell G15 5530 | |
| Captiva Advanced Gaming I74-121 | |
| Average of class Gaming | |
| Lenovo Legion Slim 5 16APH8 | |
| MSI Cyborg 15 A12VF | |
| SCHENKER XMG Core 15 (M22) | |
| Lenovo LOQ 15APH8 | |
| The Witcher 3 - 1920x1080 Ultra Graphics & Postprocessing (HBAO+) | |
| Average of class Gaming (8.61 - 216, n=236, last 2 years) | |
| Dell G15 5530 | |
| Captiva Advanced Gaming I74-121 | |
| Lenovo Legion Slim 5 16APH8 | |
| Lenovo LOQ 15APH8 | |
| SCHENKER XMG Core 15 (M22) | |
| MSI Cyborg 15 A12VF | |
| GTA V - 1920x1080 Highest Settings possible AA:4xMSAA + FX AF:16x | |
| Captiva Advanced Gaming I74-121 | |
| Dell G15 5530 | |
| Average of class Gaming (6.38 - 167.7, n=225, last 2 years) | |
| Lenovo Legion Slim 5 16APH8 | |
| SCHENKER XMG Core 15 (M22) | |
| MSI Cyborg 15 A12VF | |
| Lenovo LOQ 15APH8 | |
| Final Fantasy XV Benchmark - 1920x1080 High Quality | |
| Average of class Gaming (9.13 - 194.9, n=234, last 2 years) | |
| Captiva Advanced Gaming I74-121 | |
| Dell G15 5530 | |
| Lenovo Legion Slim 5 16APH8 | |
| SCHENKER XMG Core 15 (M22) | |
| Lenovo LOQ 15APH8 | |
| MSI Cyborg 15 A12VF | |
| Strange Brigade - 1920x1080 ultra AA:ultra AF:16 | |
| Average of class Gaming (14.6 - 421, n=233, last 2 years) | |
| Dell G15 5530 | |
| Captiva Advanced Gaming I74-121 | |
| Lenovo Legion Slim 5 16APH8 | |
| Lenovo LOQ 15APH8 | |
| SCHENKER XMG Core 15 (M22) | |
| MSI Cyborg 15 A12VF | |
| Dota 2 Reborn - 1920x1080 ultra (3/3) best looking | |
| Dell G15 5530 | |
| Captiva Advanced Gaming I74-121 | |
| Average of class Gaming (26.9 - 220, n=248, last 2 years) | |
| Lenovo Legion Slim 5 16APH8 | |
| MSI Cyborg 15 A12VF | |
| Lenovo LOQ 15APH8 | |
| SCHENKER XMG Core 15 (M22) | |
| X-Plane 11.11 - 1920x1080 high (fps_test=3) | |
| Dell G15 5530 | |
| Captiva Advanced Gaming I74-121 | |
| Average of class Gaming (12.4 - 166.2, n=252, last 2 years) | |
| MSI Cyborg 15 A12VF | |
| Lenovo Legion Slim 5 16APH8 | |
| Lenovo LOQ 15APH8 | |
| SCHENKER XMG Core 15 (M22) | |
| The Witcher 3 | |
| 1920x1080 High Graphics & Postprocessing (Nvidia HairWorks Off) | |
| Dell G15 5530 | |
| Average of class Gaming (17.5 - 449, n=178, last 2 years) | |
| Captiva Advanced Gaming I74-121 | |
| Average NVIDIA GeForce RTX 4060 Laptop GPU (112 - 216, n=24) | |
| Lenovo Legion Slim 5 16APH8 | |
| Lenovo LOQ 15APH8 | |
| SCHENKER XMG Core 15 (M22) | |
| MSI Cyborg 15 A12VF | |
| 1920x1080 Ultra Graphics & Postprocessing (HBAO+) | |
| Average of class Gaming (8.61 - 216, n=236, last 2 years) | |
| Dell G15 5530 | |
| Captiva Advanced Gaming I74-121 | |
| Average NVIDIA GeForce RTX 4060 Laptop GPU (77 - 159.7, n=28) | |
| Lenovo Legion Slim 5 16APH8 | |
| Lenovo LOQ 15APH8 | |
| SCHENKER XMG Core 15 (M22) | |
| MSI Cyborg 15 A12VF | |
| Far Cry 5 | |
| 1920x1080 High Preset AA:T | |
| Captiva Advanced Gaming I74-121 | |
| Dell G15 5530 | |
| Average NVIDIA GeForce RTX 4060 Laptop GPU (104 - 155, n=17) | |
| Average of class Gaming (16 - 232, n=126, last 2 years) | |
| SCHENKER XMG Core 15 (M22) | |
| MSI Cyborg 15 A12VF | |
| 1920x1080 Ultra Preset AA:T | |
| Dell G15 5530 | |
| Captiva Advanced Gaming I74-121 | |
| Average NVIDIA GeForce RTX 4060 Laptop GPU (95 - 146, n=18) | |
| Average of class Gaming (14 - 218, n=134, last 2 years) | |
| SCHENKER XMG Core 15 (M22) | |
| MSI Cyborg 15 A12VF | |
| F1 23 | |
| 1920x1080 Ultra High Preset AA:T AF:16x | |
| Average of class Gaming (12.9 - 132, n=24, last 2 years) | |
| Average NVIDIA GeForce RTX 4060 Laptop GPU (43.8 - 119.9, n=8) | |
| Captiva Advanced Gaming I74-121 | |
| 1920x1080 High Preset AA:T AF:16x | |
| Captiva Advanced Gaming I74-121 | |
| Average NVIDIA GeForce RTX 4060 Laptop GPU (143.7 - 187.6, n=8) | |
| Average of class Gaming (13.8 - 374, n=25, last 2 years) | |
Aside from the usual day and night rhythm, the frame rate in The Witcher 3 remained very stable. Only the Dell G15 was slightly faster.
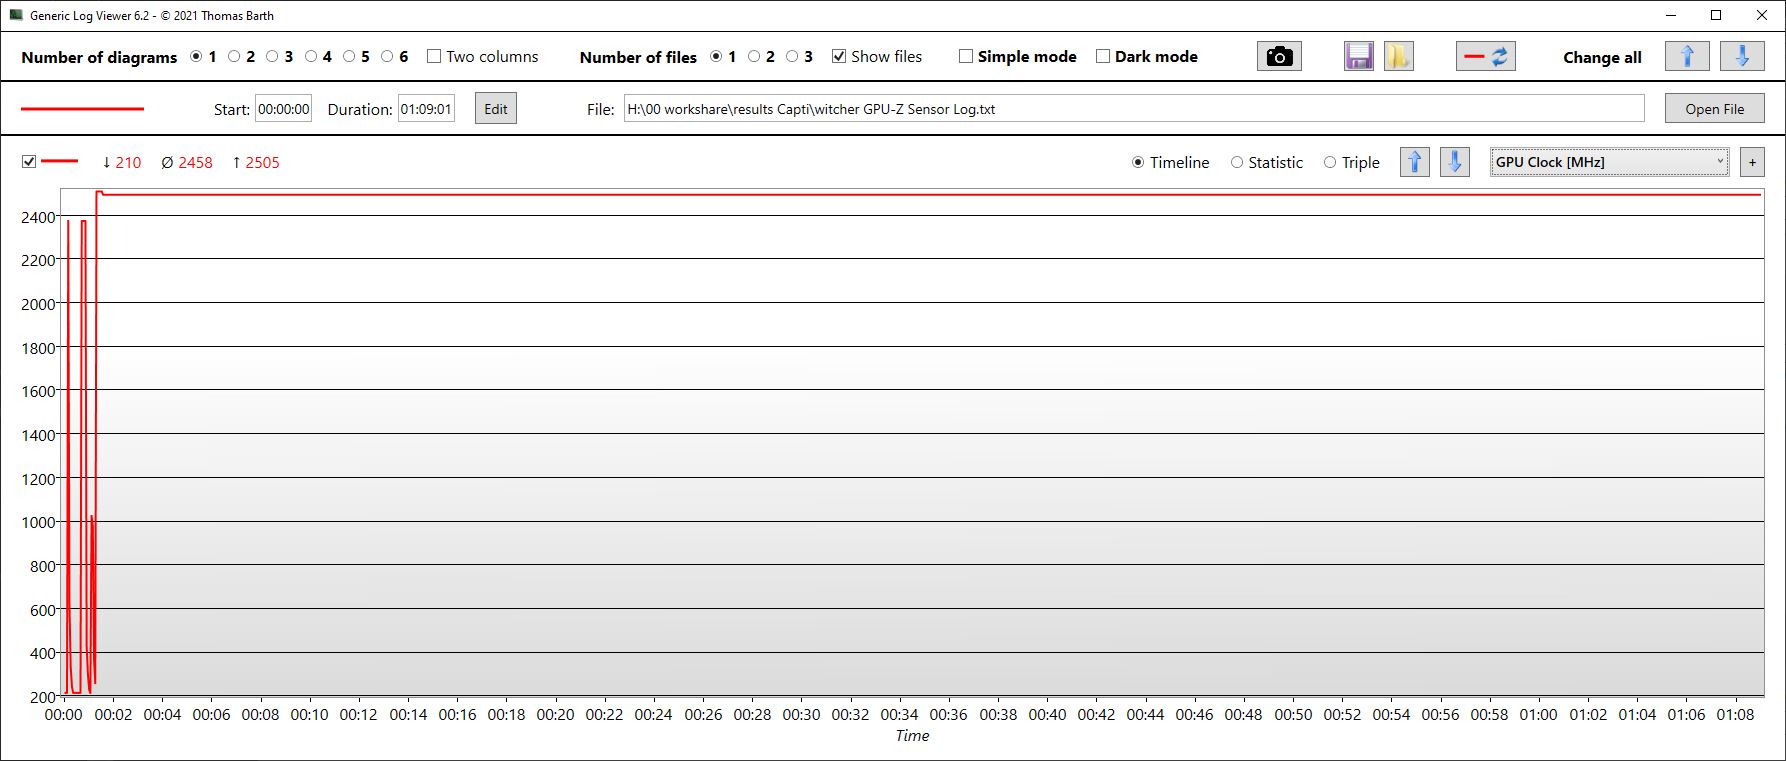
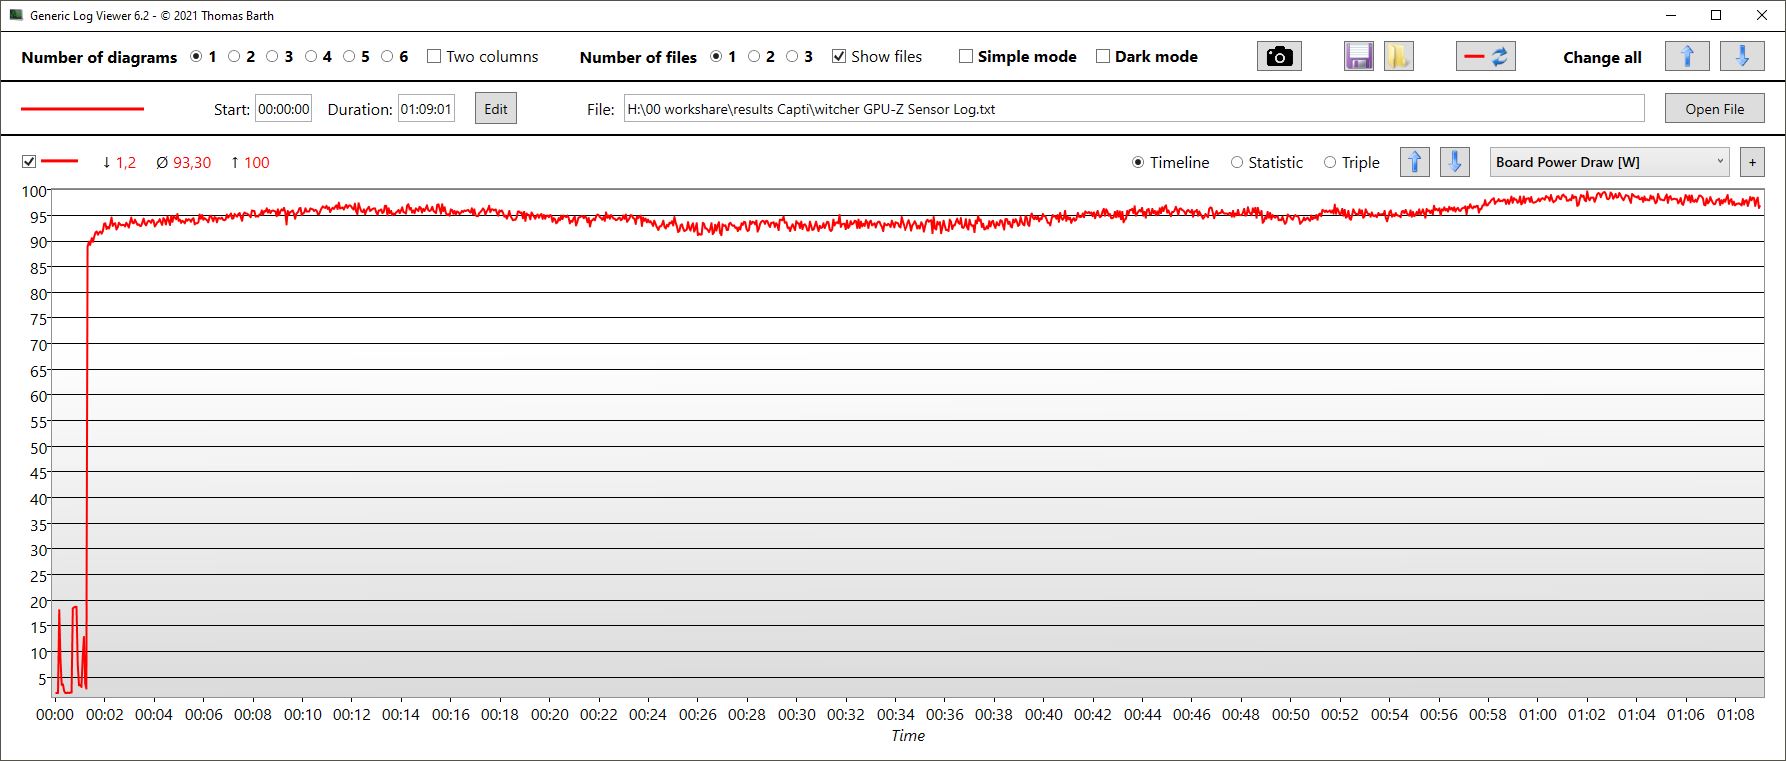
The GPU consistently clocked at over 2,400 MHz during the one-hour benchmark time running The Witcher 3, and the memory clock was constant at 2,000 MHz. During this time, the GPU heated up to 72 °C and the power consumption was around 95 watts.
The CPU reduced its TDP to about 30 watts during the same time and heated up to about 77 °C.

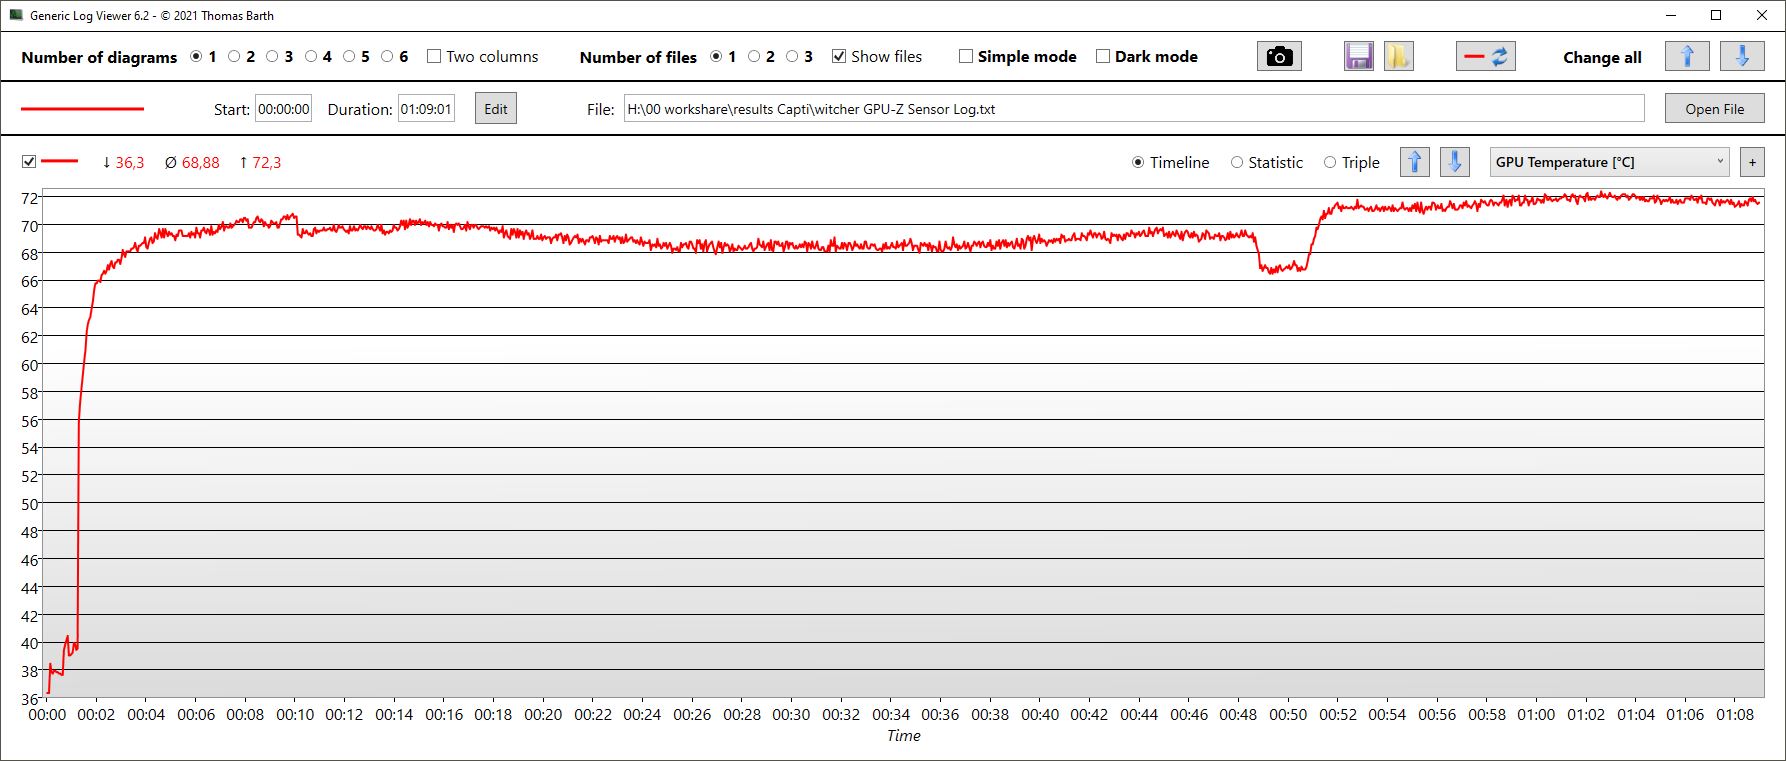
Witcher 3 FPS diagram
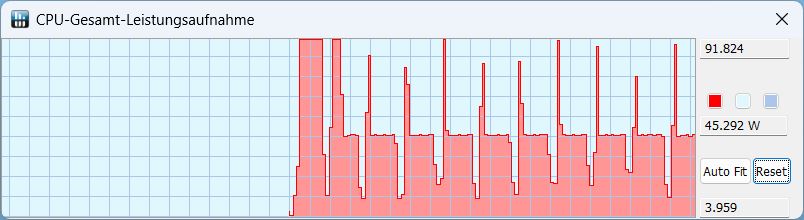
Entertainment mode resulted in practically the same values and it wasn't even much quieter.
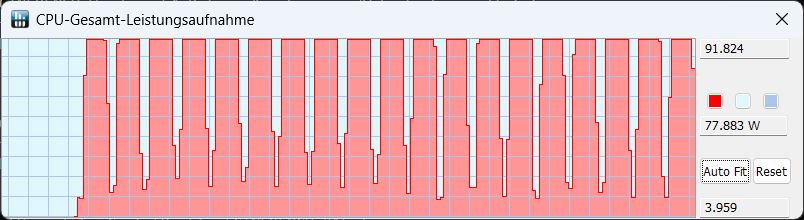
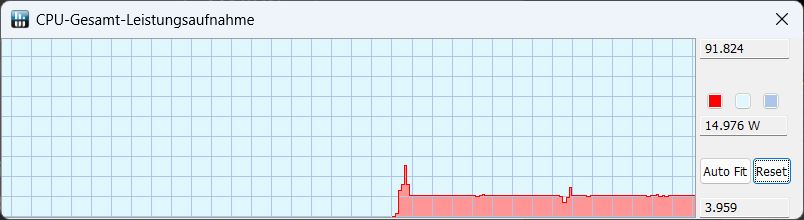
In silent mode, the PC runs quite a bit quieter (31.43 dB). The less active fans result in the GPU's temperature rising a lot quicker. After about 3.5 minutes, the temperature was already at 87 °C, which led to the GPU clock and power consumption to sink slightly. Then the temperature remained constant at 89 °C. The TGP sank from 100 watts to 80 watts. At the same time, the frame rate sank from 100 fps to only about 85 fps.

| low | med. | high | ultra | QHD | |
| GTA V (2015) | 186.5 | 182.4 | 177.2 | 117 | |
| The Witcher 3 (2015) | 367 | 296 | 199 | 101 | |
| Dota 2 Reborn (2015) | 181 | 168.1 | 147.2 | 140.5 | |
| Final Fantasy XV Benchmark (2018) | 185.6 | 148 | 102.2 | 75.6 | |
| X-Plane 11.11 (2018) | 142.7 | 128.1 | 99.4 | ||
| Far Cry 5 (2018) | 175 | 153 | 147 | 138 | |
| Strange Brigade (2018) | 470 | 276 | 219 | 187.9 | |
| F1 23 (2023) | 221 | 225 | 184 | 59 |
Emissions - Cool but not quiet
Noise emissions
Both of the Captiva Advanced Gaming's fans are pretty much always active - even in the so-called "silent mode". Even so, the fans run very quietly in idle mode. While gaming, the laptop gets quite loud and achieves the same noise emissions as it does under maximum load. Unfortunately, we didn't note any difference, for example like we could in the Lenovo LOQ.
At least, its maximum noise emissions aren't out of the ordinary - they are about the same as on other gaming laptops. The Dell G15 is quieter despite it having the same 3D performance.
Entertainment mode didn't lead to quieter results in our test. When using silent mode, the gaming noise levels sank considerably and in idle mode, the fans still remained active.
The Witcher 3 Full HD Ultra
| Mode/value | Noise emissions in dB | FPS |
|---|---|---|
| Performance | 55 | 101 |
| Entertainment | 55 | 101 |
| Silent | 31.43 | 85 (slow sink from 100 fps) |
Noise Level
| Idle |
| 23 / 25.67 / 25.67 dB(A) |
| Load |
| 38.52 / 54.17 dB(A) |
 | ||
30 dB silent 40 dB(A) audible 50 dB(A) loud |
||
min: | ||
| Captiva Advanced Gaming I74-121 NVIDIA GeForce RTX 4060 Laptop GPU, i5-13500H, Samsung SSD 980 1TB MZ-V8V1T0BW | MSI Cyborg 15 A12VF NVIDIA GeForce RTX 4060 Laptop GPU, i7-12650H, Samsung PM9B1 1024GB MZVL41T0HBLB | Dell G15 5530 NVIDIA GeForce RTX 4060 Laptop GPU, i7-13650HX, SSTC CL4-3D512-Q11 | Lenovo Legion Slim 5 16APH8 NVIDIA GeForce RTX 4060 Laptop GPU, R7 7840HS, SK hynix PC801 HFS512GEJ9X115N | Lenovo LOQ 15APH8 NVIDIA GeForce RTX 4050 Laptop GPU, R7 7840HS, Micron 2450 512GB MTFDKCD512TFK | SCHENKER XMG Core 15 (M22) GeForce RTX 3060 Laptop GPU, R7 6800H, Samsung SSD 980 Pro 1TB MZ-V8P1T0BW | |
|---|---|---|---|---|---|---|
| Noise | -30% | 5% | 2% | 2% | 1% | |
| off / environment * | 23 | 27 -17% | 20.41 11% | 22.9 -0% | 23.1 -0% | 23 -0% |
| Idle Minimum * | 23 | 27 -17% | 26.85 -17% | 23.1 -0% | 23.1 -0% | 23 -0% |
| Idle Average * | 25.67 | 37.5 -46% | 26.85 -5% | 23.1 10% | 23.1 10% | 23 10% |
| Idle Maximum * | 25.67 | 38 -48% | 26.85 -5% | 27.7 -8% | 25.2 2% | 23 10% |
| Load Average * | 38.52 | 56.3 -46% | 27.65 28% | 33.3 14% | 44.3 -15% | 42.41 -10% |
| Witcher 3 ultra * | 54.17 | 47.9 12% | 54 -0% | 45.8 15% | 54.71 -1% | |
| Load Maximum * | 54.17 | 56.3 -4% | 47.86 12% | 54 -0% | 52 4% | 55.05 -2% |
* ... smaller is better
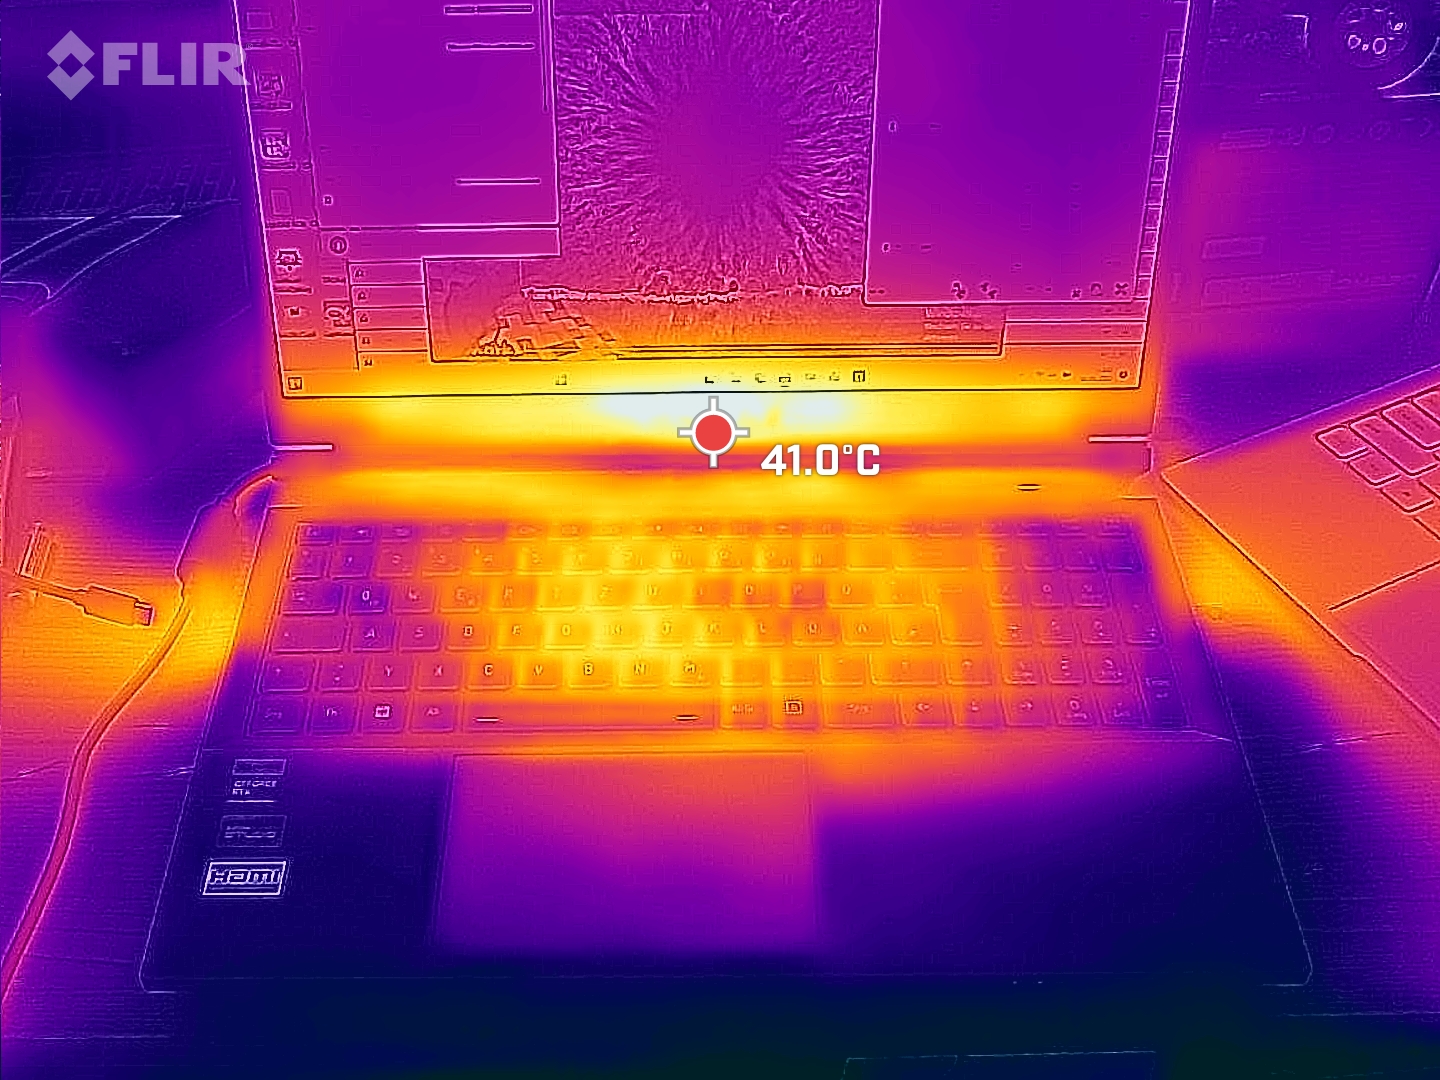
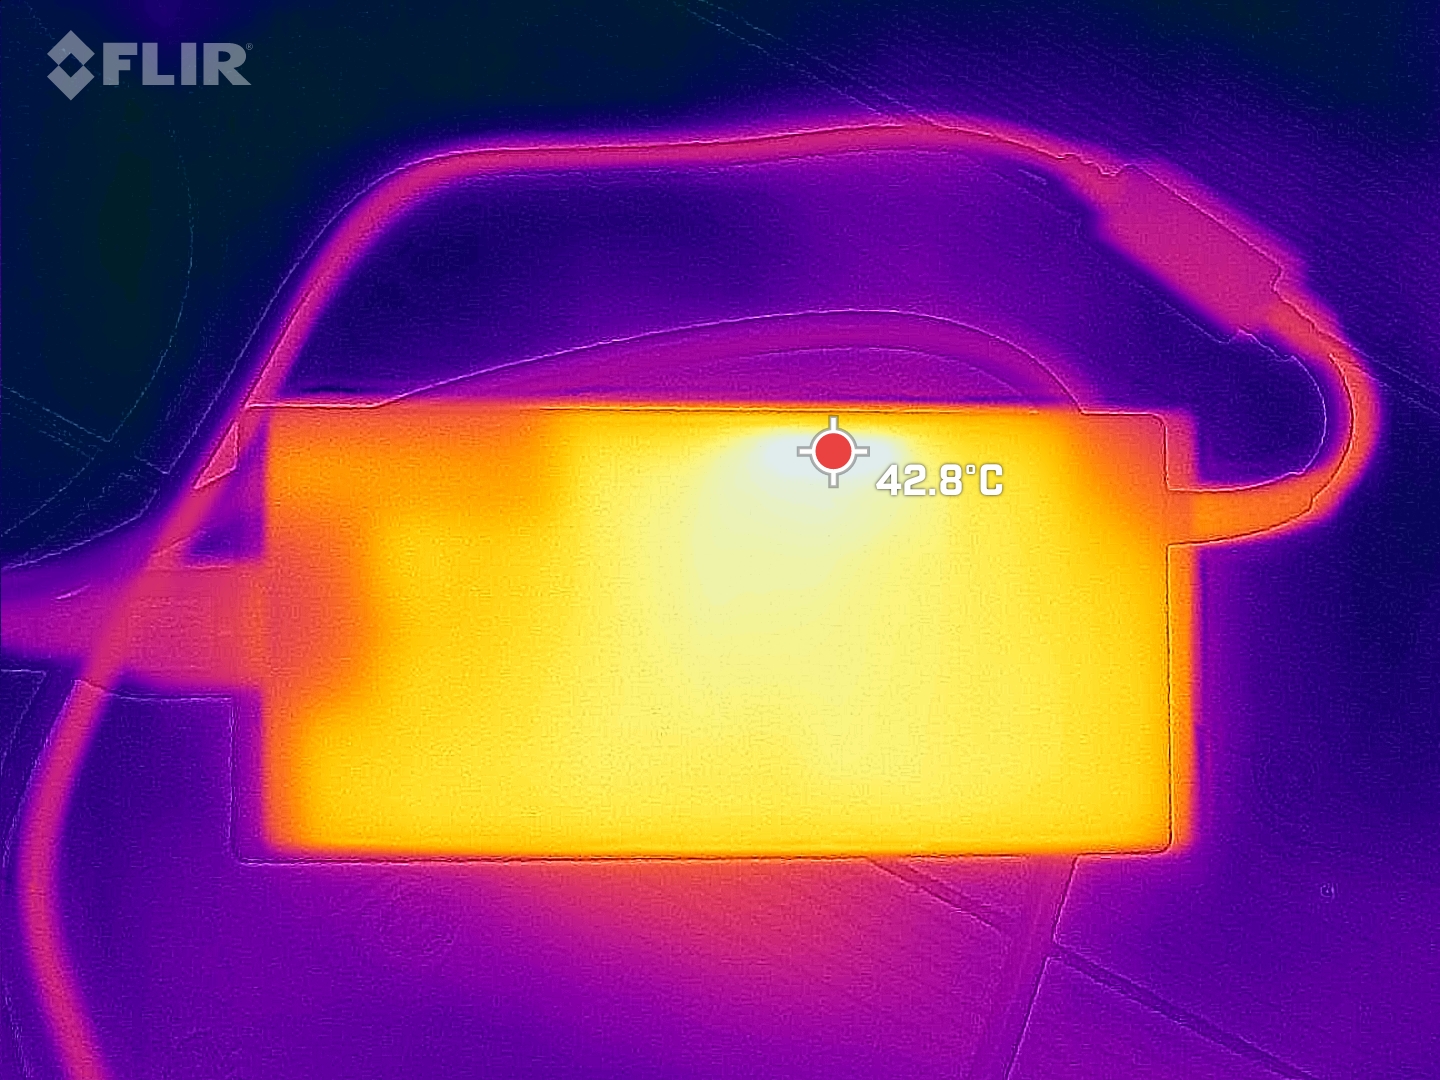
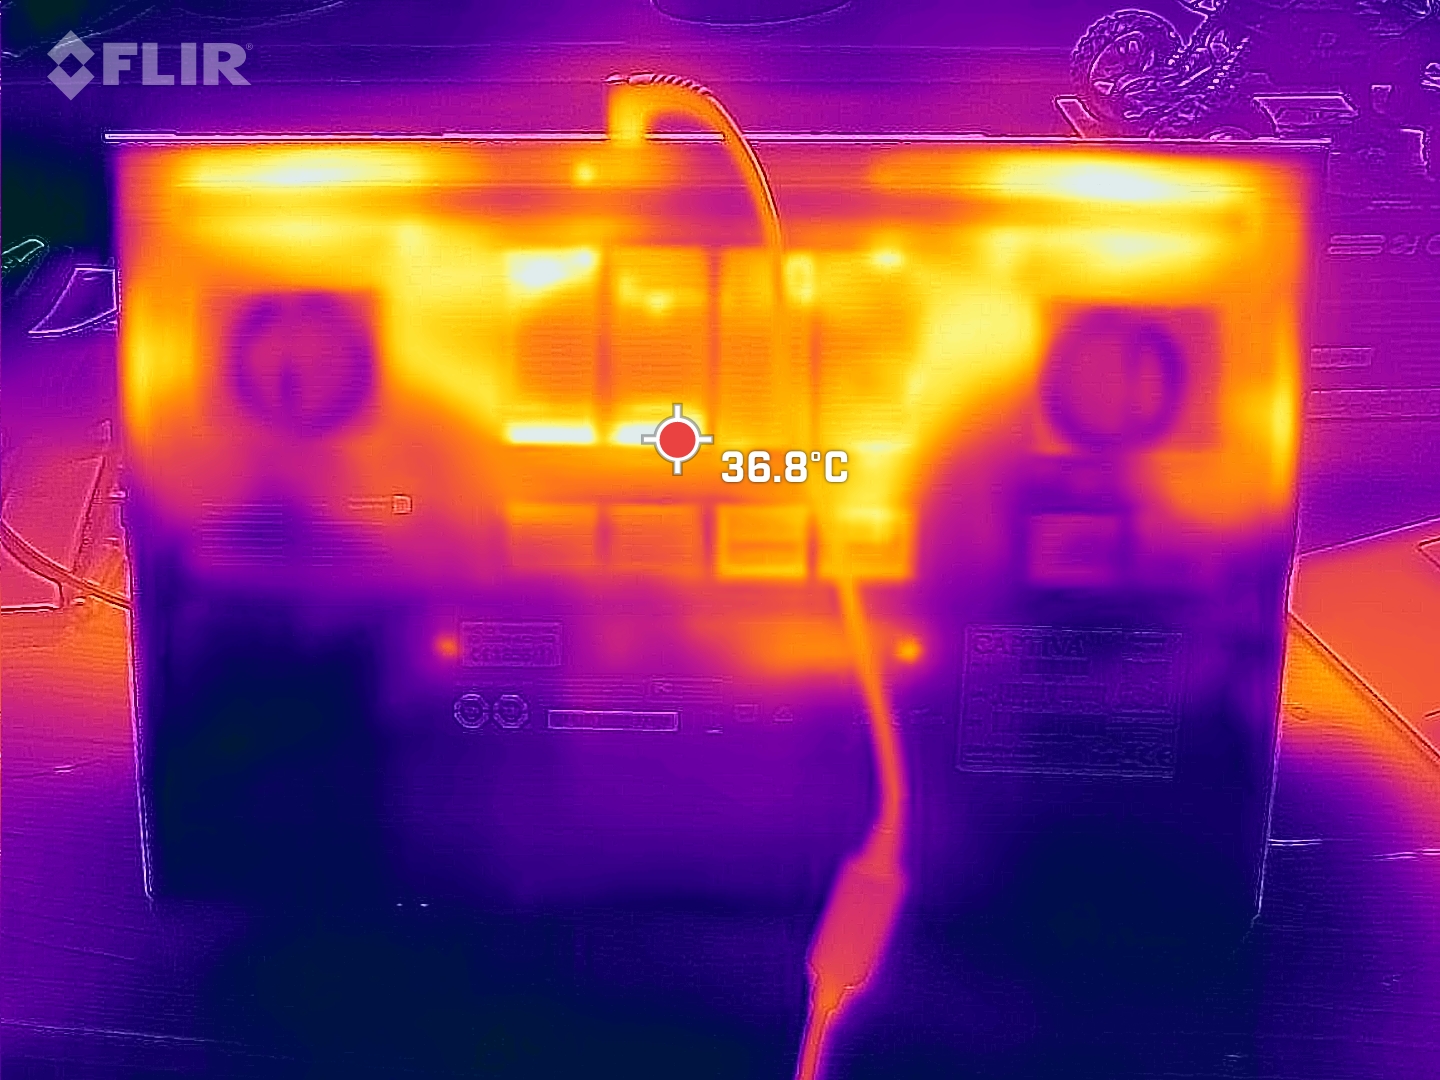
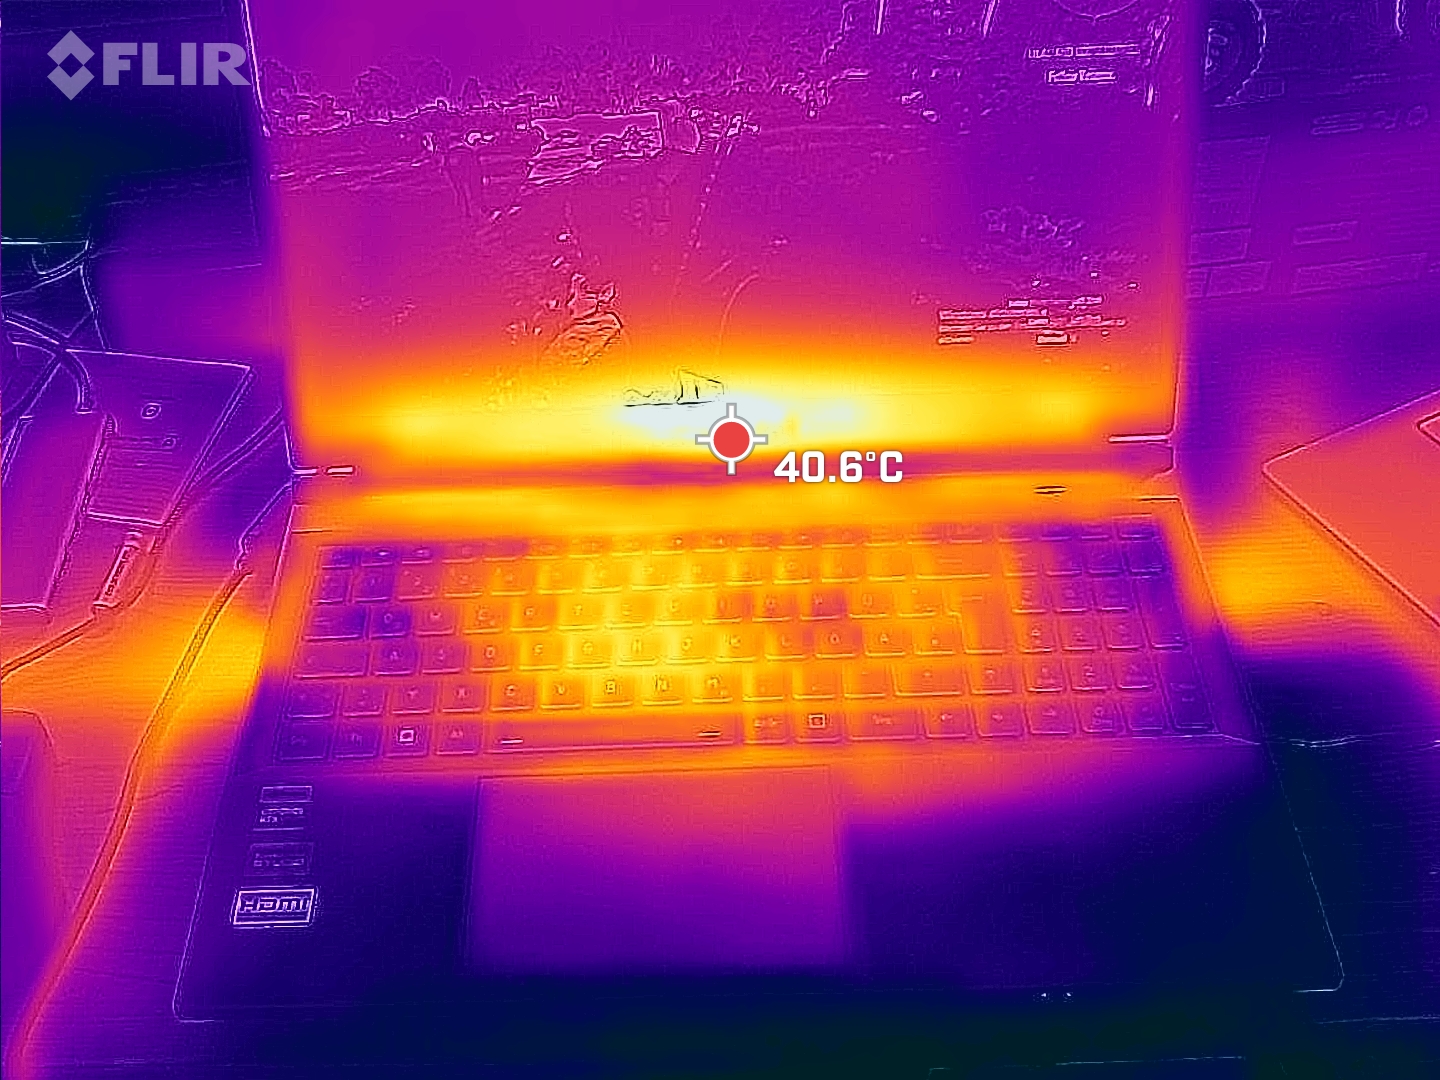
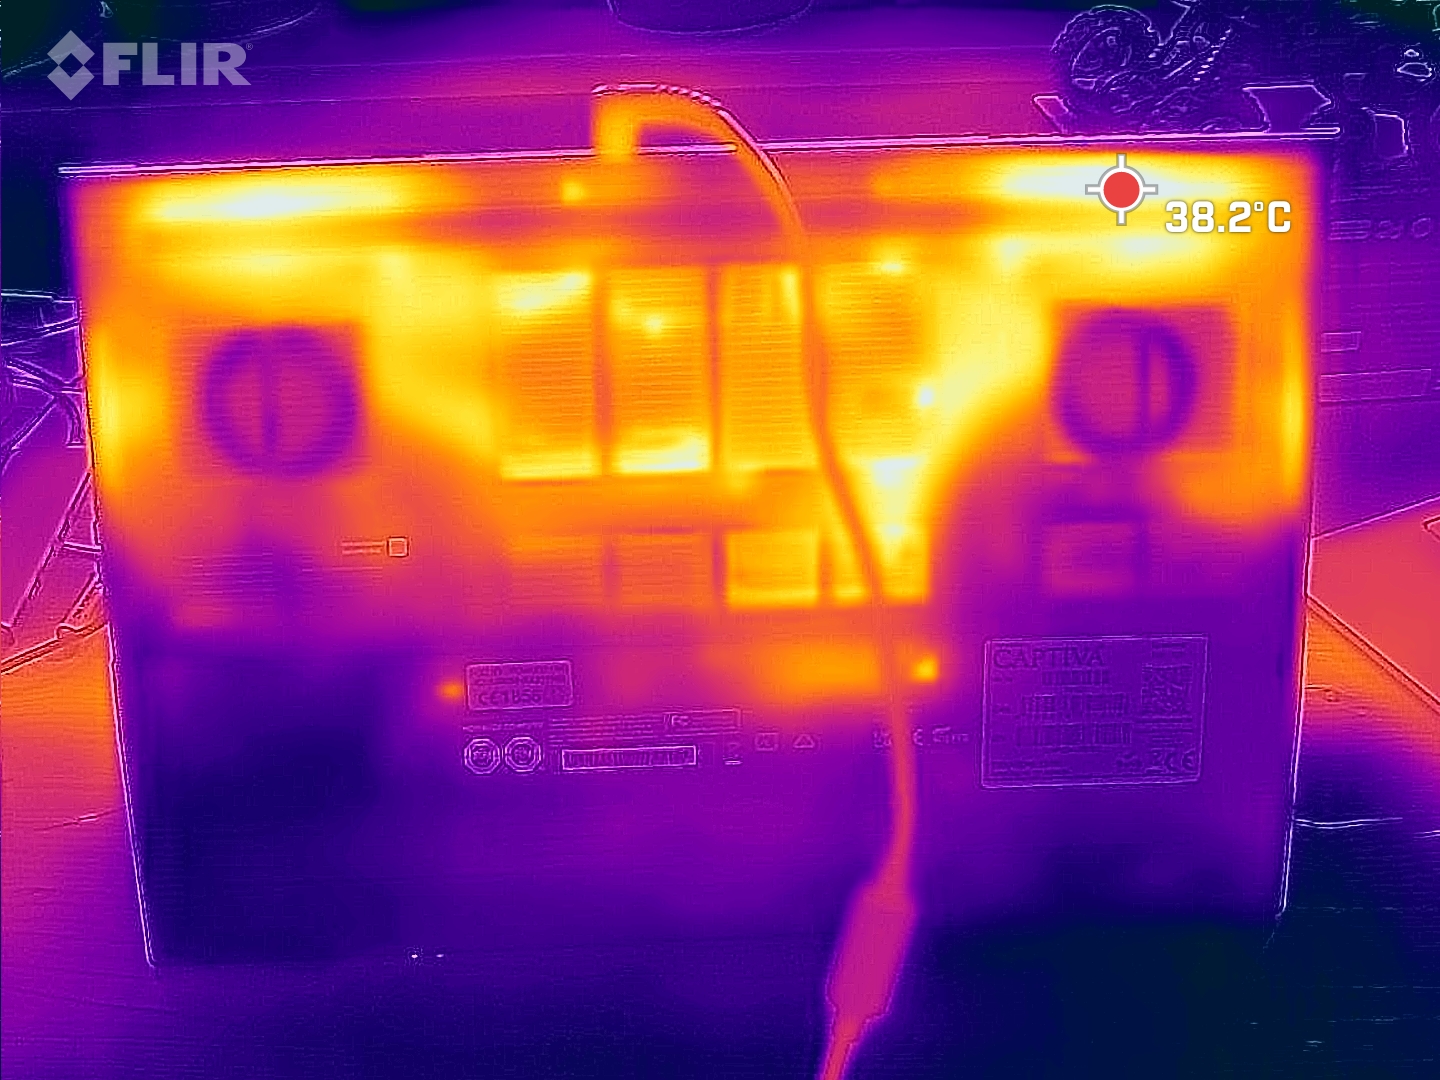
Temperature
Thanks to the laptop's generous use of copper and its fans, the gaming device remains comparatively cool. Even under full load after an hour, we only measured a maximum of 42 °C. Here, the Dell G15 really shows what cost the quieter fans come at - it hits temperatures of over 60 °C!
(±) The maximum temperature on the upper side is 41 °C / 106 F, compared to the average of 40.4 °C / 105 F, ranging from 21.2 to 68.8 °C for the class Gaming.
(±) The bottom heats up to a maximum of 42 °C / 108 F, compared to the average of 43.3 °C / 110 F
(+) In idle usage, the average temperature for the upper side is 28.3 °C / 83 F, compared to the device average of 33.9 °C / 93 F.
(±) Playing The Witcher 3, the average temperature for the upper side is 32.9 °C / 91 F, compared to the device average of 33.9 °C / 93 F.
(+) The palmrests and touchpad are cooler than skin temperature with a maximum of 30 °C / 86 F and are therefore cool to the touch.
(±) The average temperature of the palmrest area of similar devices was 29 °C / 84.2 F (-1 °C / -1.8 F).
| Captiva Advanced Gaming I74-121 Intel Core i5-13500H, NVIDIA GeForce RTX 4060 Laptop GPU | MSI Cyborg 15 A12VF Intel Core i7-12650H, NVIDIA GeForce RTX 4060 Laptop GPU | Dell G15 5530 Intel Core i7-13650HX, NVIDIA GeForce RTX 4060 Laptop GPU | Lenovo Legion Slim 5 16APH8 AMD Ryzen 7 7840HS, NVIDIA GeForce RTX 4060 Laptop GPU | Lenovo LOQ 15APH8 AMD Ryzen 7 7840HS, NVIDIA GeForce RTX 4050 Laptop GPU | SCHENKER XMG Core 15 (M22) AMD Ryzen 7 6800H, NVIDIA GeForce RTX 3060 Laptop GPU | |
|---|---|---|---|---|---|---|
| Heat | 7% | -20% | 10% | -1% | -5% | |
| Maximum Upper Side * | 41 | 47.5 -16% | 54 -32% | 40.6 1% | 44.4 -8% | 48 -17% |
| Maximum Bottom * | 42 | 35.5 15% | 62.2 -48% | 42 -0% | 52 -24% | 51 -21% |
| Idle Upper Side * | 32 | 27.7 13% | 33.4 -4% | 27.8 13% | 28 12% | 28 12% |
| Idle Bottom * | 35 | 29.5 16% | 33.4 5% | 26.6 24% | 29.6 15% | 33 6% |
* ... smaller is better
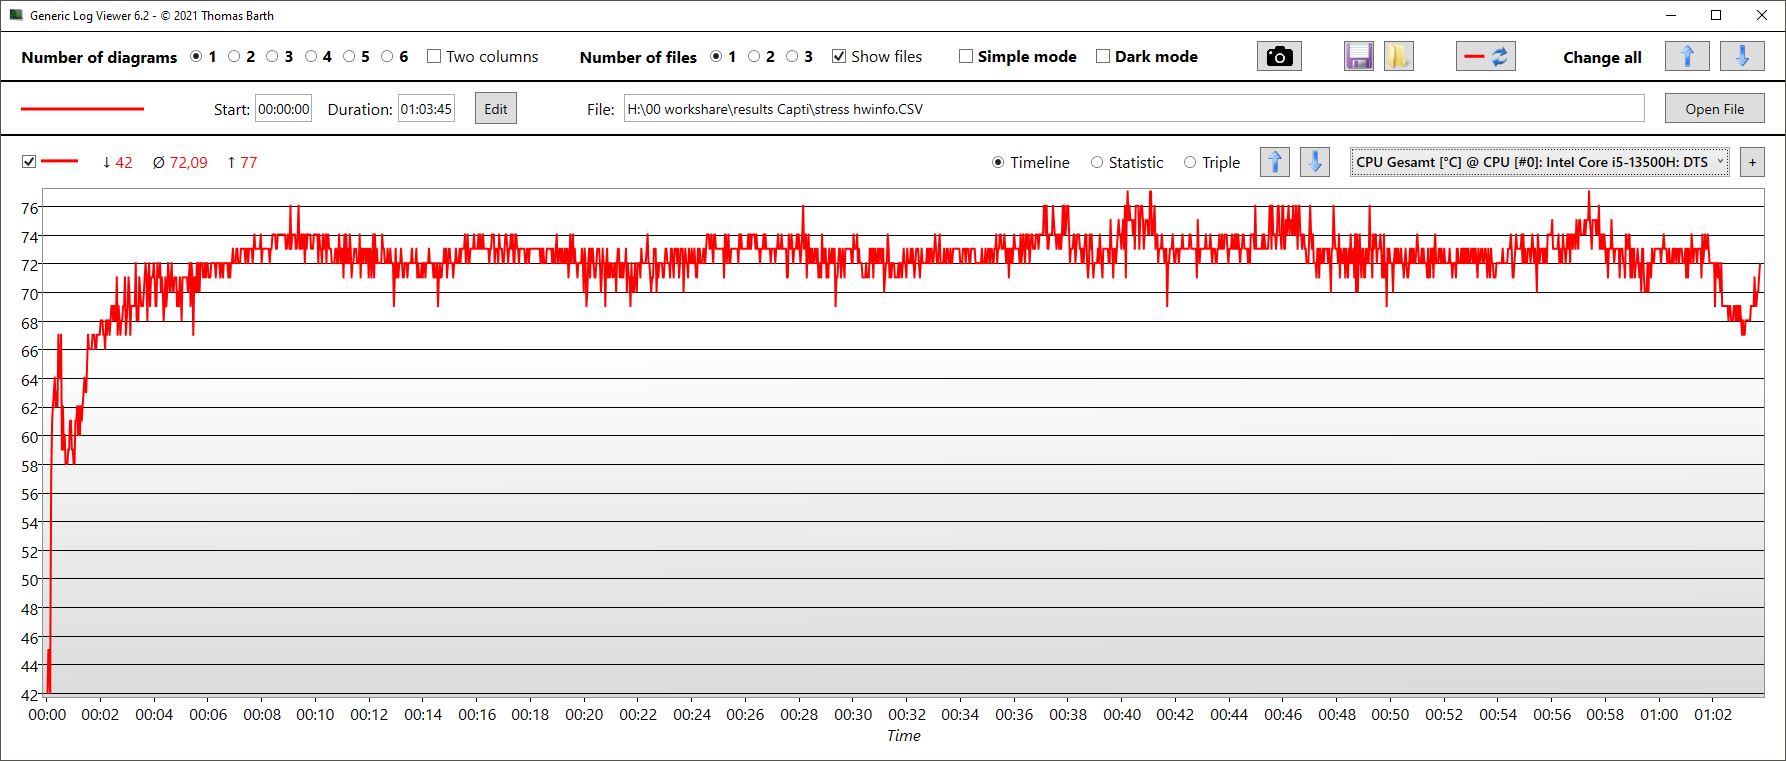
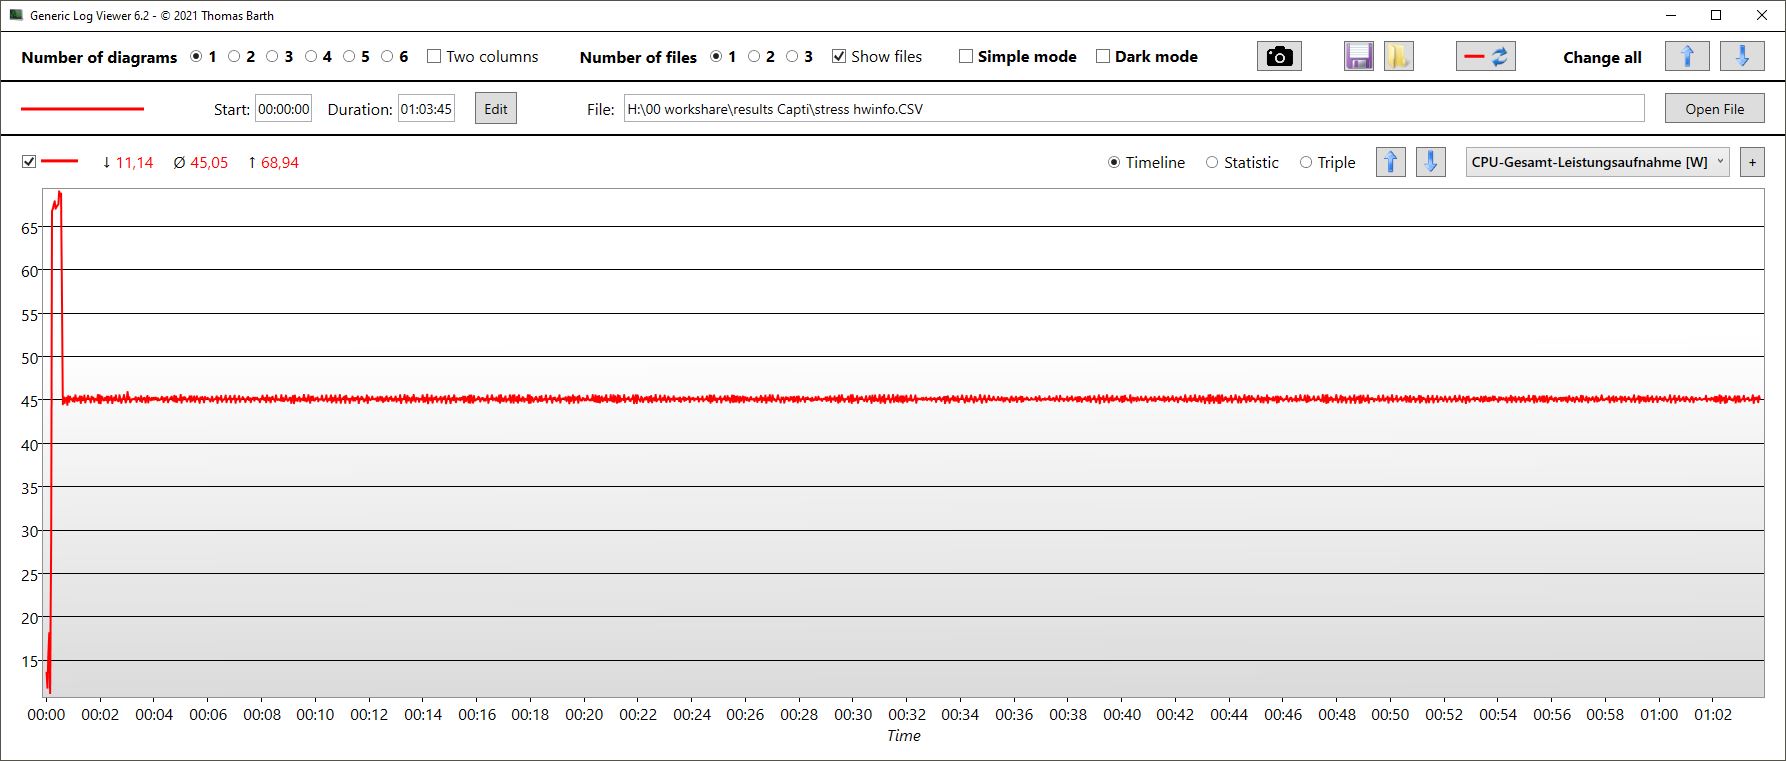
Stress test
The CPU clock rate remained surprisingly constant over our one-hour stress test. An average of about 3.1 GHz was achieved. The CPU heated up to around 72 °C and had a constant TDP of 45 watts.
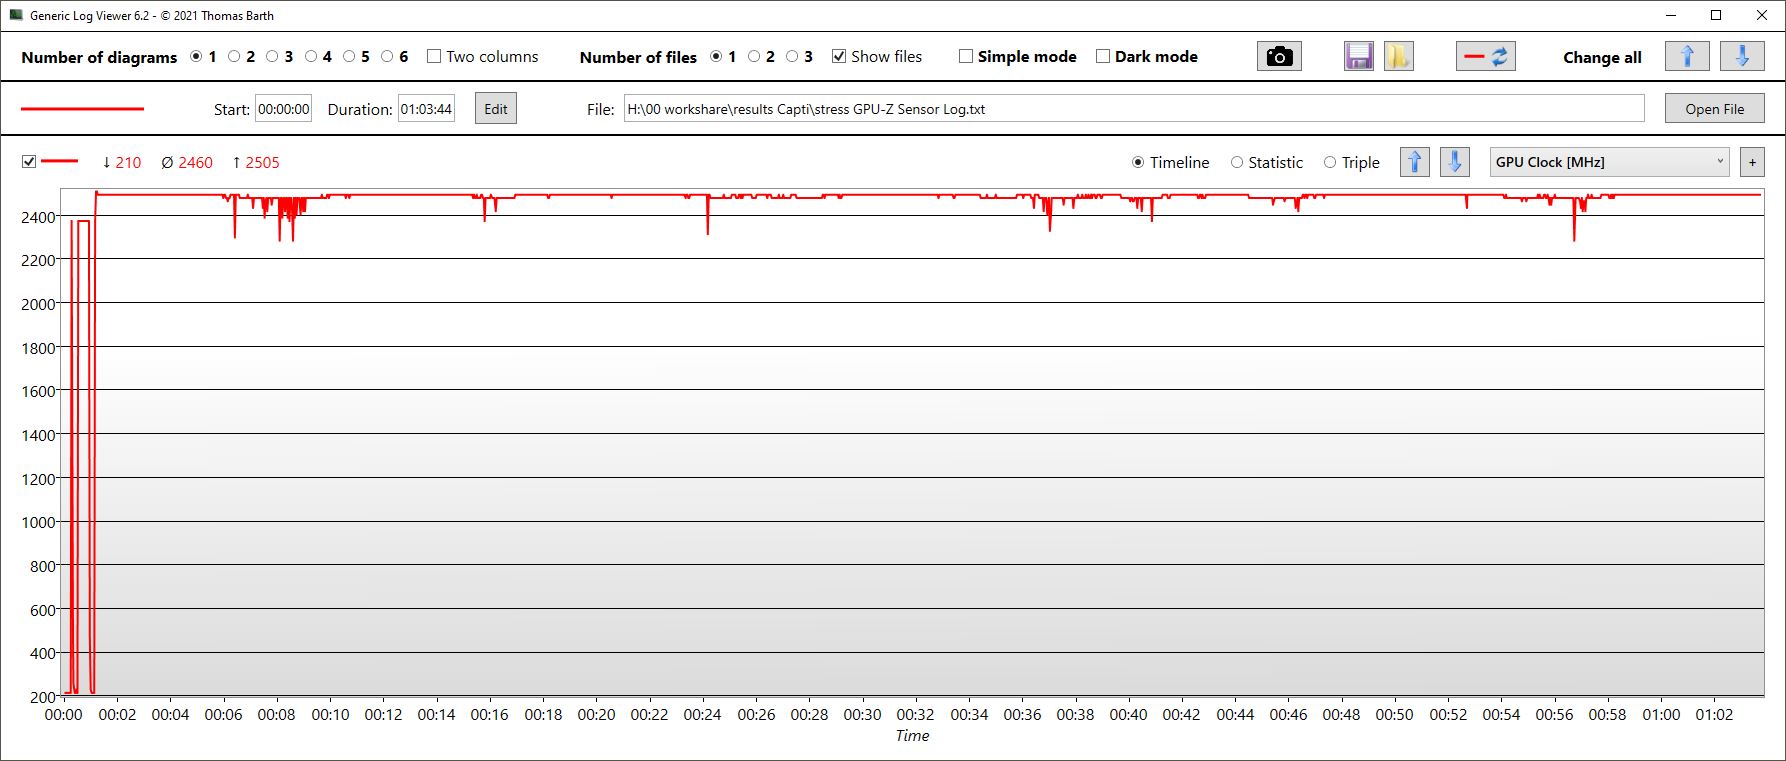
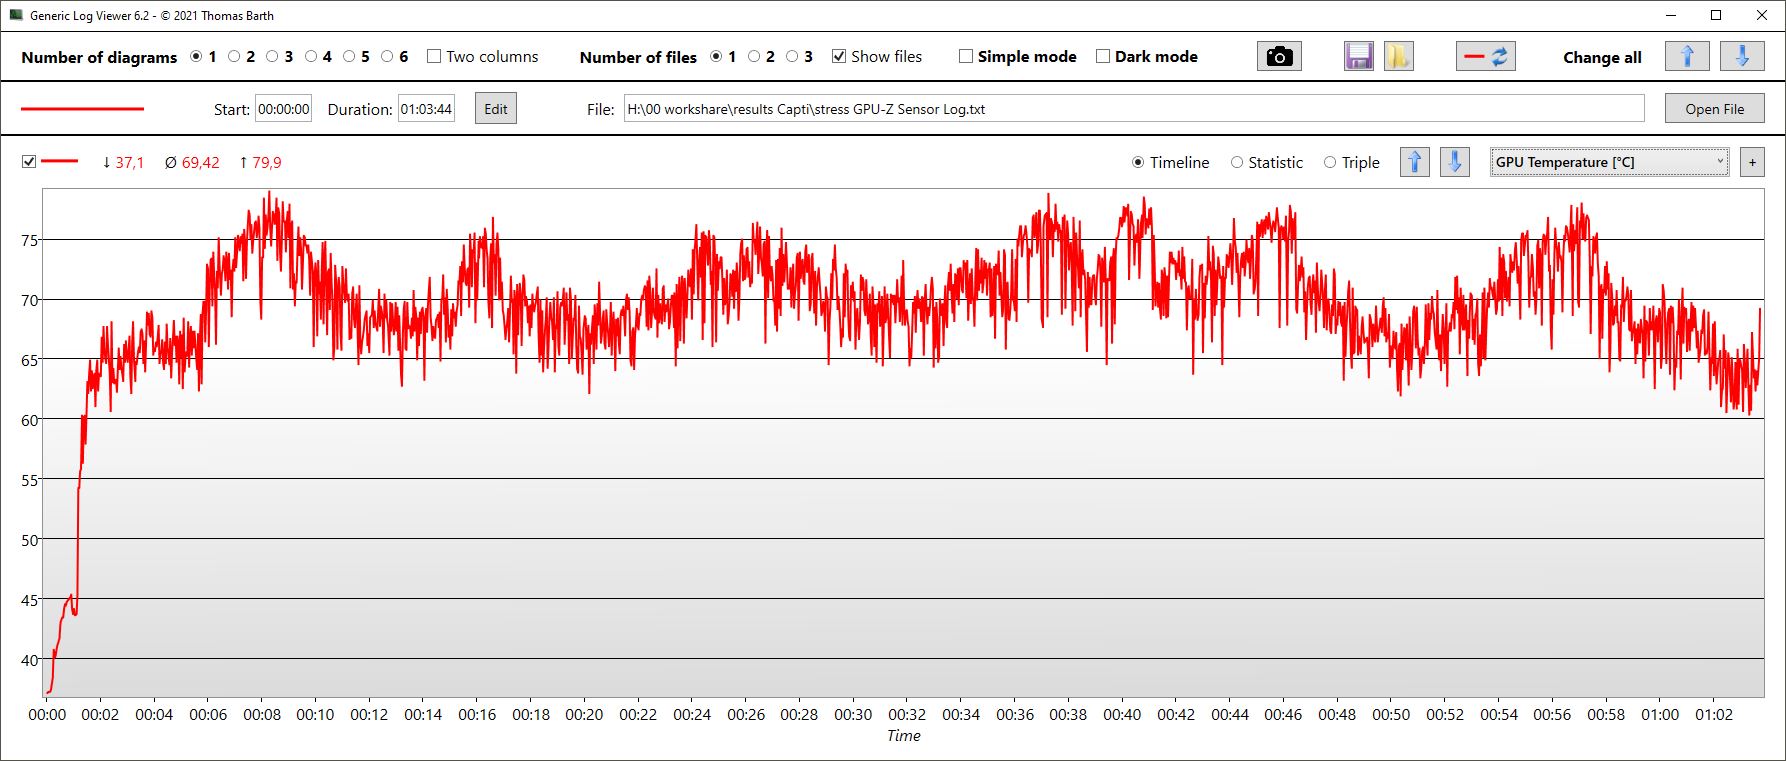
The GPU behaved similarly consistently: Its clock was 2,460 MHz, the memory clock was 2,000 MHz, and the temperature was 69 °C on average.

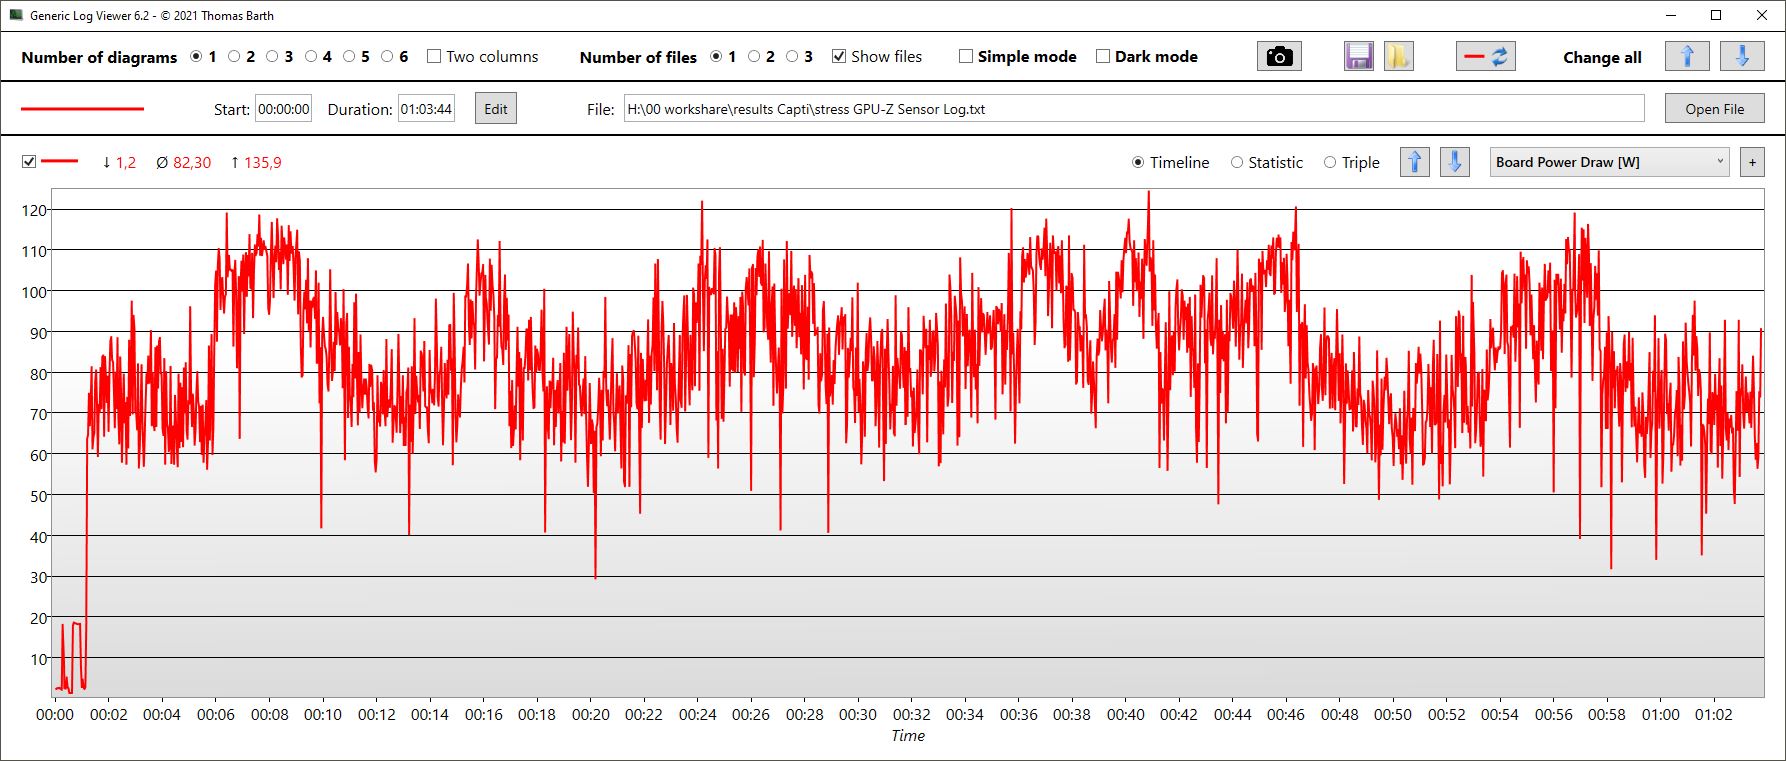
| CPU Clock (GHz) | GPU Clock (MHz) | Average CPU Temperature (°C) | Average GPU Temperature (°C) | |
| Prime95 + FurMark Stress | 3.1 | 2,460 | 72 | 69 |
| Witcher 3 Stress | 0.8 | 2,400 | 77 | 72 |
Speakers
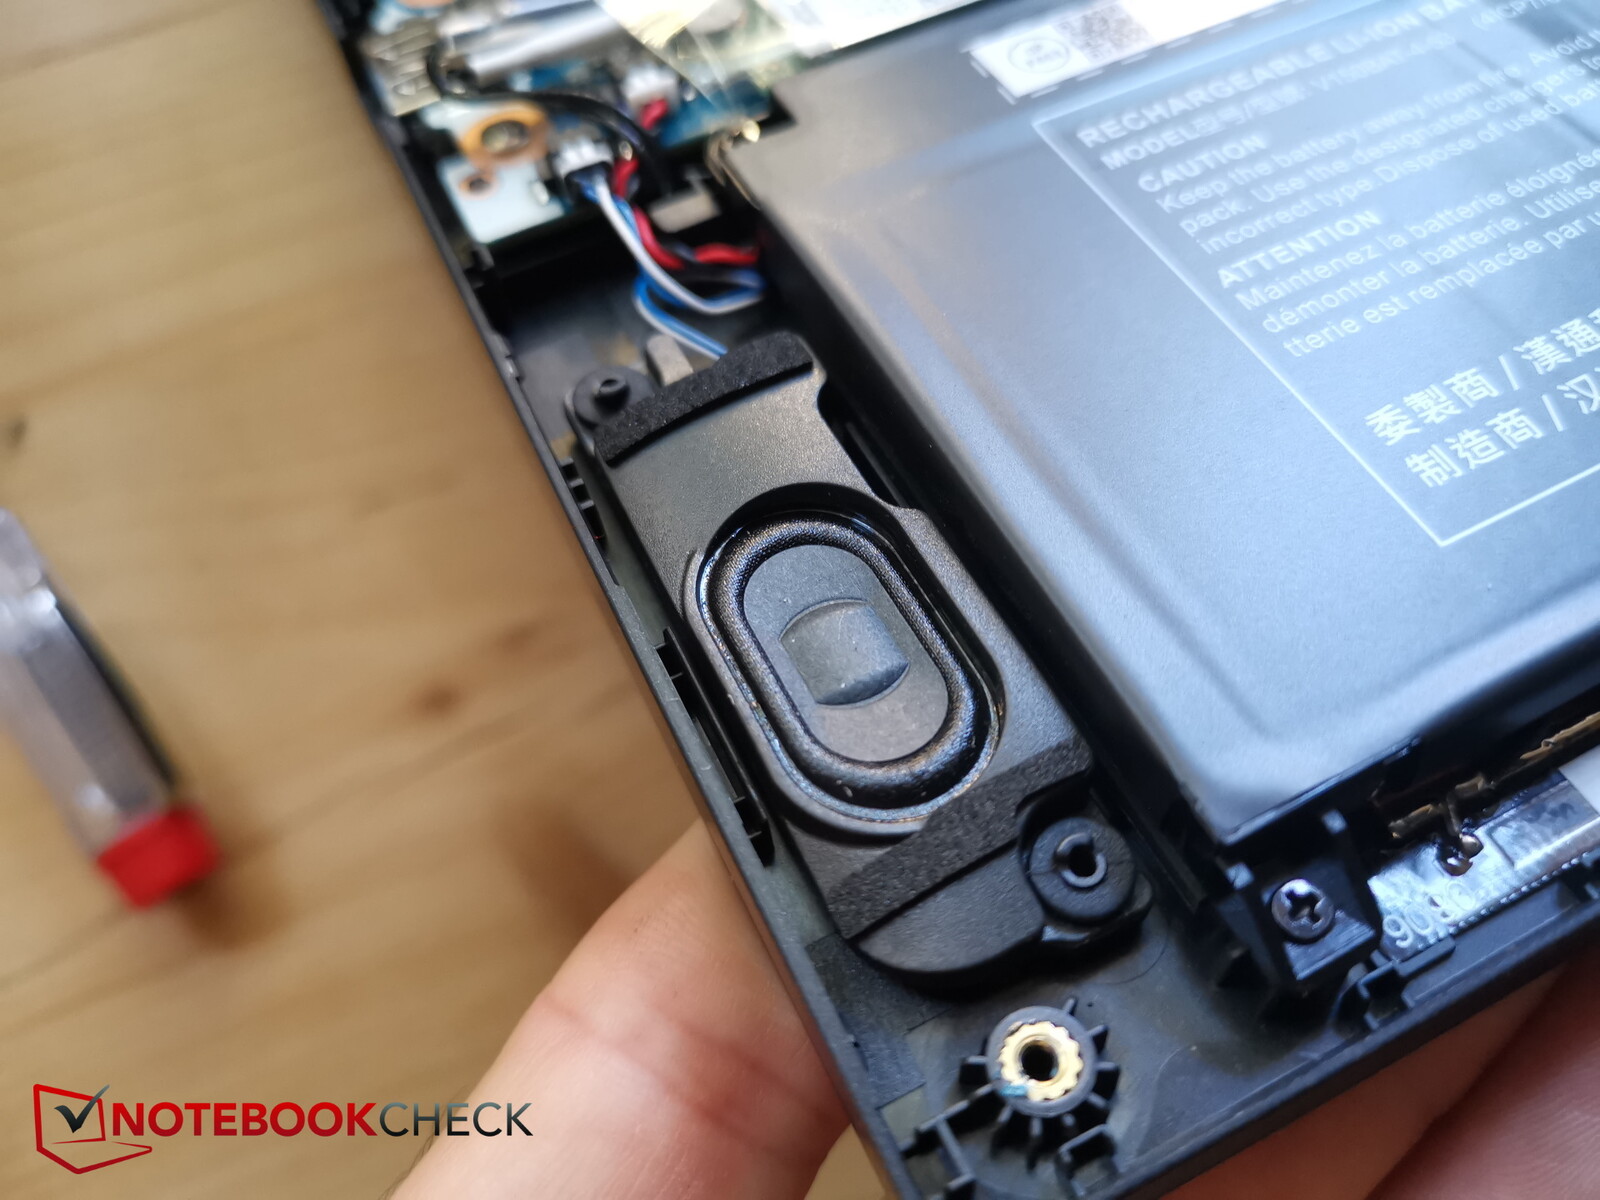
Captiva has installed stereo speakers into the area of the front corners. They radiate downwards, could be a bit louder, hardly have any bass and are otherwise rather mediocre.
In addition to the digital ports, two jacks are available for connecting other audio devices - one for headsets and headphones, the other for microphones.
Captiva Advanced Gaming I74-121 audio analysis
(±) | speaker loudness is average but good (79.02 dB)
Bass 100 - 315 Hz
(-) | nearly no bass - on average 27.2% lower than median
(±) | linearity of bass is average (12.7% delta to prev. frequency)
Mids 400 - 2000 Hz
(±) | higher mids - on average 10% higher than median
(±) | linearity of mids is average (14.2% delta to prev. frequency)
Highs 2 - 16 kHz
(+) | balanced highs - only 4.3% away from median
(±) | linearity of highs is average (9.9% delta to prev. frequency)
Overall 100 - 16.000 Hz
(-) | overall sound is not linear (30.3% difference to median)
Compared to same class
» 95% of all tested devices in this class were better, 2% similar, 3% worse
» The best had a delta of 7%, average was 19%, worst was 132%
Compared to all devices tested
» 86% of all tested devices were better, 3% similar, 11% worse
» The best had a delta of 4%, average was 26%, worst was 134%
Apple MacBook Pro 16 2021 M1 Pro audio analysis
(+) | speakers can play relatively loud (84.7 dB)
Bass 100 - 315 Hz
(+) | good bass - only 3.8% away from median
(+) | bass is linear (5.2% delta to prev. frequency)
Mids 400 - 2000 Hz
(+) | balanced mids - only 1.3% away from median
(+) | mids are linear (2.1% delta to prev. frequency)
Highs 2 - 16 kHz
(+) | balanced highs - only 1.9% away from median
(+) | highs are linear (2.7% delta to prev. frequency)
Overall 100 - 16.000 Hz
(+) | overall sound is linear (4.6% difference to median)
Compared to same class
» 0% of all tested devices in this class were better, 0% similar, 100% worse
» The best had a delta of 5%, average was 18%, worst was 45%
Compared to all devices tested
» 0% of all tested devices were better, 0% similar, 100% worse
» The best had a delta of 4%, average was 26%, worst was 134%
Power management - The Captiva has a small battery
Power consumption

The Captiva laptop could be a bit more frugal in idle mode, but its consumption rates are otherwise reasonable in view of its performance. The Dell G15, which is about as powerful when it comes to gaming, consumes considerably more due to its stronger HX processor.
The weaker other competitors are throttled and, as a result, are much more frugal under load.
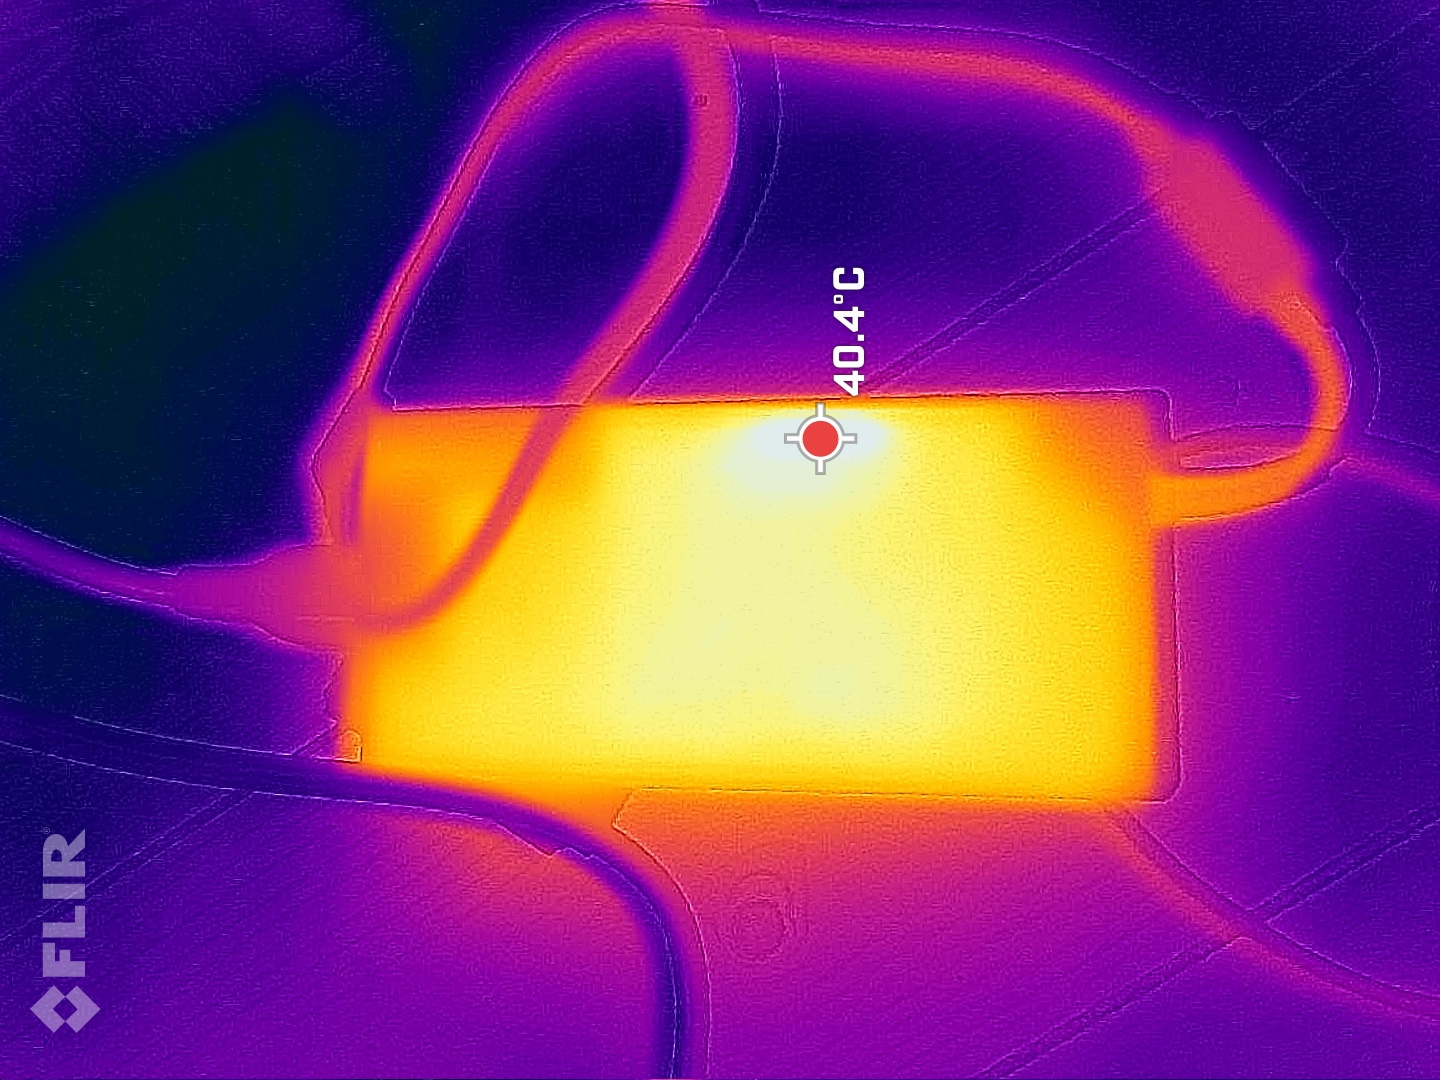
We measured a maximum load of 219 watts for a short time, which the 230-watt power supply could handle well.
| Off / Standby | |
| Idle | |
| Load |
|
| Captiva Advanced Gaming I74-121 i5-13500H, NVIDIA GeForce RTX 4060 Laptop GPU, Samsung SSD 980 1TB MZ-V8V1T0BW, IPS, 1920x1080, 15.60 | MSI Cyborg 15 A12VF i7-12650H, NVIDIA GeForce RTX 4060 Laptop GPU, Samsung PM9B1 1024GB MZVL41T0HBLB, IPS, 1920x1080, 15.60 | Dell G15 5530 i7-13650HX, NVIDIA GeForce RTX 4060 Laptop GPU, SSTC CL4-3D512-Q11, IPS, 1920x1080, 15.60 | Lenovo Legion Slim 5 16APH8 R7 7840HS, NVIDIA GeForce RTX 4060 Laptop GPU, SK hynix PC801 HFS512GEJ9X115N, IPS, 2560x1600, 16.00 | Lenovo LOQ 15APH8 R7 7840HS, NVIDIA GeForce RTX 4050 Laptop GPU, Micron 2450 512GB MTFDKCD512TFK, IPS, 1920x1080, 15.60 | SCHENKER XMG Core 15 (M22) R7 6800H, GeForce RTX 3060 Laptop GPU, Samsung SSD 980 Pro 1TB MZ-V8P1T0BW, IPS, 2560x1440, 15.60 | Average NVIDIA GeForce RTX 4060 Laptop GPU | Average of class Gaming | |
|---|---|---|---|---|---|---|---|---|
| Power Consumption | 44% | 9% | 17% | 12% | 9% | 8% | -8% | |
| Idle Minimum * | 18.4 | 6 67% | 8.4 54% | 9.4 49% | 15 18% | 11.8 36% | 12.7 ? 31% | 14 ? 24% |
| Idle Average * | 20 | 8.8 56% | 14.98 25% | 15.5 22% | 17.7 11% | 14.7 26% | 16.8 ? 16% | 19.1 ? 4% |
| Idle Maximum * | 20.7 | 11.9 43% | 15.56 25% | 24.4 -18% | 21.5 -4% | 15 28% | 21.1 ? -2% | 26 ? -26% |
| Load Average * | 85 | 89 -5% | 96.8 -14% | 74.1 13% | 73.5 14% | 100 -18% | 94.2 ? -11% | 111.8 ? -32% |
| Witcher 3 ultra * | 164 | 90.3 45% | 186 -13% | 112.9 31% | 138.6 15% | 184 -12% | ||
| Load Maximum * | 219 | 99 55% | 271.42 -24% | 206.5 6% | 176.5 19% | 237 -8% | 211 ? 4% | 246 ? -12% |
* ... smaller is better
Power consumption Witcher 3 / Stress test
Power consumption with external monitor
Runtimes
Fitted with a 53-Wh battery, the low-priced Captiva isn't the best; the Dell G15 has an 86-Wh battery, Schenker and Lenovo use 60 Wh, and only the MSI Cyborg uses 53 Wh as well.
Subsequently, the Captiva lasted just under 5 hours in our WLAN and video test when using its own power-saving mode.
| Captiva Advanced Gaming I74-121 i5-13500H, NVIDIA GeForce RTX 4060 Laptop GPU, 53 Wh | MSI Cyborg 15 A12VF i7-12650H, NVIDIA GeForce RTX 4060 Laptop GPU, 53.5 Wh | Dell G15 5530 i7-13650HX, NVIDIA GeForce RTX 4060 Laptop GPU, 86 Wh | Lenovo Legion Slim 5 16APH8 R7 7840HS, NVIDIA GeForce RTX 4060 Laptop GPU, 80 Wh | Lenovo LOQ 15APH8 R7 7840HS, NVIDIA GeForce RTX 4050 Laptop GPU, 60 Wh | SCHENKER XMG Core 15 (M22) R7 6800H, GeForce RTX 3060 Laptop GPU, 62 Wh | Average of class Gaming | |
|---|---|---|---|---|---|---|---|
| Battery Runtime | 50% | 4% | 4% | 4% | 8% | 12% | |
| H.264 | 296 | 480 62% | 405 37% | 383 ? 29% | |||
| WiFi v1.3 | 315 | 452 43% | 391 24% | 425 35% | 441 40% | 465 48% | 361 ? 15% |
| Load | 96 | 140 46% | 50 -48% | 70 -27% | 65 -32% | 64 -33% | 87 ? -9% |
| Reader / Idle | 817 | 699 | 587 | 535 ? | |||
| Witcher 3 ultra | 47 | 77.9 ? |
Pros
Cons
Verdict - Focussing on the essentials of a gaming laptop
The Captiva Advanced Gaming may not use the fastest processor but even so, it leaves no doubts about the 3D performance of its slightly above-average RTX 4060. Subsequently, the manufacturer focuses on the essentials: gaming performance.
For the relatively low price of US$1,800, you also have to make a few compromises. This includes the lack of Thunderbolt and an SD card reader, as well as its outdated USB 2.0 port.
The Captiva Advanced Gaming I74-121 offers quite high 3D performance for a relatively low price. Compromises have to be made when it comes to its connectivity options.
There are some viable alternatives, although its price is temptingly low. In many comparisons, the Dell G15 counts as one of its harshest competitors. It offers better CPU performance and a bigger battery but in turn, it gets much hotter and has a higher consumption.
Price and availability
Our test model retails for around US$1,800. It currently cannot be found for purchase from any US online retailers.
You can check out similar devices, such as the Dell G15, on Amazon.
Captiva Advanced Gaming I74-121
-
09/22/2023 v7
Christian Hintze
More articles related to this device
Captiva Advanced Gaming I74-121 (Advanced Gaming Series)Related Articles


Transparency
The present review sample was made available to the author as a loan by the manufacturer or a shop for the purposes of review. The lender had no influence on this review, nor did the manufacturer receive a copy of this review before publication. There was no obligation to publish this review.
Pricecompare

