 Deutsch
 English
 Español
 Français
 Italiano
 Nederlands
 Polski
 Português
 Русский
 Türkçe
 Svenska
 Chinese
 Magyar
HP ZBook Fury 16 G10 mobile workstation review: 100 W Nvidia RTX 5000 Ada

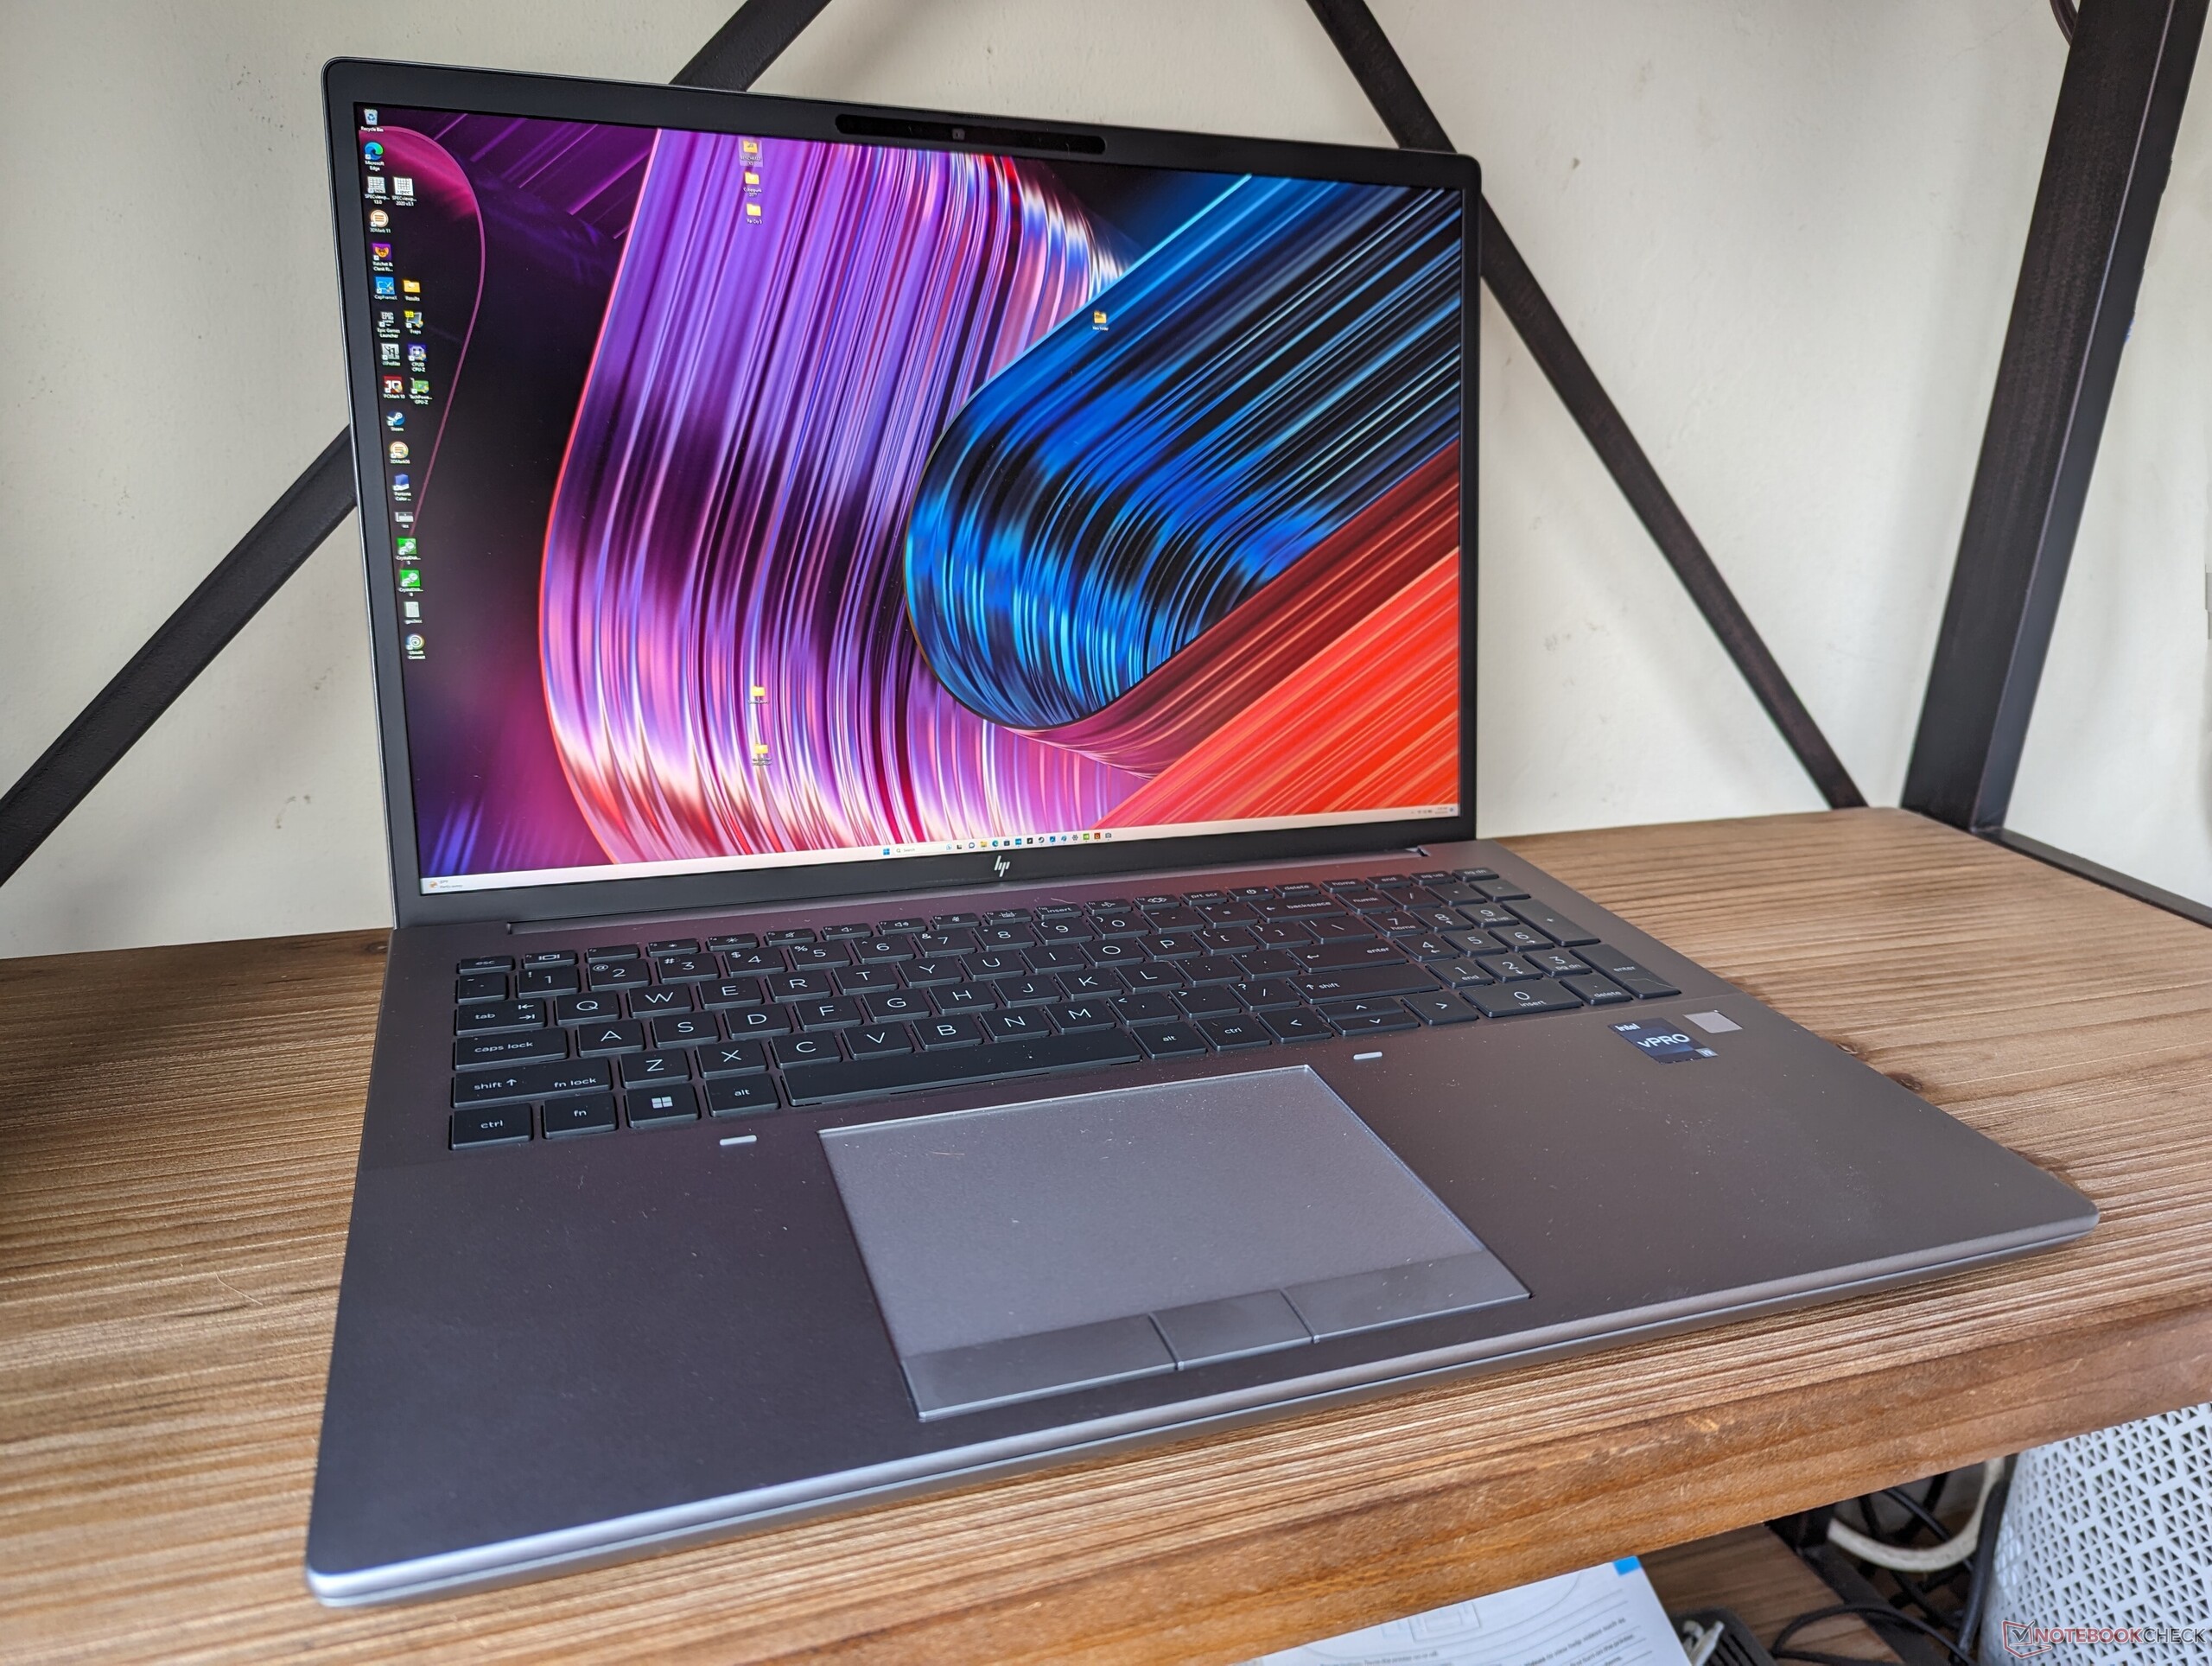
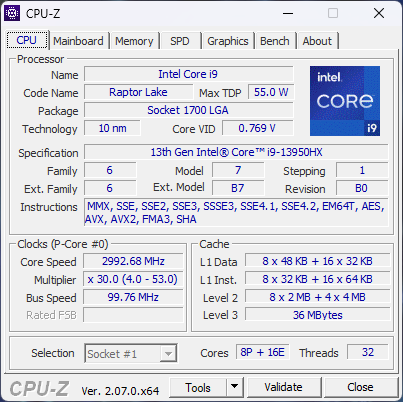
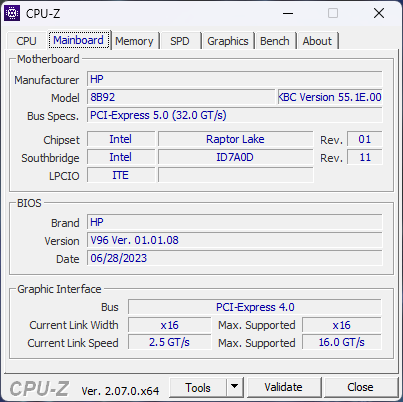
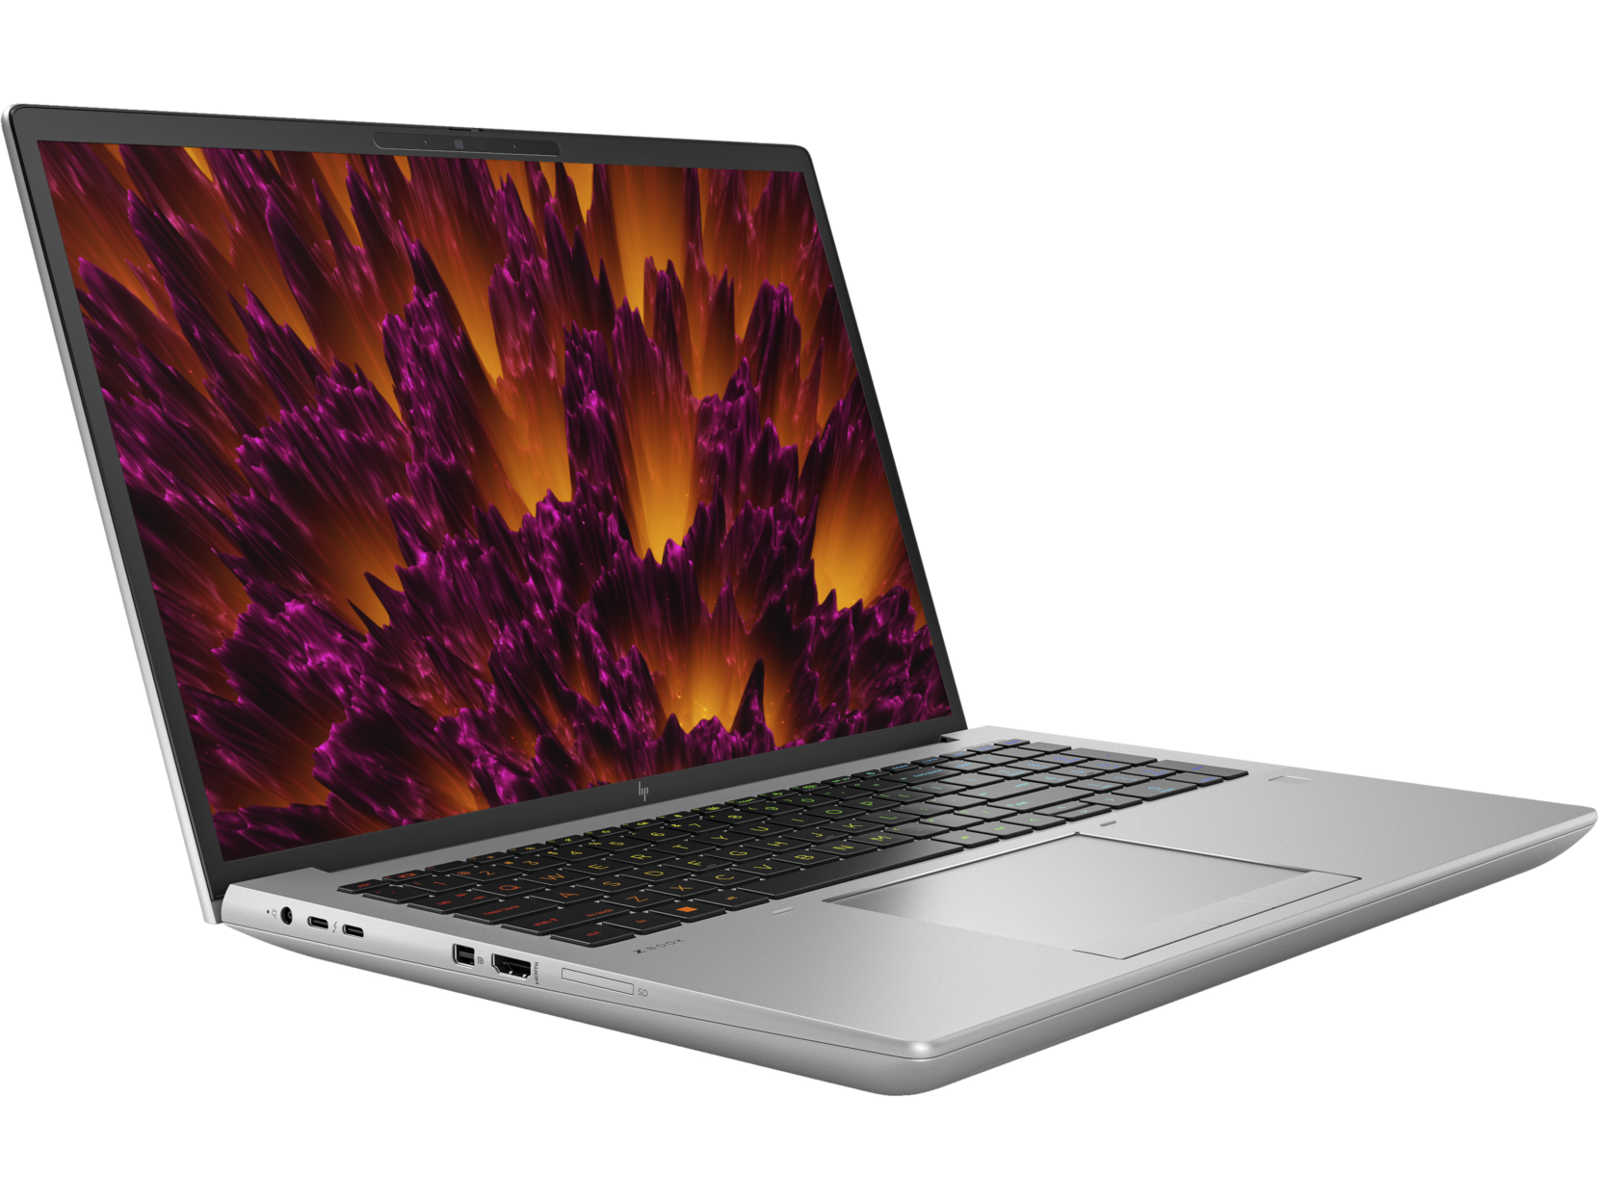
The ZBook Fury 16 G10 directly succeeds last year's ZBook Fury 16 G9 with new 13th gen Raptor Lake-HX CPU and Nvidia RTX Ada GPU options to replace the older 12th gen Alder Lake and RTX Ampere processors, respectively. The new model is otherwise visually identical to the Fury 16 G9 and so we recommend catching up on our review for last year's model to learn more about the physical features of the Fury 16 G10.
Our specific review unit is a higher-end configuration with the Core i9-13950HX, Nvidia RTX 5000 Ada, and 2400p IPS display for approximately $5300 USD retail. Lesser configurations are available for lower starting prices as detailed by the official HP specifications list.
Alternatives to the Fury 16 G10 include other 16-inch mobile workstations like the Dell Precision 5680, Lenovo ThinkPad P16 G1, MSI CreatorPro Z16P, or the Asus ProArt StudioBook 16.
More HP reviews:
Potential Competitors in Comparison
Rating | Date | Model | Weight | Height | Size | Resolution | Best Price |
|---|---|---|---|---|---|---|---|
| 92.3 % | 09/2023 | HP ZBook Fury 16 G10 i9-13950HX, NVIDIA RTX 5000 Ada Generation Laptop GPU | 2.6 kg | 28.5 mm | 16.00" | 3840x2400 | |
| 91 % | 06/2023 | HP ZBook Fury 16 G9 i9-12950HX, RTX A5500 Laptop GPU | 2.6 kg | 28.5 mm | 16.00" | 3840x2400 | |
| 89 % | 08/2023 | Dell Precision 5000 5680 i9-13900H, NVIDIA RTX 5000 Ada Generation Laptop GPU | 2.3 kg | 22.17 mm | 16.00" | 3840x2400 | |
| 91 % | 02/2023 | Lenovo ThinkPad P16 G1 RTX A5500 i9-12950HX, RTX A5500 Laptop GPU | 3 kg | 30.23 mm | 16.00" | 3840x2400 | |
| 84.3 % | 11/2022 | MSI CreatorPro Z16P B12UKST i7-12700H, RTX A3000 Laptop GPU | 2.4 kg | 19 mm | 16.00" | 2560x1600 | |
12/2021 | Asus ProArt StudioBook 16 W7600H5A-2BL2 W-11955M, RTX A5000 Laptop GPU | 2.4 kg | 21.4 mm | 16.00" | 3840x2400 |
Case — Familiar ZBook Fury 16 G9 Design
SD Card Reader
| SD Card Reader | |
| average JPG Copy Test (av. of 3 runs) | |
| Dell Precision 5000 5680 (Toshiba Exceria Pro SDXC 64 GB UHS-II) | |
| MSI CreatorPro Z16P B12UKST (AV Pro V60) | |
| HP ZBook Fury 16 G10 (Toshiba Exceria Pro SDXC 64 GB UHS-II) | |
| HP ZBook Fury 16 G9 (PNY EliteX-PRO60) | |
| Lenovo ThinkPad P16 G1 RTX A5500 (Toshiba Exceria Pro SDXC 64 GB UHS-II) | |
| Asus ProArt StudioBook 16 W7600H5A-2BL2 (AV Pro SD microSD 128 GB V60) | |
| maximum AS SSD Seq Read Test (1GB) | |
| Dell Precision 5000 5680 (Toshiba Exceria Pro SDXC 64 GB UHS-II) | |
| HP ZBook Fury 16 G10 (Toshiba Exceria Pro SDXC 64 GB UHS-II) | |
| Asus ProArt StudioBook 16 W7600H5A-2BL2 (AV Pro SD microSD 128 GB V60) | |
| HP ZBook Fury 16 G9 (PNY EliteX-PRO60) | |
| MSI CreatorPro Z16P B12UKST (AV Pro V60) | |
| Lenovo ThinkPad P16 G1 RTX A5500 (Toshiba Exceria Pro SDXC 64 GB UHS-II) | |
Communication
| Networking | |
| iperf3 transmit AX12 | |
| Asus ProArt StudioBook 16 W7600H5A-2BL2 | |
| iperf3 receive AX12 | |
| Asus ProArt StudioBook 16 W7600H5A-2BL2 | |
| iperf3 transmit AXE11000 | |
| HP ZBook Fury 16 G10 | |
| Lenovo ThinkPad P16 G1 RTX A5500 | |
| Dell Precision 5000 5680 | |
| HP ZBook Fury 16 G9 | |
| iperf3 receive AXE11000 | |
| HP ZBook Fury 16 G9 | |
| HP ZBook Fury 16 G10 | |
| Lenovo ThinkPad P16 G1 RTX A5500 | |
| Dell Precision 5000 5680 | |
| iperf3 transmit AXE11000 6GHz | |
| MSI CreatorPro Z16P B12UKST | |
| Lenovo ThinkPad P16 G1 RTX A5500 | |
| HP ZBook Fury 16 G10 | |
| Dell Precision 5000 5680 | |
| iperf3 receive AXE11000 6GHz | |
| MSI CreatorPro Z16P B12UKST | |
| HP ZBook Fury 16 G10 | |
| Lenovo ThinkPad P16 G1 RTX A5500 | |
| Dell Precision 5000 5680 | |
Webcam
HP laptops continue to have some of the highest resolution webcams in the market. The 5 MP sensor on the Fury 16 G10 offers a much cleaner picture than the 2 MP webcam on the Precision 5680.


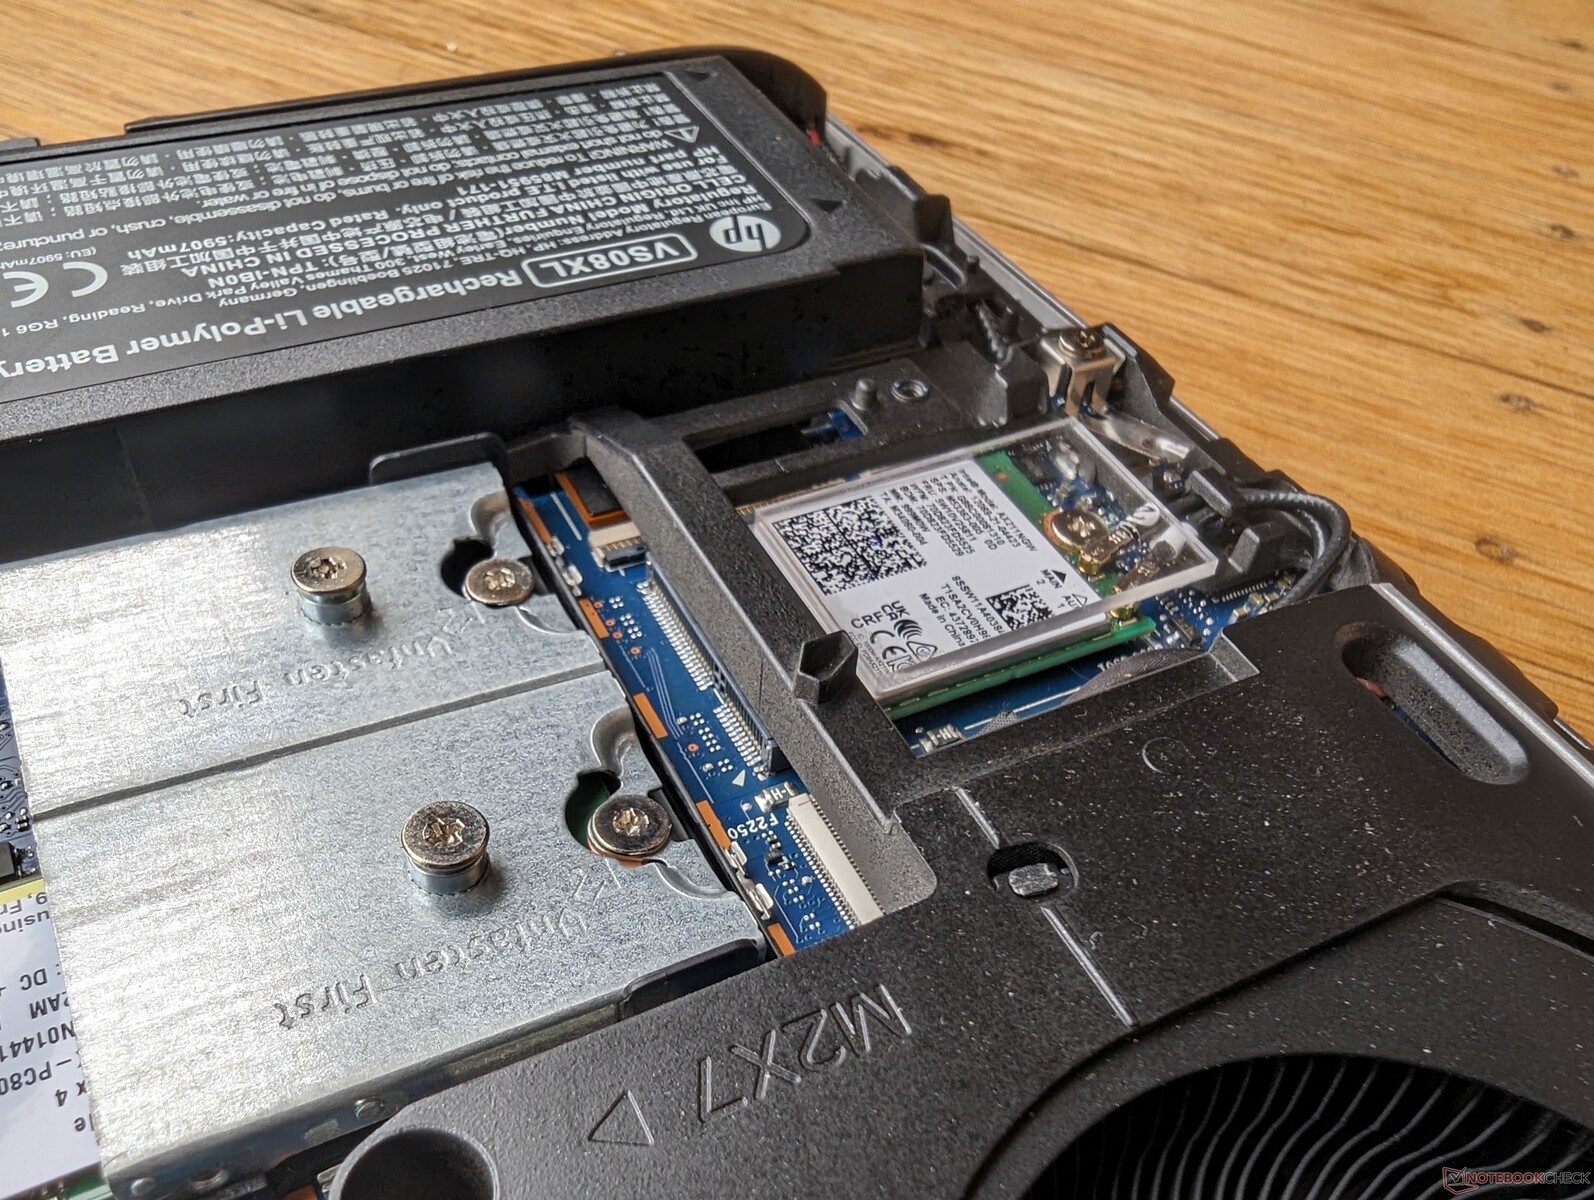
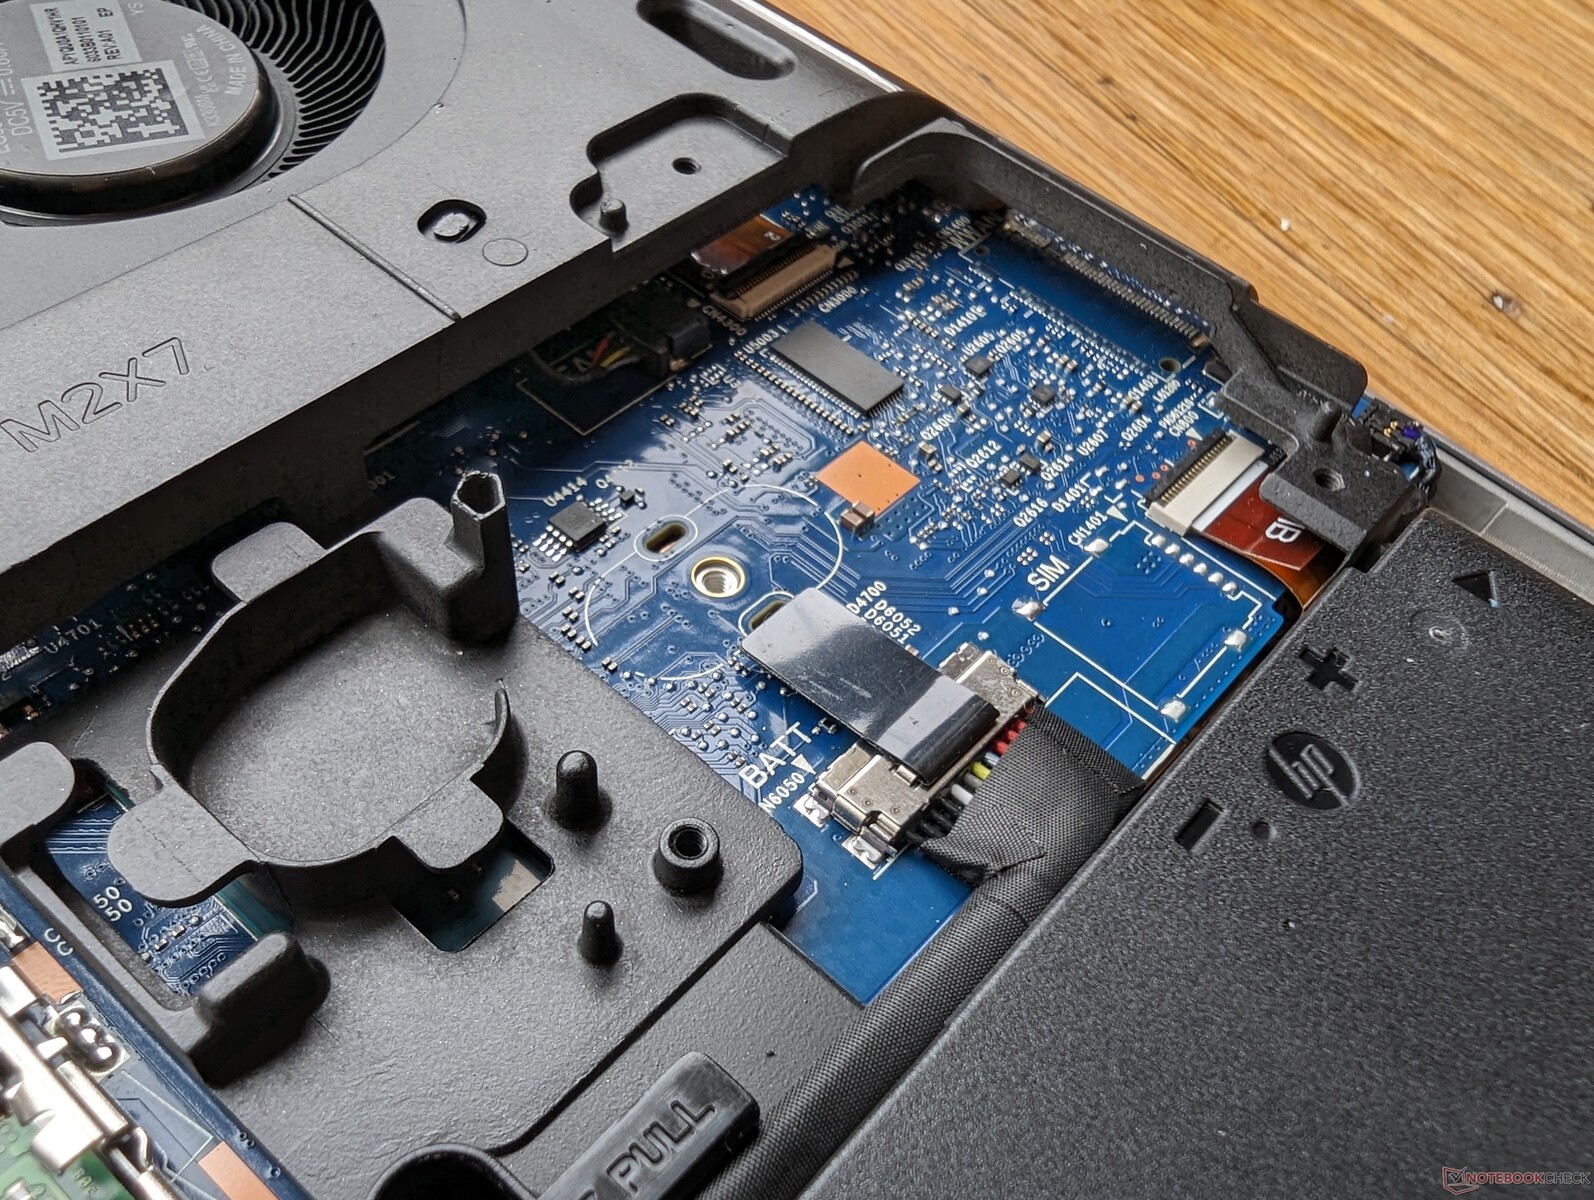
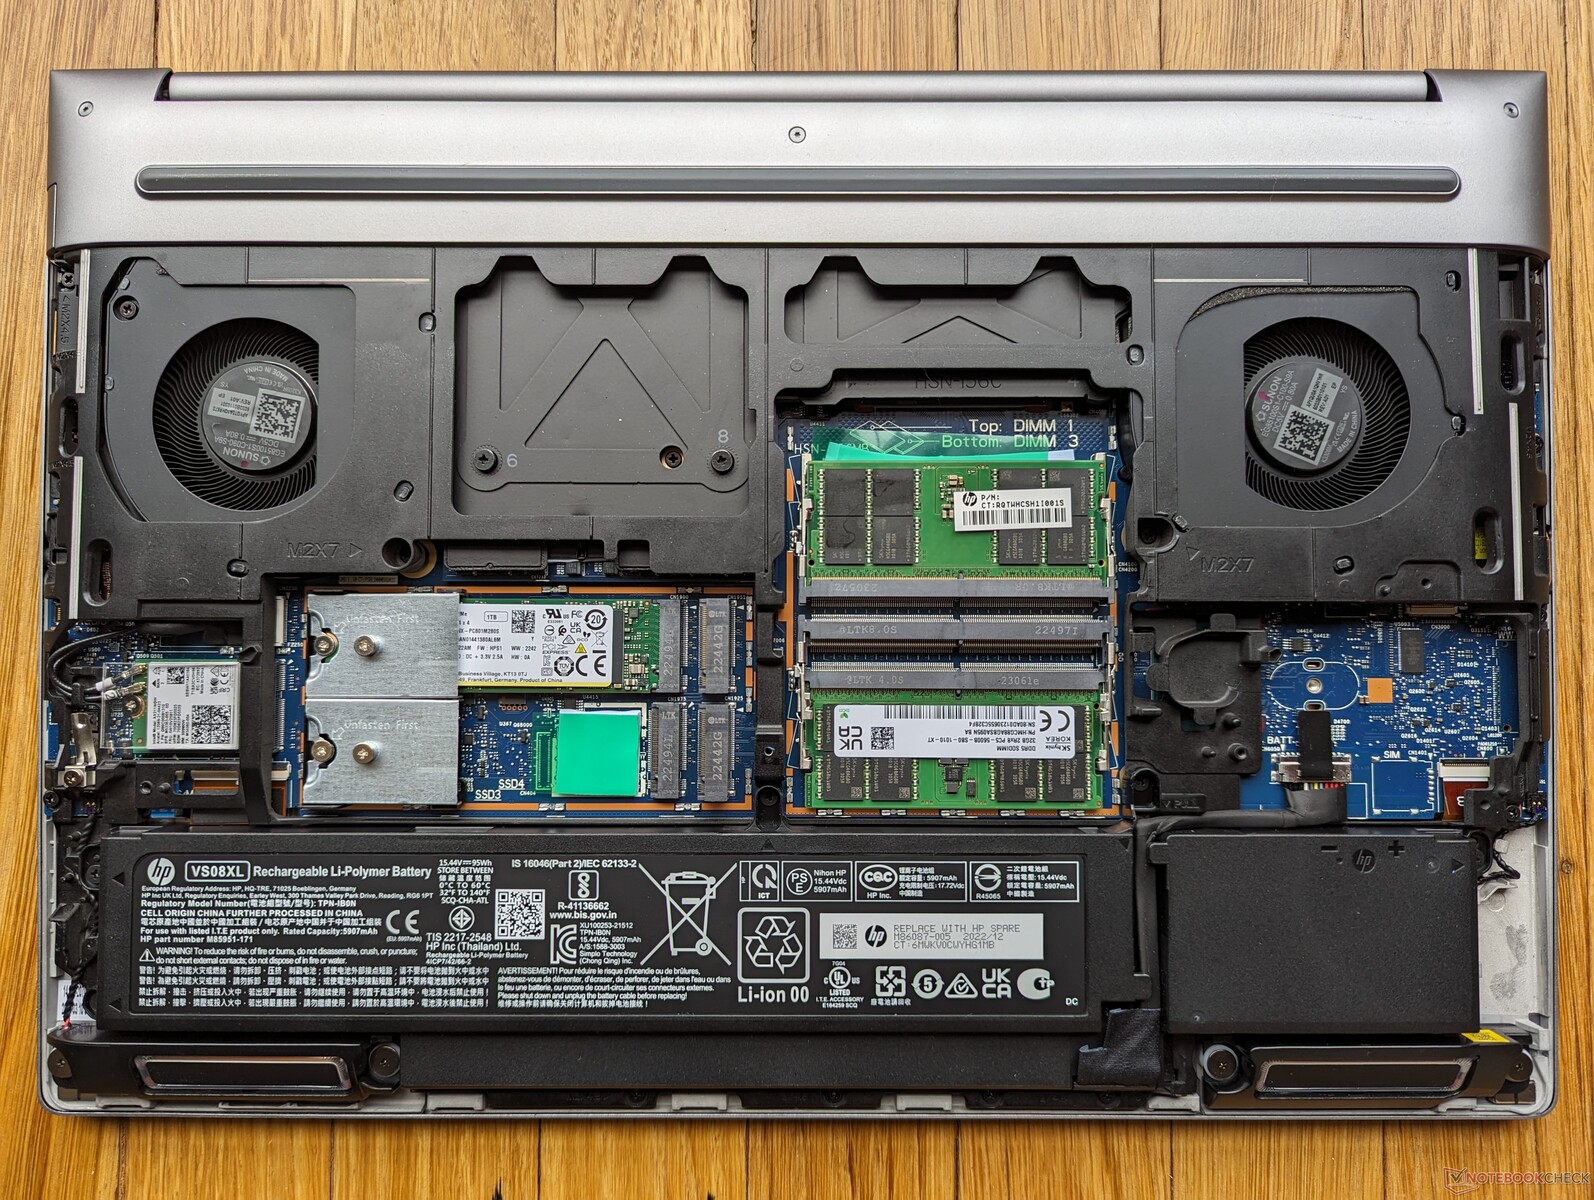
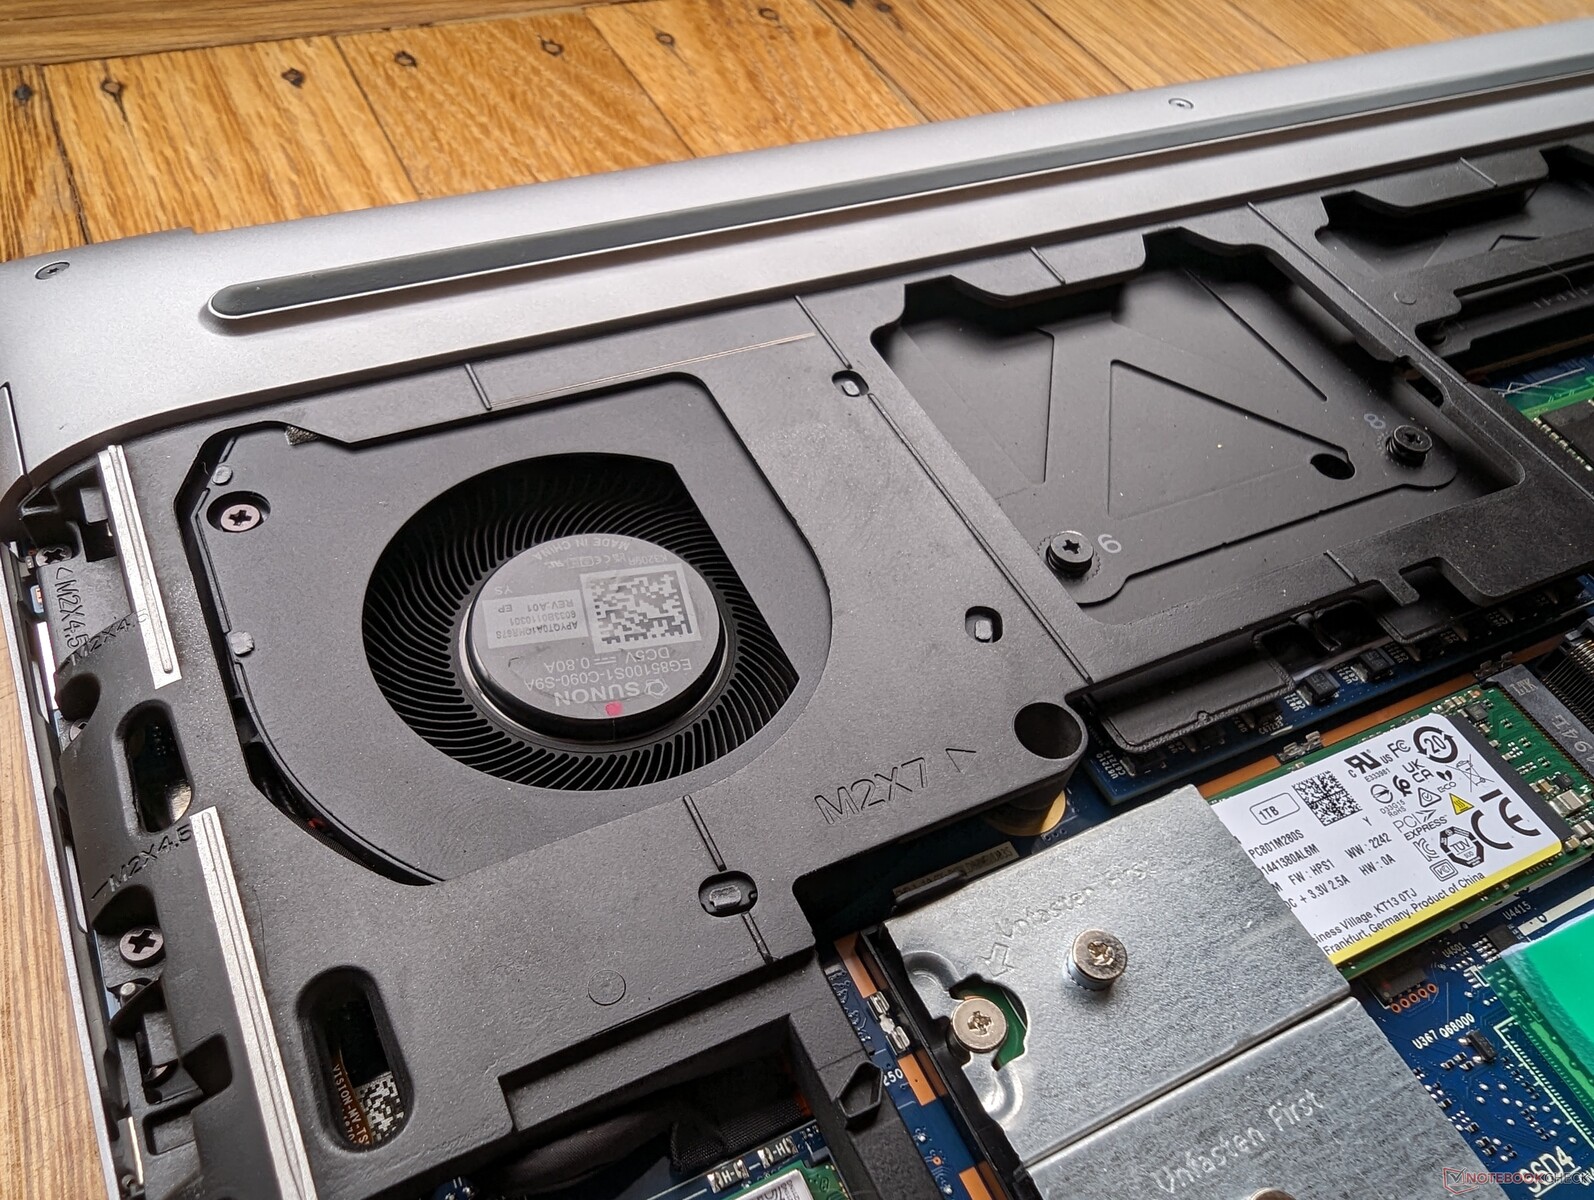
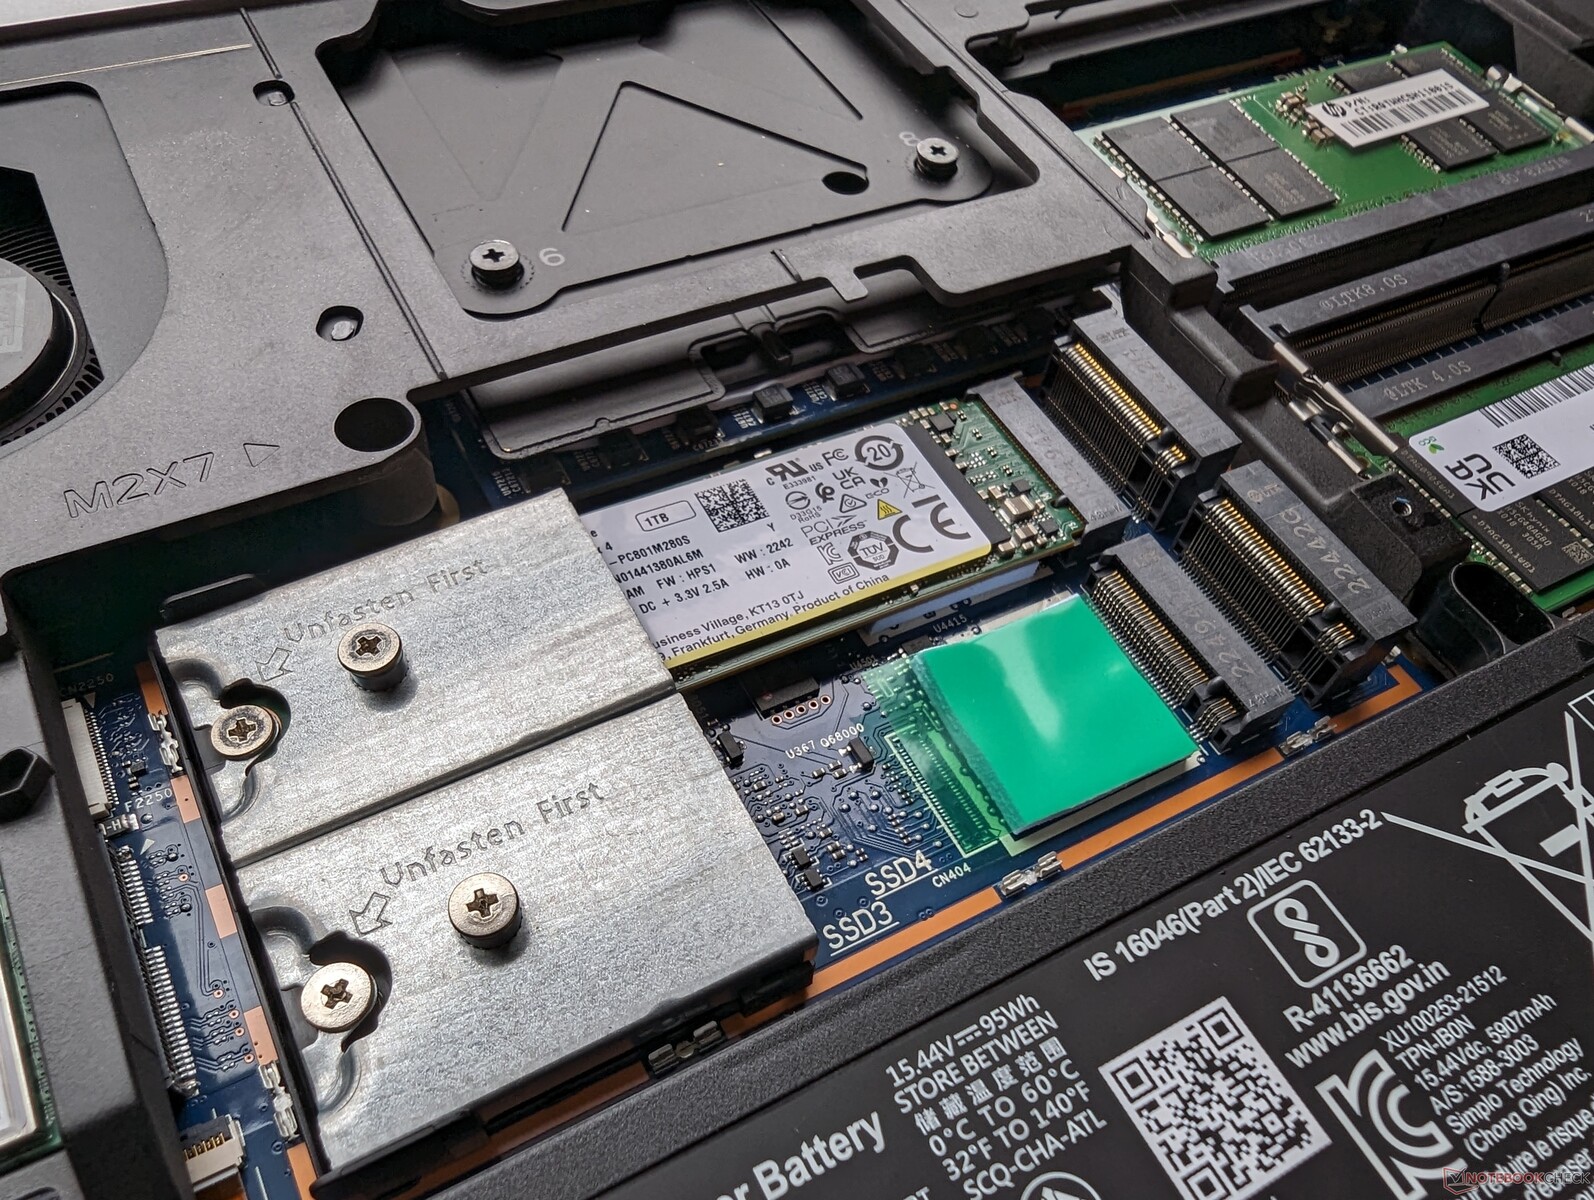
Maintenance
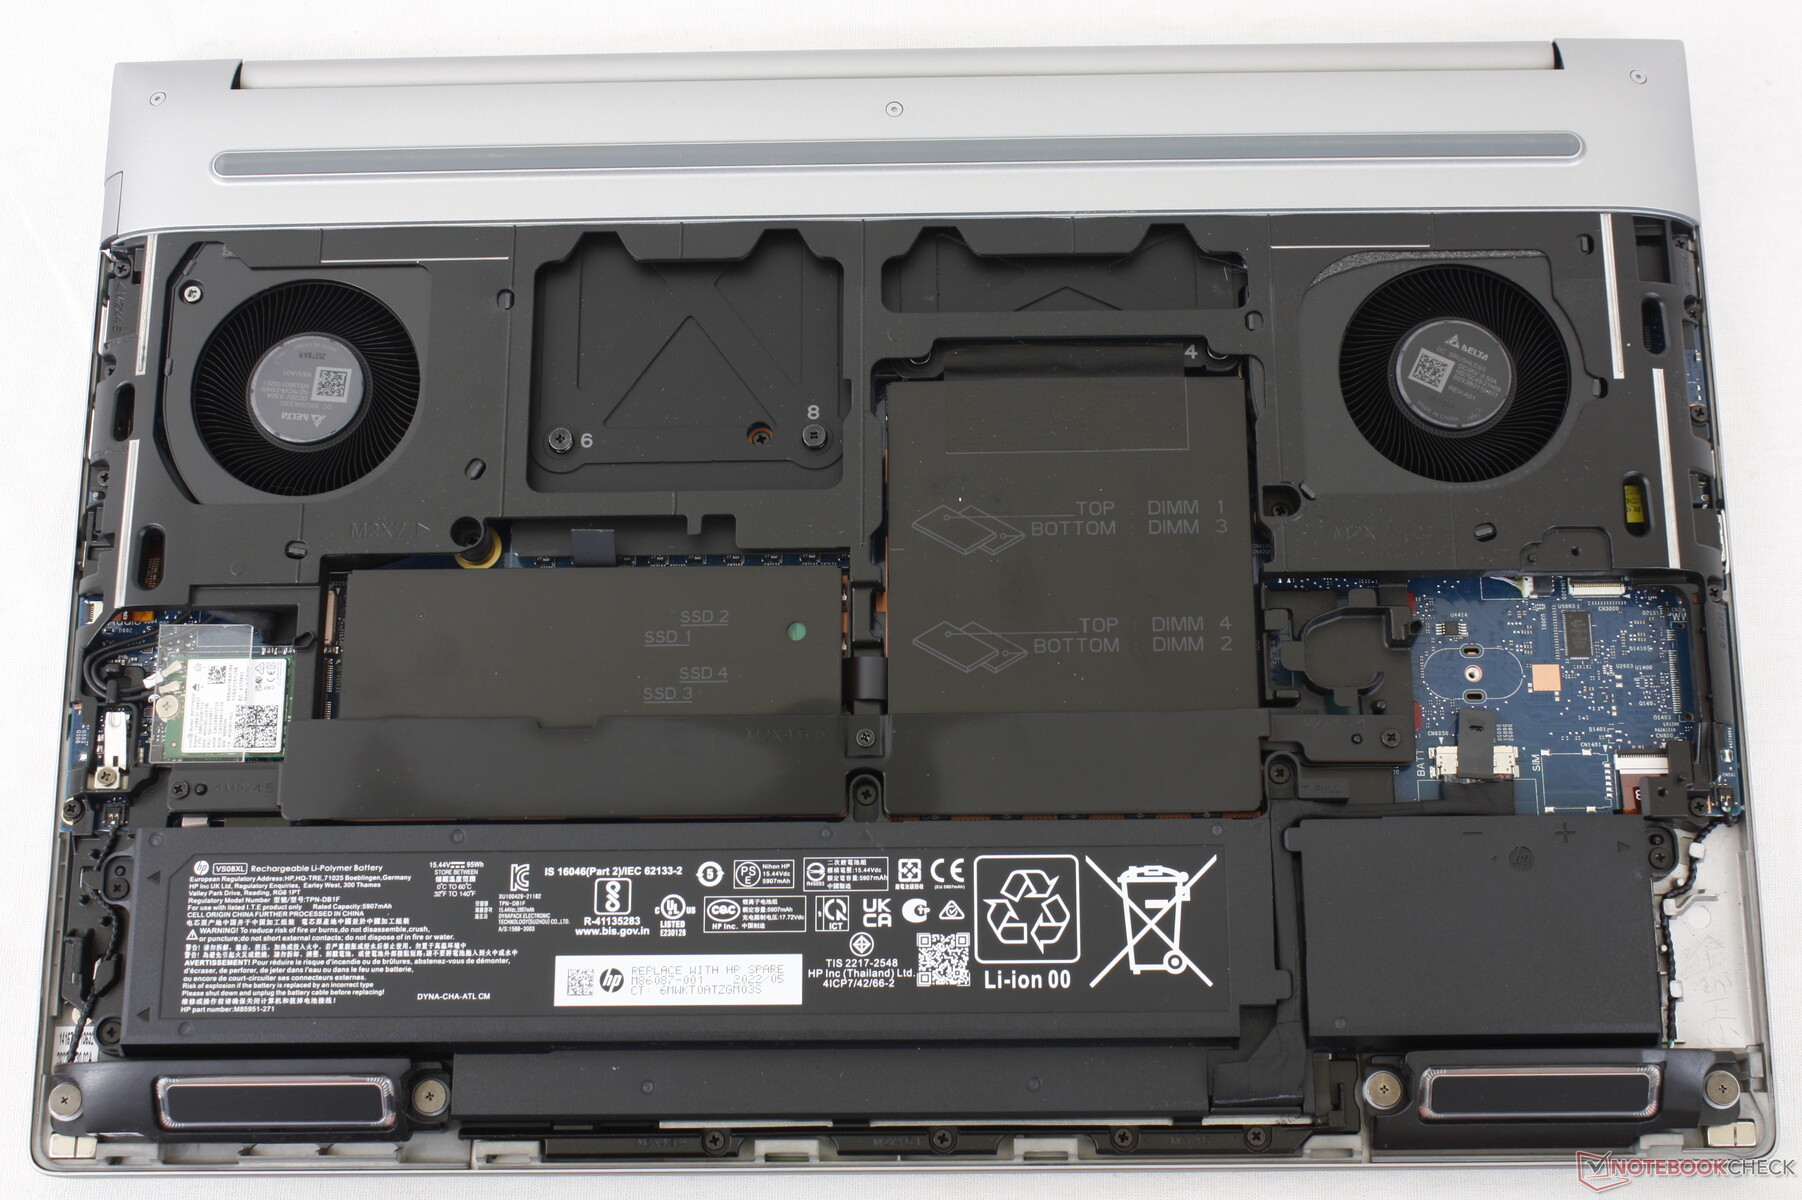
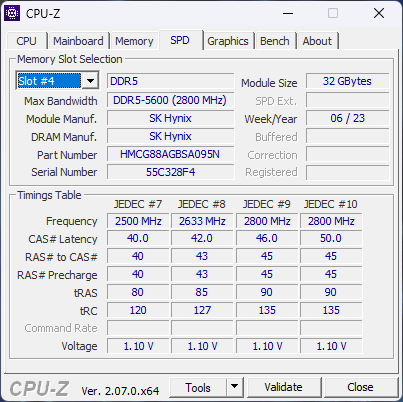
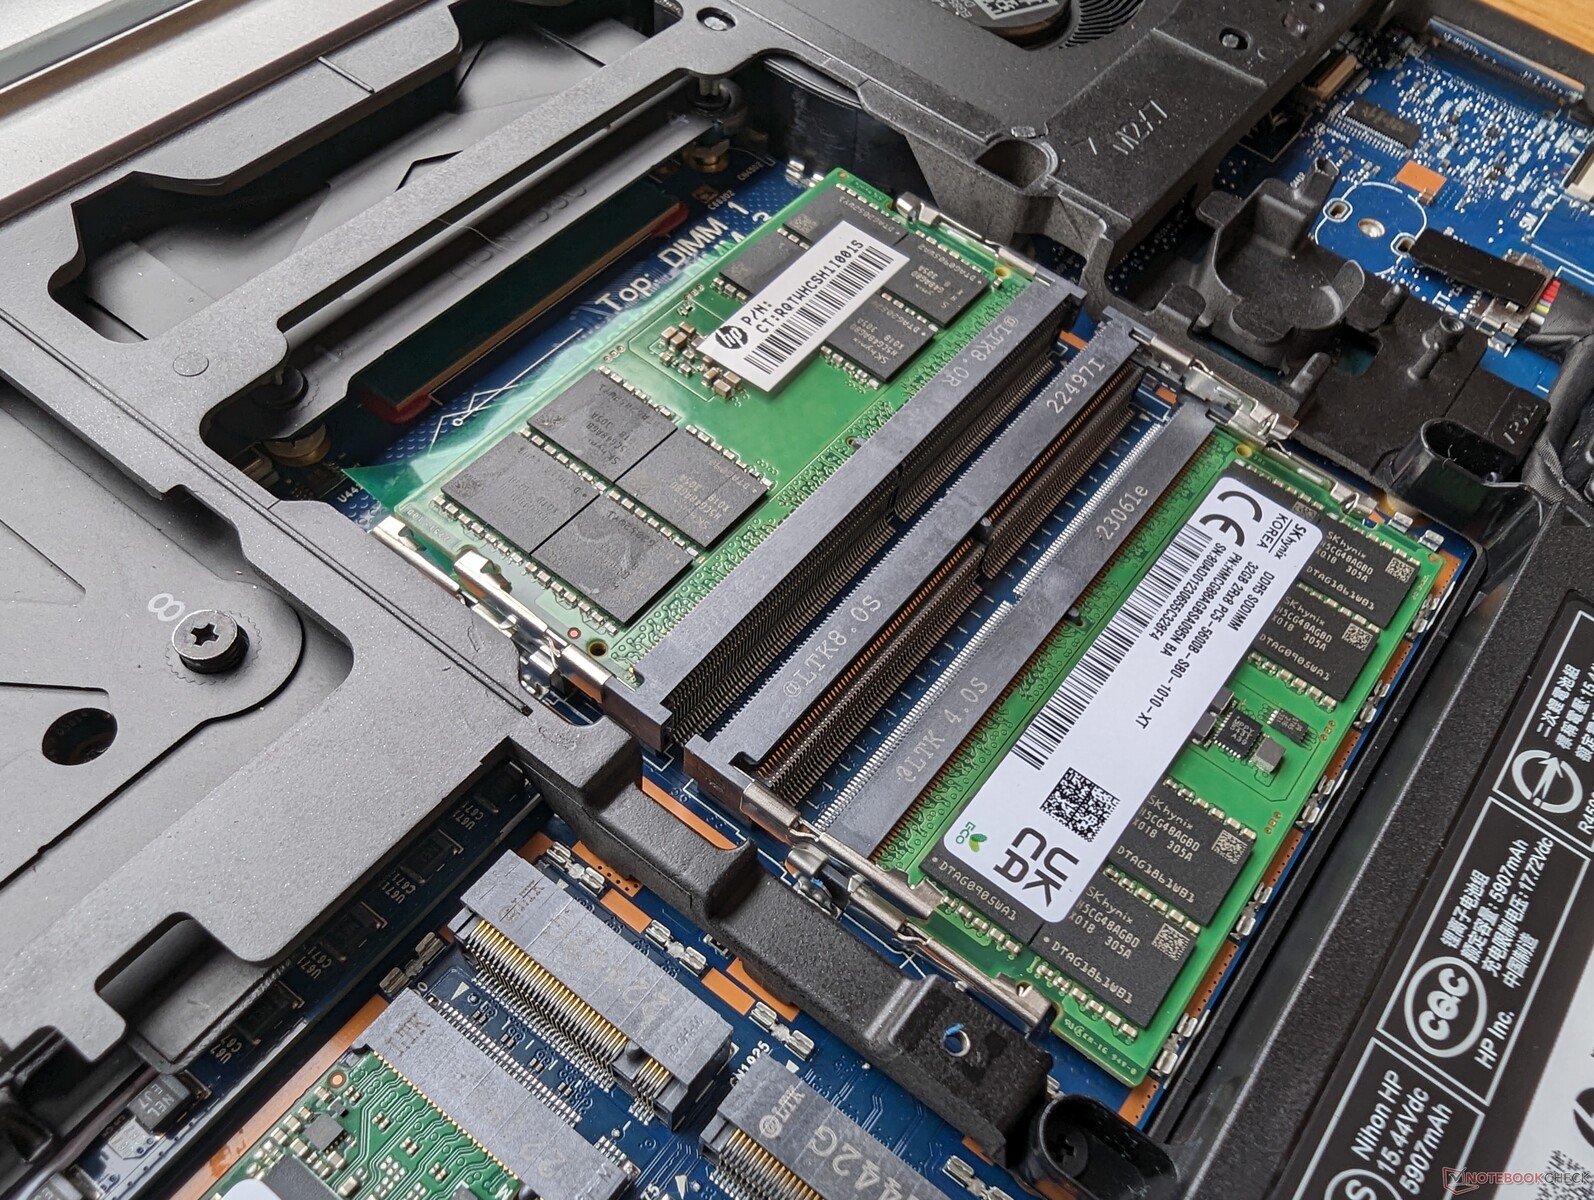
Servicing is "tool-less" in the sense that the bottom panel can be removed without any tools. Once inside, however, a screwdriver will be required to remove the metal plate protecting the four SSDs and four RAM modules. You'll therefore still need a screwdriver for any meaningful upgrades.
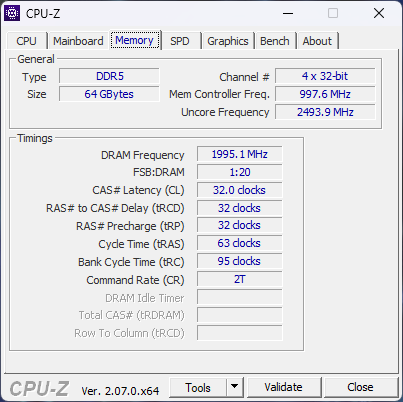
Up to 128 GB of RAM is supported albeit only up to 4000 MT/s.
Accessories And Warranty
There are no extras in the box other than the AC adapter and paperwork. HP offers three years limited warranty as standard.
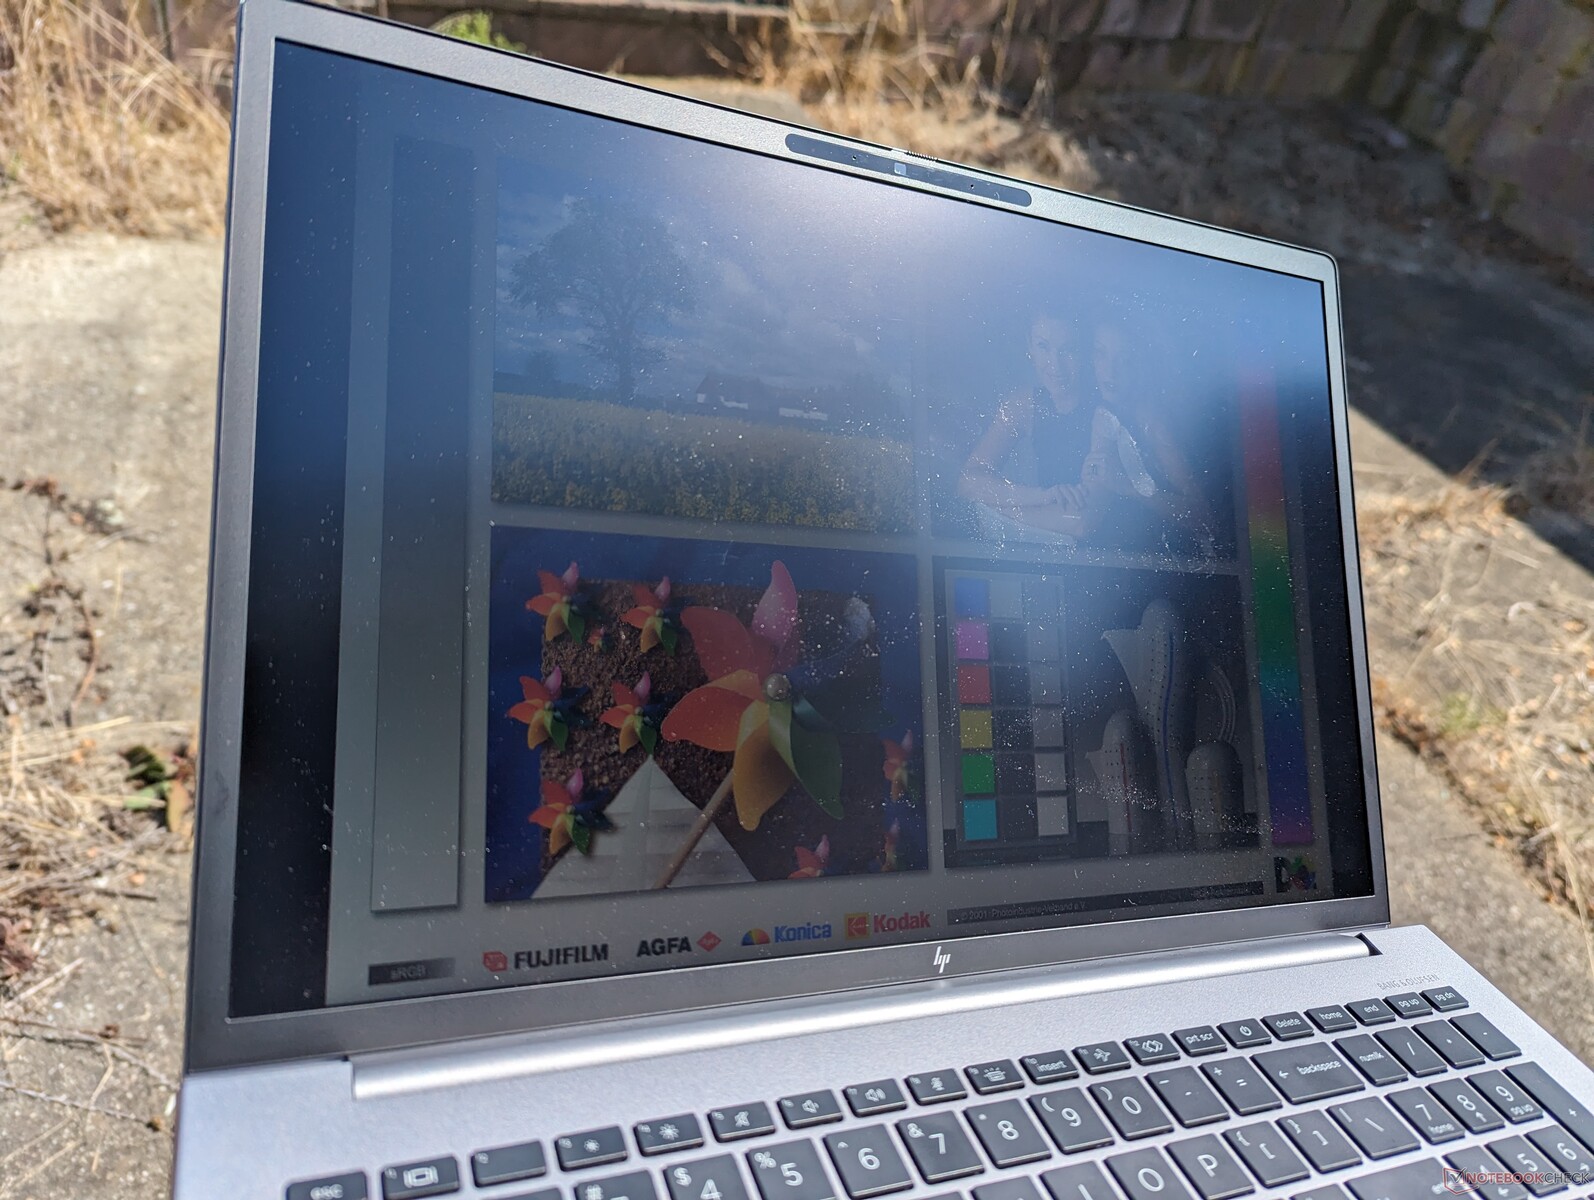
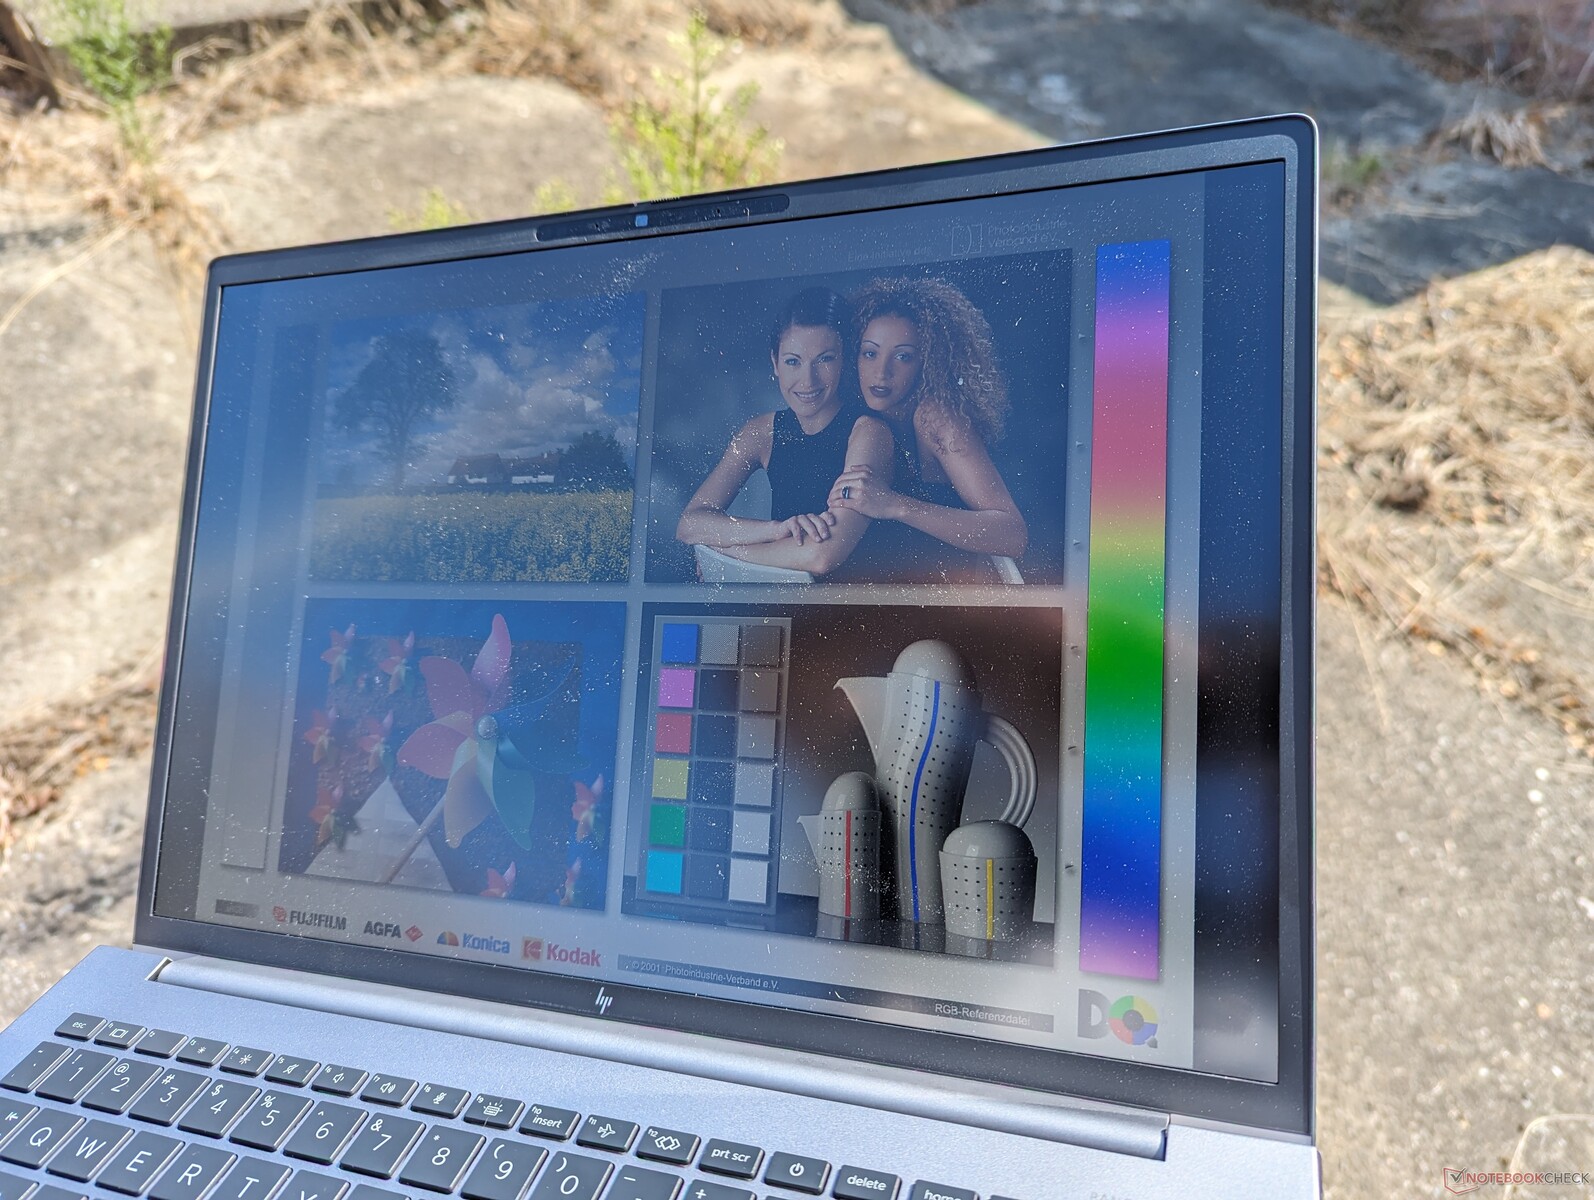
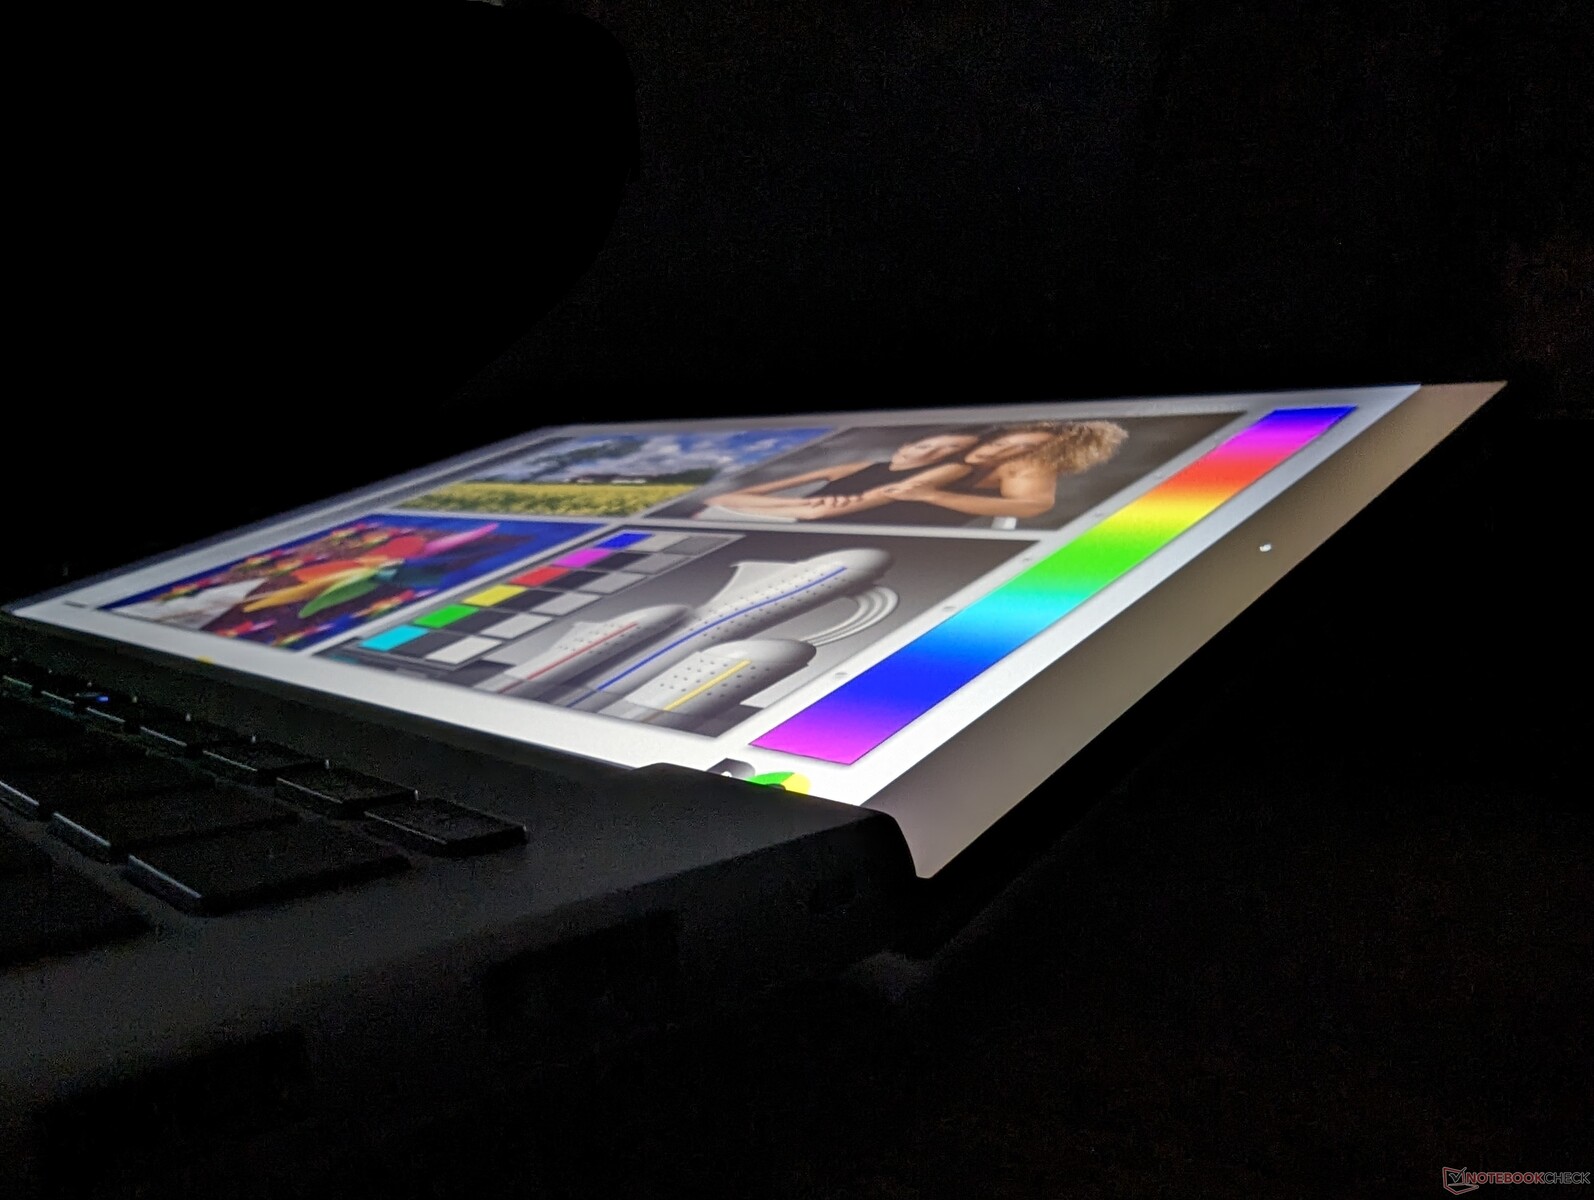
Display
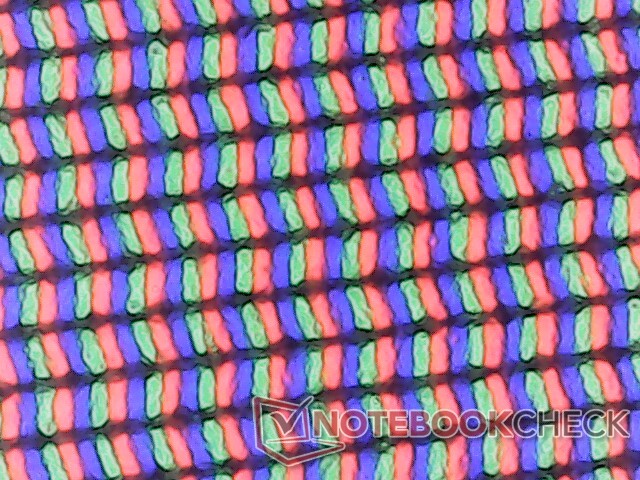
The following three eDP+PSR (Panel Self Refresh) display options are available for the 16-inch Fury 16 G10. Our specific review unit has been configured with the bolded option:
- 3840 x 2400, 60Hz, OLED, touchscreen, 400 nits, 100% DCI-P3, glossy
- 3840 x 2400, 120 Hz, IPS, non-touch, 500 nits, 100% DCI-P3, matte
- 1920 x 1200, 60 Hz, IPS, non-touch, 1000 nits, 100% sRGB, matte
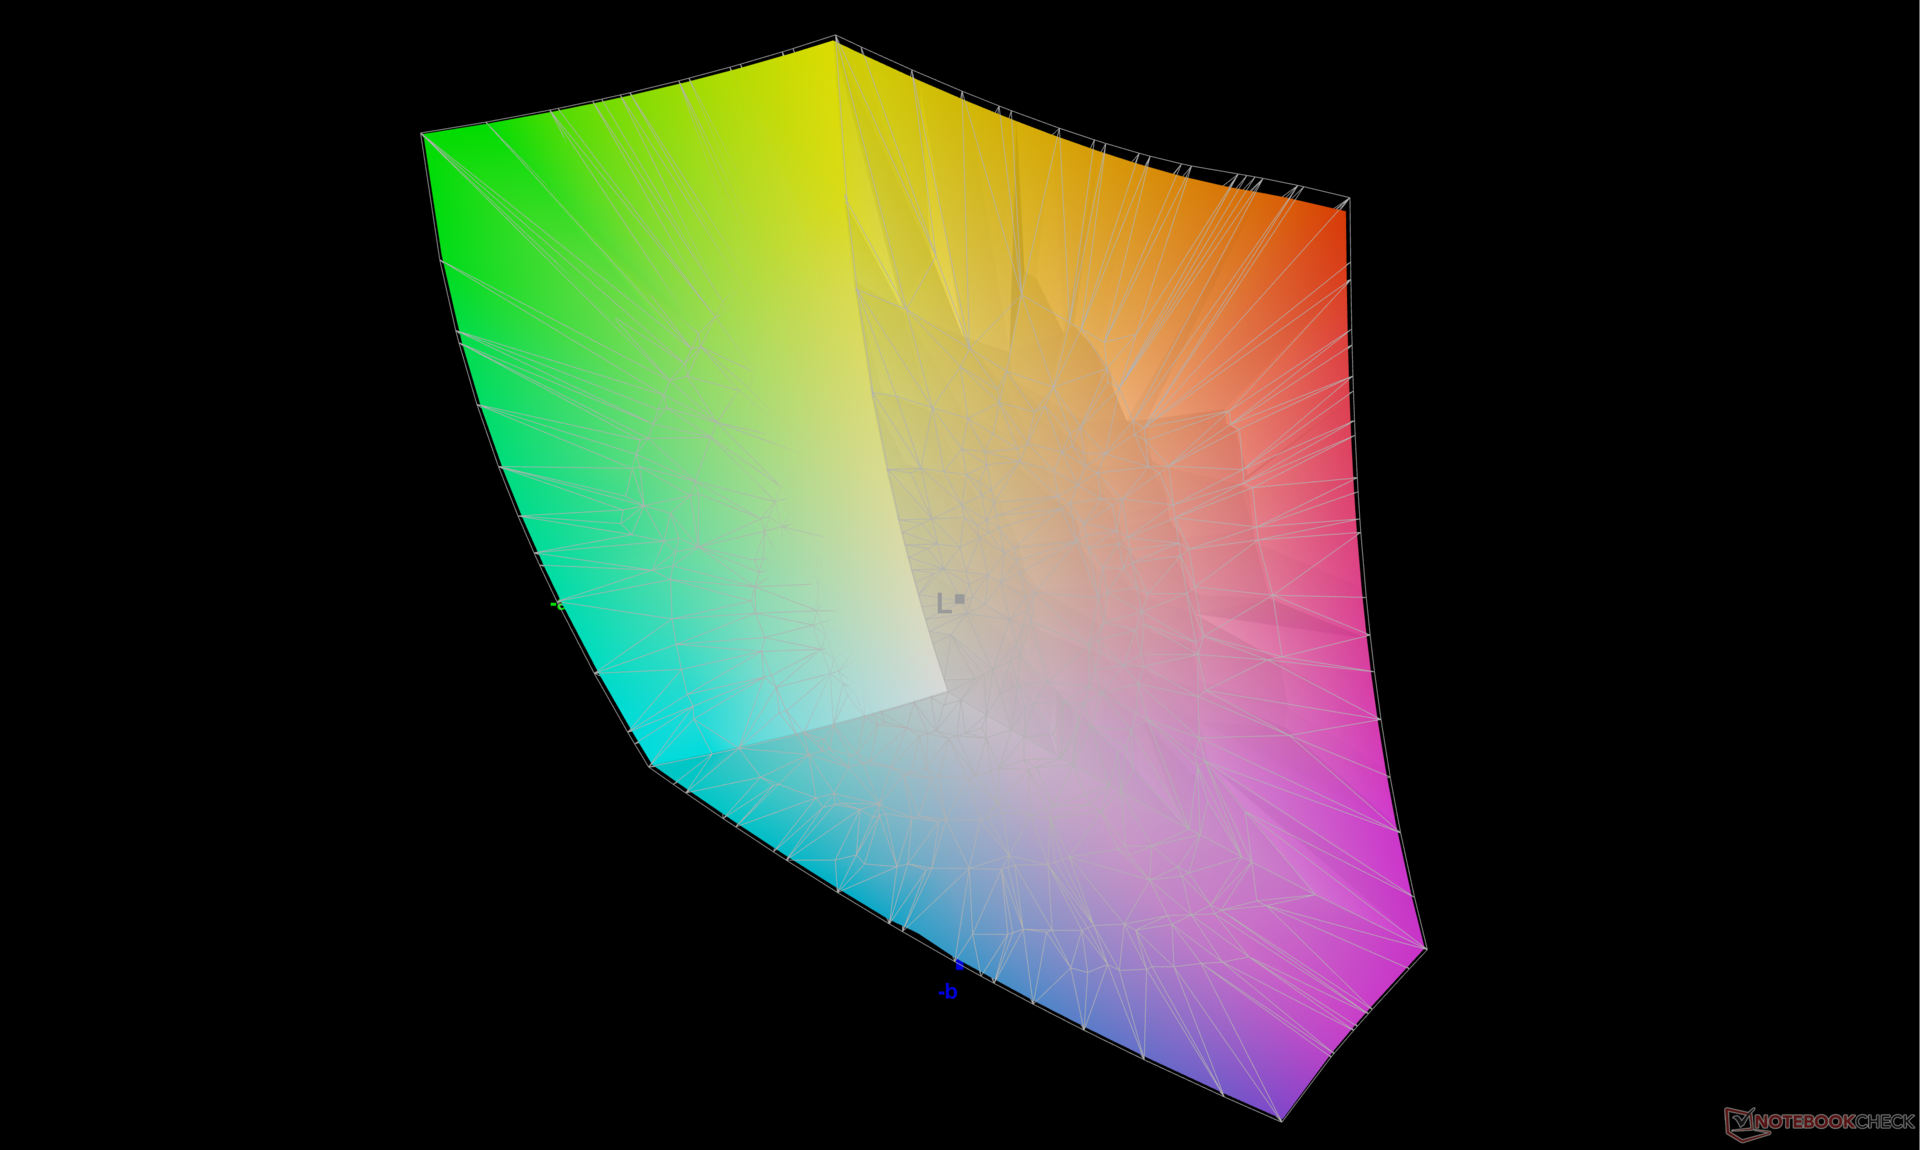
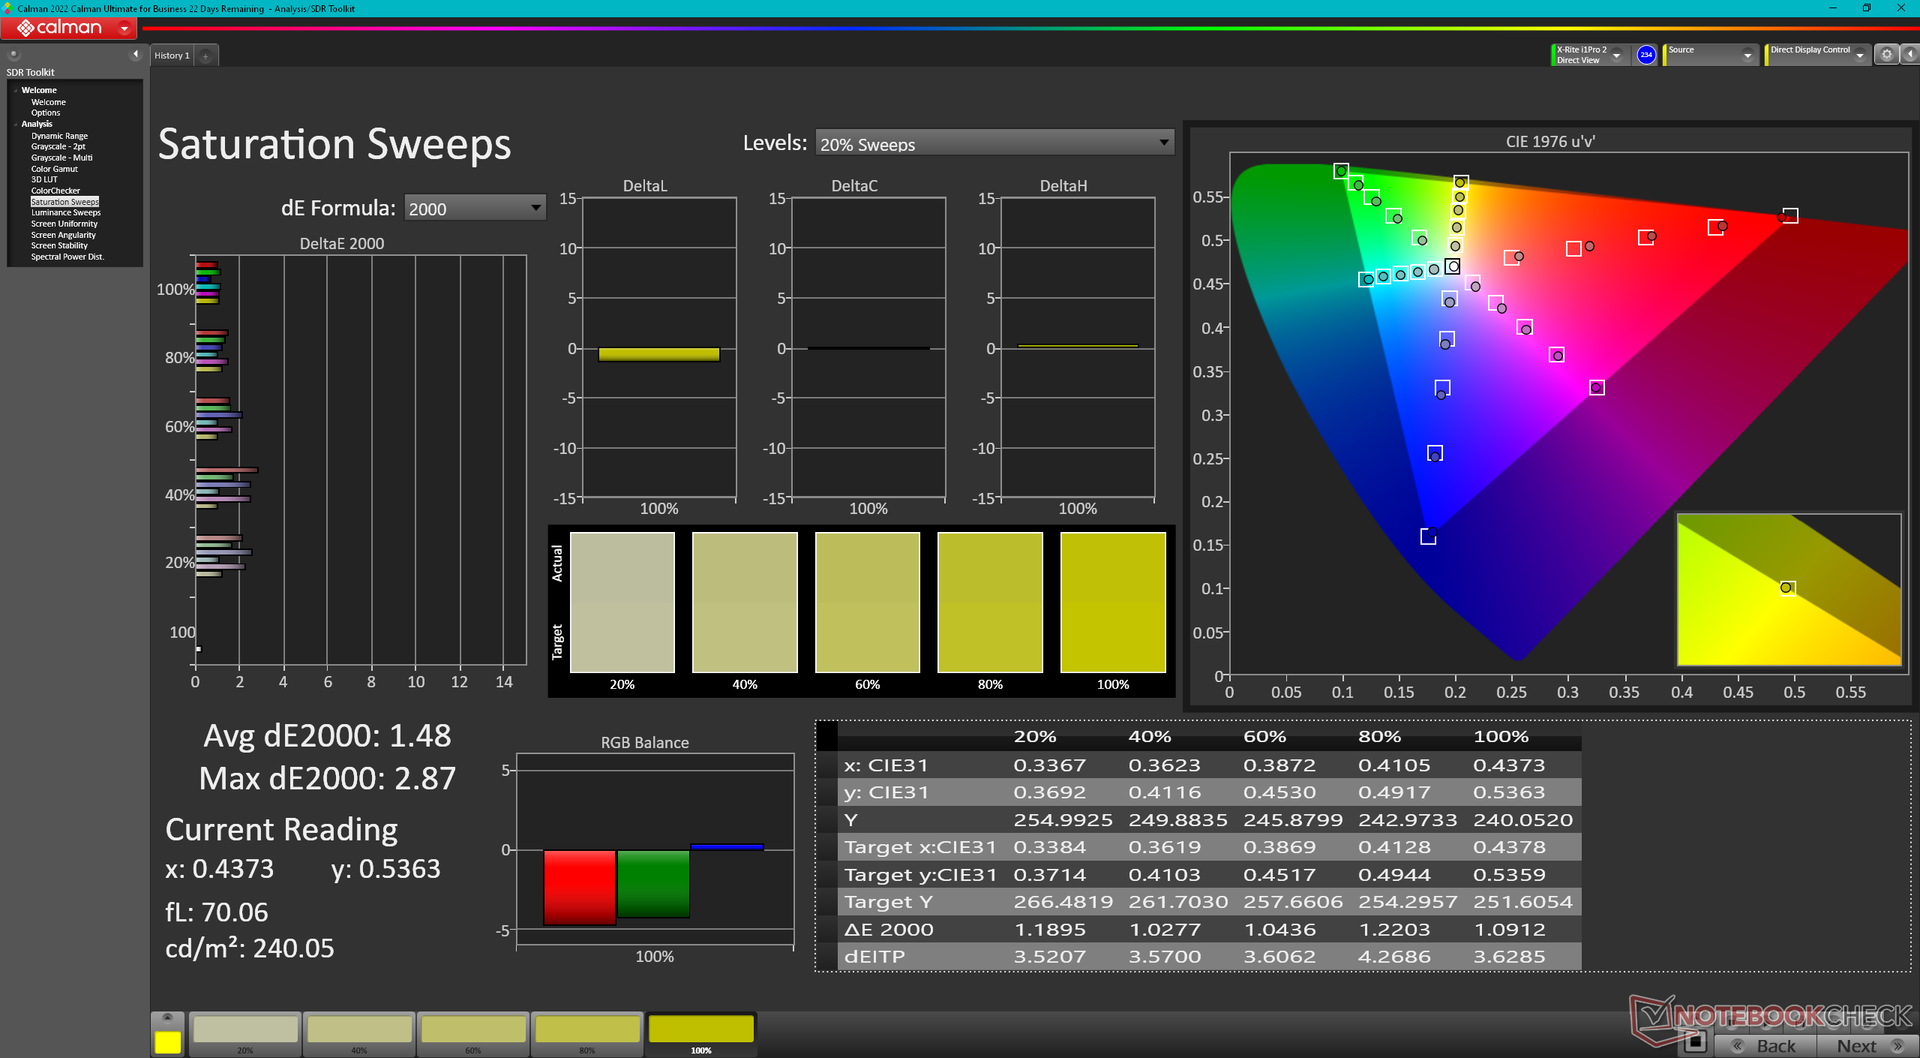
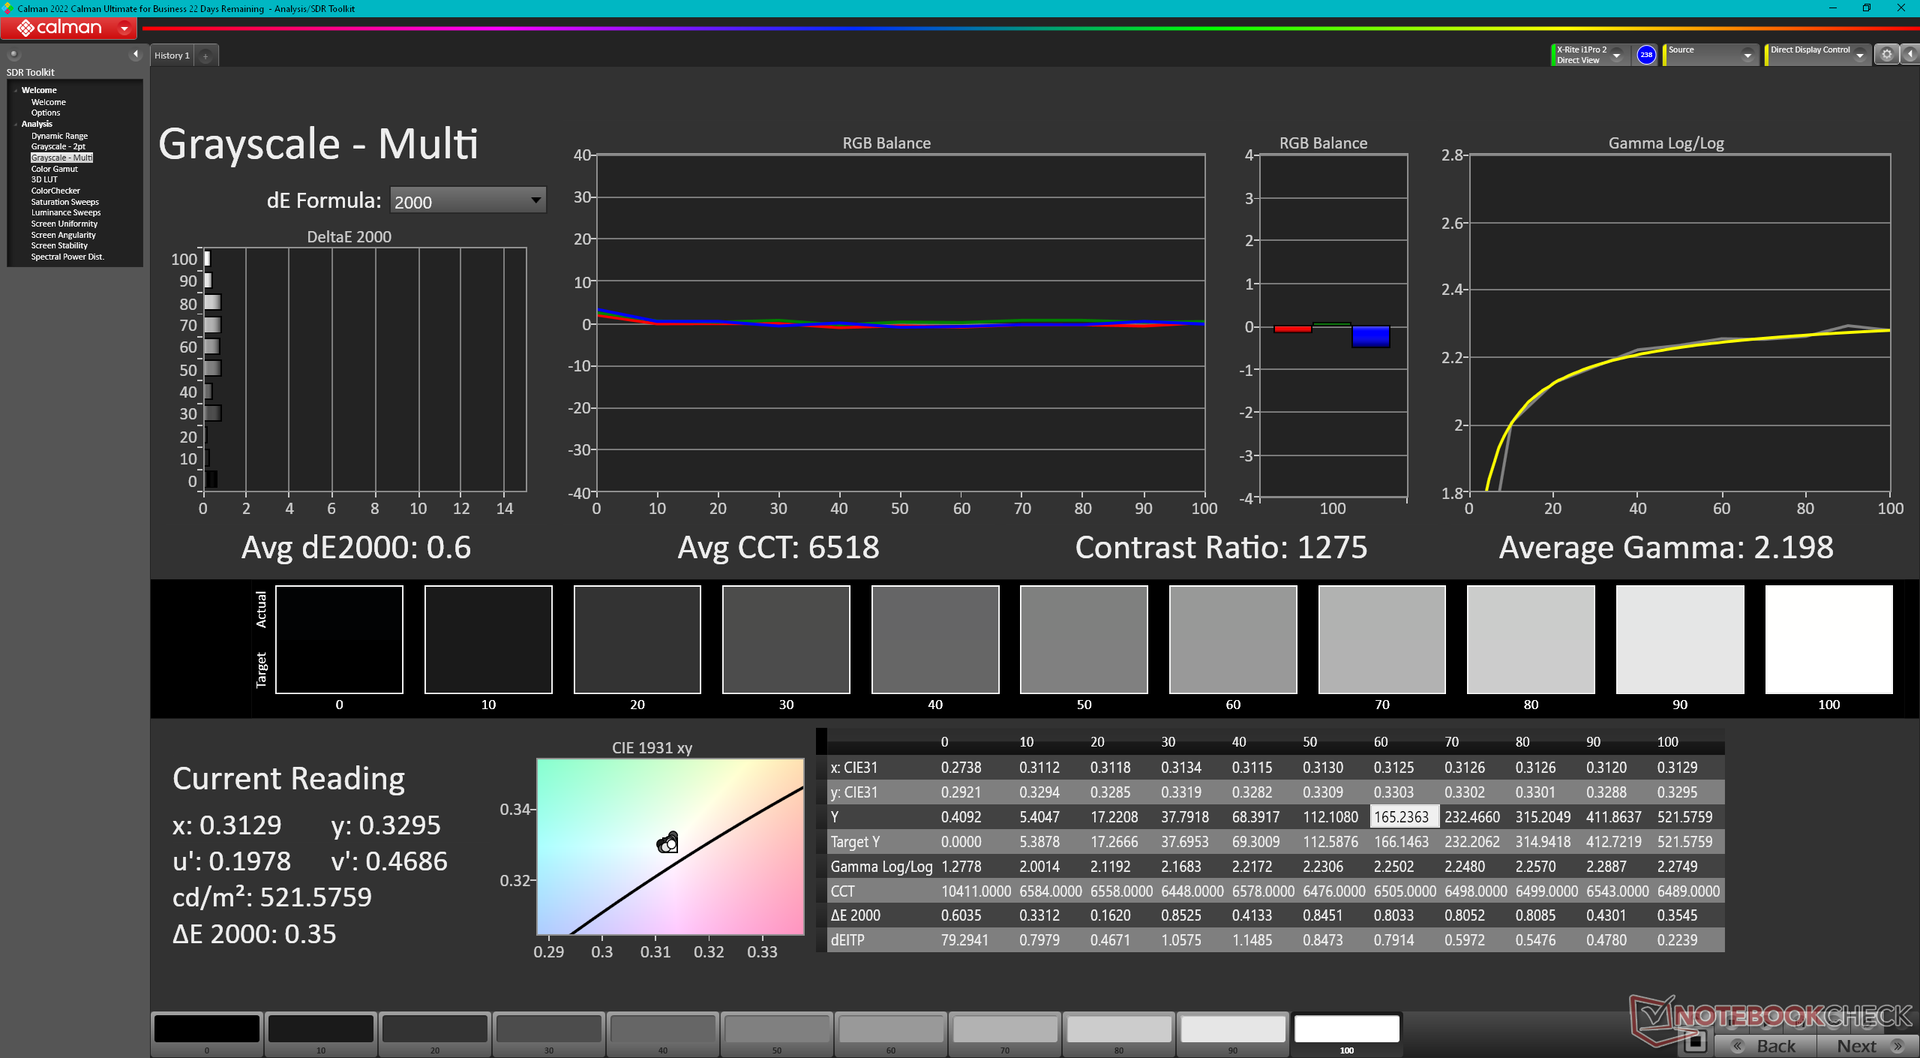
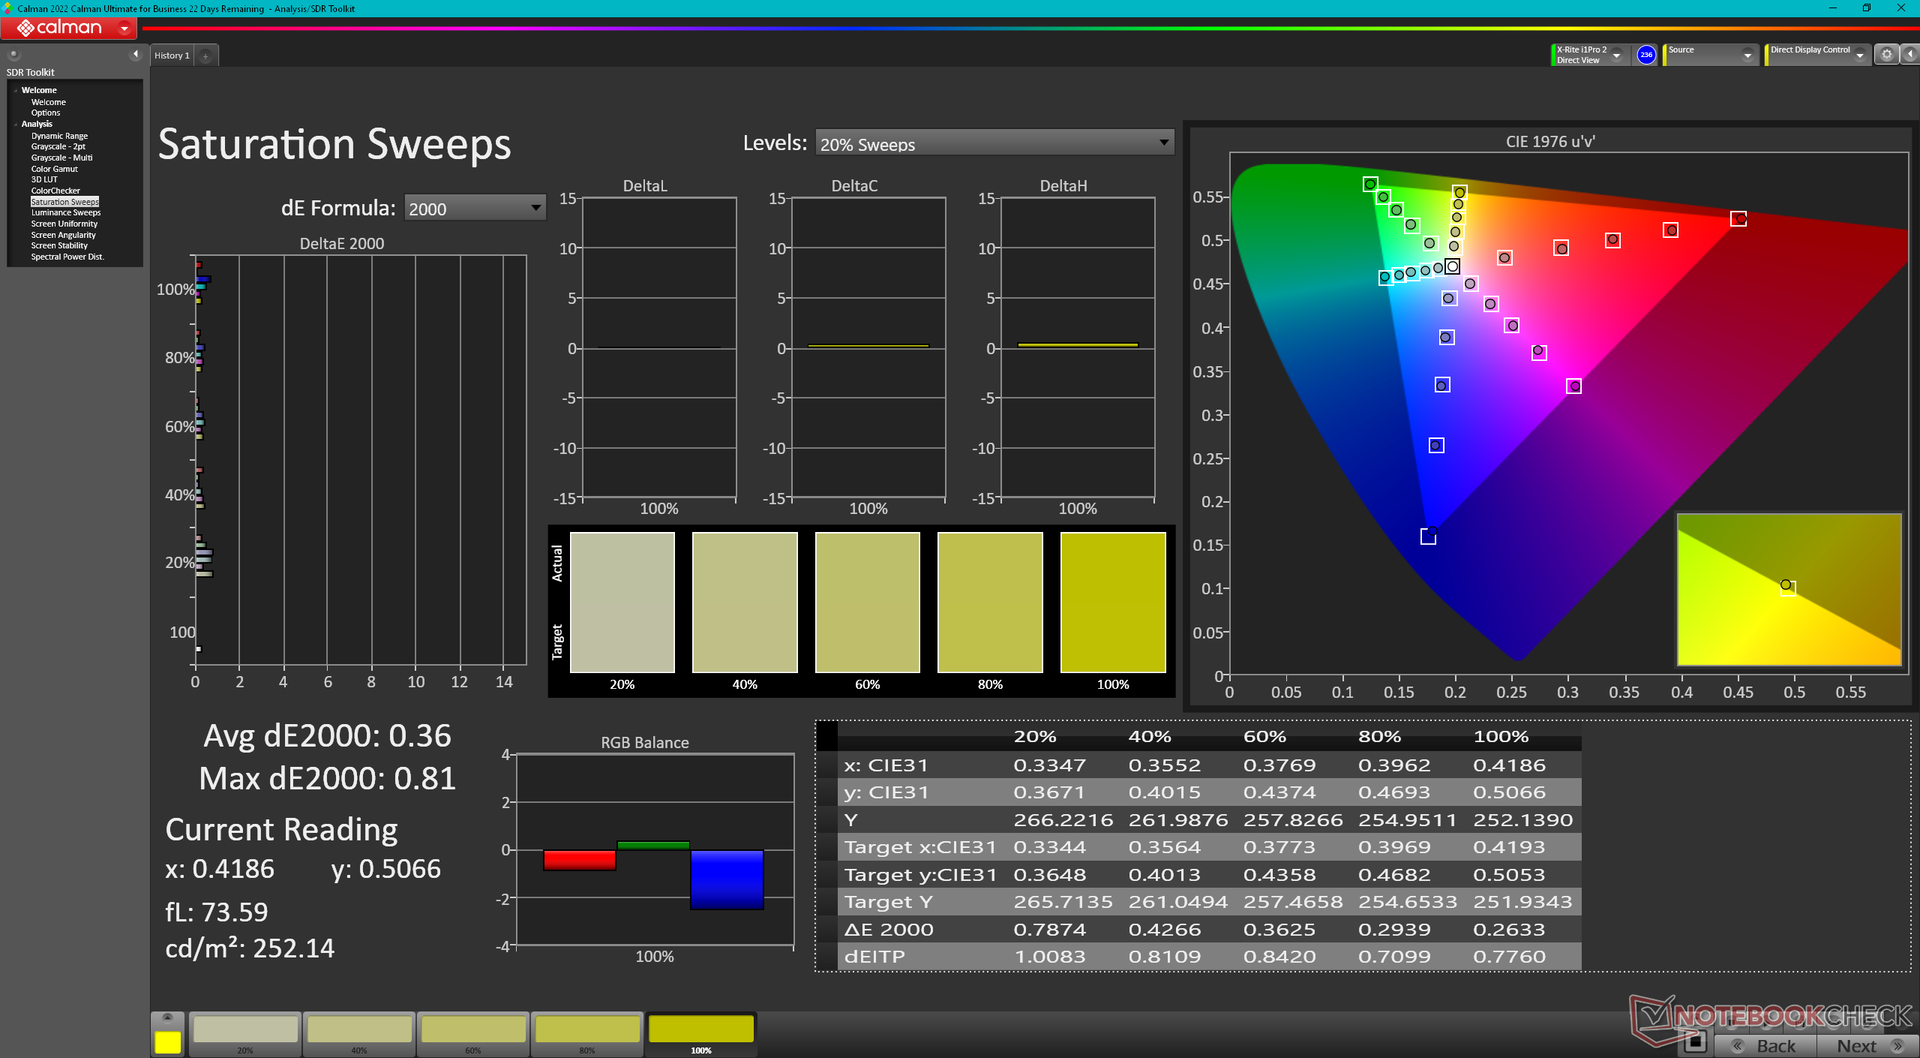
Our independent measurements with an X-Rite colorimeter confirm both the full P3 coverage and 500-nit maximum brightness as advertised. The 120 Hz refresh rate is also a noticeable boost over the 60 Hz panel on last year's Fury 16 G9. This is one of the very few workstations in the market at the moment to offer a 4K IPS panel with both P3 colors and a fast 120 Hz refresh rate.
| |||||||||||||||||||||||||
Brightness Distribution: 90 %
Center on Battery: 514.6 cd/m²
Contrast: 1119:1 (Black: 0.46 cd/m²)
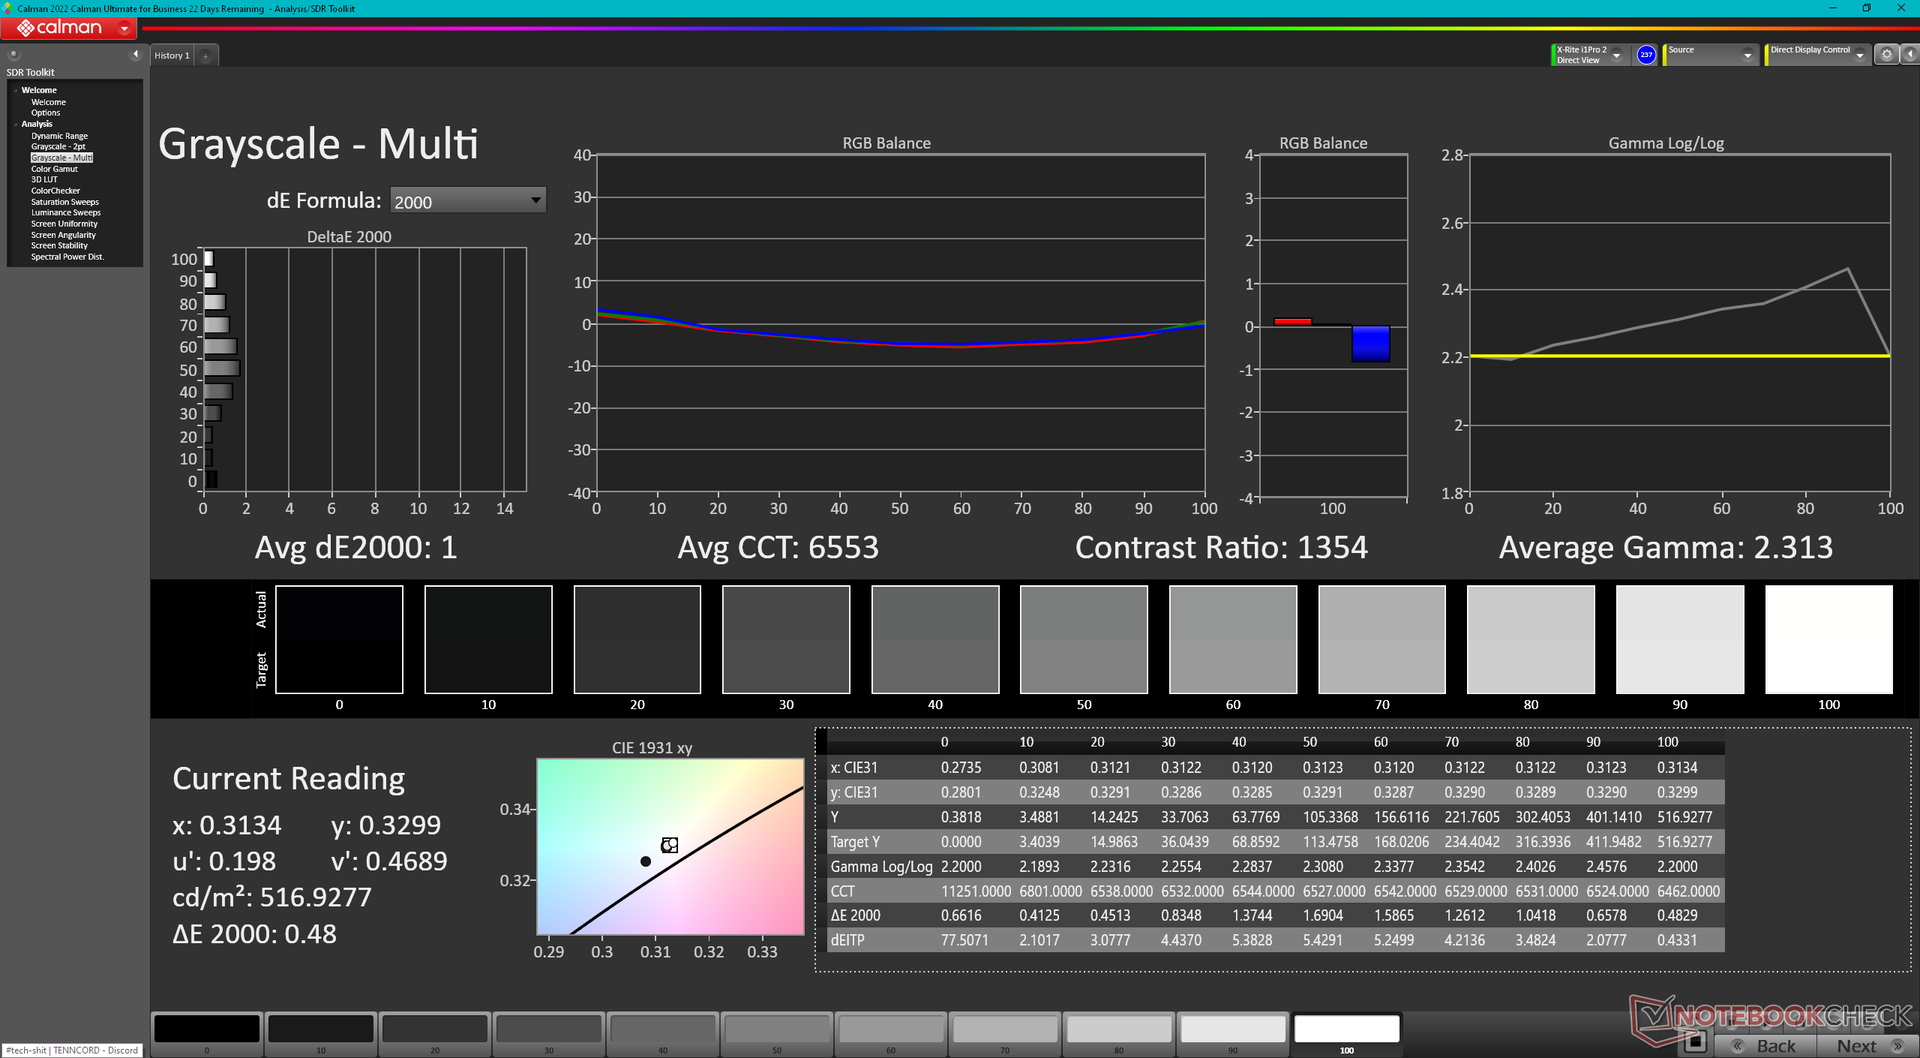
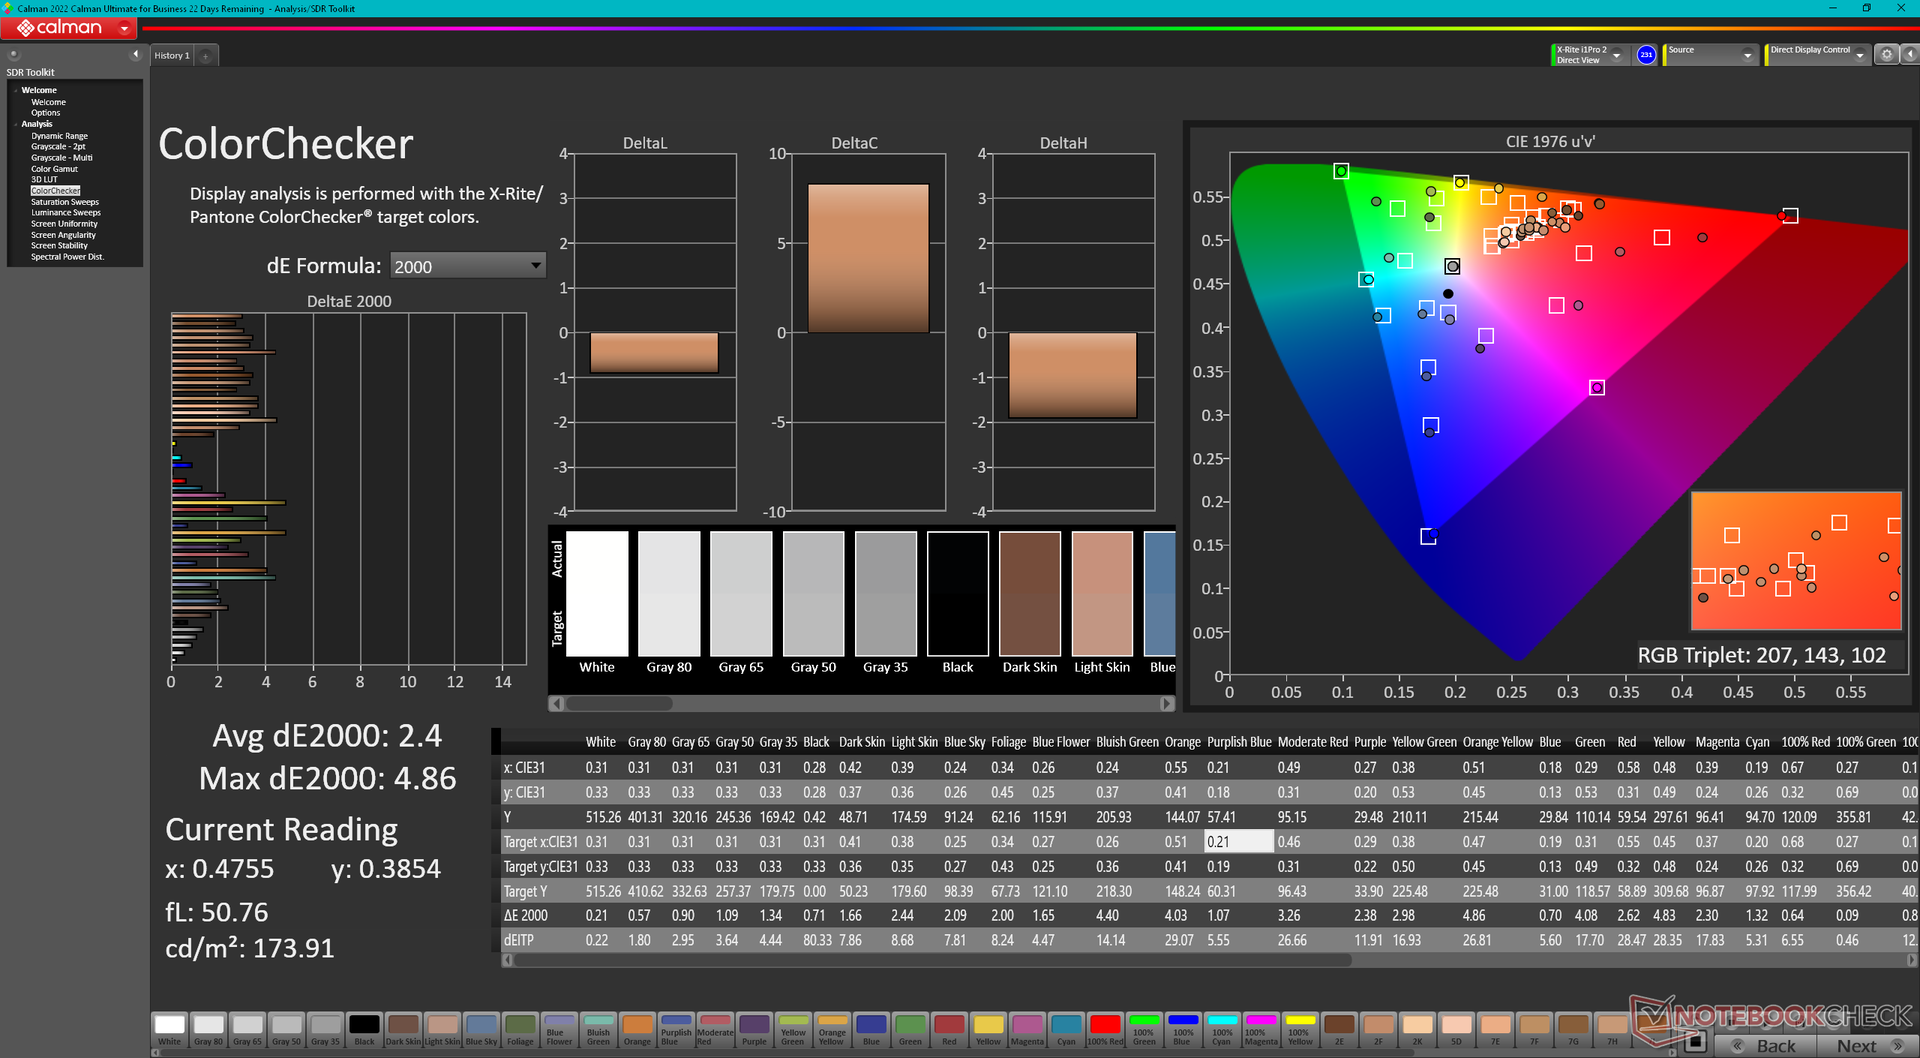
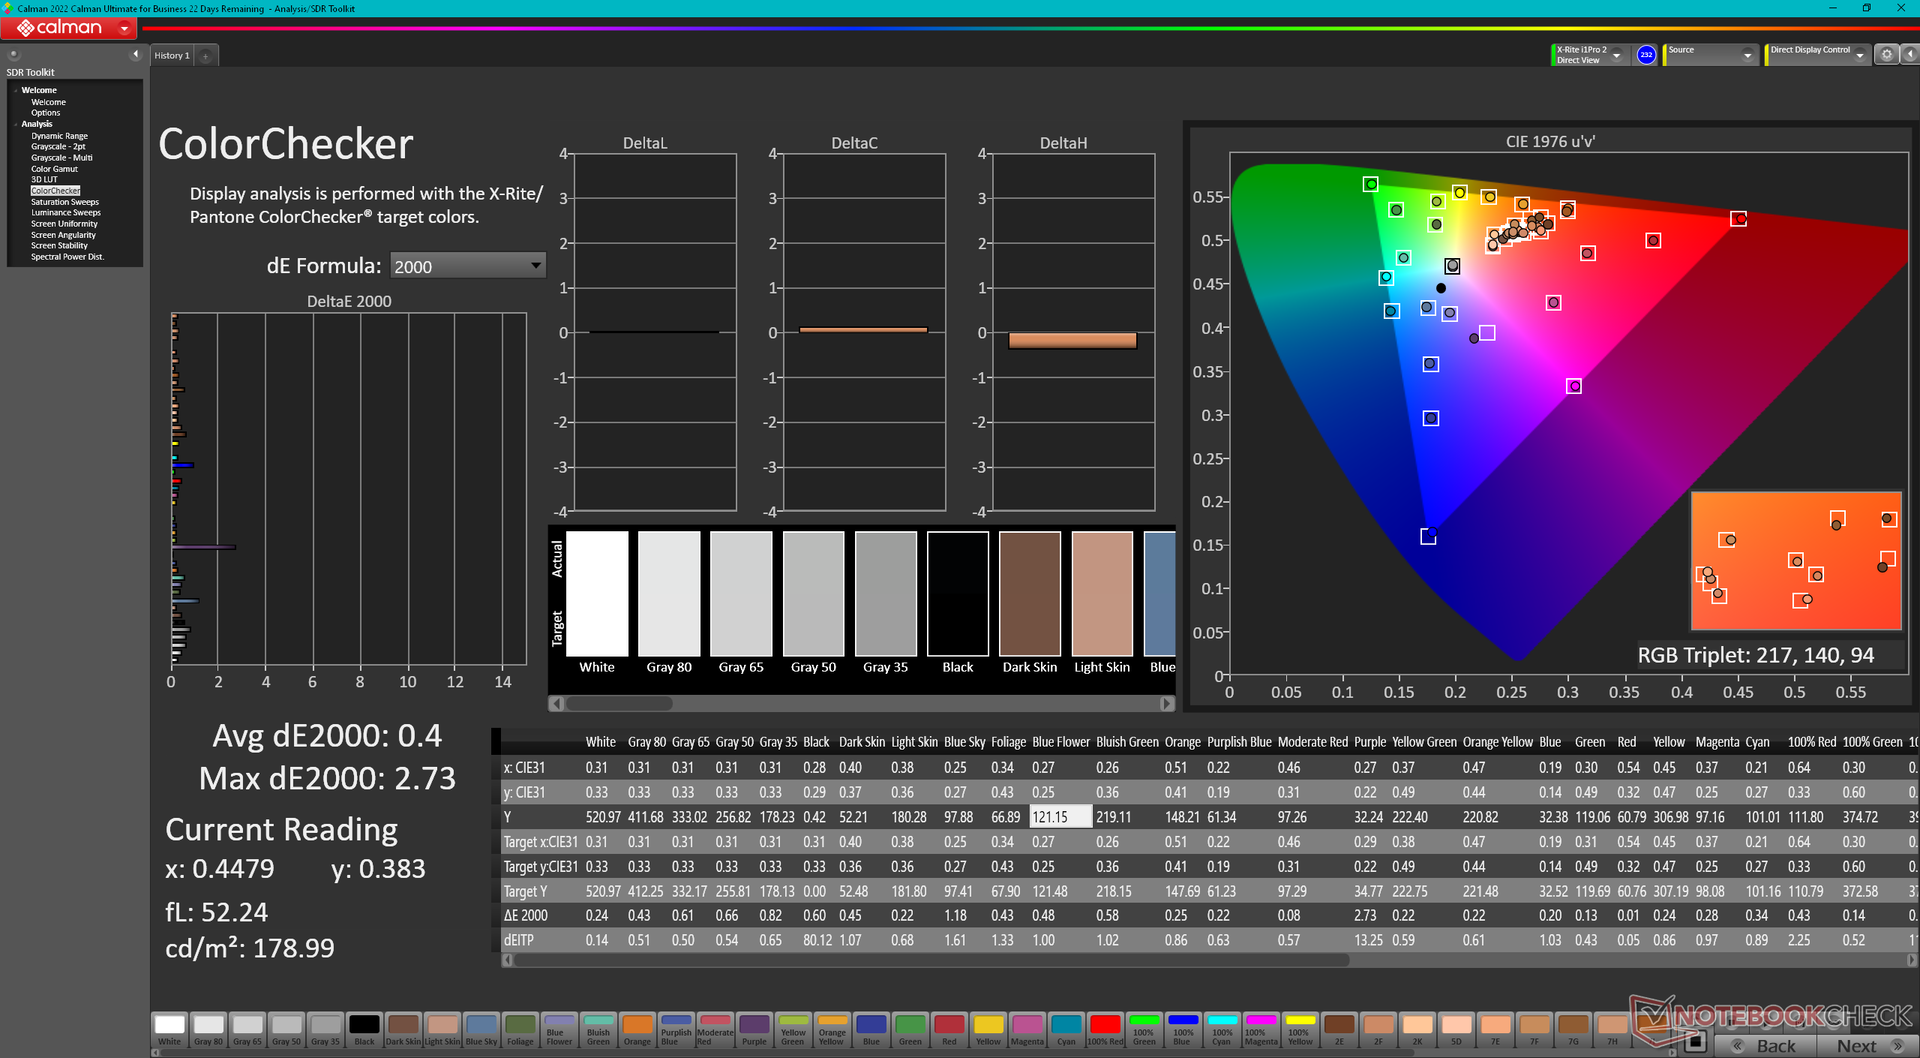
ΔE Color 2.4 | 0.5-29.43 Ø5.1, calibrated: 0.4
ΔE Greyscale 1 | 0.57-98 Ø5.3
86.2% AdobeRGB 1998 (Argyll 2.2.0 3D)
99.9% sRGB (Argyll 2.2.0 3D)
98% Display P3 (Argyll 2.2.0 3D)
Gamma: 2.3
| HP ZBook Fury 16 G10 AUO87A8, IPS, 3840x2400, 16.00 | HP ZBook Fury 16 G9 BOE0A52, IPS, 3840x2400, 16.00 | Dell Precision 5000 5680 Samsung 160YV03, OLED, 3840x2400, 16.00 | Lenovo ThinkPad P16 G1 RTX A5500 LP160UQ1-SPB1, IPS, 3840x2400, 16.00 | MSI CreatorPro Z16P B12UKST B160QAN02.N, IPS, 2560x1600, 16.00 | Asus ProArt StudioBook 16 W7600H5A-2BL2 ATNA60YV02-0, OLED, 3840x2400, 16.00 | |
|---|---|---|---|---|---|---|
| Display | -0% | 5% | -2% | 0% | 5% | |
| Display P3 Coverage | 98 | 97.4 -1% | 99.9 2% | 82.9 -15% | 97.6 0% | 99.9 2% |
| sRGB Coverage | 99.9 | 99.9 0% | 100 0% | 98.9 -1% | 99.9 0% | 100 0% |
| AdobeRGB 1998 Coverage | 86.2 | 86.3 0% | 97.5 13% | 95.9 11% | 87.4 1% | 98.6 14% |
| Response Times | -3% | 84% | -283% | 8% | 81% | |
| Response Time Grey 50% / Grey 80% * | 11.9 ? | 13.7 ? -15% | 1.68 ? 86% | 45.6 ? -283% | 12.8 ? -8% | 2 ? 83% |
| Response Time Black / White * | 9.6 ? | 8.6 ? 10% | 1.77 ? 82% | 36.8 ? -283% | 7.4 ? 23% | 2 ? 79% |
| PWM Frequency | 60 ? | 240 ? | ||||
| Screen | -141% | -72% | -16% | -12% | -102% | |
| Brightness middle | 514.6 | 530.5 3% | 345.7 -33% | 601.9 17% | 407 -21% | 353 -31% |
| Brightness | 495 | 476 -4% | 349 -29% | 569 15% | 388 -22% | 360 -27% |
| Brightness Distribution | 90 | 83 -8% | 98 9% | 77 -14% | 88 -2% | 96 7% |
| Black Level * | 0.46 | 0.57 -24% | 0.47 -2% | 0.36 22% | ||
| Contrast | 1119 | 931 -17% | 1281 14% | 1131 1% | ||
| Colorchecker dE 2000 * | 2.4 | 2.26 6% | 3.59 -50% | 2.45 -2% | 1.3 46% | 2.45 -2% |
| Colorchecker dE 2000 max. * | 4.86 | 7.02 -44% | 4.46 8% | 2.5 49% | 3.75 23% | |
| Colorchecker dE 2000 calibrated * | 0.4 | 4.73 -1083% | 0.99 -148% | 0.7 -75% | 2.77 -593% | |
| Greyscale dE 2000 * | 1 | 1 -0% | 3.1 -210% | 2.6 -160% | 2.1 -110% | 1.88 -88% |
| Gamma | 2.3 96% | 2.28 96% | 2.13 103% | 2.3 96% | 2.26 97% | 2.31 95% |
| CCT | 6553 99% | 6543 99% | 6448 101% | 6805 96% | 6437 101% | 6441 101% |
| Total Average (Program / Settings) | -48% /
-87% | 6% /
-27% | -100% /
-53% | -1% /
-7% | -5% /
-44% |
* ... smaller is better
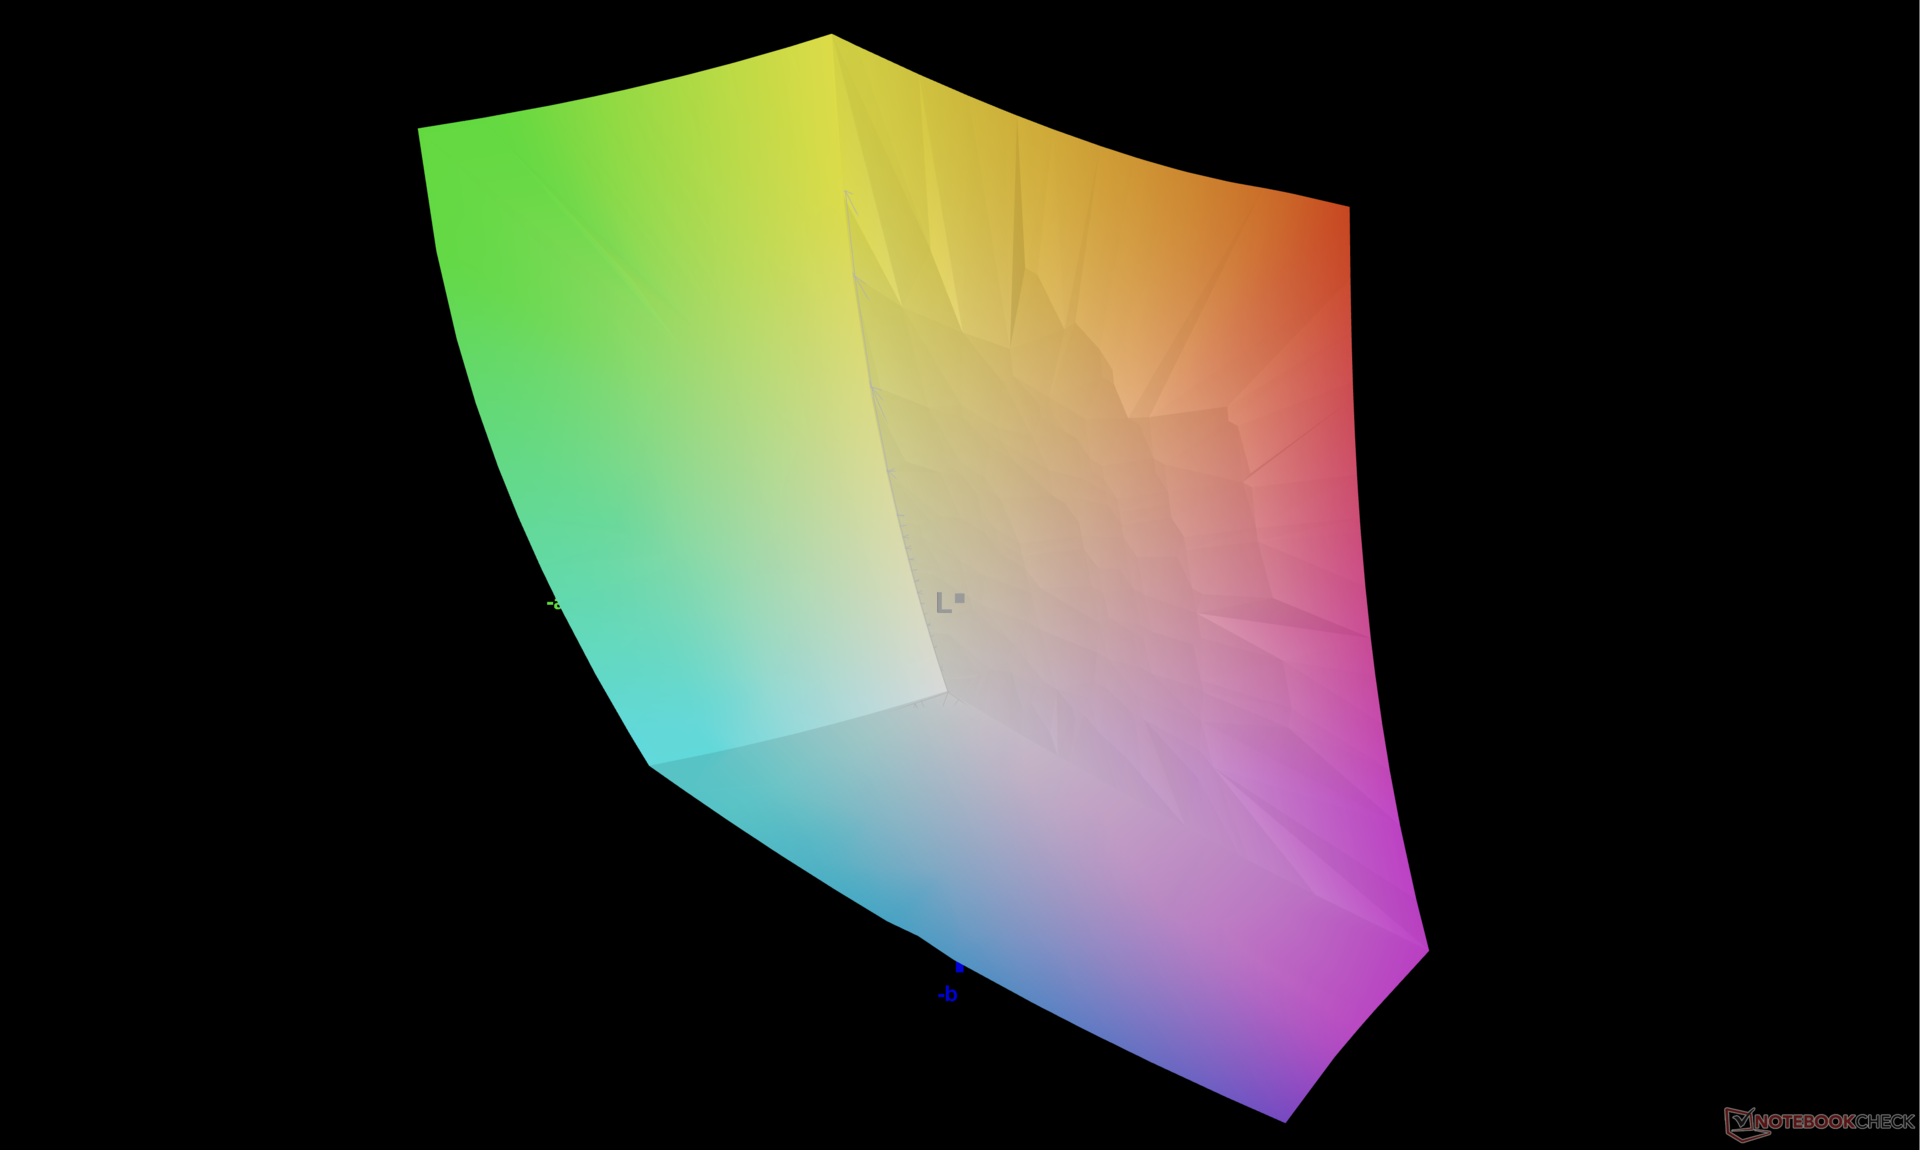
The display comes well-calibrated out of the box against the P3 standard and so an end-user calibration is therefore not as necessary.
Display Response Times
| ↔ Response Time Black to White | ||
|---|---|---|
| 9.6 ms ... rise ↗ and fall ↘ combined | ↗ 5.1 ms rise | 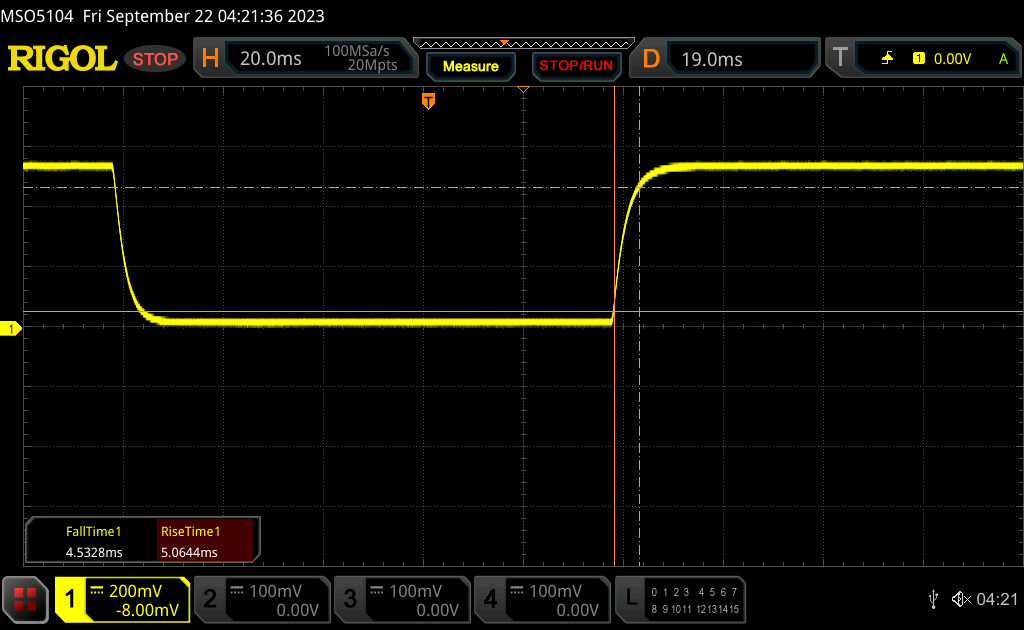 |
| ↘ 4.5 ms fall | ||
| The screen shows fast response rates in our tests and should be suited for gaming. In comparison, all tested devices range from 0.1 (minimum) to 240 (maximum) ms. » 19 % of all devices are better. This means that the measured response time is better than the average of all tested devices (21.8 ms). | ||
| ↔ Response Time 50% Grey to 80% Grey | ||
| 11.9 ms ... rise ↗ and fall ↘ combined | ↗ 5.9 ms rise | 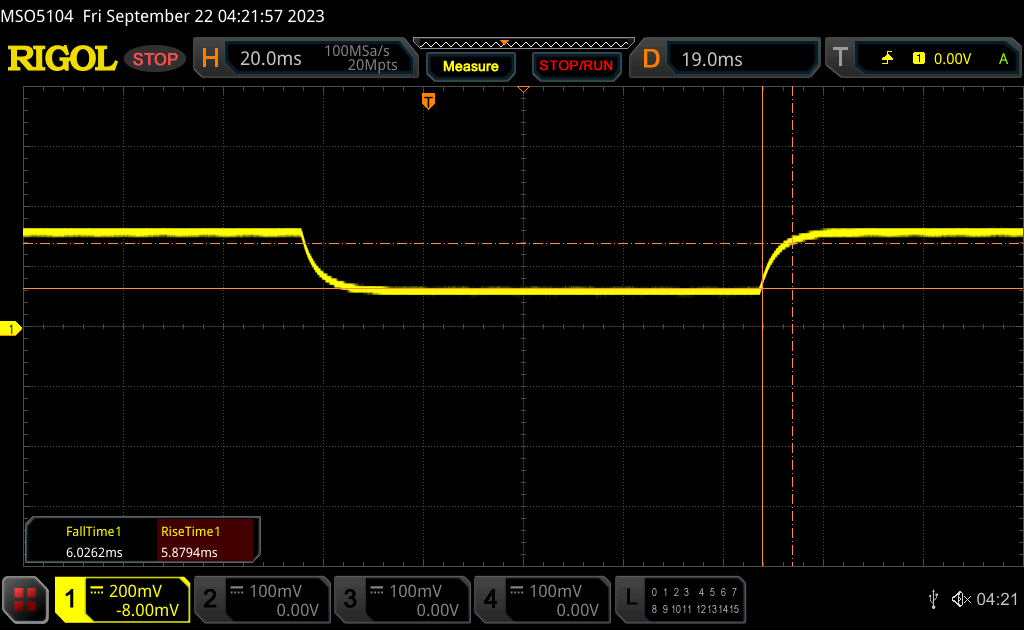 |
| ↘ 6 ms fall | ||
| The screen shows good response rates in our tests, but may be too slow for competitive gamers. In comparison, all tested devices range from 0.2 (minimum) to 636 (maximum) ms. » 18 % of all devices are better. This means that the measured response time is better than the average of all tested devices (34.3 ms). | ||
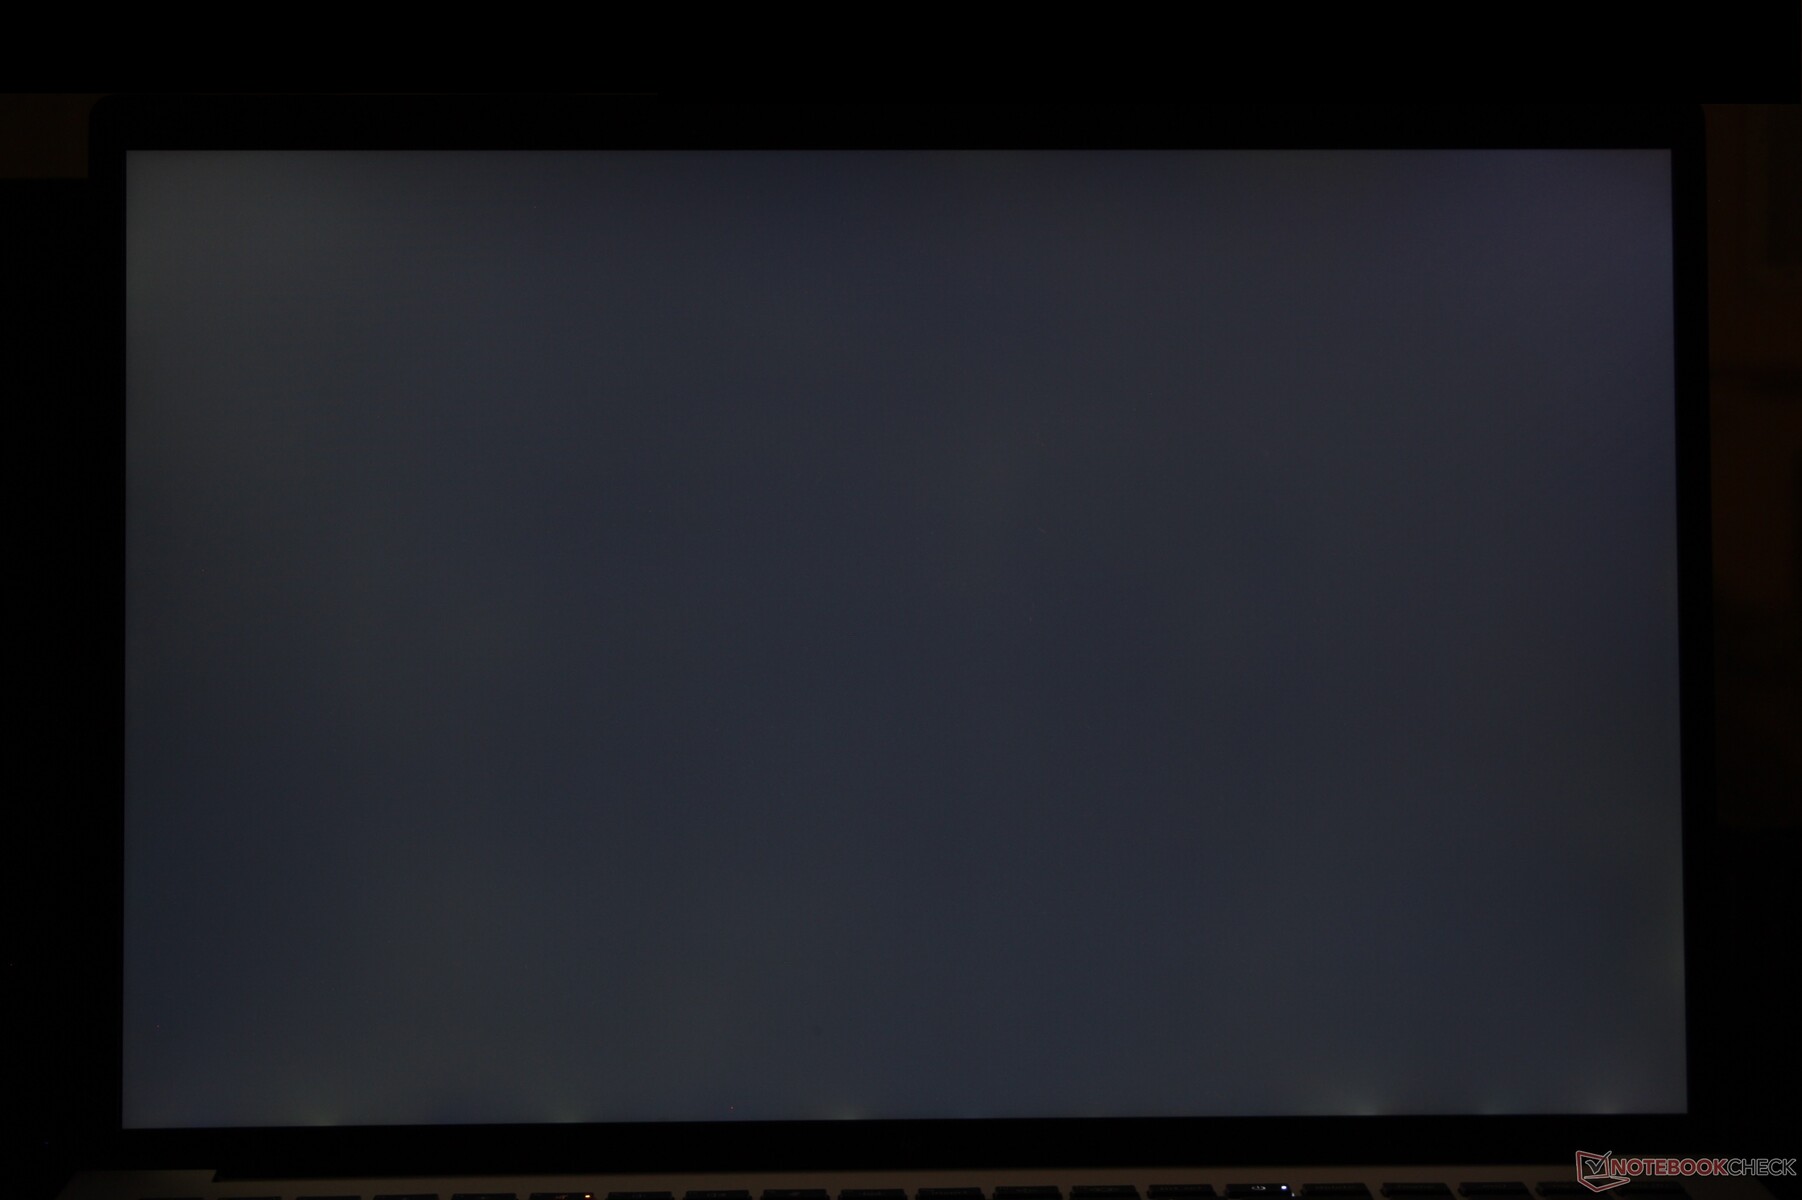
Screen Flickering / PWM (Pulse-Width Modulation)
| Screen flickering / PWM not detected | 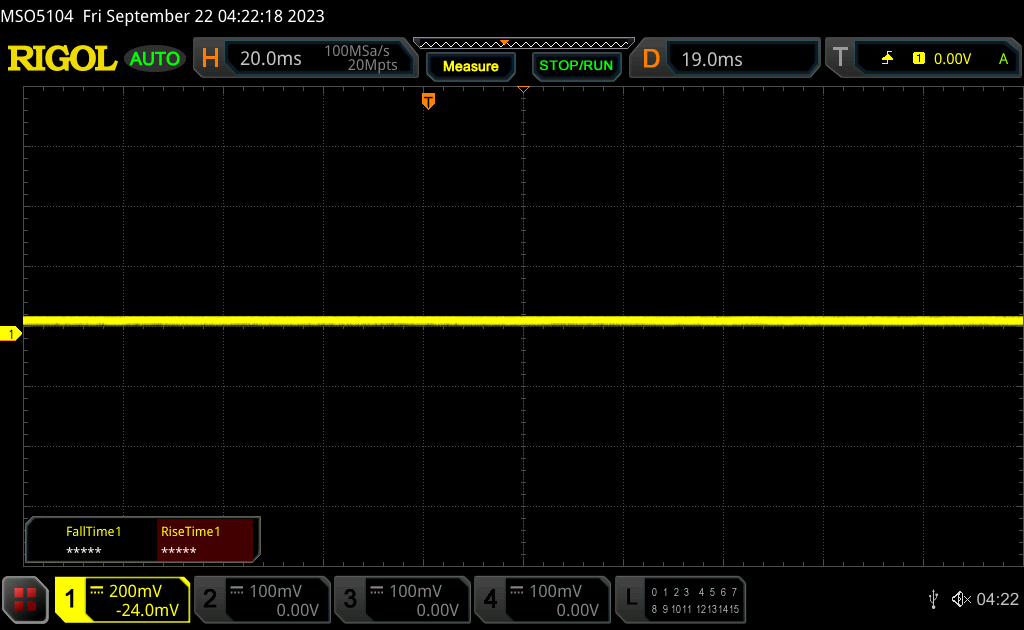 | ||
In comparison: 53 % of all tested devices do not use PWM to dim the display. If PWM was detected, an average of 18732 (minimum: 5 - maximum: 3846000) Hz was measured. | |||


Performance
Testing Conditions
We set Windows to Performance mode prior to running any benchmarks below.
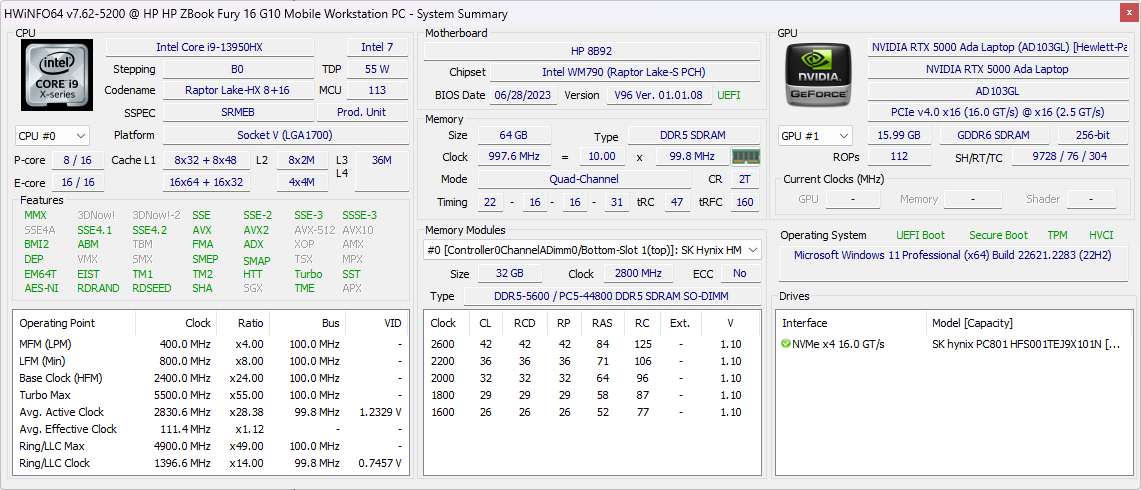
Advanced Optimus, MUX, and Intel Xeon CPUs are not supported. However, it's worth noting that the model officially supports DDR5 ECC RAM despite the lack of any Xeon options which is a feature not found on most other mobile workstations.
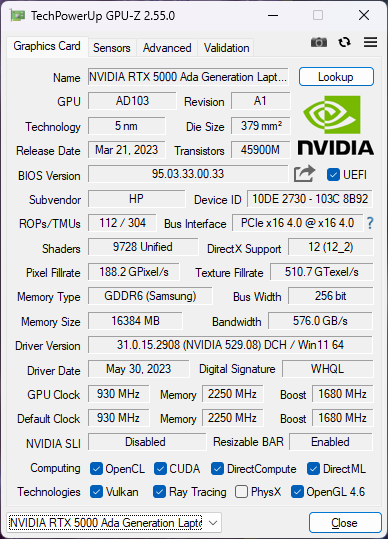
ECC VRAM mode can be toggled on our off much like on other Ada Lovelace GPUs designed for workstations. Enabling it reduces the maximum usable VRAM from 16 GB to 15 GB.
Processor
CPU performance is a mixed bag. On one hand, multi-thread performance is roughly 25 to 30 percent faster than the Core i9-12950HX in last year's Fury 16 G9. On the other hand, performance averages about 15 percent slower than on other laptops with the same Core i9-13950HX processor as our HP. The exact same CPU in the larger Razer Blade 18 and MSI GE78HX, for example, run consistently faster than our HP. This isn't to say that the Fury 16 G10 is slow, but it shows that the CPU is slightly slower than expected.
Cinebench R15 Multi Loop
Cinebench R23: Multi Core | Single Core
Cinebench R20: CPU (Multi Core) | CPU (Single Core)
Cinebench R15: CPU Multi 64Bit | CPU Single 64Bit
Blender: v2.79 BMW27 CPU
7-Zip 18.03: 7z b 4 | 7z b 4 -mmt1
Geekbench 5.5: Multi-Core | Single-Core
HWBOT x265 Benchmark v2.2: 4k Preset
LibreOffice : 20 Documents To PDF
R Benchmark 2.5: Overall mean
* ... smaller is better
AIDA64: FP32 Ray-Trace | FPU Julia | CPU SHA3 | CPU Queen | FPU SinJulia | FPU Mandel | CPU AES | CPU ZLib | FP64 Ray-Trace | CPU PhotoWorxx
| Performance Rating | |
| Average Intel Core i9-13950HX | |
| HP ZBook Fury 16 G10 | |
| Lenovo ThinkPad P16 G1 RTX A5500 | |
| HP ZBook Fury 16 G9 | |
| Dell Precision 5000 5680 | |
| MSI CreatorPro Z16P B12UKST | |
| AIDA64 / FP32 Ray-Trace | |
| Average Intel Core i9-13950HX (18131 - 28957, n=7) | |
| HP ZBook Fury 16 G10 | |
| Lenovo ThinkPad P16 G1 RTX A5500 | |
| HP ZBook Fury 16 G9 | |
| Dell Precision 5000 5680 | |
| MSI CreatorPro Z16P B12UKST | |
| AIDA64 / FPU Julia | |
| Average Intel Core i9-13950HX (102591 - 144303, n=7) | |
| HP ZBook Fury 16 G10 | |
| HP ZBook Fury 16 G9 | |
| Lenovo ThinkPad P16 G1 RTX A5500 | |
| Dell Precision 5000 5680 | |
| MSI CreatorPro Z16P B12UKST | |
| AIDA64 / CPU SHA3 | |
| Average Intel Core i9-13950HX (4981 - 7093, n=7) | |
| HP ZBook Fury 16 G10 | |
| Lenovo ThinkPad P16 G1 RTX A5500 | |
| HP ZBook Fury 16 G9 | |
| MSI CreatorPro Z16P B12UKST | |
| Dell Precision 5000 5680 | |
| AIDA64 / CPU Queen | |
| Average Intel Core i9-13950HX (131931 - 140103, n=7) | |
| HP ZBook Fury 16 G10 | |
| Dell Precision 5000 5680 | |
| Lenovo ThinkPad P16 G1 RTX A5500 | |
| HP ZBook Fury 16 G9 | |
| MSI CreatorPro Z16P B12UKST | |
| AIDA64 / FPU SinJulia | |
| Average Intel Core i9-13950HX (12381 - 17057, n=7) | |
| HP ZBook Fury 16 G10 | |
| Lenovo ThinkPad P16 G1 RTX A5500 | |
| HP ZBook Fury 16 G9 | |
| Dell Precision 5000 5680 | |
| MSI CreatorPro Z16P B12UKST | |
| AIDA64 / FPU Mandel | |
| Average Intel Core i9-13950HX (46539 - 71038, n=7) | |
| HP ZBook Fury 16 G10 | |
| HP ZBook Fury 16 G9 | |
| Lenovo ThinkPad P16 G1 RTX A5500 | |
| Dell Precision 5000 5680 | |
| MSI CreatorPro Z16P B12UKST | |
| AIDA64 / CPU AES | |
| Average Intel Core i9-13950HX (99981 - 204491, n=7) | |
| MSI CreatorPro Z16P B12UKST | |
| HP ZBook Fury 16 G10 | |
| HP ZBook Fury 16 G9 | |
| Lenovo ThinkPad P16 G1 RTX A5500 | |
| Dell Precision 5000 5680 | |
| AIDA64 / CPU ZLib | |
| Average Intel Core i9-13950HX (1472 - 2069, n=7) | |
| HP ZBook Fury 16 G10 | |
| Lenovo ThinkPad P16 G1 RTX A5500 | |
| HP ZBook Fury 16 G9 | |
| MSI CreatorPro Z16P B12UKST | |
| Dell Precision 5000 5680 | |
| AIDA64 / FP64 Ray-Trace | |
| Average Intel Core i9-13950HX (9787 - 15573, n=7) | |
| HP ZBook Fury 16 G10 | |
| Lenovo ThinkPad P16 G1 RTX A5500 | |
| HP ZBook Fury 16 G9 | |
| Dell Precision 5000 5680 | |
| MSI CreatorPro Z16P B12UKST | |
| AIDA64 / CPU PhotoWorxx | |
| Dell Precision 5000 5680 | |
| Average Intel Core i9-13950HX (40233 - 50864, n=7) | |
| MSI CreatorPro Z16P B12UKST | |
| Lenovo ThinkPad P16 G1 RTX A5500 | |
| HP ZBook Fury 16 G10 | |
| HP ZBook Fury 16 G9 | |
System Performance
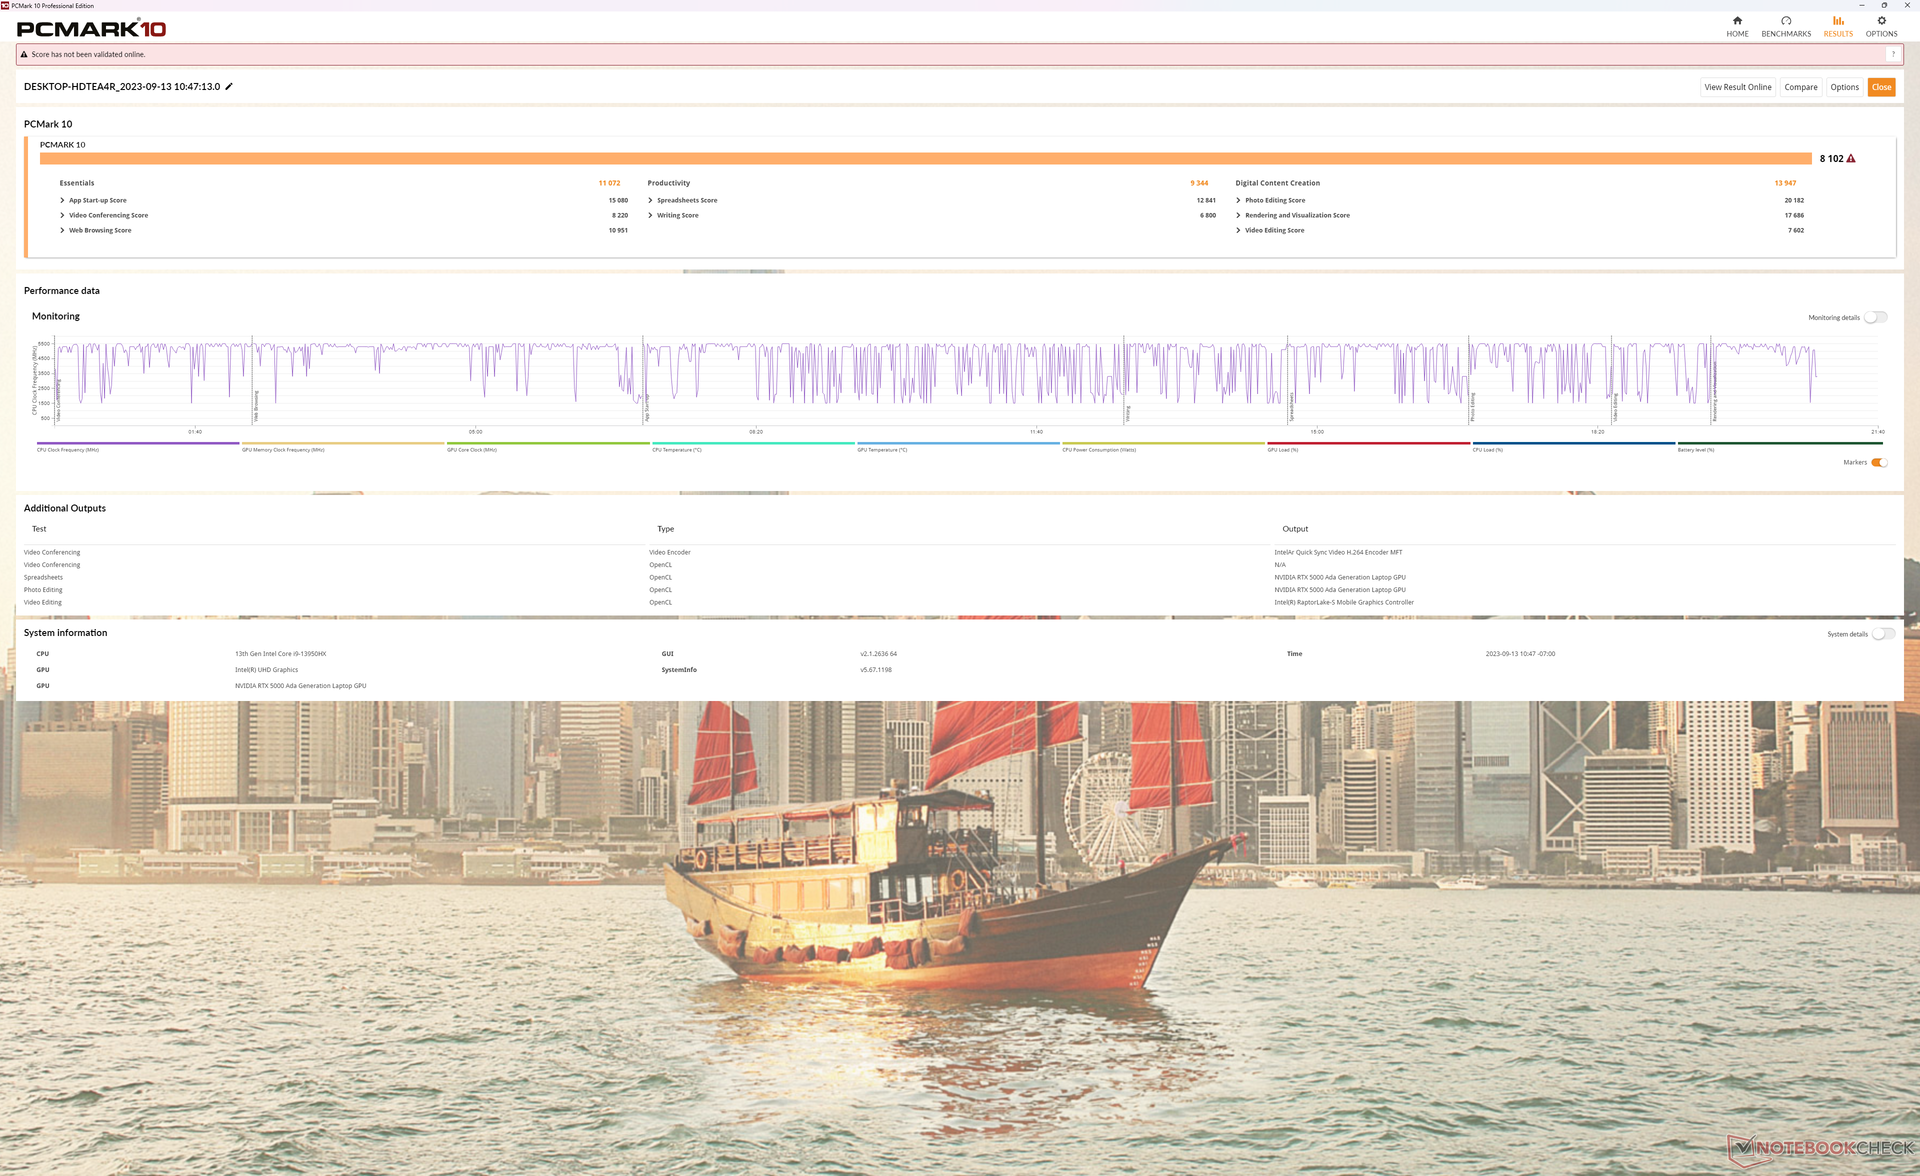
PCMark scores are ahead of last year's Fury 16 G9 especially in the Digital Content Creation subtest due to the significant jump in GPU performance. Meanwhile, the Precision 5680 scores higher in Productivity because of its RAID 0 SSDs. Of course, our HP can also be configured with RAID if desired.
CrossMark: Overall | Productivity | Creativity | Responsiveness
| PCMark 10 Score | 8102 points | |
Help | ||
| AIDA64 / Memory Copy | |
| Dell Precision 5000 5680 | |
| Lenovo ThinkPad P16 G1 RTX A5500 | |
| MSI CreatorPro Z16P B12UKST | |
| HP ZBook Fury 16 G10 | |
| HP ZBook Fury 16 G9 | |
| AIDA64 / Memory Read | |
| Dell Precision 5000 5680 | |
| MSI CreatorPro Z16P B12UKST | |
| Lenovo ThinkPad P16 G1 RTX A5500 | |
| HP ZBook Fury 16 G10 | |
| HP ZBook Fury 16 G9 | |
| AIDA64 / Memory Write | |
| Dell Precision 5000 5680 | |
| MSI CreatorPro Z16P B12UKST | |
| Lenovo ThinkPad P16 G1 RTX A5500 | |
| HP ZBook Fury 16 G10 | |
| HP ZBook Fury 16 G9 | |
* ... smaller is better
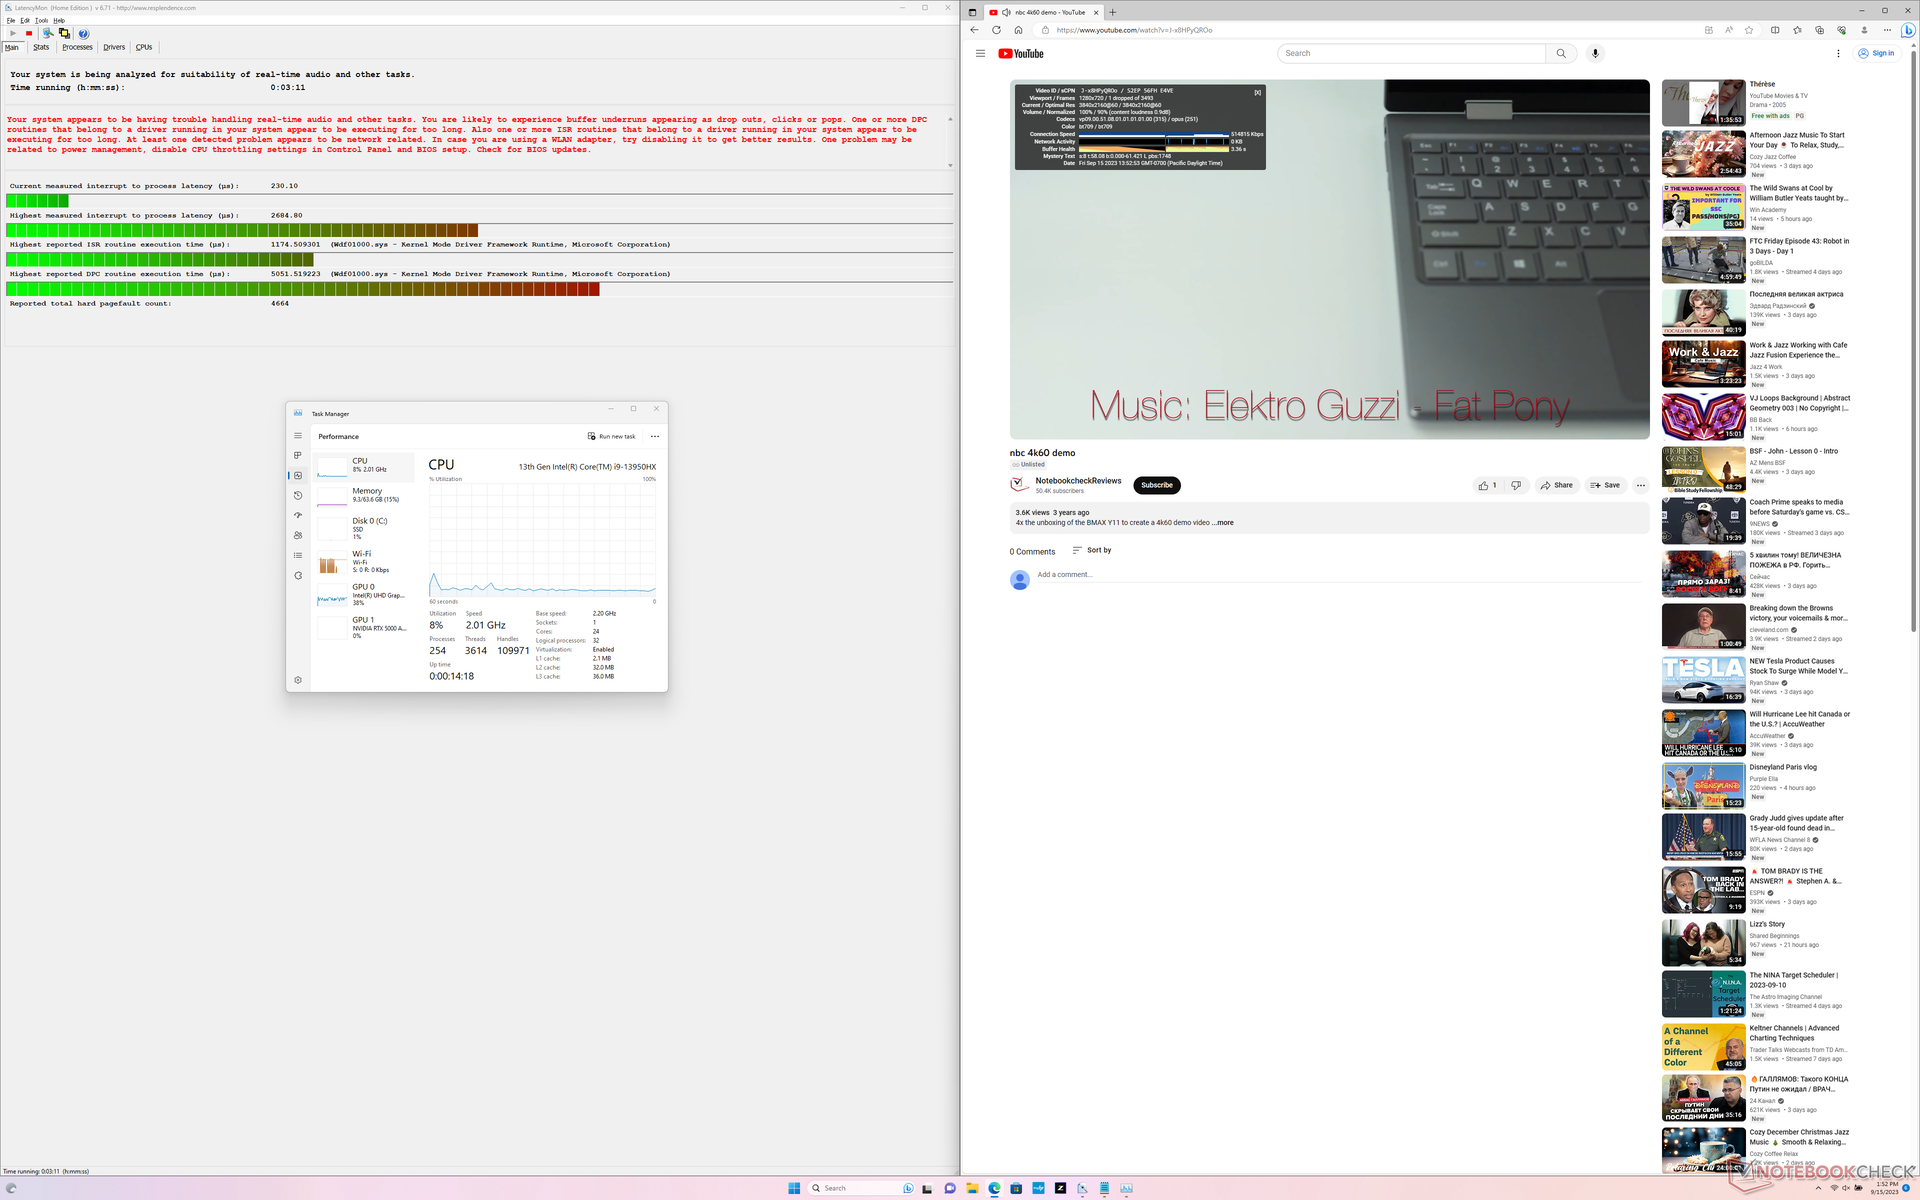
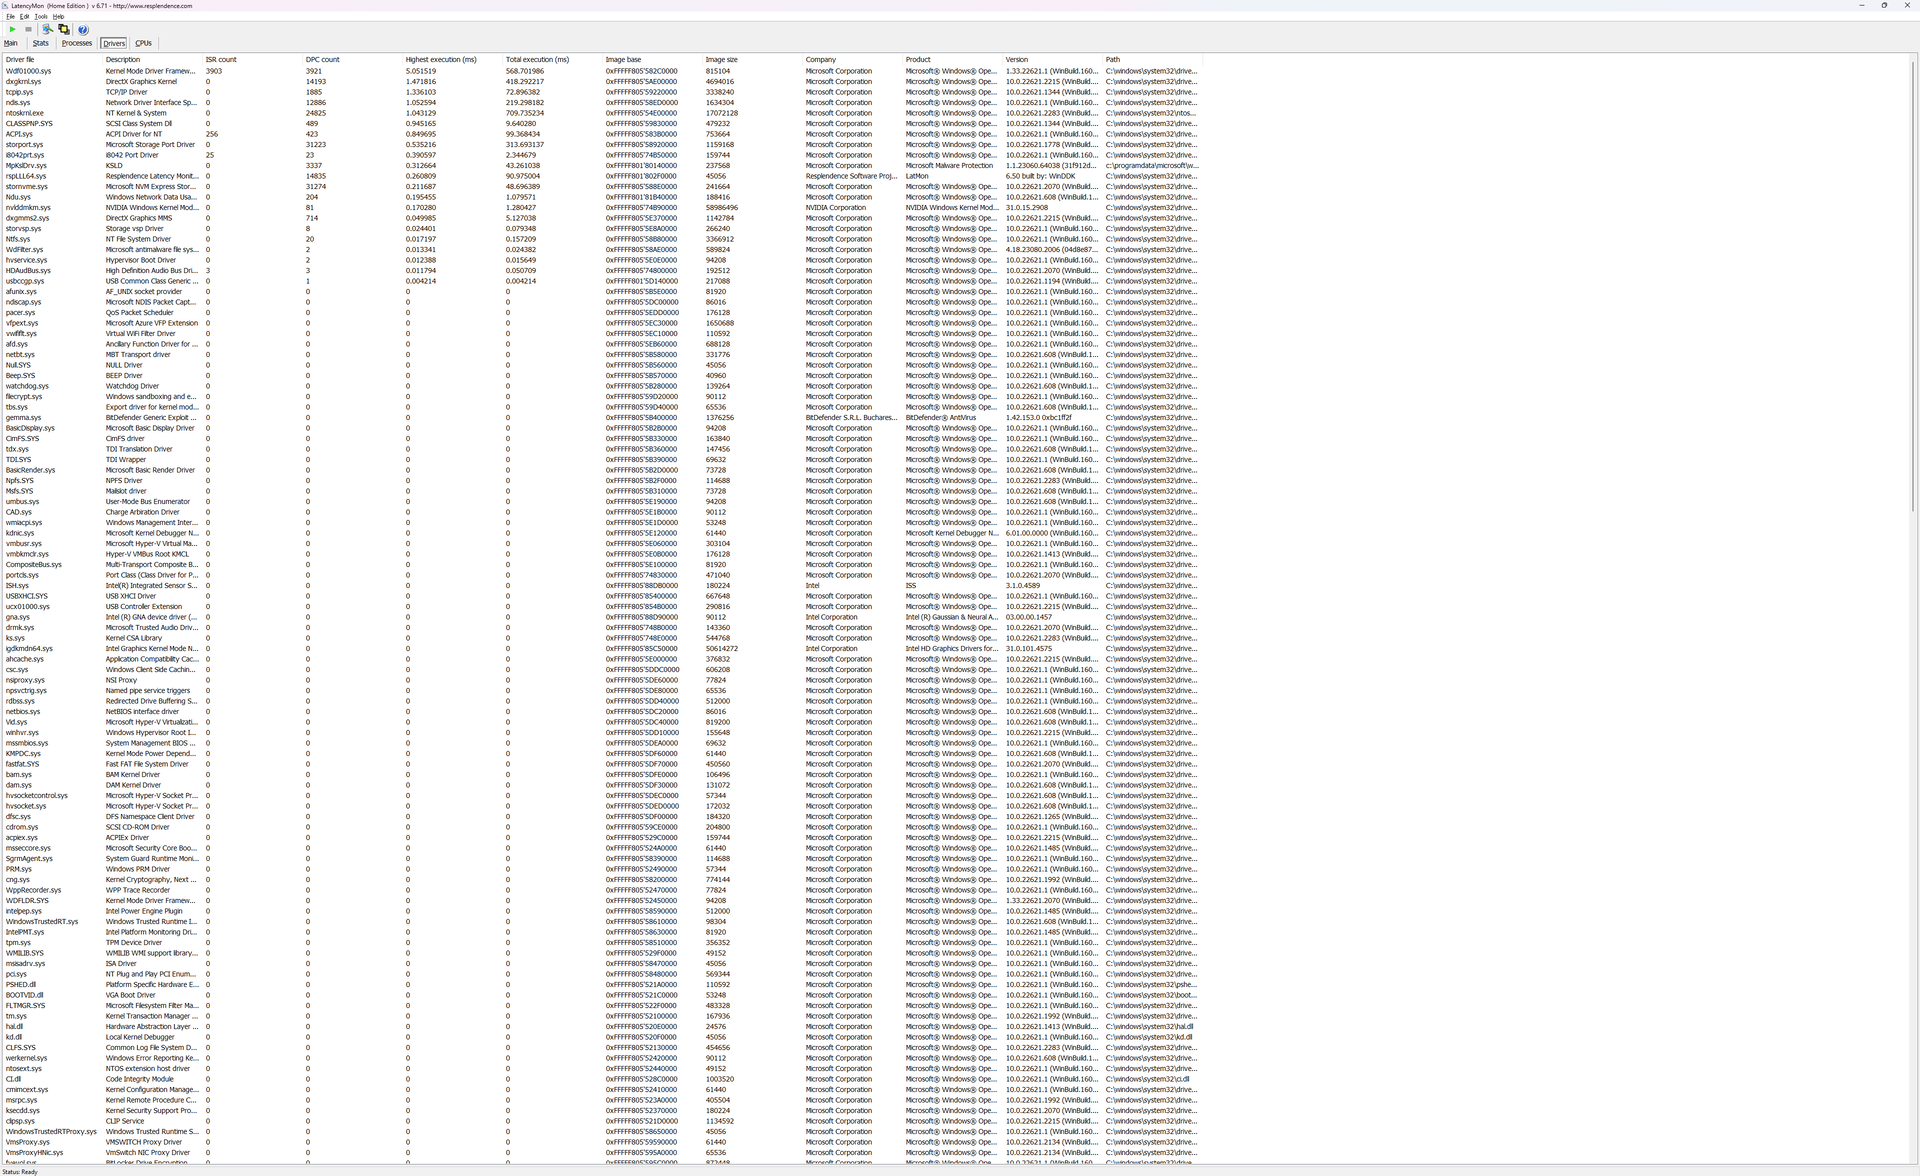
DPC Latency
LatencyMon reveals DPC issues when opening multiple tabs of our homepage. 4K video playback at 60 FPS is almost perfect with just one dropped frame recorded during a 60-second interval.
| DPC Latencies / LatencyMon - interrupt to process latency (max), Web, Youtube, Prime95 | |
| HP ZBook Fury 16 G10 | |
| HP ZBook Fury 16 G9 | |
| Dell Precision 5000 5680 | |
| Lenovo ThinkPad P16 G1 RTX A5500 | |
| Asus ProArt StudioBook 16 W7600H5A-2BL2 | |
| MSI CreatorPro Z16P B12UKST | |
* ... smaller is better
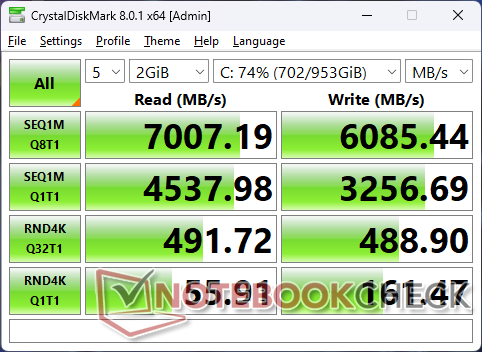
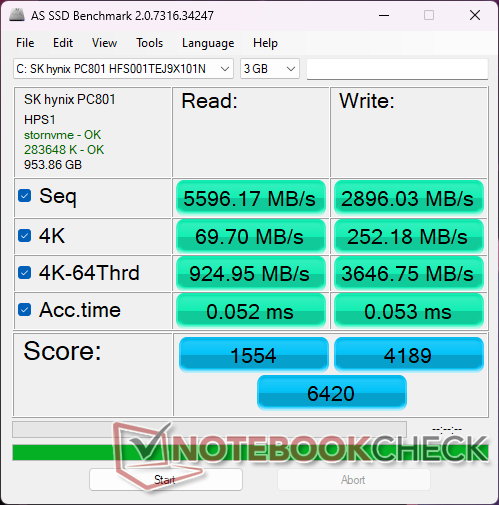
Storage Devices
Our test unit ships with an SK hynix PC801 PCIe4 x4 NVMe SSD whereas our older Fury G16 G9 unit would ship with a Micron 3400. Unfortunately, performance would still throttle to as low as 3400 MB/s after about a minute into our stress test as shown by the graph below. It's clear that the four M.2 SSD slots could really use some more cooling to improve performance consistency.

| Drive Performance Rating - Percent | |
| MSI CreatorPro Z16P B12UKST -8! | |
| HP ZBook Fury 16 G9 | |
| HP ZBook Fury 16 G10 -11! | |
| Dell Precision 5000 5680 | |
| Lenovo ThinkPad P16 G1 RTX A5500 | |
| Asus ProArt StudioBook 16 W7600H5A-2BL2 | |
* ... smaller is better
Disk Throttling: DiskSpd Read Loop, Queue Depth 8
GPU Performance — Mobile Monster
The RTX 5000 Ada in our HP system is 10 to 20 percent faster than the same GPU on the Dell Precision 5680. Its slight but consistent performance advantages can be attributed to the higher TGP ceiling whereas the GPU in the aforementioned Dell would run at a lower power envelope. Our Stress Test section below details our observations.
Overall performance is well ahead of the RTX A5500 in last year's Fury 16 G9 by up to 40 percent or even 80 percent depending on the application.
| 3DMark 11 Performance | 39530 points | |
| 3DMark Fire Strike Score | 28837 points | |
| 3DMark Time Spy Score | 15989 points | |
Help | ||
* ... smaller is better
Witcher 3 FPS Chart
| low | med. | high | ultra | QHD | 4K | |
| The Witcher 3 (2015) | 510.5 | 430.3 | 298.1 | 156.5 | 105.2 | |
| Dota 2 Reborn (2015) | 211 | 191.7 | 188.2 | 166.7 | 157.3 | |
| Final Fantasy XV Benchmark (2018) | 196.9 | 179.9 | 149.1 | 120 | 68.7 | |
| X-Plane 11.11 (2018) | 175.5 | 153.9 | 122.4 | 102.6 | ||
| Far Cry 5 (2018) | 158 | 144 | 138 | 131 | 129 | |
| Strange Brigade (2018) | 411 | 337 | 306 | 283 | 216 | 105.1 |
| Cyberpunk 2077 1.6 (2022) | 110.5 | 106.8 | 104.9 | 103.8 | 74.7 | 37 |
| Tiny Tina's Wonderlands (2022) | 267.5 | 227.7 | 171.7 | 139.4 | 99.4 | 53.9 |
| F1 22 (2022) | 249 | 246 | 211 | 86.2 | 64.4 | 33.4 |
| Ratchet & Clank Rift Apart (2023) | 118 | 93.9 | 69.4 | 54.5 | 43.4 | 33.3 |
Emissions
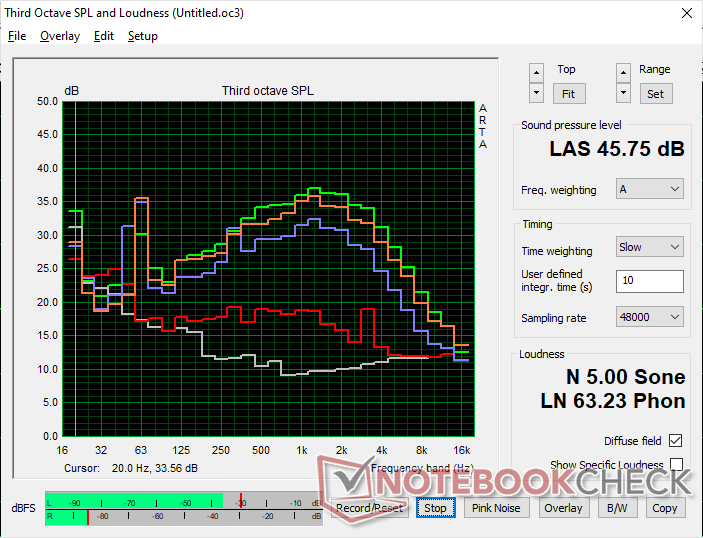
System Noise
Maximum fan noise is quieter than what we recorded on last year's model. Or, at the very least, it takes longer for the fans in the Fury 16 G10 to reach the same high as the fans in the Fury 16 G9. Fan noise is otherwise quiet during low to low-medium loads with the occasional pulsing to 29 dB(A) against a silent background of 23 dB(A).
we can notice some slight coil whine or electronic noise on our unit when launching more demanding loads like games. The high-pitched noise should hopefully slowly disappear over time.

Noise Level
| Idle |
| 22.9 / 22.9 / 28.5 dB(A) |
| Load |
| 40.6 / 45.8 dB(A) |
 | ||
30 dB silent 40 dB(A) audible 50 dB(A) loud |
||
min: | ||
| HP ZBook Fury 16 G10 NVIDIA RTX 5000 Ada Generation Laptop GPU, i9-13950HX, SK hynix PC801 HFS001TEJ9X101N | HP ZBook Fury 16 G9 RTX A5500 Laptop GPU, i9-12950HX, Micron 3400 1TB MTFDKBA1T0TFH | Dell Precision 5000 5680 NVIDIA RTX 5000 Ada Generation Laptop GPU, i9-13900H, 2x SK hynix PC801 HFS512GEJ9X101N RAID 0 | Lenovo ThinkPad P16 G1 RTX A5500 RTX A5500 Laptop GPU, i9-12950HX, WDC PC SN810 2TB | MSI CreatorPro Z16P B12UKST RTX A3000 Laptop GPU, i7-12700H, Samsung PM9A1 MZVL21T0HCLR | Asus ProArt StudioBook 16 W7600H5A-2BL2 RTX A5000 Laptop GPU, W-11955M, 2x Micron 2300 2TB MTFDHBA2T0TDV (RAID 0) | |
|---|---|---|---|---|---|---|
| Noise | -1% | 0% | 2% | -6% | -5% | |
| off / environment * | 22.9 | 22.6 1% | 22.8 -0% | 23.1 -1% | 24.1 -5% | 26 -14% |
| Idle Minimum * | 22.9 | 22.7 1% | 23 -0% | 23.1 -1% | 27.1 -18% | 26 -14% |
| Idle Average * | 22.9 | 22.7 1% | 23 -0% | 23.1 -1% | 27.1 -18% | 26 -14% |
| Idle Maximum * | 28.5 | 28.8 -1% | 23 19% | 23.1 19% | 27.1 5% | 26.5 7% |
| Load Average * | 40.6 | 36.2 11% | 37.2 8% | 28.9 29% | 42.9 -6% | 42 -3% |
| Witcher 3 ultra * | 44.1 | 49.5 -12% | 51 -16% | 51.6 -17% | 44 -0% | |
| Load Maximum * | 45.8 | 49.3 -8% | 51 -11% | 51.4 -12% | 47 -3% | 43 6% |
* ... smaller is better
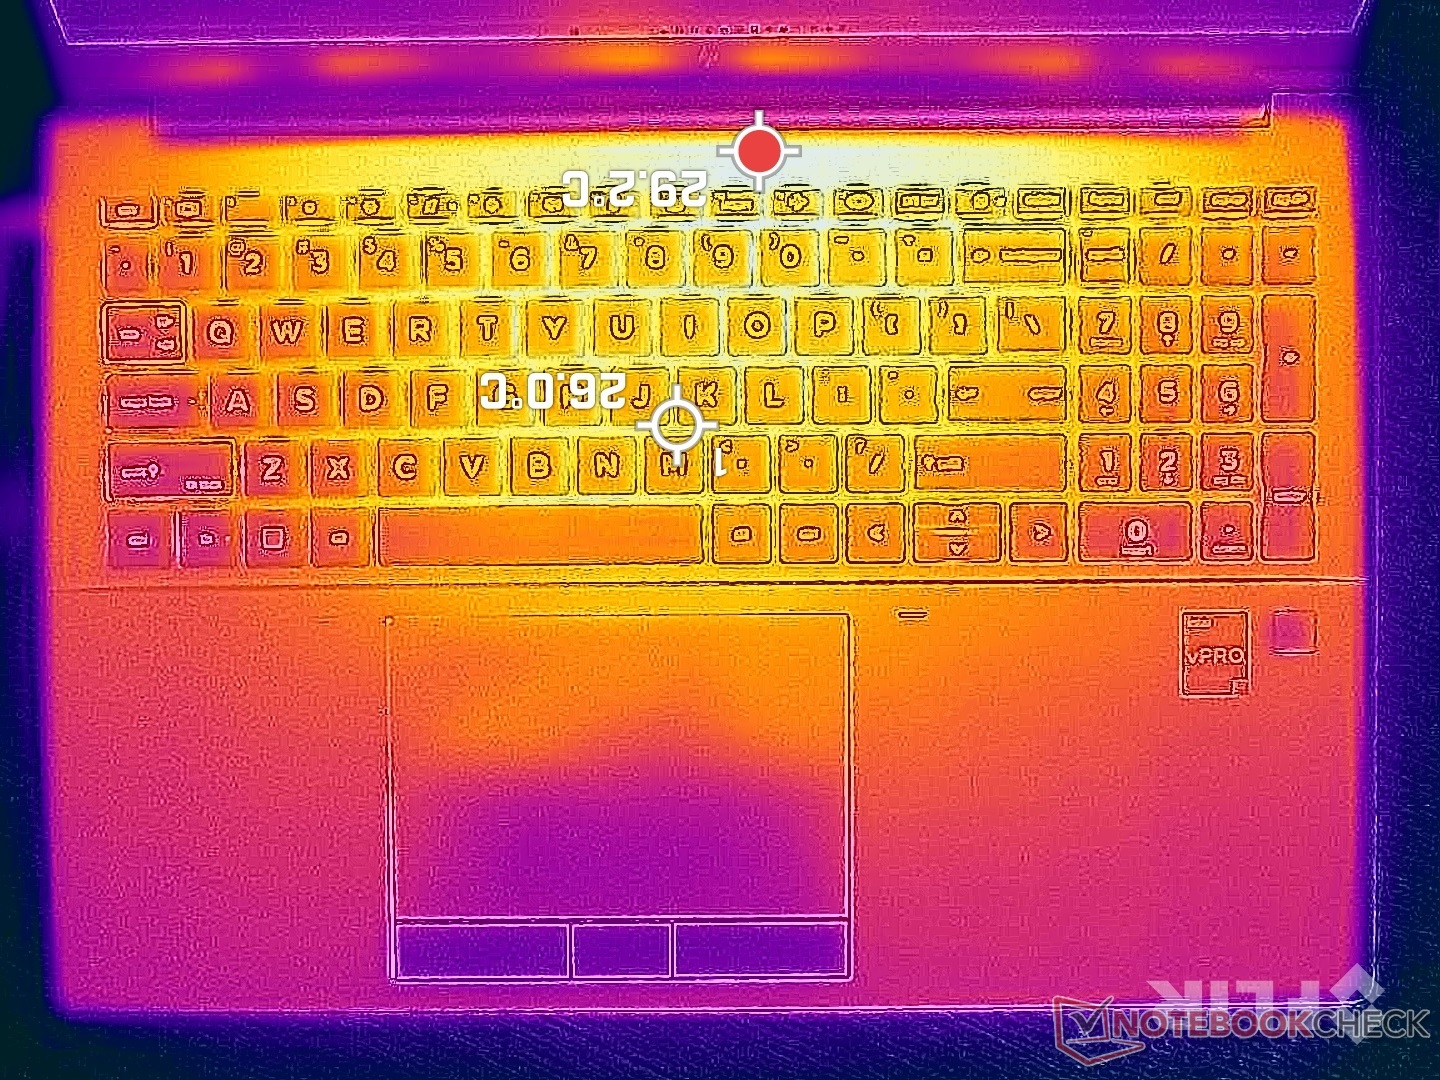
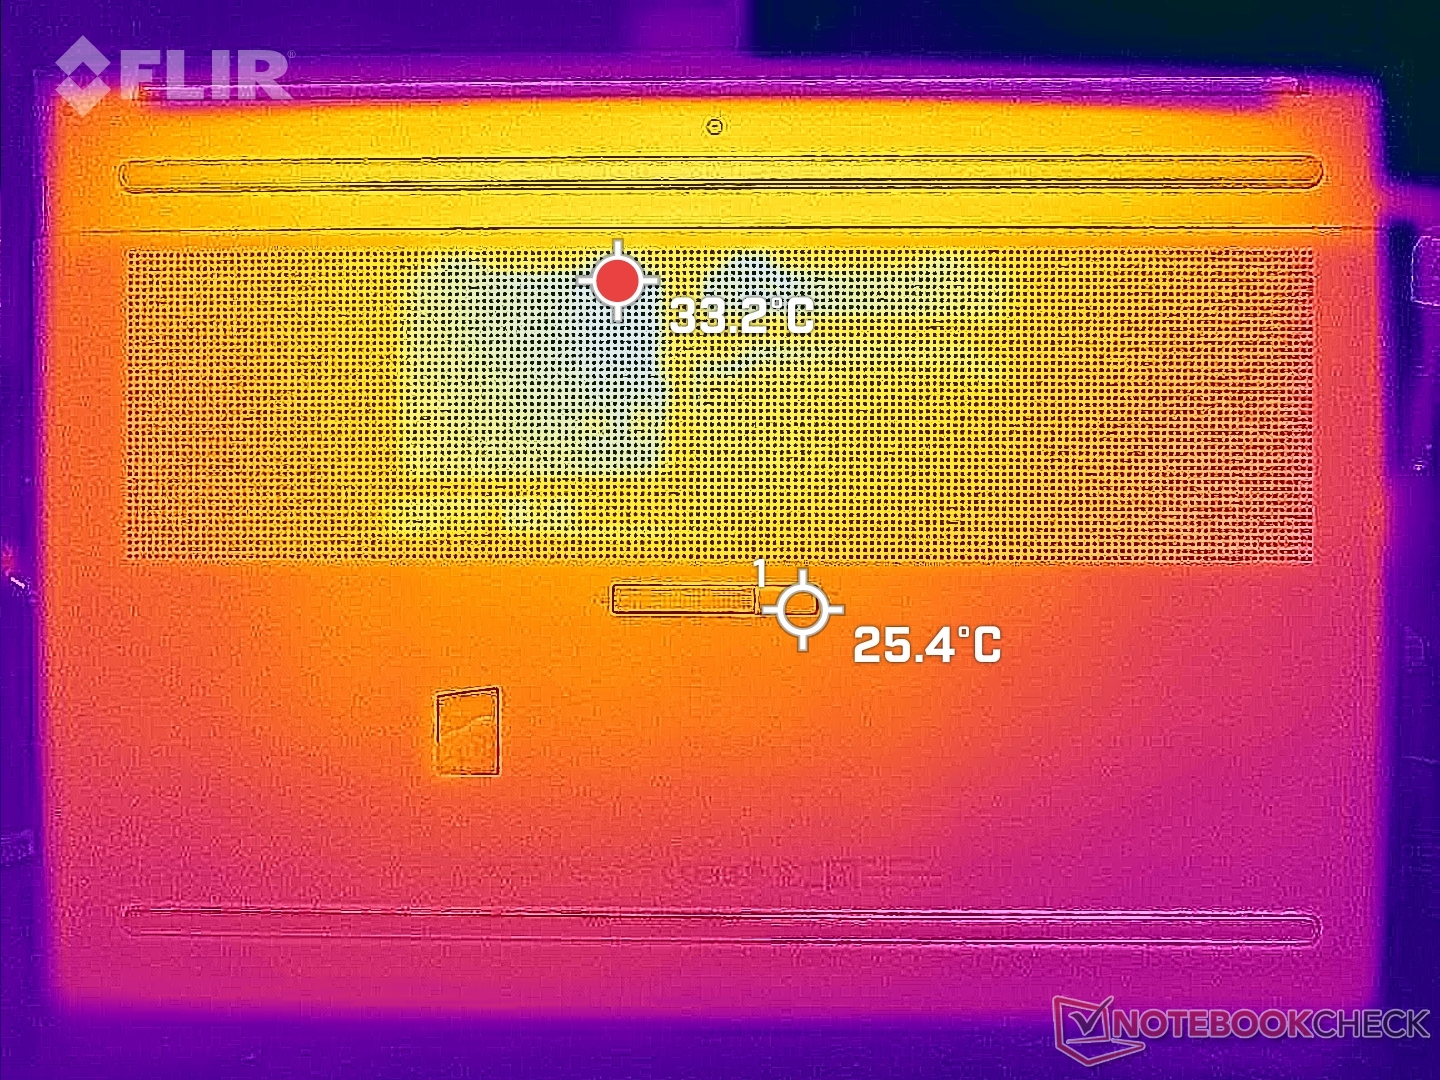
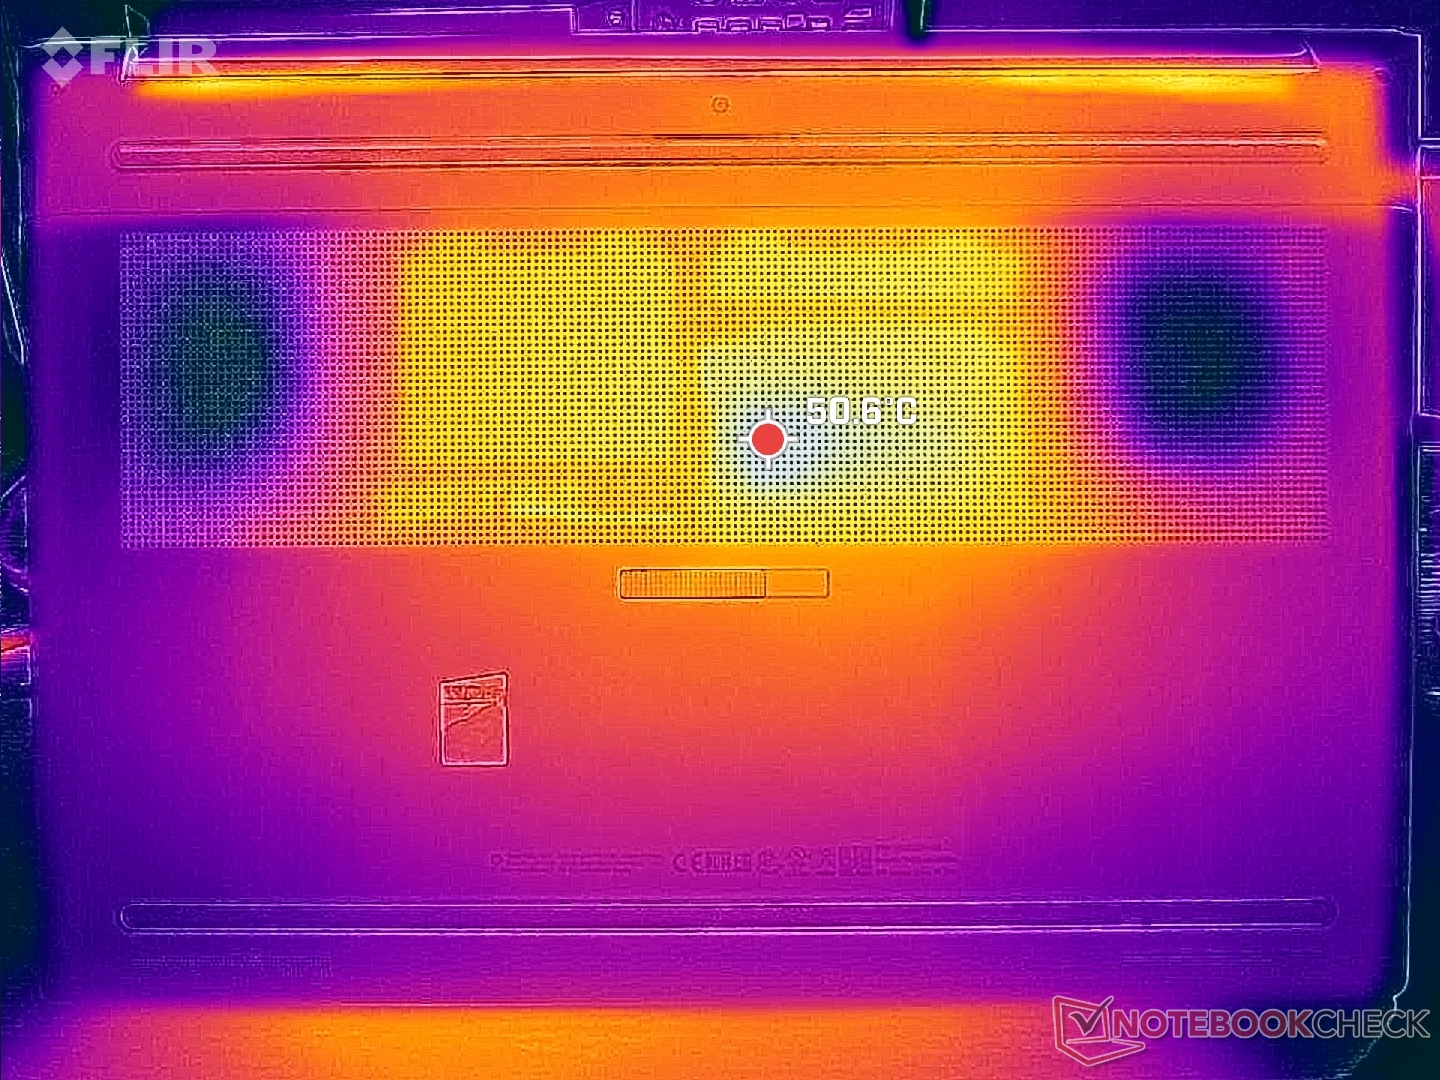
Temperature
Surface temperatures can reach over 36 C on the keyboard center or 45 C along the rear when running high loads. Interestingly, the system is cooler than the Precision 5680 on the keyboard but the opposite is true for their bottom surfaces.
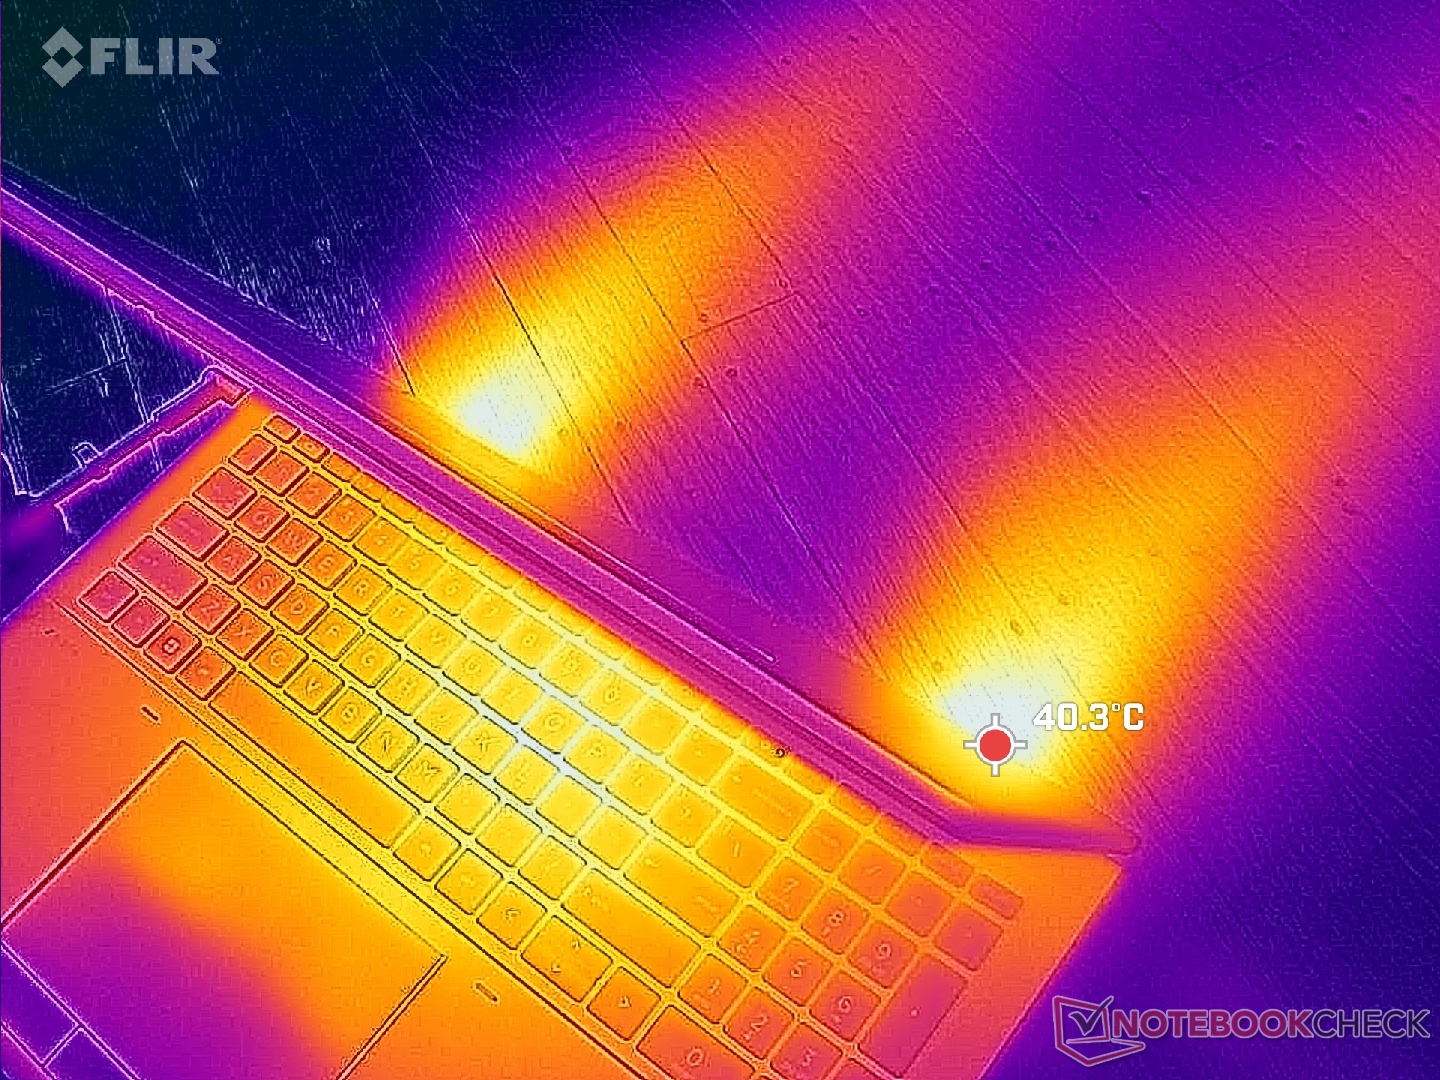
(±) The maximum temperature on the upper side is 44.8 °C / 113 F, compared to the average of 38.1 °C / 101 F, ranging from 22.2 to 69.8 °C for the class Workstation.
(-) The bottom heats up to a maximum of 50 °C / 122 F, compared to the average of 41.4 °C / 107 F
(+) In idle usage, the average temperature for the upper side is 30.6 °C / 87 F, compared to the device average of 32 °C / 90 F.
(±) Playing The Witcher 3, the average temperature for the upper side is 34.7 °C / 94 F, compared to the device average of 32 °C / 90 F.
(±) The palmrests and touchpad can get very hot to the touch with a maximum of 39.2 °C / 102.6 F.
(-) The average temperature of the palmrest area of similar devices was 27.9 °C / 82.2 F (-11.3 °C / -20.4 F).


| HP ZBook Fury 16 G10 Intel Core i9-13950HX, NVIDIA RTX 5000 Ada Generation Laptop GPU | HP ZBook Fury 16 G9 Intel Core i9-12950HX, NVIDIA RTX A5500 Laptop GPU | Dell Precision 5000 5680 Intel Core i9-13900H, NVIDIA RTX 5000 Ada Generation Laptop GPU | Lenovo ThinkPad P16 G1 RTX A5500 Intel Core i9-12950HX, NVIDIA RTX A5500 Laptop GPU | MSI CreatorPro Z16P B12UKST Intel Core i7-12700H, NVIDIA RTX A3000 Laptop GPU | Asus ProArt StudioBook 16 W7600H5A-2BL2 Intel Xeon W-11955M, NVIDIA RTX A5000 Laptop GPU | |
|---|---|---|---|---|---|---|
| Heat | 8% | 4% | -3% | -4% | -3% | |
| Maximum Upper Side * | 44.8 | 43.2 4% | 50.2 -12% | 44.8 -0% | 56.3 -26% | 45.7 -2% |
| Maximum Bottom * | 50 | 50.4 -1% | 32 36% | 49.8 -0% | 68.3 -37% | 48.3 3% |
| Idle Upper Side * | 34.4 | 28.6 17% | 37.4 -9% | 30.6 11% | 25.2 27% | 35.3 -3% |
| Idle Bottom * | 31.8 | 28.2 11% | 31.2 2% | 38.6 -21% | 25.9 19% | 34.4 -8% |
* ... smaller is better
Stress Test
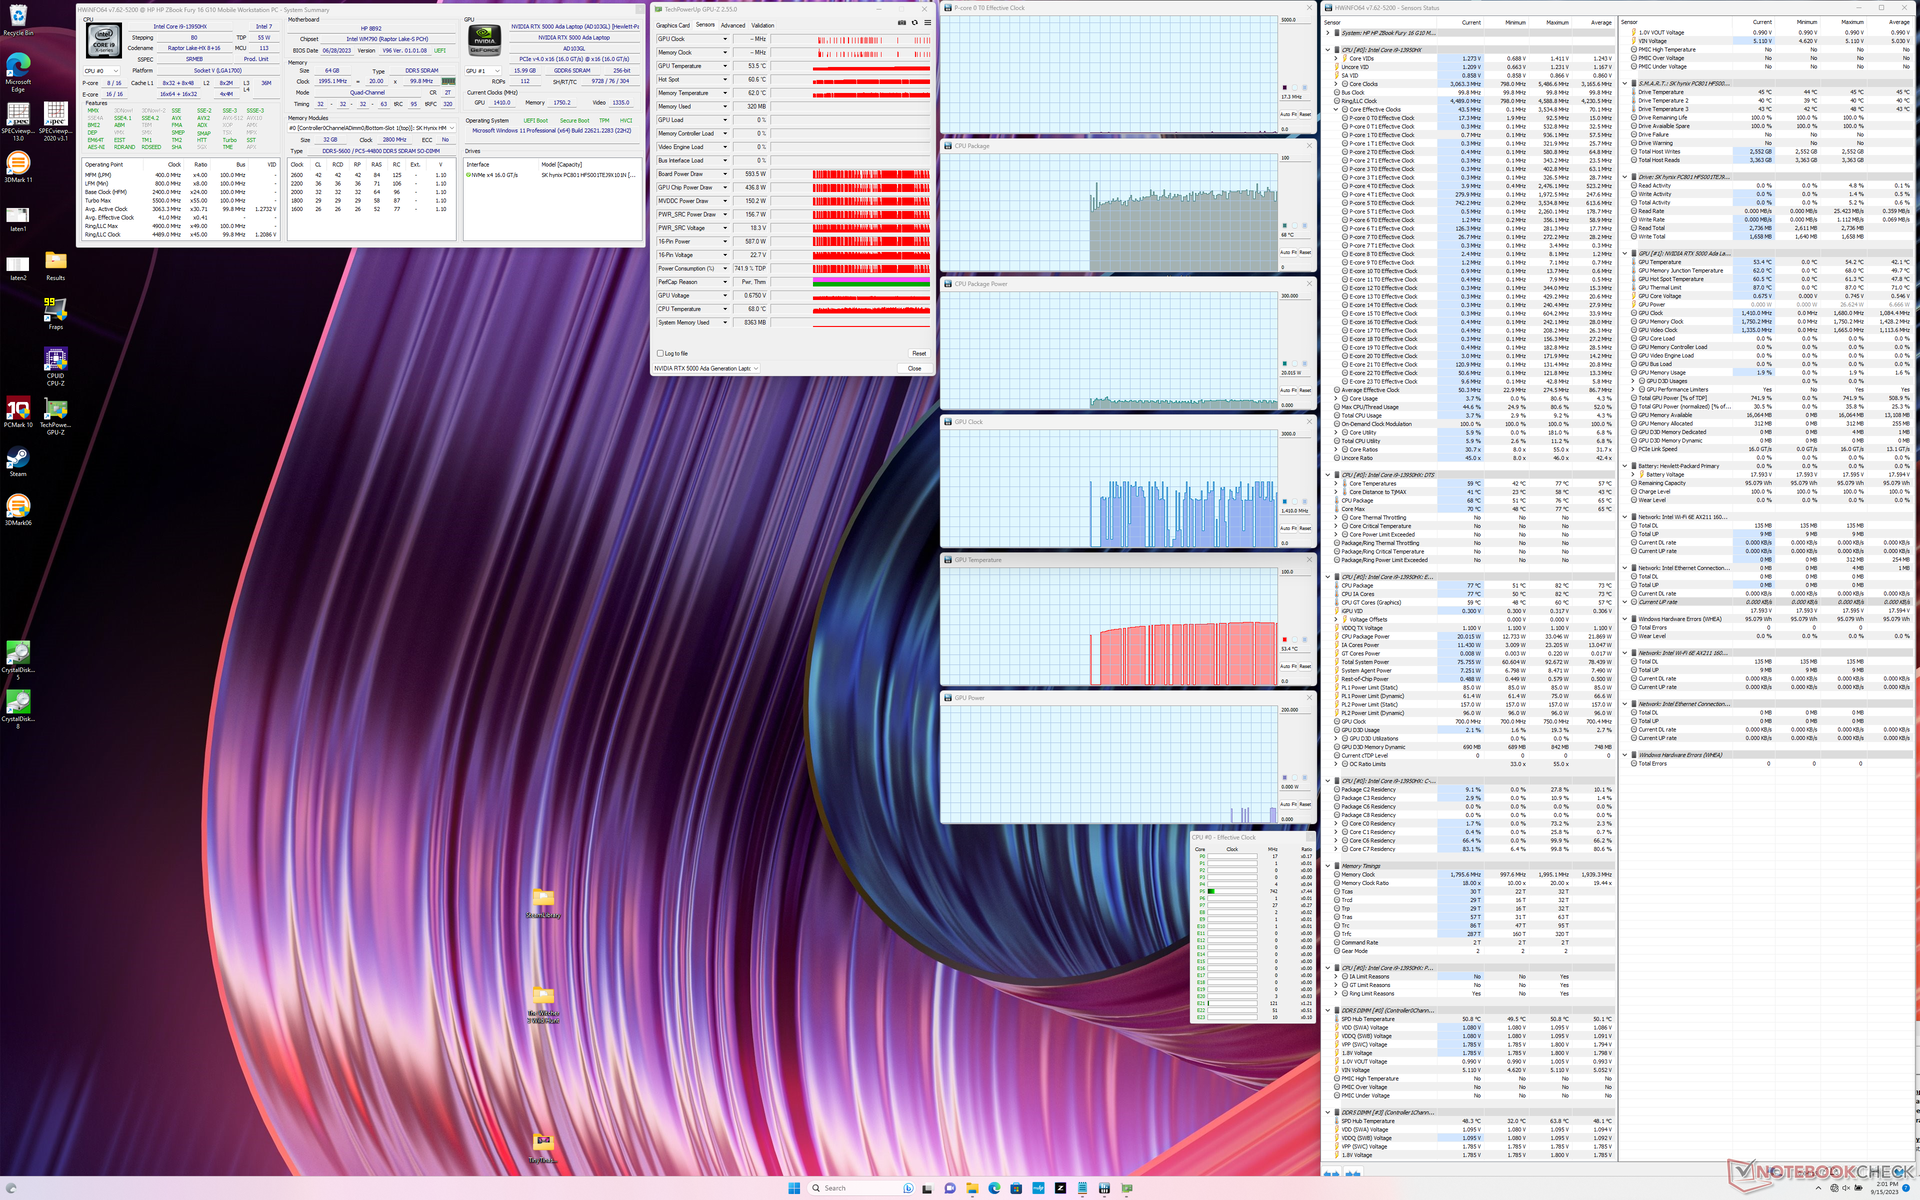
Average CPU clock rates and board power draw when running Prime95 would stabilize at 1.5 GHz and 48 W, respectively, compared to 2.9 GHz and 115 W on the Razer Blade 18 equipped with the same Core i9-13950HX CPU. Core temperature would be cooler by around 8 C on the HP to suggest that the Fury 16 G10 is prioritizing temperature control over faster performance.
Running on Balanced mode reduces graphics performance. For example, GPU clock rates and power draw when running Witcher 3 would stabilize at 1845 MHz and 102 W, respectively, compared to 1770 MHz and 94 W when on Balanced mode. Either way, the HP system reaches higher real-world TGP values than the same GPU in the Precision 5680 where it is only 72 W.
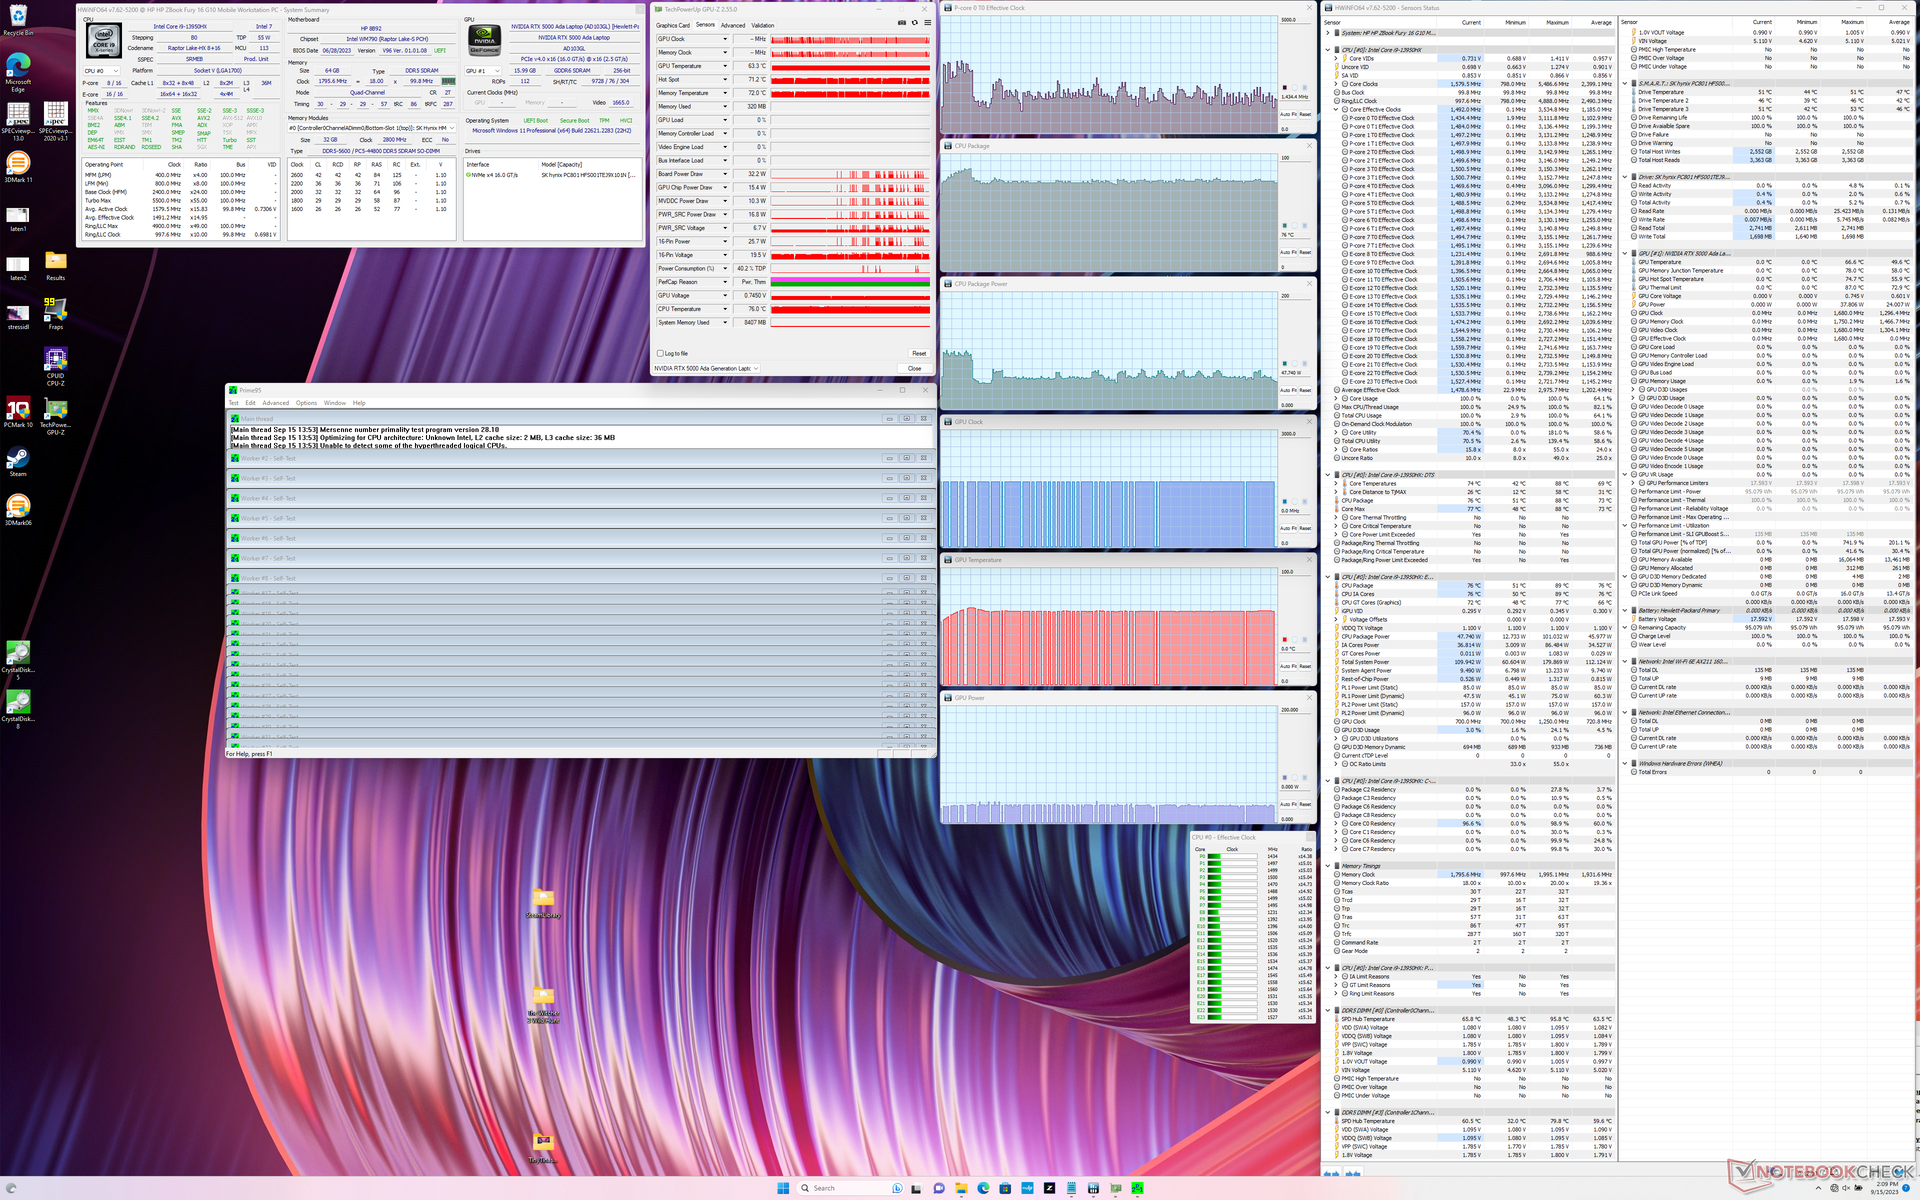
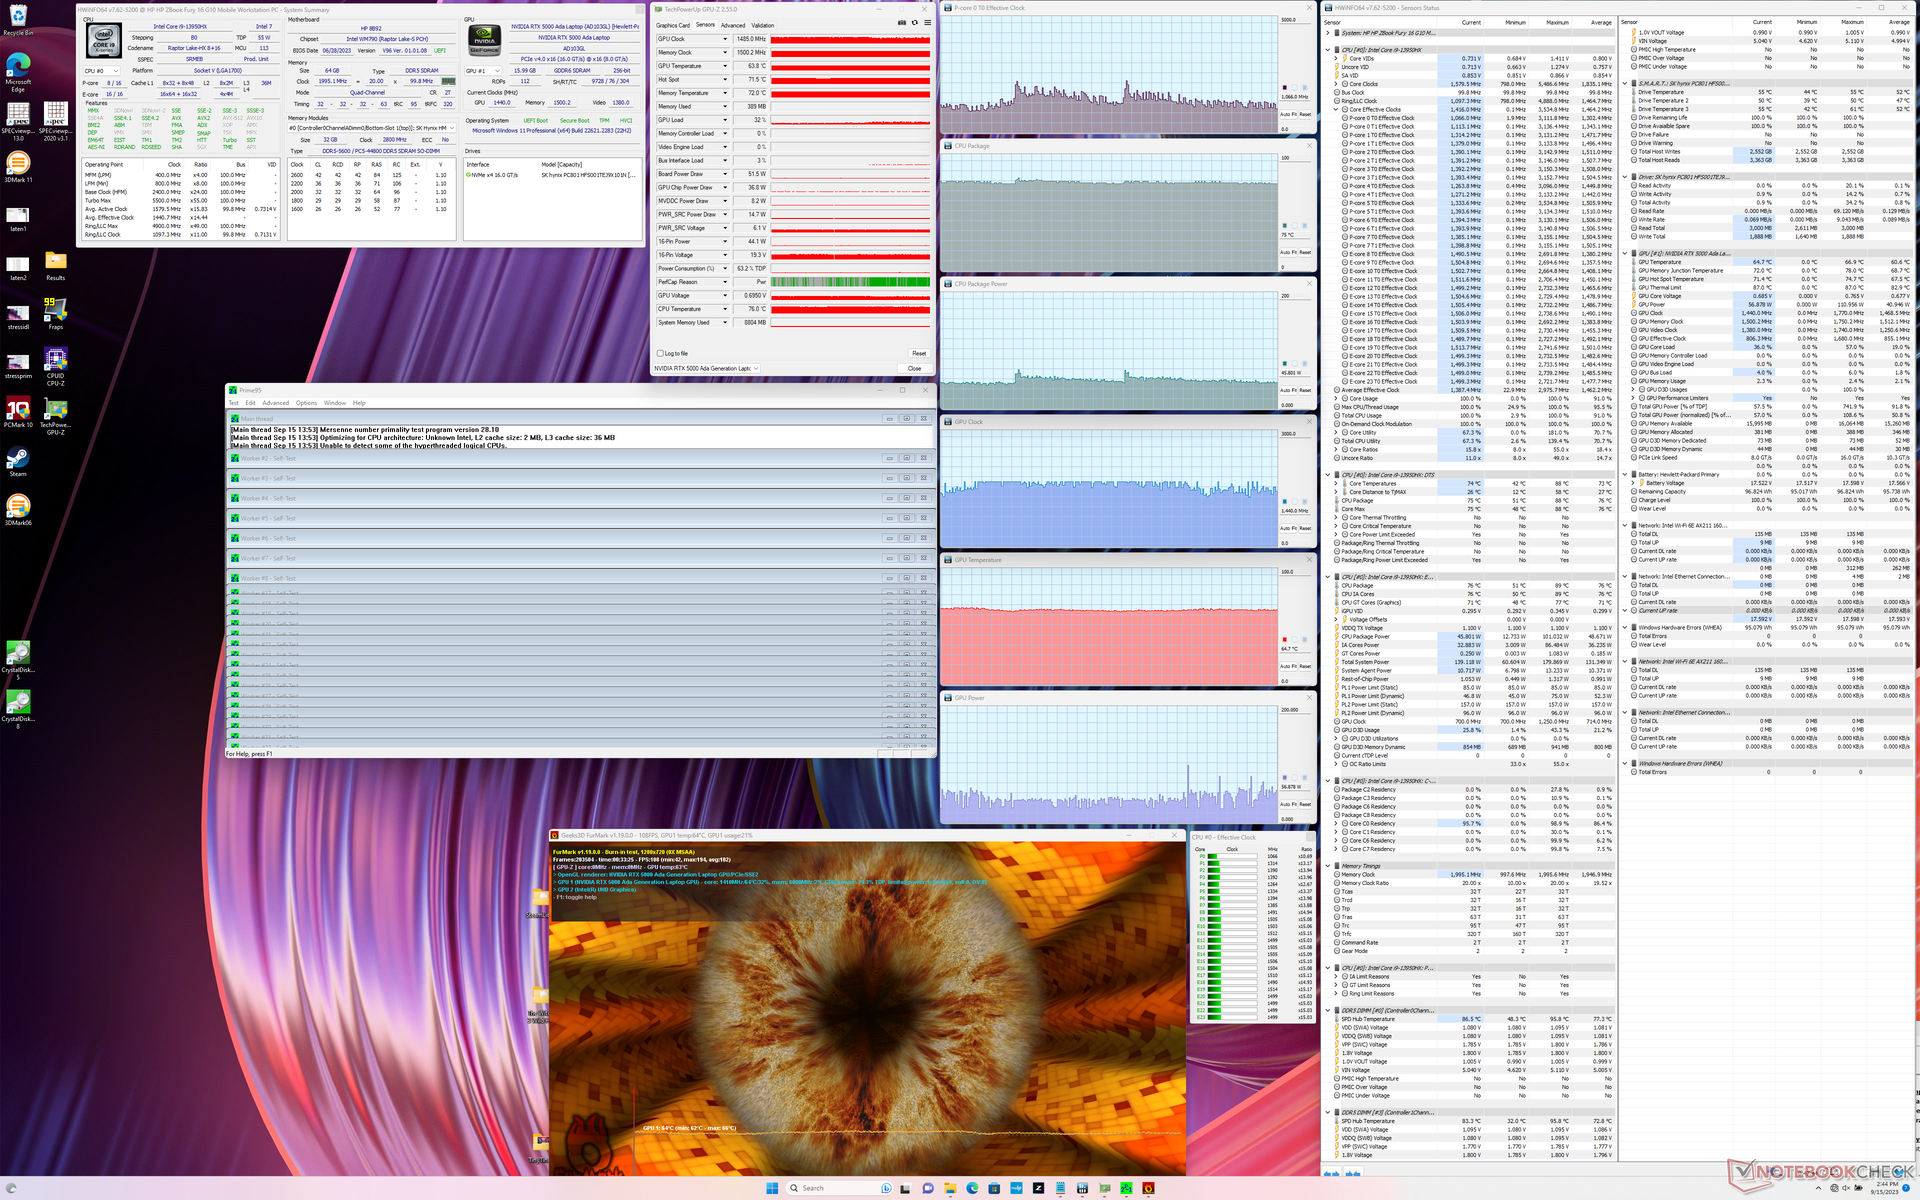
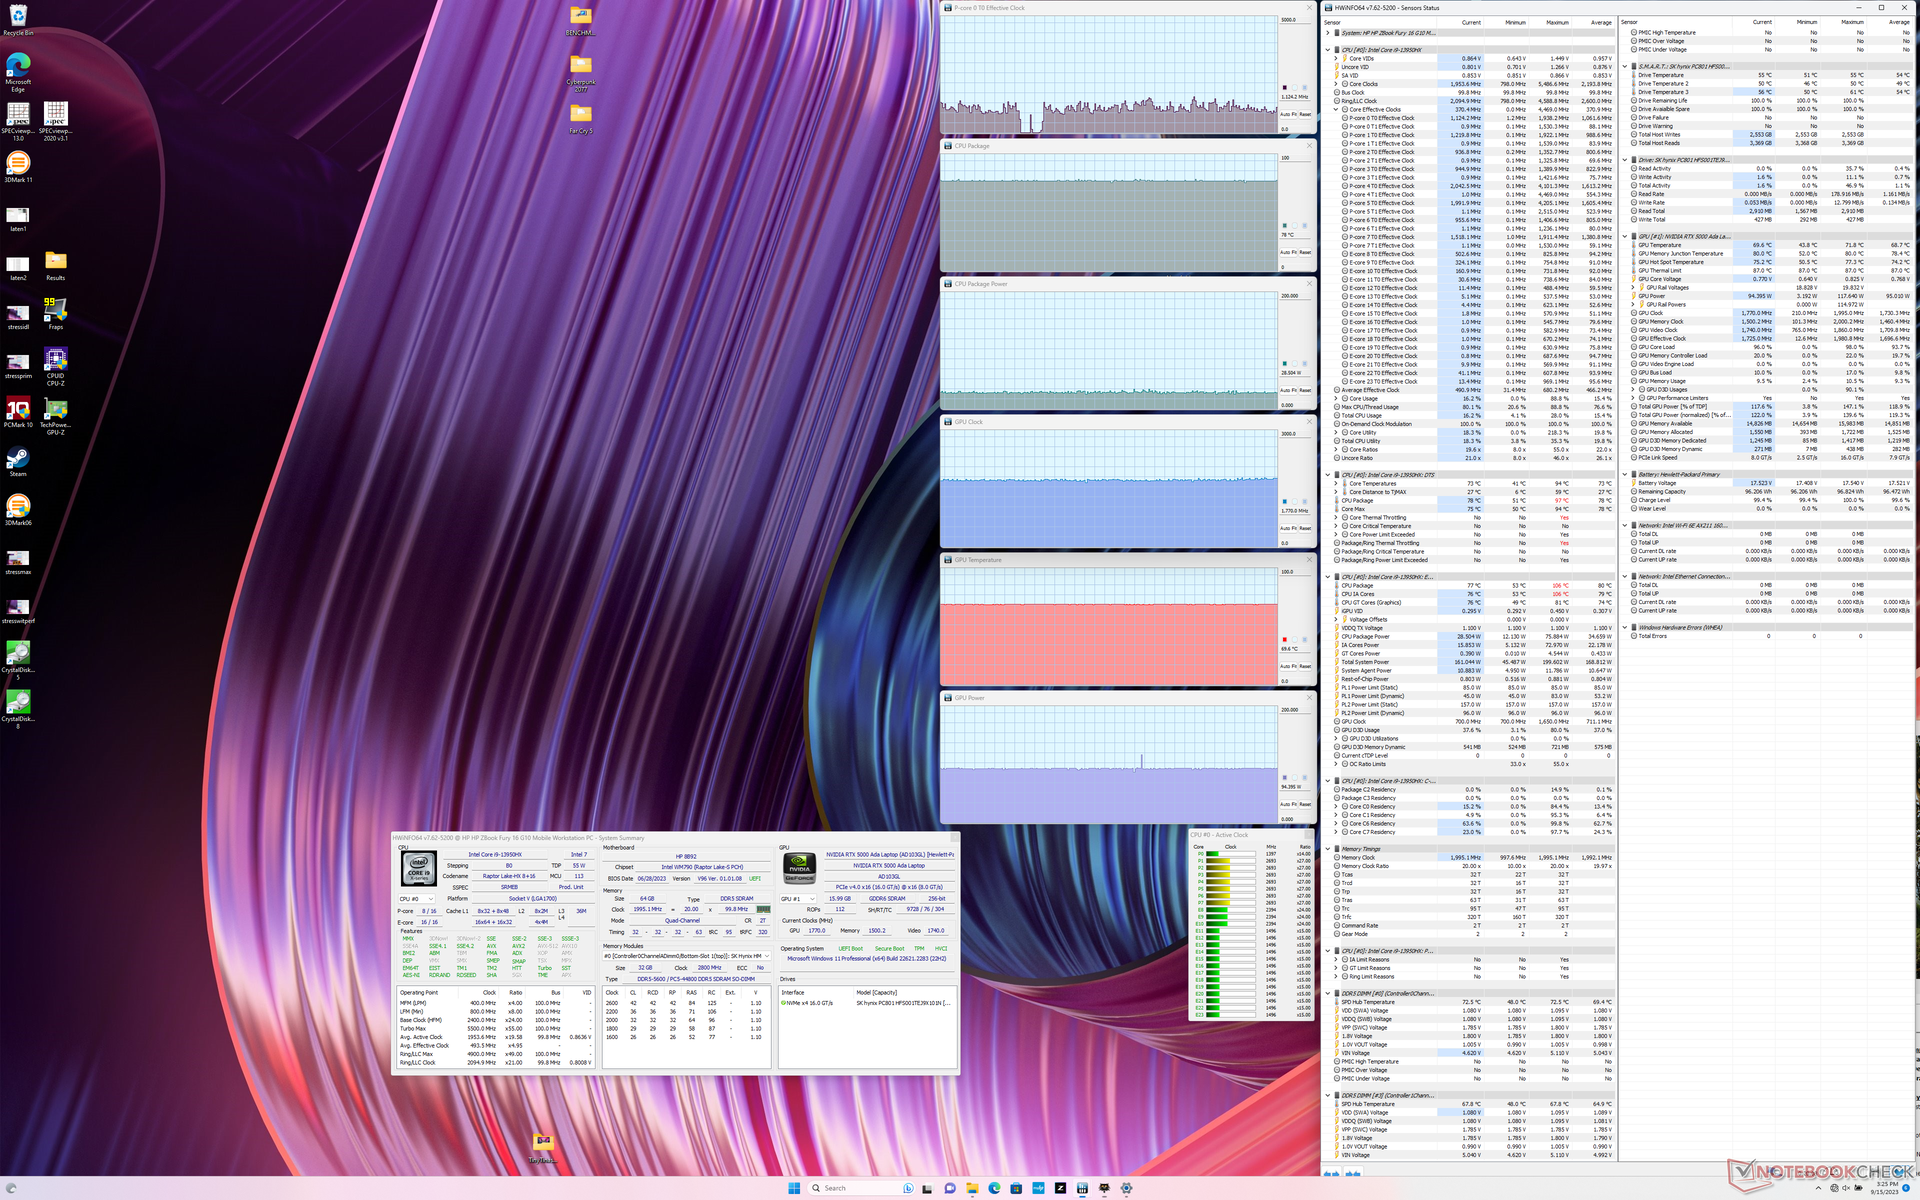

| CPU Clock (GHz) | GPU Clock (MHz) | Average CPU Temperature (°C) | Average GPU Temperature (°C) | |
| System Idle | -- | -- | 68 | 54 |
| Prime95 Stress | ~1.7 | -- | 76 | 63 |
| Prime95 + FurMark Stress | ~1.1 | 1440 | 75 | 65 |
| Witcher 3 Stress (Balanced mode) | ~1.1 | 1770 | 78 | 70 |
| Witcher 3 Stress (Performance mode) | ~1.1 | 1845 | 79 | 70 |
Speakers

HP ZBook Fury 16 G10 audio analysis
(+) | speakers can play relatively loud (88.2 dB)
Bass 100 - 315 Hz
(±) | reduced bass - on average 7.7% lower than median
(±) | linearity of bass is average (8.7% delta to prev. frequency)
Mids 400 - 2000 Hz
(+) | balanced mids - only 1.2% away from median
(+) | mids are linear (3.3% delta to prev. frequency)
Highs 2 - 16 kHz
(+) | balanced highs - only 2.8% away from median
(+) | highs are linear (5.2% delta to prev. frequency)
Overall 100 - 16.000 Hz
(+) | overall sound is linear (8.6% difference to median)
Compared to same class
» 2% of all tested devices in this class were better, 2% similar, 96% worse
» The best had a delta of 7%, average was 18%, worst was 35%
Compared to all devices tested
» 1% of all tested devices were better, 0% similar, 98% worse
» The best had a delta of 4%, average was 26%, worst was 134%
Apple MacBook Pro 16 2021 M1 Pro audio analysis
(+) | speakers can play relatively loud (84.7 dB)
Bass 100 - 315 Hz
(+) | good bass - only 3.8% away from median
(+) | bass is linear (5.2% delta to prev. frequency)
Mids 400 - 2000 Hz
(+) | balanced mids - only 1.3% away from median
(+) | mids are linear (2.1% delta to prev. frequency)
Highs 2 - 16 kHz
(+) | balanced highs - only 1.9% away from median
(+) | highs are linear (2.7% delta to prev. frequency)
Overall 100 - 16.000 Hz
(+) | overall sound is linear (4.6% difference to median)
Compared to same class
» 0% of all tested devices in this class were better, 0% similar, 100% worse
» The best had a delta of 5%, average was 18%, worst was 45%
Compared to all devices tested
» 0% of all tested devices were better, 0% similar, 100% worse
» The best had a delta of 4%, average was 26%, worst was 134%
Energy Management
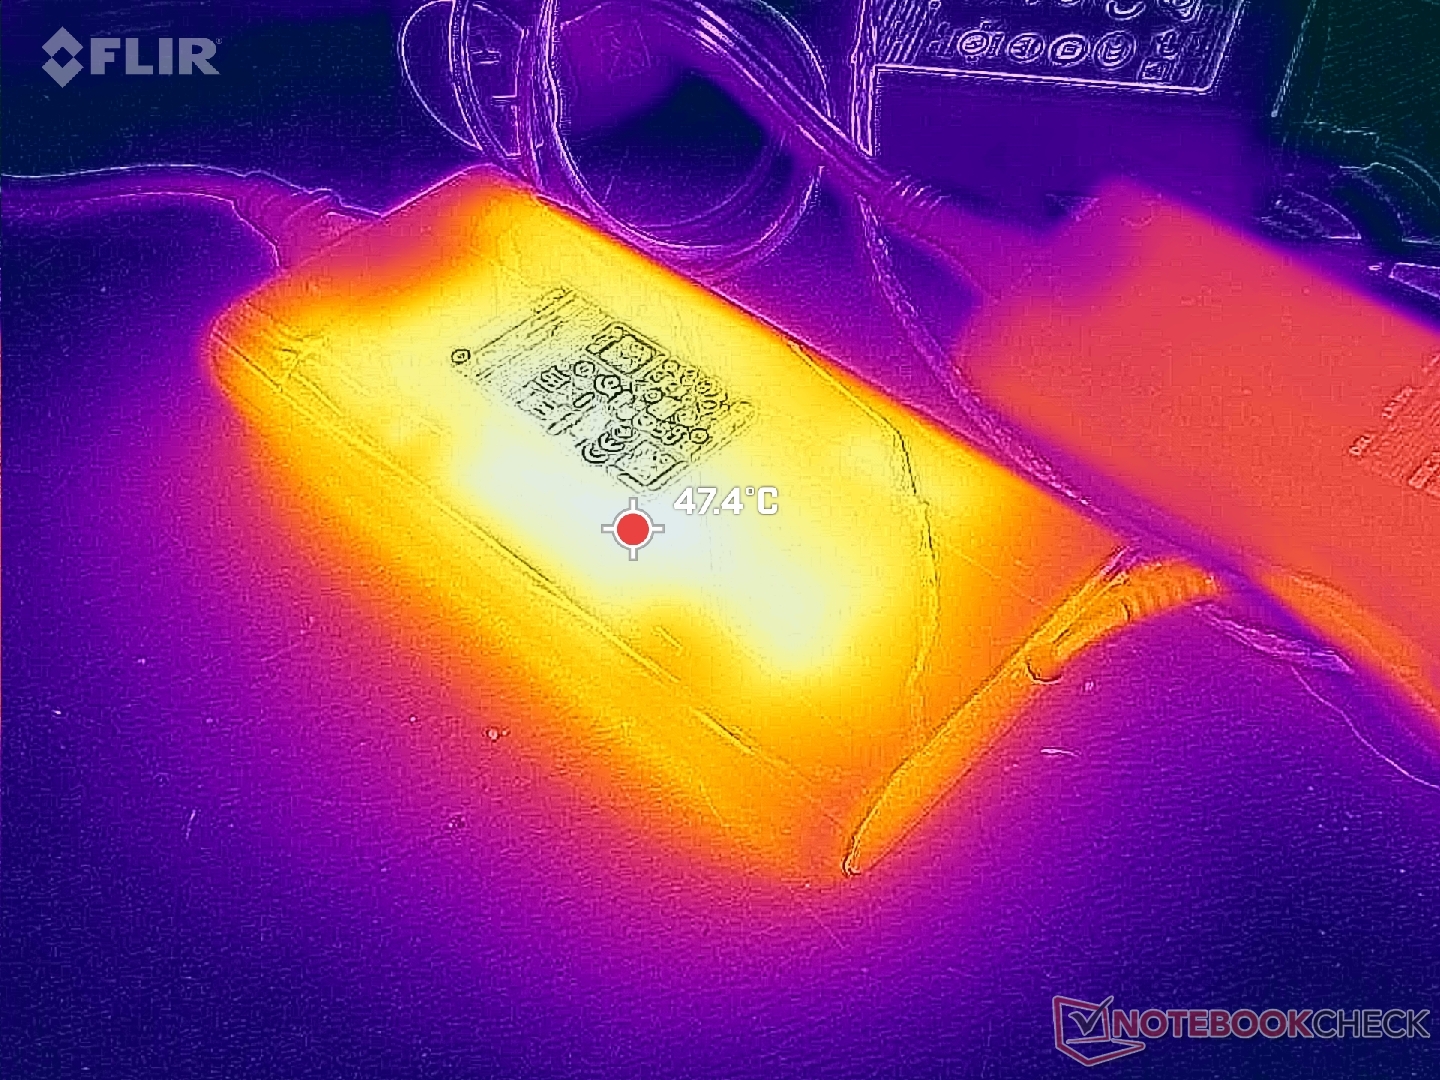
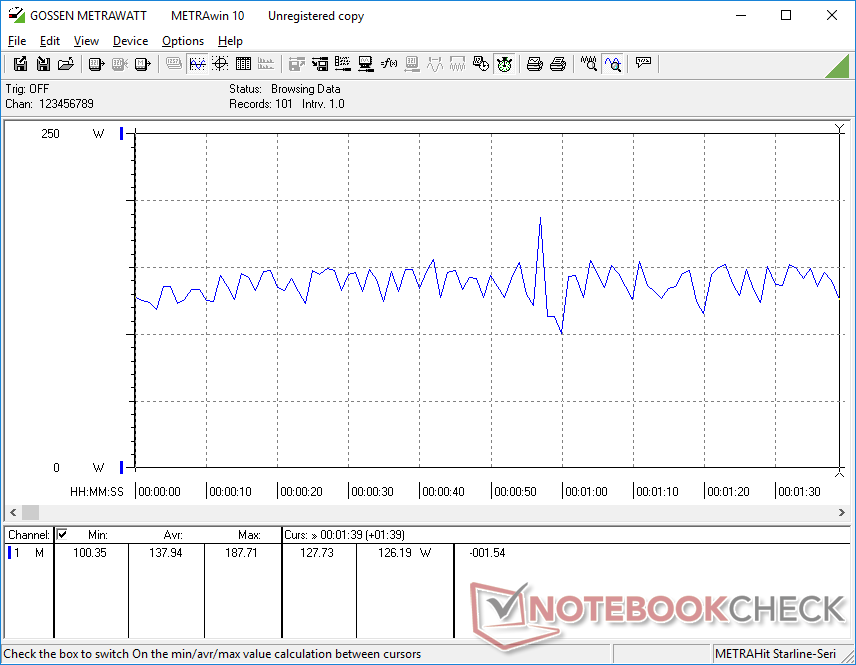
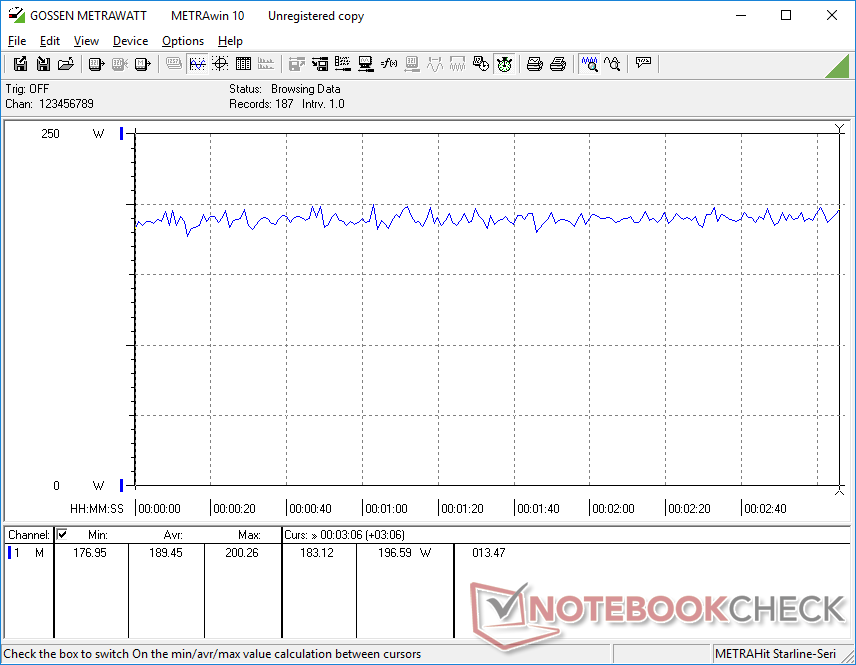
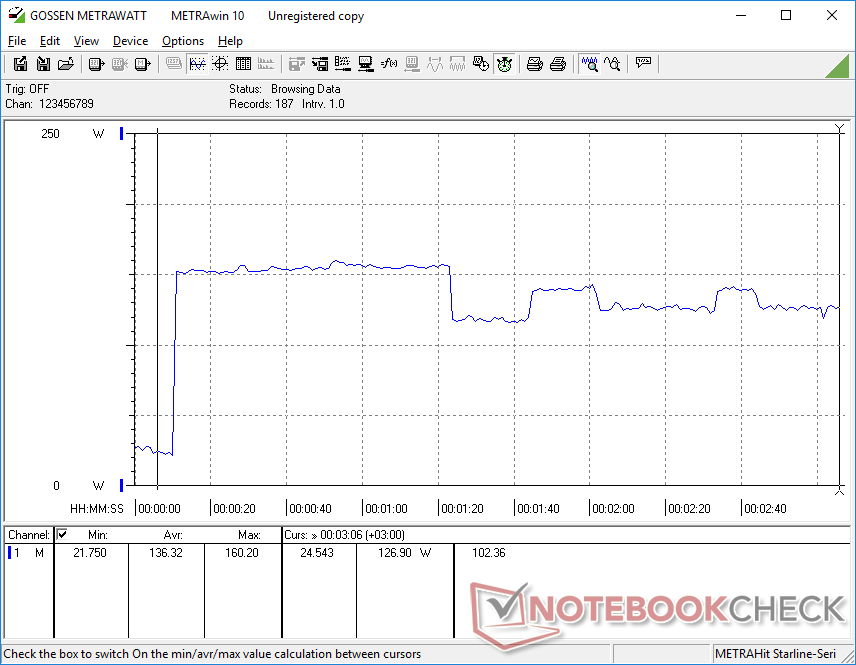
Power Consumption
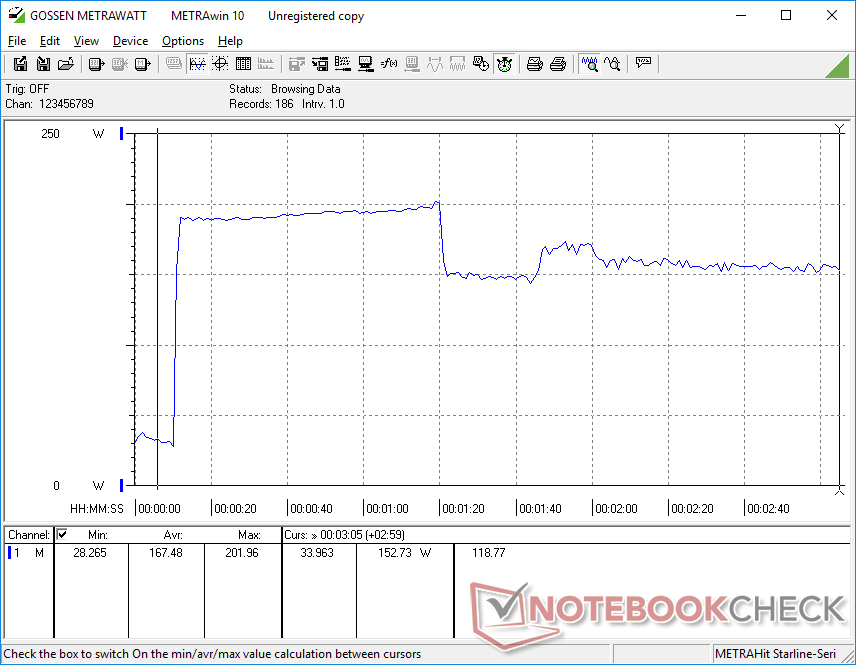
Power consumption under load remains about the same as on last year's model despite the CPU and GPU improvements for much higher performance-per-watt. It's also generally higher than on the Precision 5680 due to the higher TGP targets of the HP model.
Note that our Fury 16 G10 would draw noticeably more power than the similarly-configured Precision 5680 when running high loads like games due mostly to the higher power ceiling targets for the HP. The HP ships with a 230 W AC adapter whereas the Dell would ship with a smaller 165 W USB-C AC adapter instead.
| Off / Standby | |
| Idle | |
| Load |
|
| HP ZBook Fury 16 G10 i9-13950HX, NVIDIA RTX 5000 Ada Generation Laptop GPU, SK hynix PC801 HFS001TEJ9X101N, IPS, 3840x2400, 16.00 | HP ZBook Fury 16 G9 i9-12950HX, RTX A5500 Laptop GPU, Micron 3400 1TB MTFDKBA1T0TFH, IPS, 3840x2400, 16.00 | Dell Precision 5000 5680 i9-13900H, NVIDIA RTX 5000 Ada Generation Laptop GPU, 2x SK hynix PC801 HFS512GEJ9X101N RAID 0, OLED, 3840x2400, 16.00 | Lenovo ThinkPad P16 G1 RTX A5500 i9-12950HX, RTX A5500 Laptop GPU, WDC PC SN810 2TB, IPS, 3840x2400, 16.00 | MSI CreatorPro Z16P B12UKST i7-12700H, RTX A3000 Laptop GPU, Samsung PM9A1 MZVL21T0HCLR, IPS, 2560x1600, 16.00 | Asus ProArt StudioBook 16 W7600H5A-2BL2 W-11955M, RTX A5000 Laptop GPU, 2x Micron 2300 2TB MTFDHBA2T0TDV (RAID 0), OLED, 3840x2400, 16.00 | |
|---|---|---|---|---|---|---|
| Power Consumption | -24% | 28% | -9% | 22% | 18% | |
| Idle Minimum * | 15.3 | 19.5 -27% | 8 48% | 7.5 51% | 10.8 29% | 12.4 19% |
| Idle Average * | 18.2 | 29 -59% | 10.4 43% | 20.1 -10% | 16.3 10% | 16.5 9% |
| Idle Maximum * | 28 | 40.7 -45% | 30.5 -9% | 40 -43% | 16.9 40% | 25 11% |
| Load Average * | 137.9 | 142.1 -3% | 75.4 45% | 137 1% | 111.7 19% | 132 4% |
| Witcher 3 ultra * | 189.4 | 188.6 -0% | 134 29% | 208 -10% | 152.1 20% | 132 30% |
| Load Maximum * | 202 | 224.4 -11% | 175 13% | 285.9 -42% | 177.4 12% | 134 34% |
* ... smaller is better
Power Consumption Witcher 3 / Stresstest
Power Consumption external Monitor
Battery Life
General runtimes aren't any shorter than on last year's model despite the increases in CPU performance, GPU performance, and display refresh rate. We're able to record just over 7 hours of WLAN browsing on Balanced mode or almost an hour longer than on last year's Fury 16 G9.
Charging from empty to full capacity with the included AC adapter takes just under 90 minutes. The system can also be charged via third-party USB-C adapters albeit more slowly.
| HP ZBook Fury 16 G10 i9-13950HX, NVIDIA RTX 5000 Ada Generation Laptop GPU, 95 Wh | HP ZBook Fury 16 G9 i9-12950HX, RTX A5500 Laptop GPU, 95 Wh | Dell Precision 5000 5680 i9-13900H, NVIDIA RTX 5000 Ada Generation Laptop GPU, 98 Wh | Lenovo ThinkPad P16 G1 RTX A5500 i9-12950HX, RTX A5500 Laptop GPU, 94 Wh | MSI CreatorPro Z16P B12UKST i7-12700H, RTX A3000 Laptop GPU, 90 Wh | Asus ProArt StudioBook 16 W7600H5A-2BL2 W-11955M, RTX A5000 Laptop GPU, 90 Wh | |
|---|---|---|---|---|---|---|
| Battery Runtime | -17% | 36% | -20% | -20% | -31% | |
| WiFi v1.3 | 435 | 360 -17% | 592 36% | 350 -20% | 348 -20% | 301 -31% |
| Reader / Idle | 319 | 1072 | ||||
| Load | 71 | 101 | ||||
| H.264 | 106 | |||||
| Witcher 3 ultra | 94 |
Pros
Cons
Verdict — The HP Workstation To Get For Graphics Hunters
Sometimes the year-over-year processor updates can be relatively minor. Other times, however, they can be quite significant. The ZBook Fury 16 G10 falls into the latter category as its 13th gen CPU and Nvidia RTX Ada GPU options can offer sizable boosts in performance over the ZBook Fury 16 G9 especially when it comes to graphics. If you value ECC RAM and maximizing GPU power with higher TGP limits, then the Fury 16 G10 is absolutely worth considering over any other 16-inch workstation at the moment including the Precision 5680 which comes with the same GPU options but at lower TGP targets.
The ZBook Fury 16 G10 maximizes GPU power to be one of the fastest mobile workstations when it comes to graphics. However, this seems to come at the cost of SSD and CPU performance.
A couple of issues hold back the HP from being "perfect". SSD throttling still occurs while the CPU is slower than expected even when set to Performance mode. These would be easier to forgive on slimmer or smaller workstations, but the Fury 16 G10 is anything but thin-and-light.
Price and Availability
HP is now shipping its ZBook Fury 16 G10 starting at $2700 USD for the base configuration up to over $4200 when fully configured with Core i9 and RTX 5000 Ada.
HP ZBook Fury 16 G10
-
09/23/2023 v7
Allen Ngo
More articles related to this device
HP ZBook Fury 16 G10 (ZBook Fury 16 Series)Related Articles


Transparency
The present review sample was made available to the author as a loan by the manufacturer or a shop for the purposes of review. The lender had no influence on this review, nor did the manufacturer receive a copy of this review before publication. There was no obligation to publish this review.
Pricecompare
