 Deutsch
 English
 Español
 Français
 Italiano
 Nederlands
 Polski
 Português
 Русский
 Türkçe
 Svenska
 Chinese
 Magyar
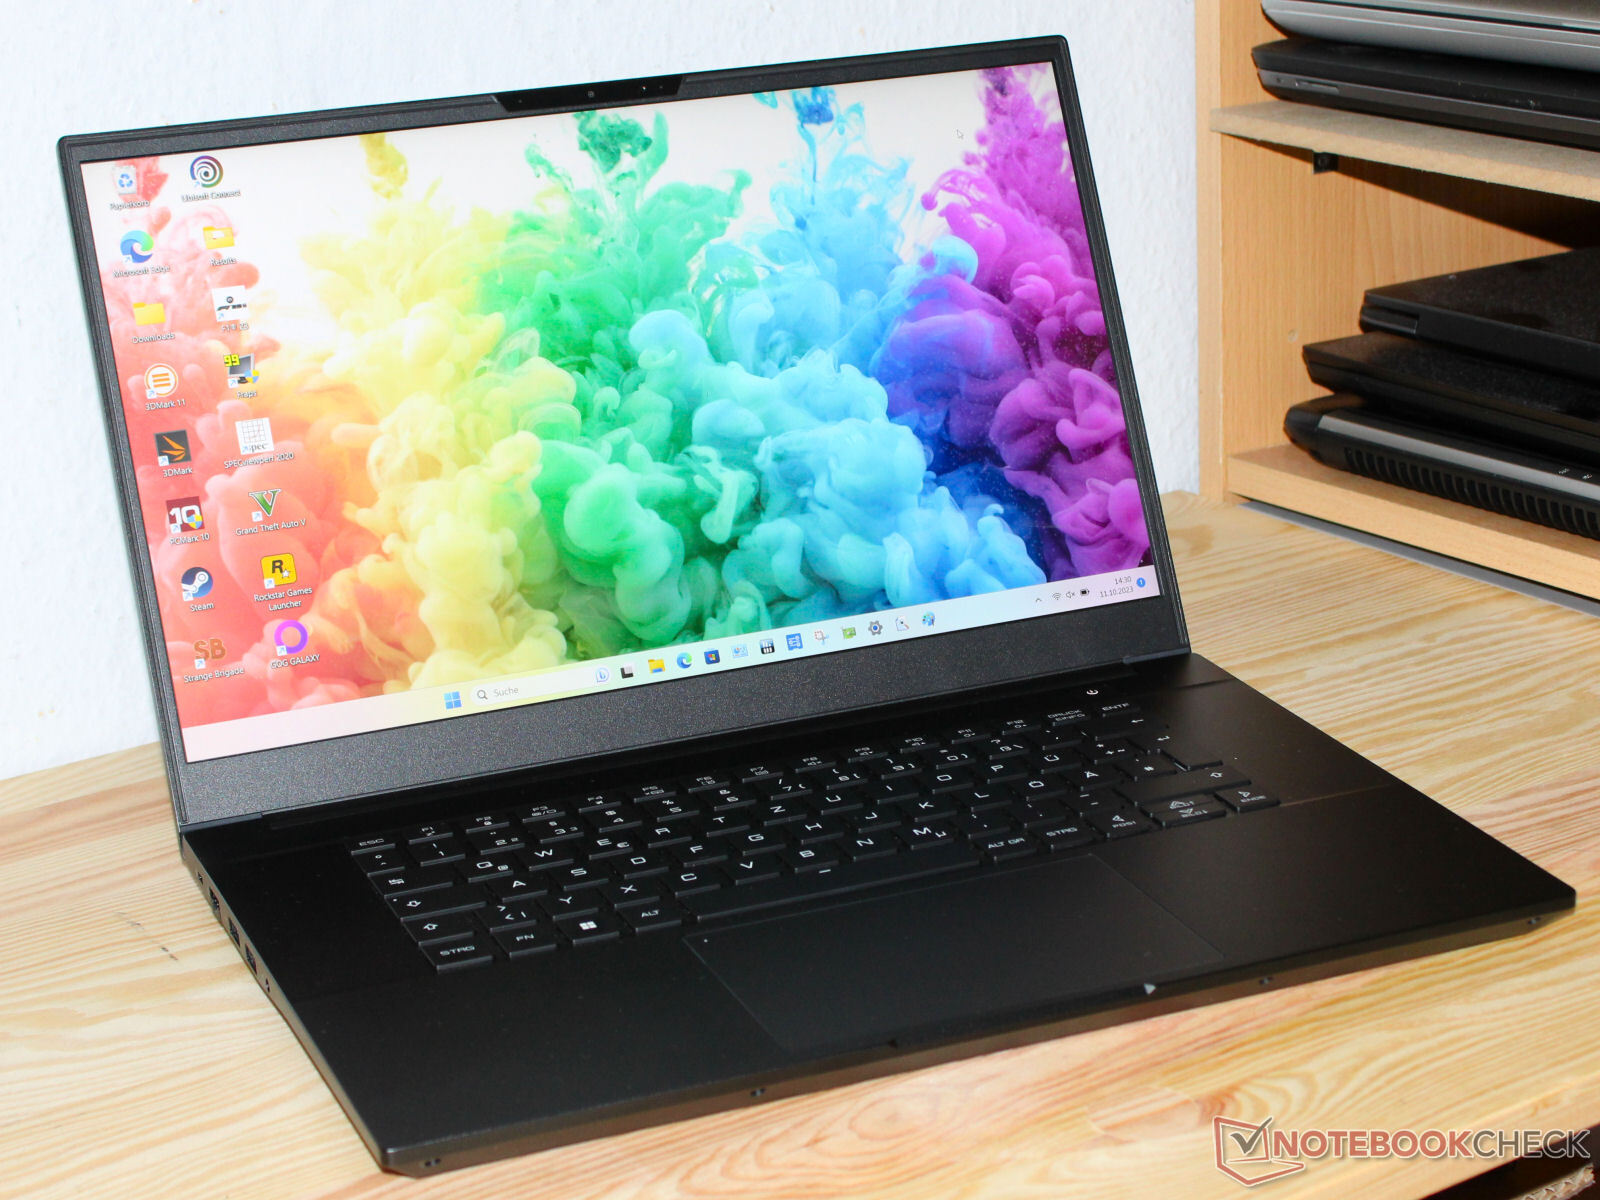
Intel NUC X15 LAPAC71H review: The multimedia laptop with an Intel Arc A730M from US$1,050
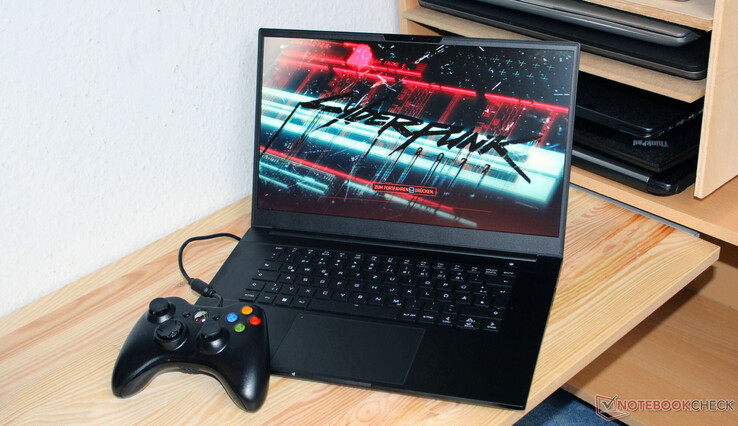
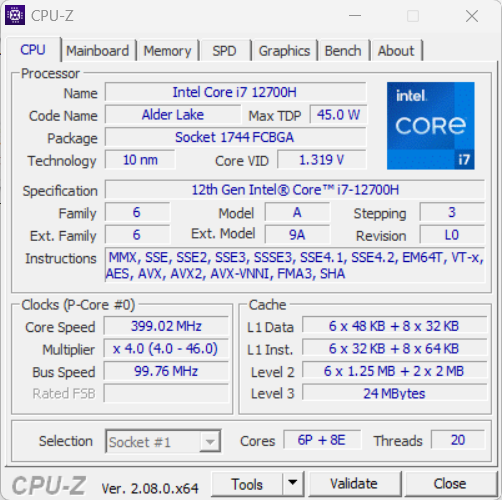
After being announced for fall 2022, the Intel NUC X15 - a laptop for gamers and creators - finally sees the light of day a year later. This should mostly be a case of getting rid of goods: The X15 as well as the NUC series as a whole has already been discontinued by Intel. The Schenker distributed laptop's Core i7-12700H, Arc A730M and FHD panel are set, whereas its RAM and SSD(s) can be selected.
Competitors include devices such as the Asus TUF A15 FA507, Gigabyte G5 KE, MSI Cyborg 15 A12VF, Dell Inspiron 16 Plus 7630 and the Asus VivoBook Pro 16.
Possible competitors compared
Rating | Date | Model | Weight | Height | Size | Resolution | Best Price |
|---|---|---|---|---|---|---|---|
| 84.4 % | 10/2023 | Intel NUC X15 LAPAC71H i7-12700H, A730M | 2.2 kg | 26.7 mm | 15.60" | 1920x1080 | |
| 86.3 % | 06/2023 | Asus TUF A15 FA507 R7 7735HS, NVIDIA GeForce RTX 4050 Laptop GPU | 2.2 kg | 24.9 mm | 15.60" | 1920x1080 | |
| 81.8 % | 04/2023 | Gigabyte G5 KE i5-12500H, GeForce RTX 3060 Laptop GPU | 2 kg | 23.9 mm | 15.60" | 1920x1080 | |
| 87.1 % | 08/2023 | Dell Inspiron 16 Plus 7630 i7-13700H, NVIDIA GeForce RTX 4060 Laptop GPU | 2.2 kg | 19.95 mm | 16.00" | 2560x1600 | |
| 86.3 % | 05/2023 | Asus VivoBook Pro 16 i7-12700H, GeForce RTX 3050 Ti Laptop GPU | 1.9 kg | 20 mm | 16.00" | 2560x1600 | |
| 82.4 % | 04/2023 | MSI Cyborg 15 A12VF i7-12650H, NVIDIA GeForce RTX 4060 Laptop GPU | 2 kg | 22.9 mm | 15.60" | 1920x1080 |
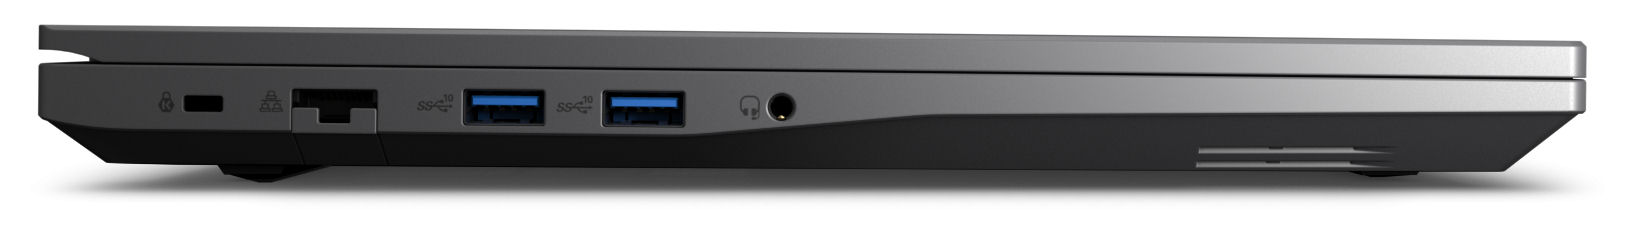
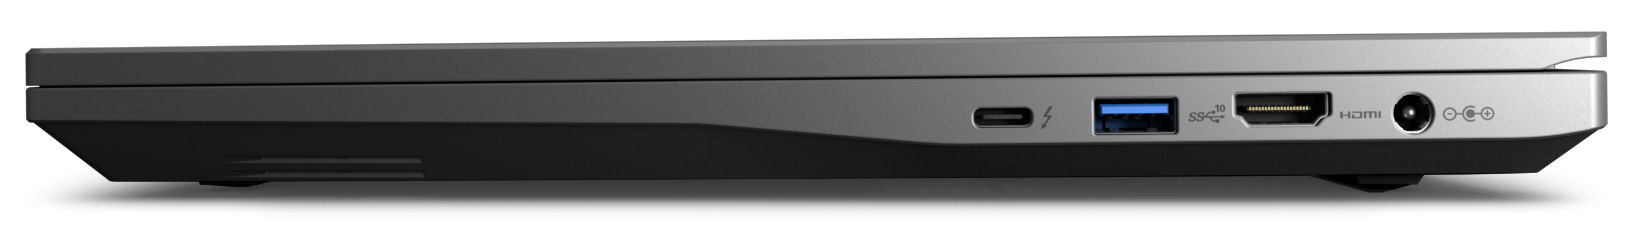
Case & connectivity - The Intel NUC features Thunderbolt 4
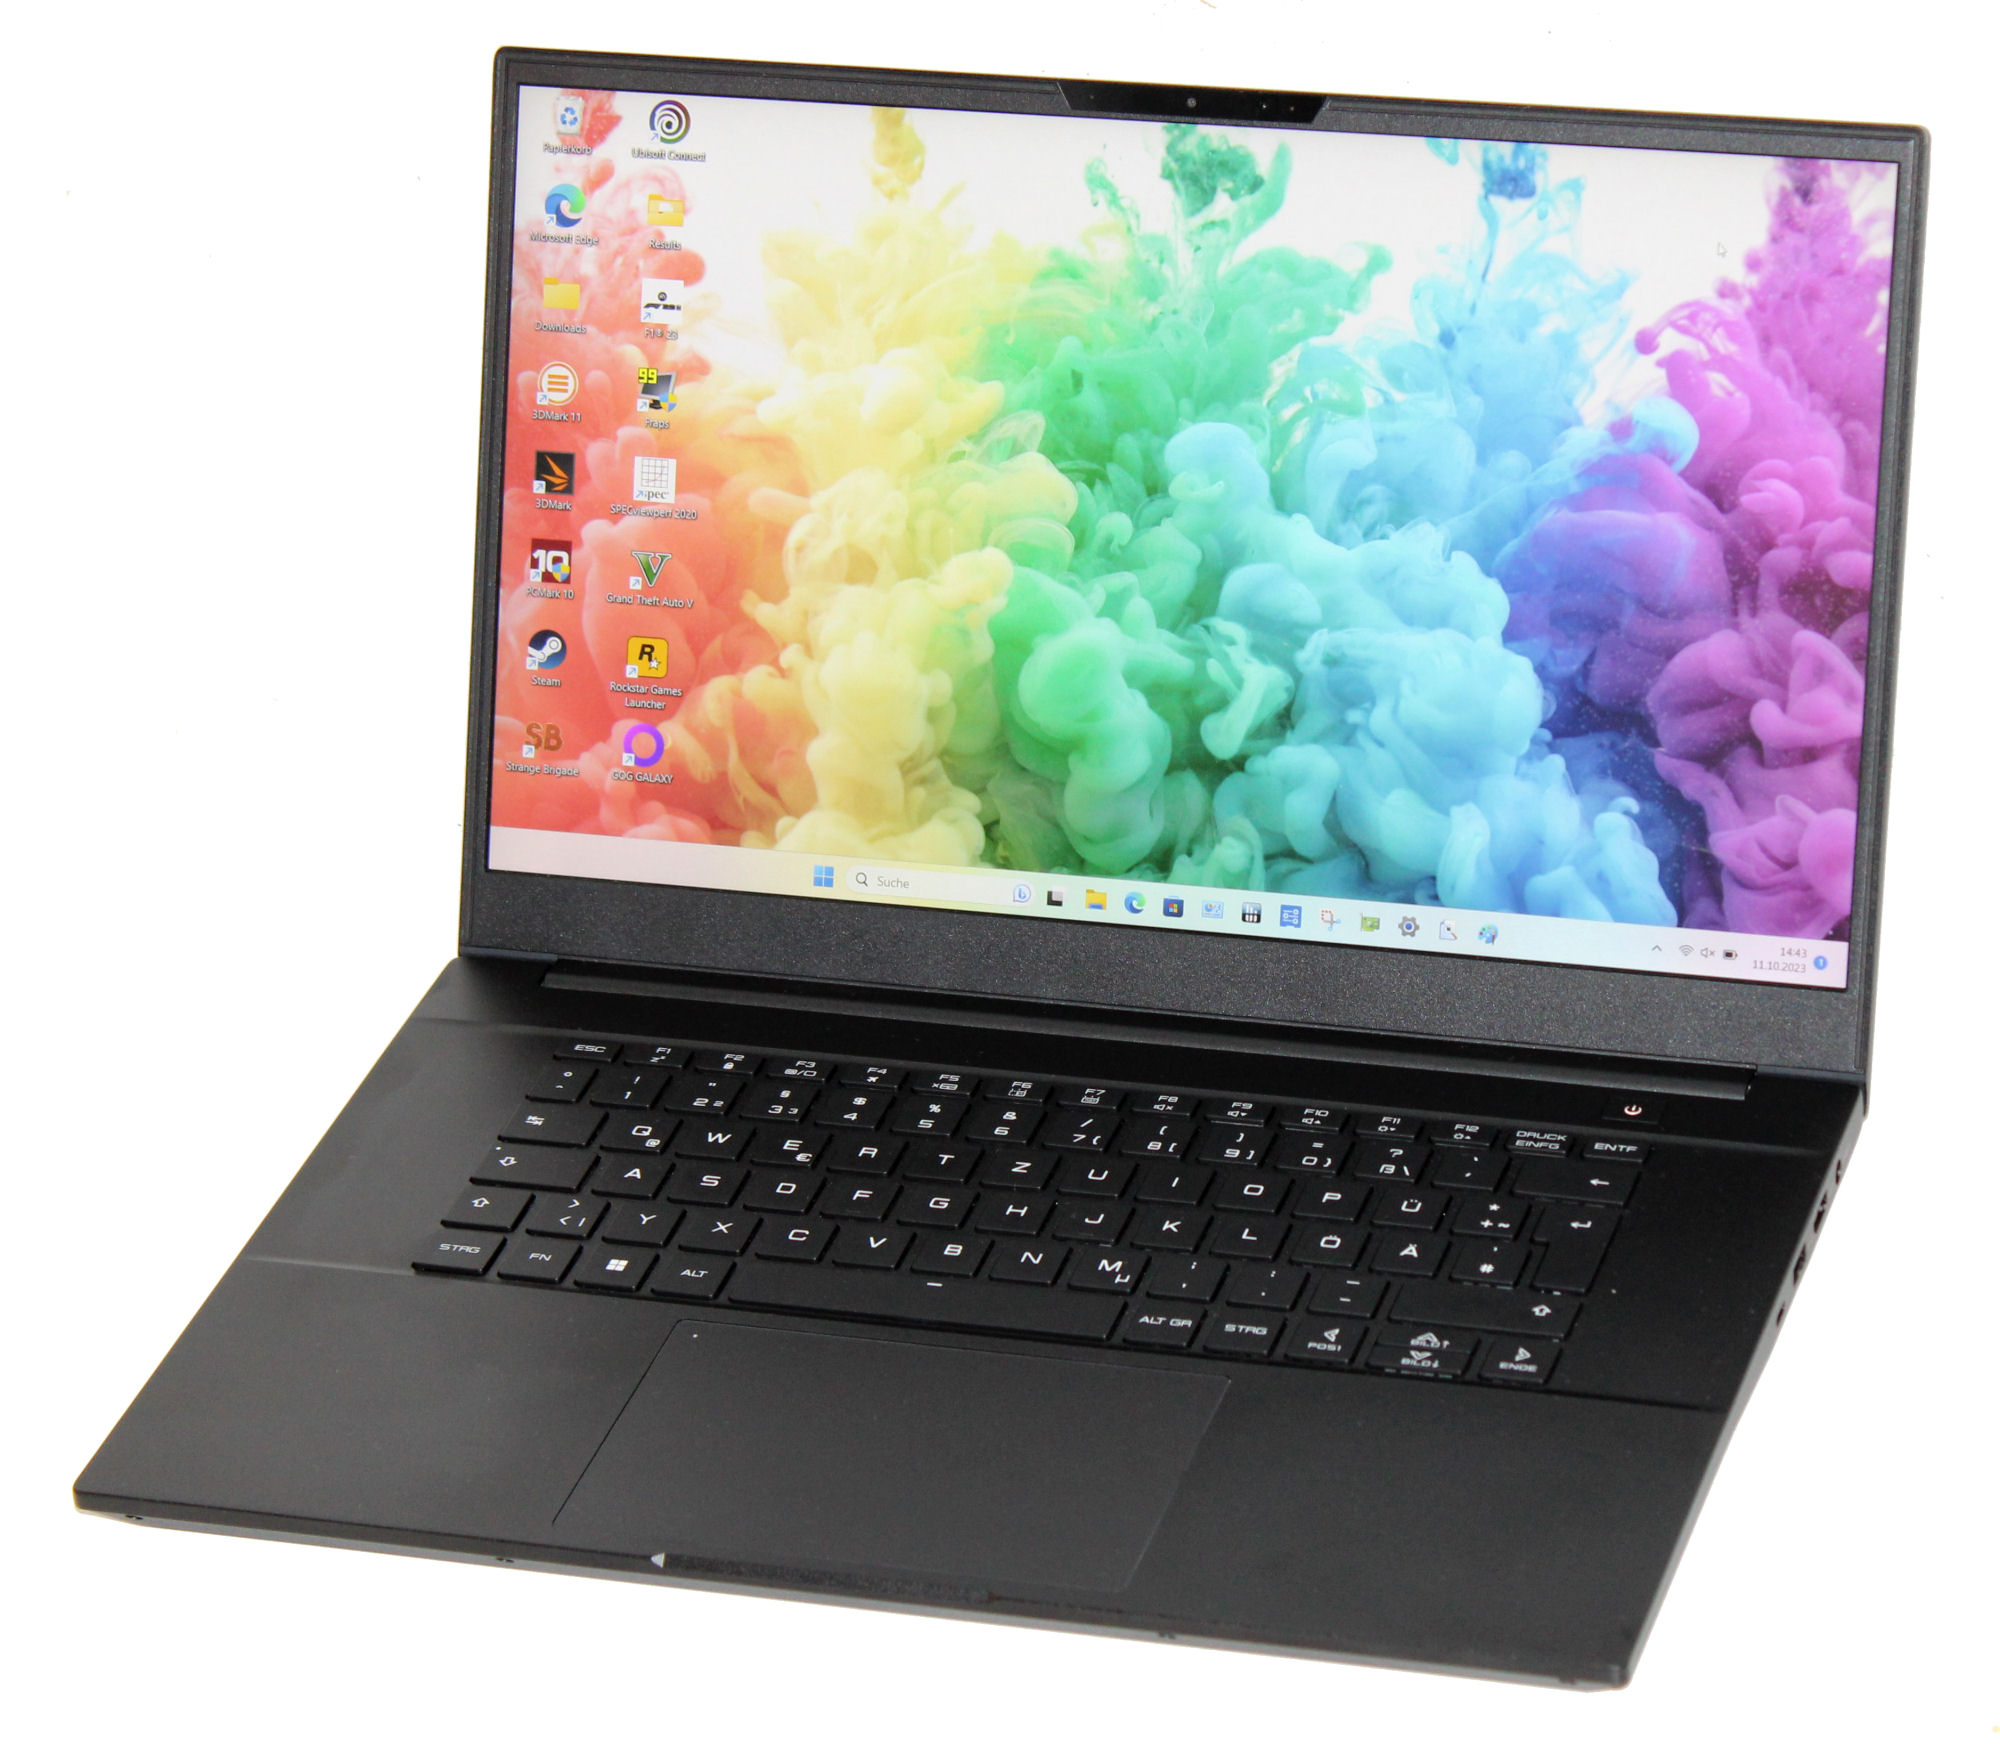
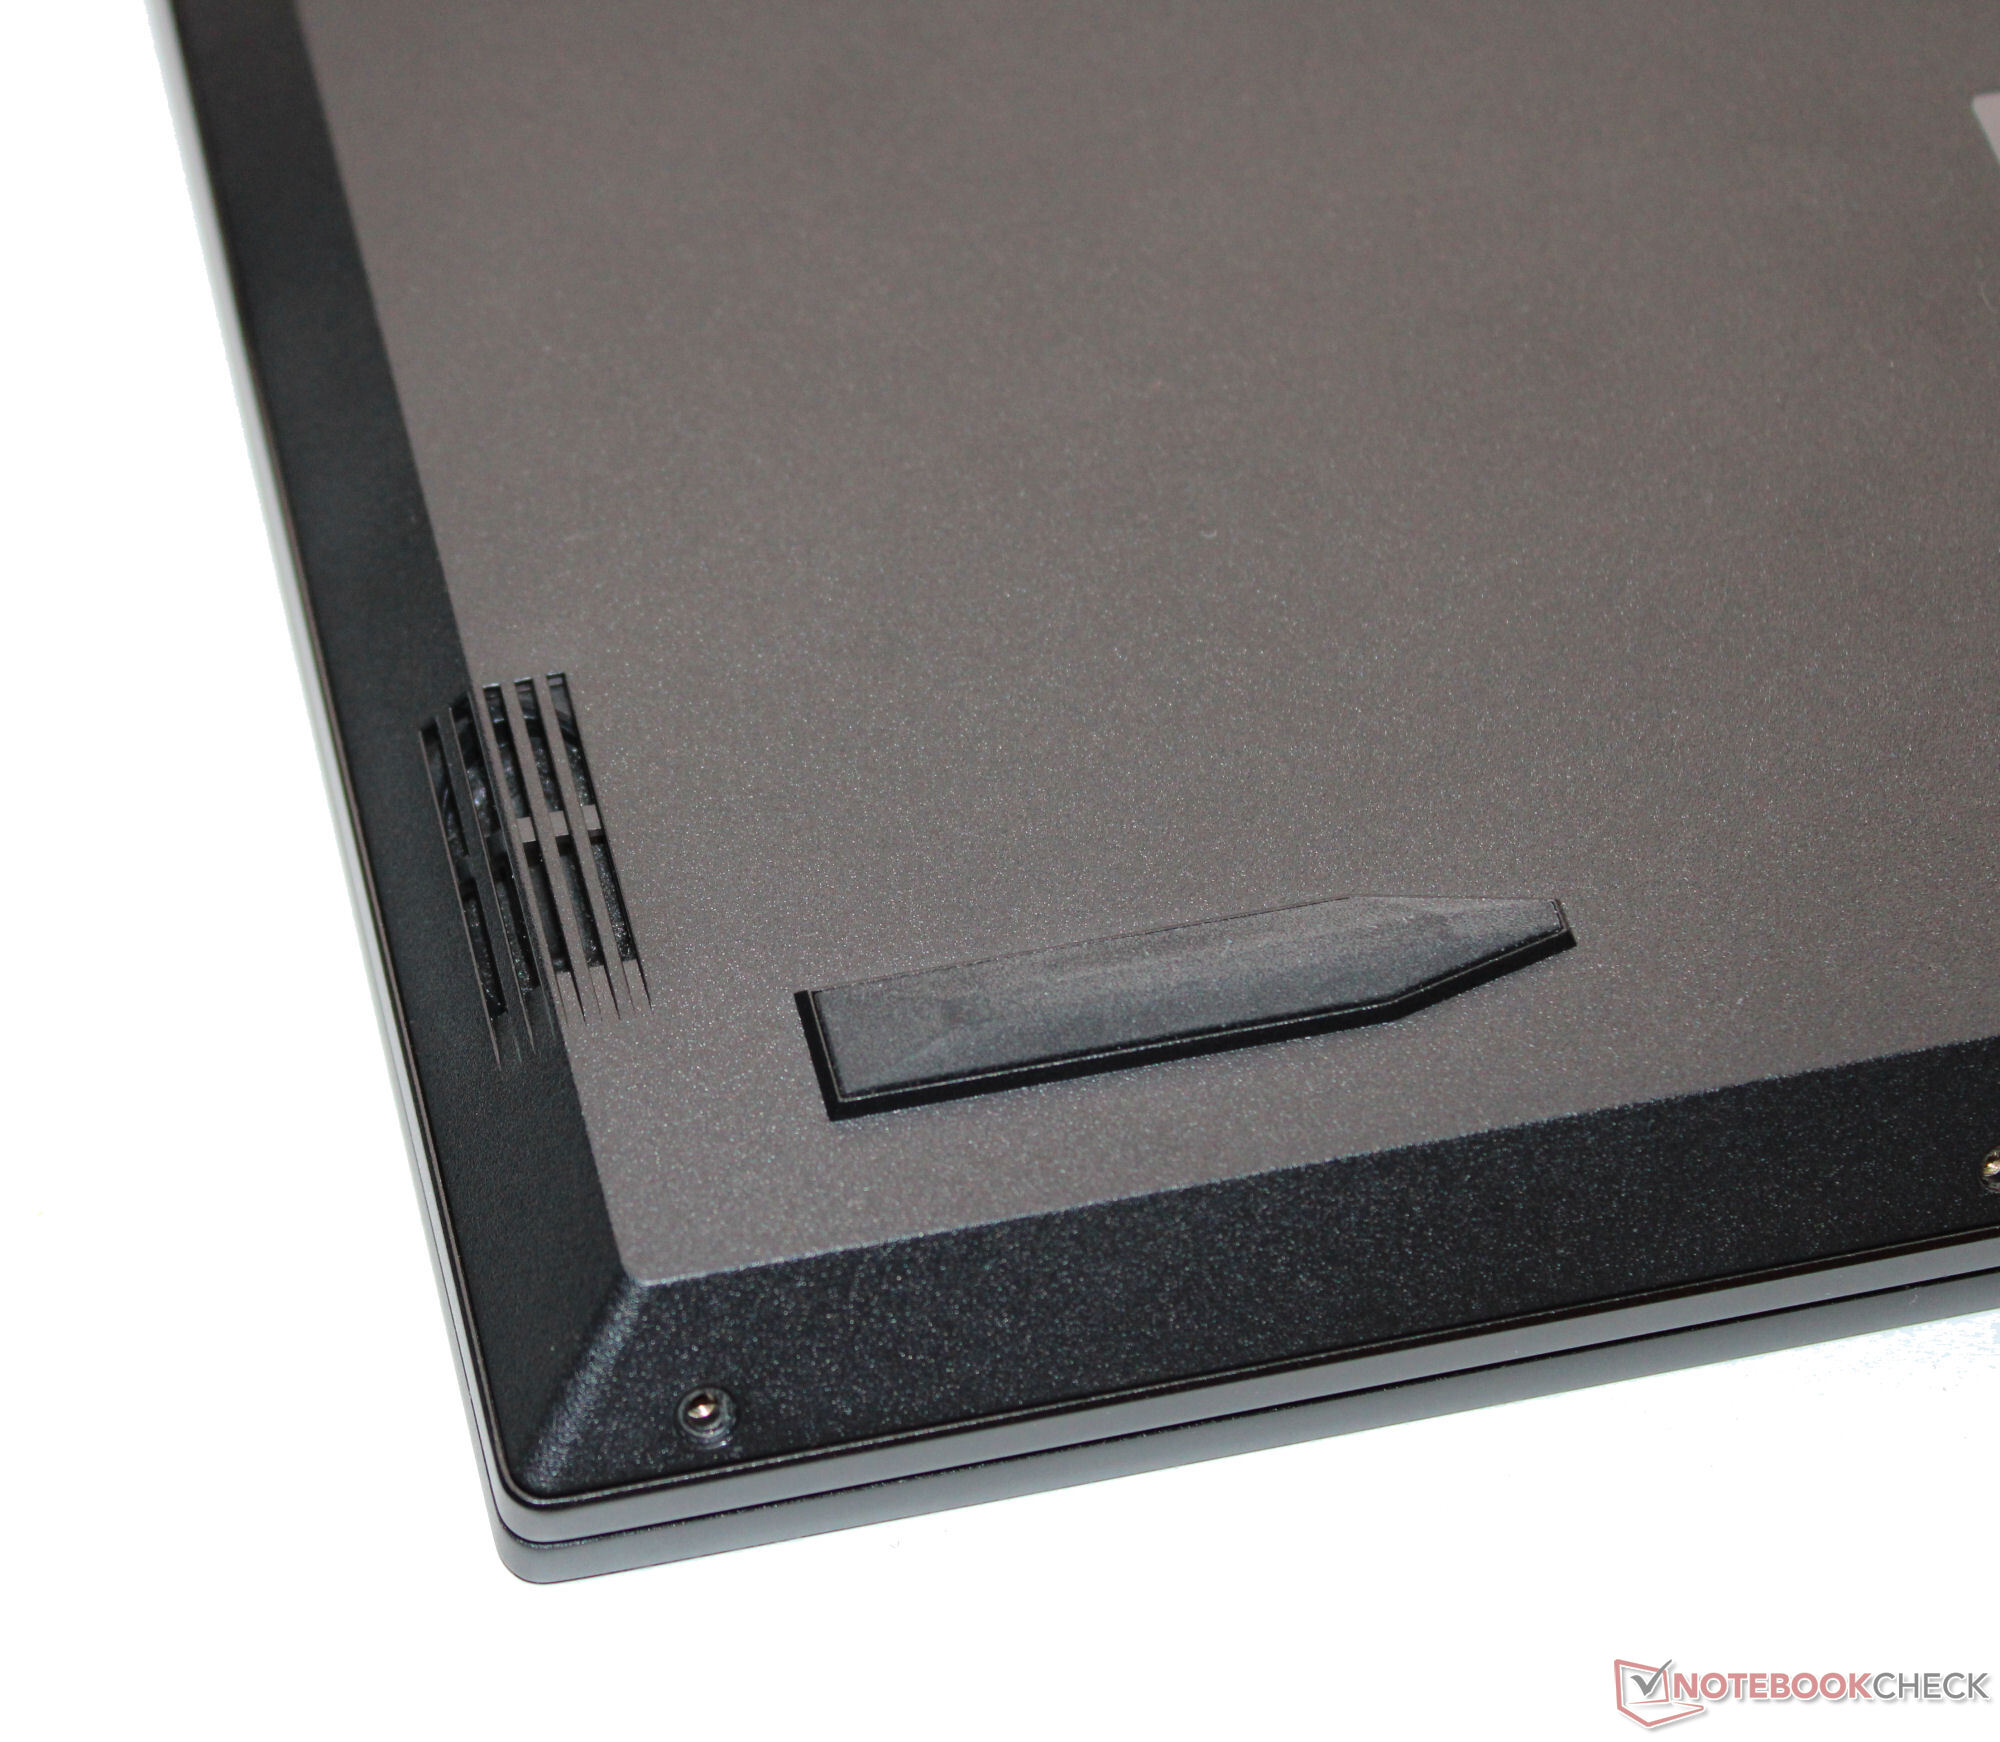
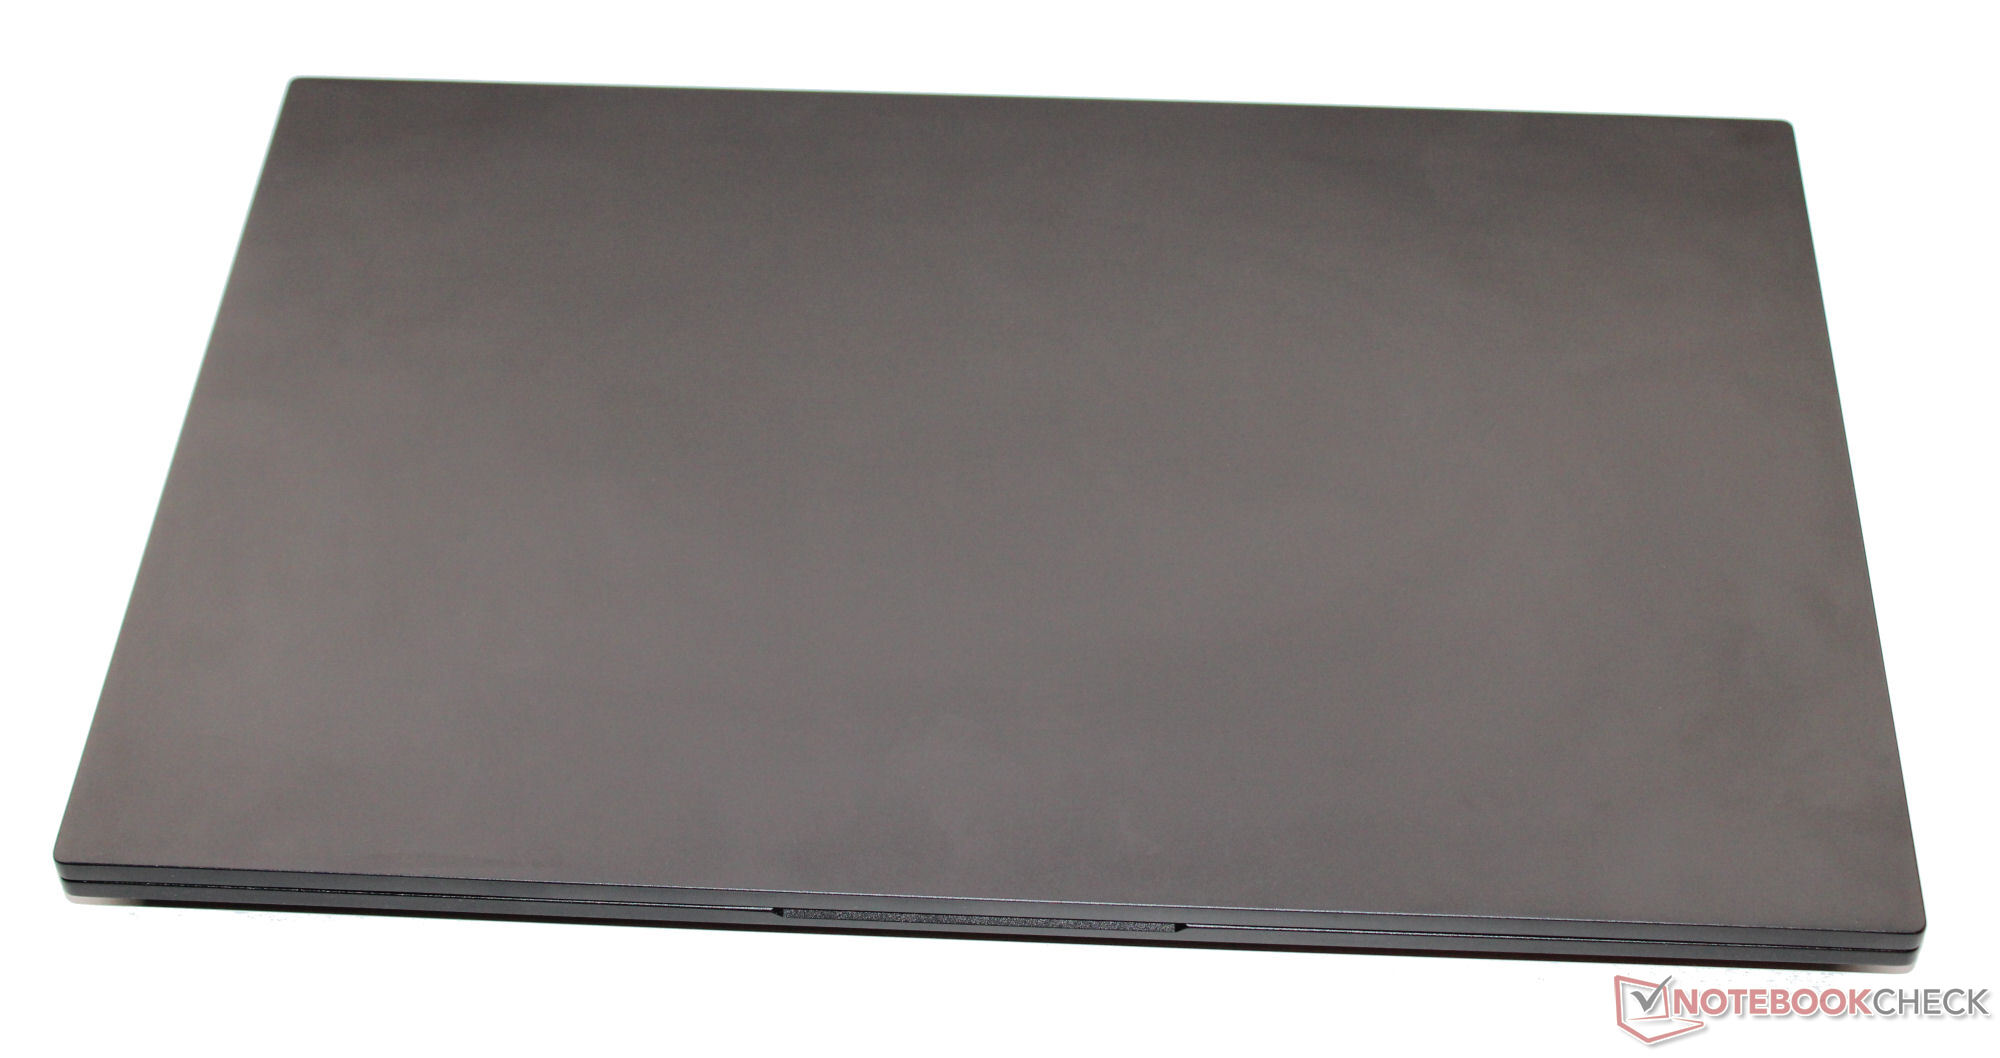
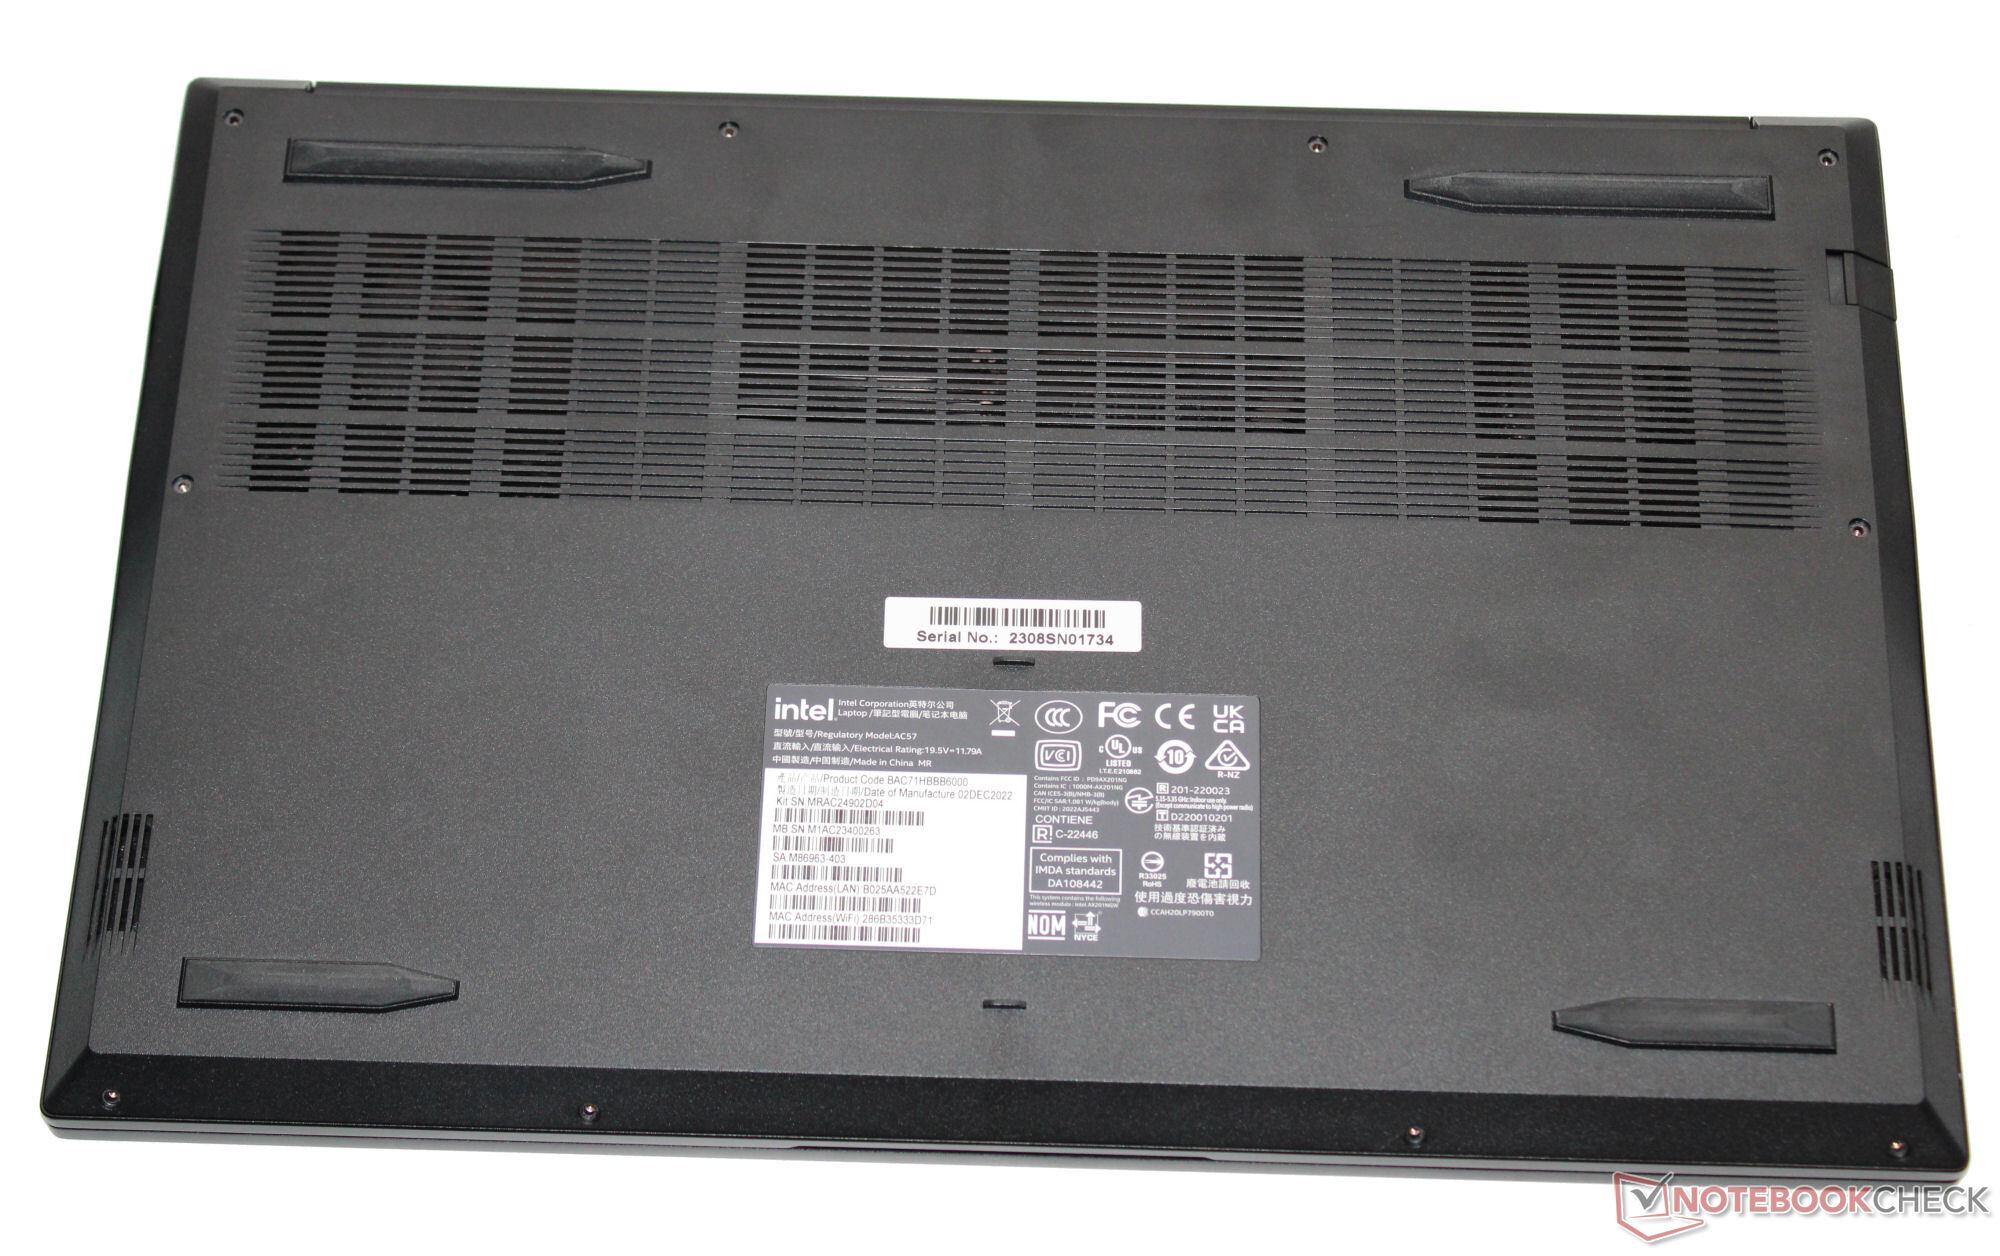
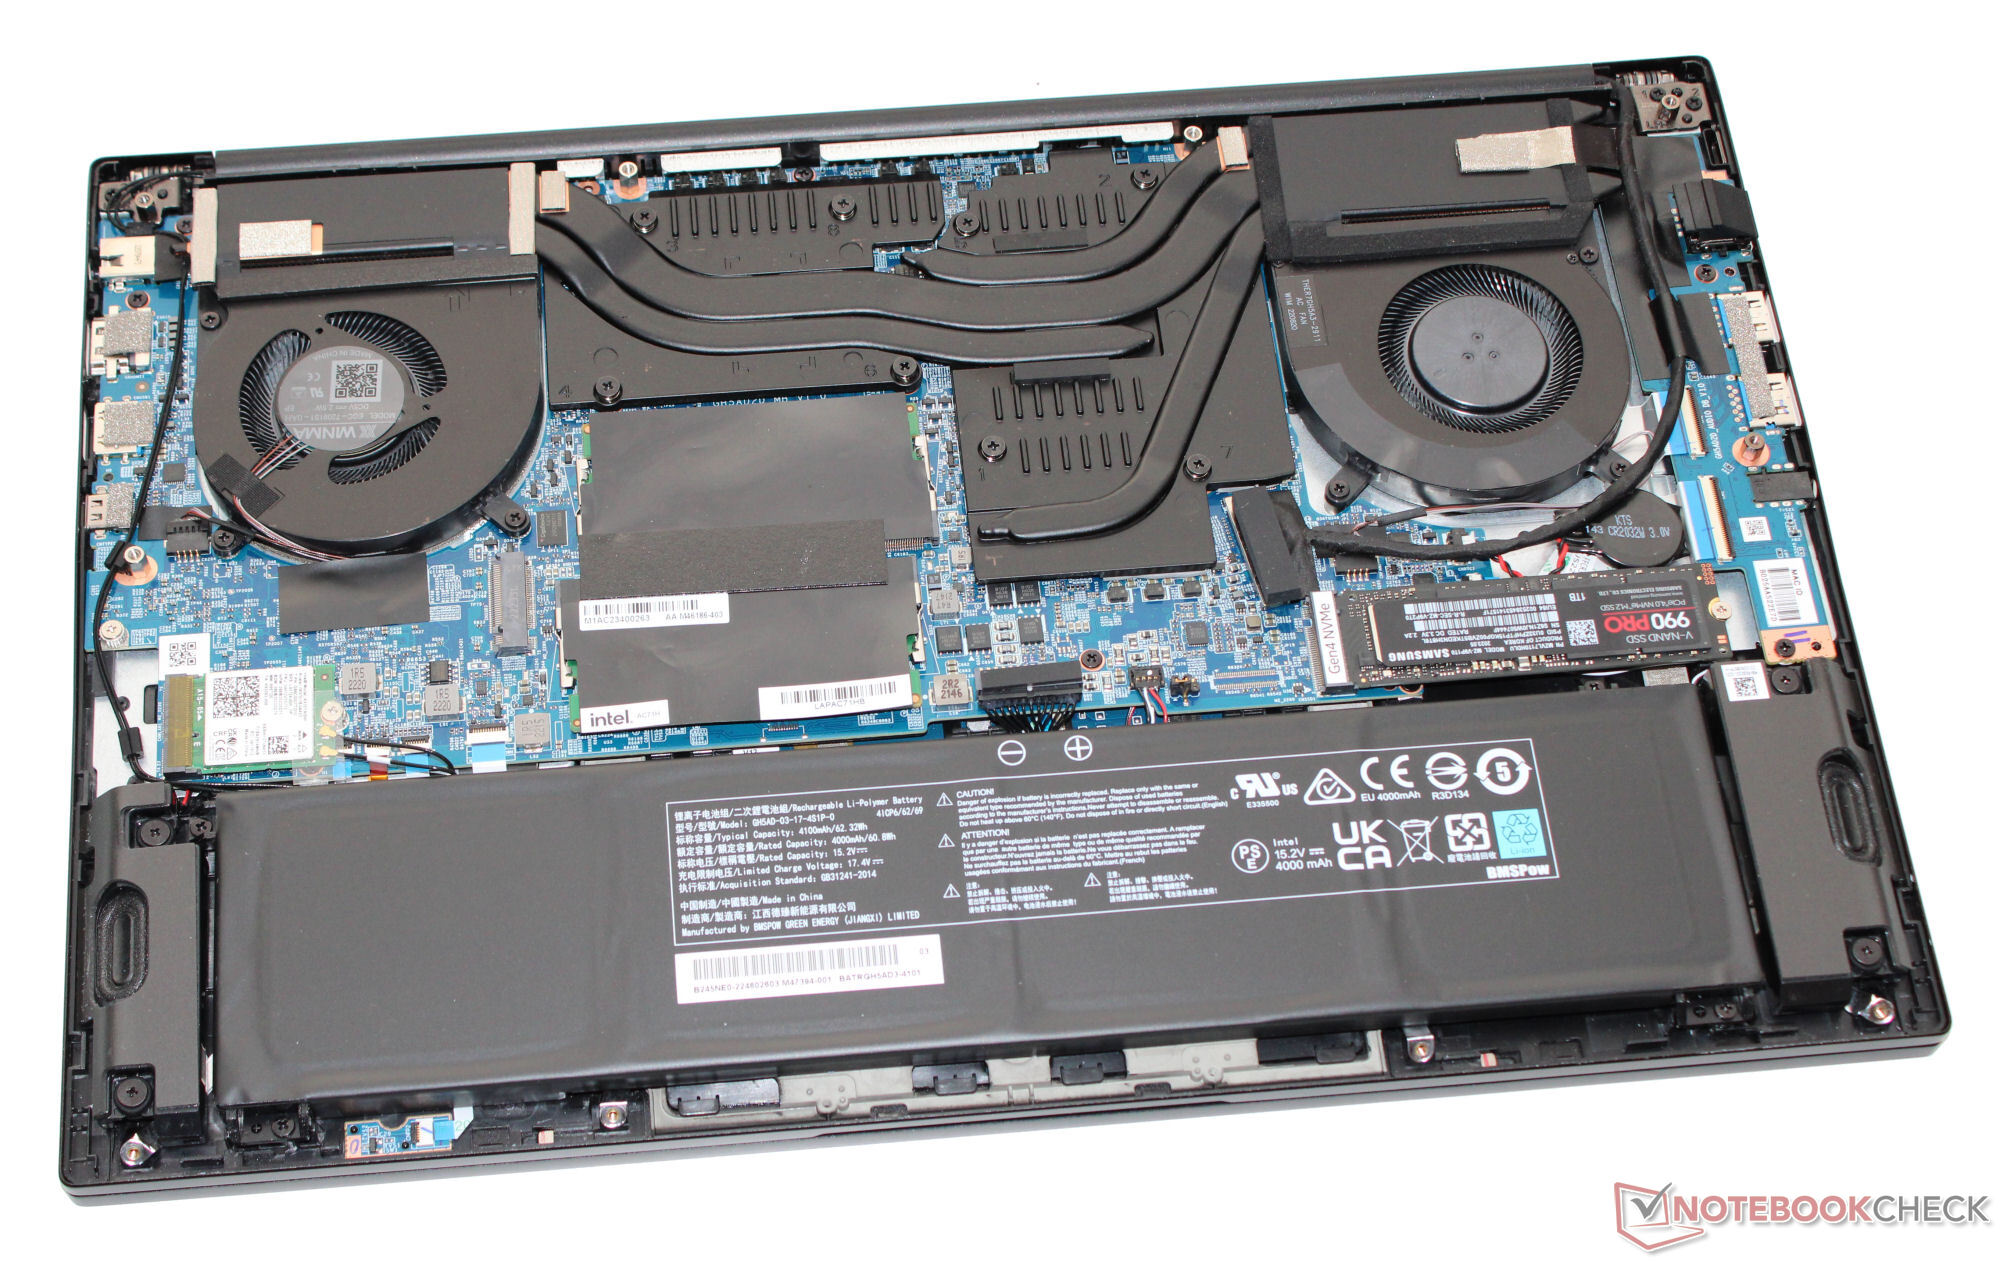
The back of the lid and the top part of the matte black case are made from aluminium, and the bottom of the display frame is made from plastic. We didn't note any build issues. Intel relies on a sleek, stripped-back case which shouldn't draw too much attention to itself in professional surroundings. After disassembling the bottom part of the case, you can access the battery (screwed in, not glued on) as well as the rest of the laptop's innards.
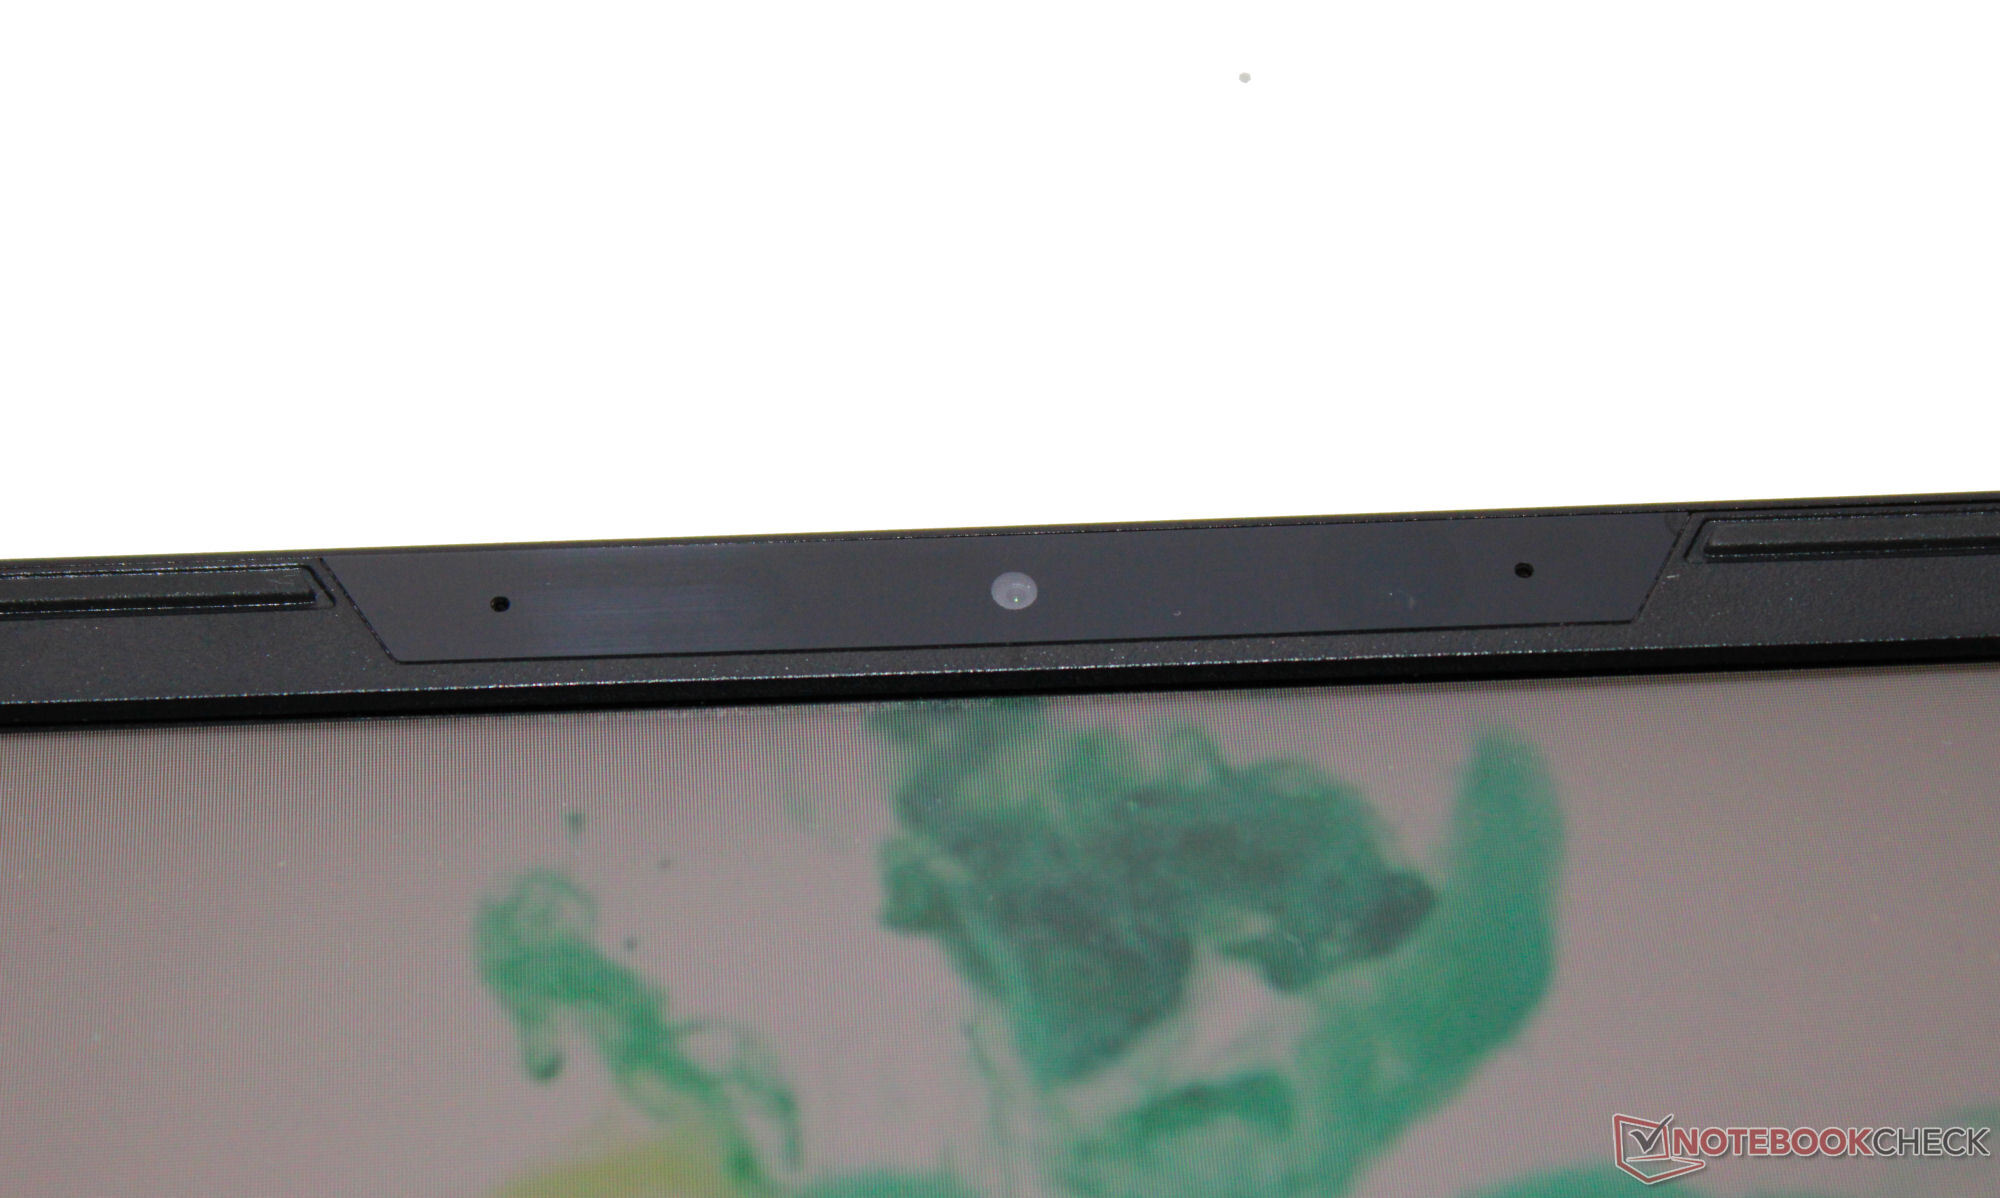
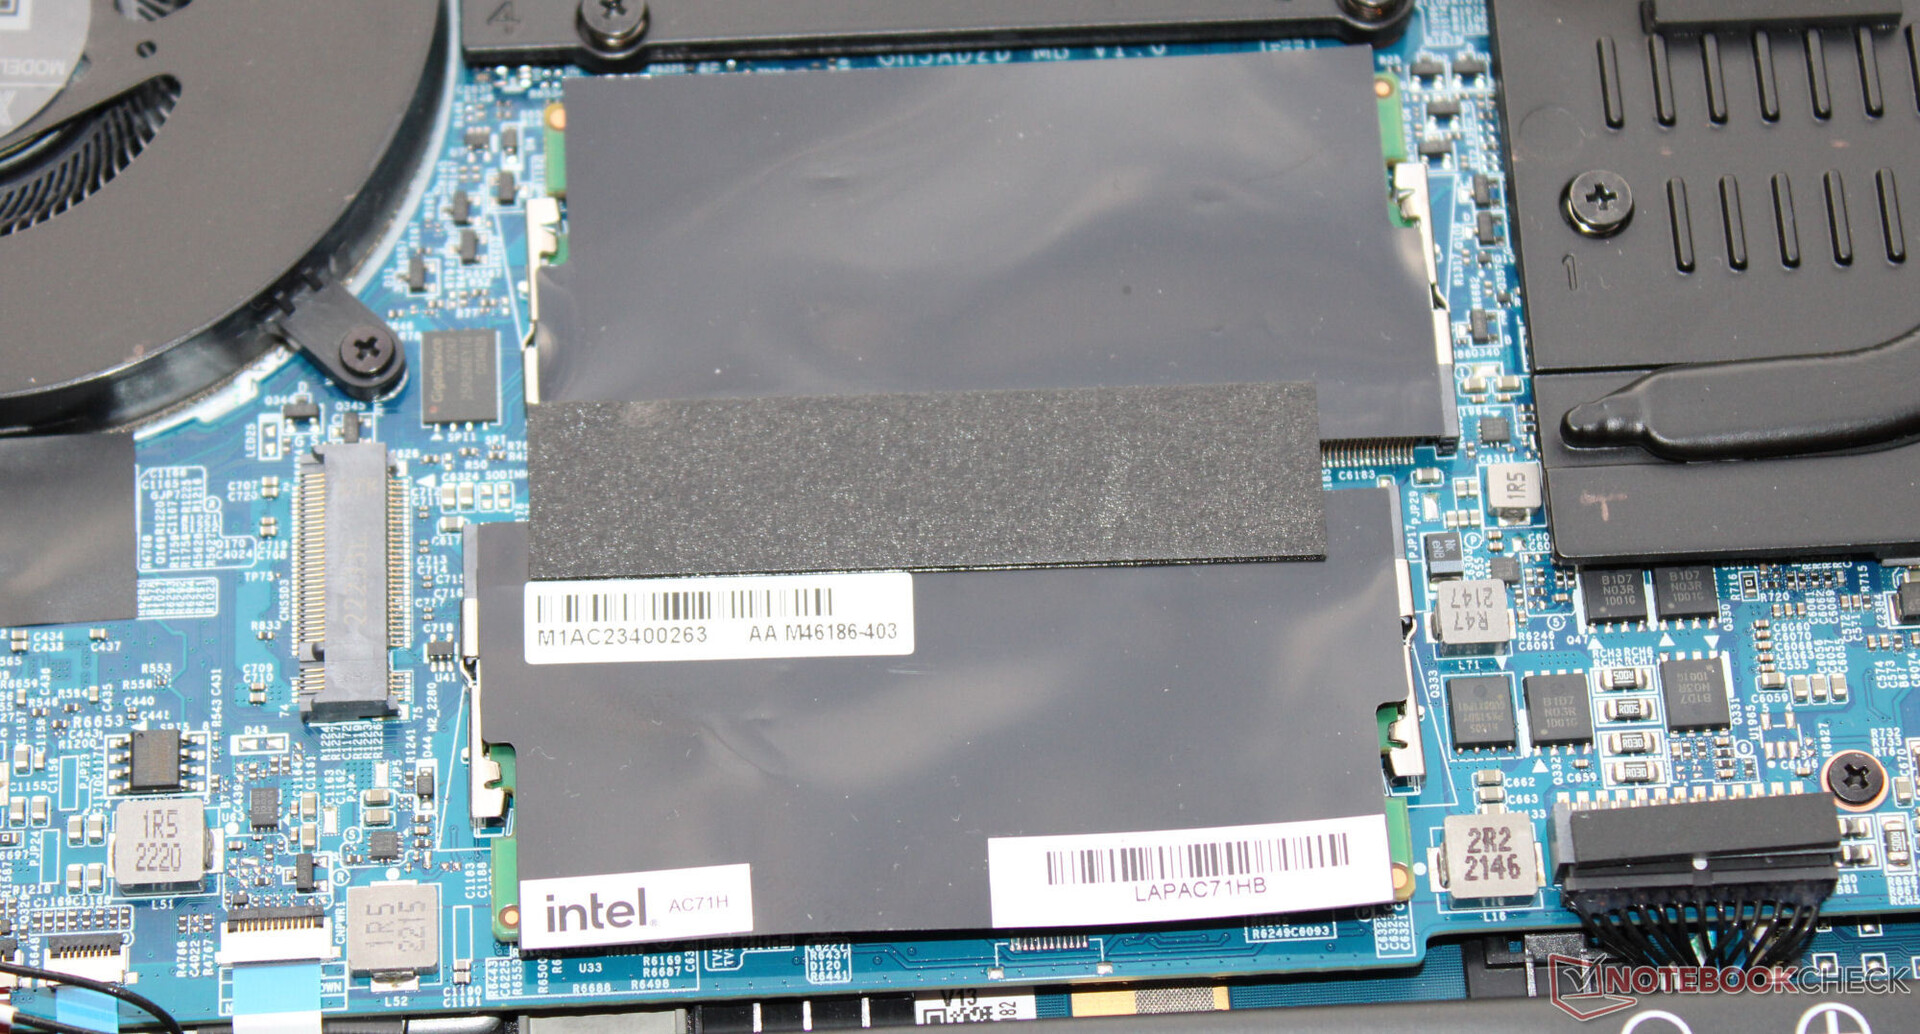
The LAPAC71H features three USB-A ports (USB 3.2 Gen 1) and one USB-C port (Thunderbolt 4/USB 4). The latter doesn't support Power Delivery but it can output a DisplayPort signal. In total, the laptop has two video outputs (1x HDMI, 1x DP). Intel hasn't given the device an SD card reader. Its webcam (0.9 MP, max. 1,280 x 720 pixels, no cover) delivers pretty standard results.
Under optimum conditions (no WiFi devices in close vicinity, short distance between laptop and server PC), it can achieve excellent WiFi data rates. The laptop uses a WiFi 6E chip (Intel AX201). Wired connections are also taken care of by an Intel controller (I225-V; 2.5 GBit/s).
| Networking | |
| iperf3 transmit AXE11000 | |
| Gigabyte G5 KE | |
| MSI Cyborg 15 A12VF | |
| Intel NUC X15 LAPAC71H | |
| Asus VivoBook Pro 16 | |
| Average Intel Wi-Fi 6 AX201 (438 - 1715, n=59) | |
| Average of class Multimedia (358 - 1648, n=57, last 2 years) | |
| Dell Inspiron 16 Plus 7630 | |
| Asus TUF A15 FA507 | |
| iperf3 receive AXE11000 | |
| Gigabyte G5 KE | |
| MSI Cyborg 15 A12VF | |
| Intel NUC X15 LAPAC71H | |
| Average Intel Wi-Fi 6 AX201 (390 - 1734, n=64) | |
| Average of class Multimedia (701 - 1740, n=59, last 2 years) | |
| Dell Inspiron 16 Plus 7630 | |
| Asus TUF A15 FA507 | |
| iperf3 transmit AXE11000 6GHz | |
| Dell Inspiron 16 Plus 7630 | |
| Average of class Multimedia (944 - 1822, n=31, last 2 years) | |
| Average Intel Wi-Fi 6 AX201 (745 - 1252, n=3) | |
| iperf3 receive AXE11000 6GHz | |
| Asus VivoBook Pro 16 | |
| Average of class Multimedia (920 - 1803, n=31, last 2 years) | |
| Dell Inspiron 16 Plus 7630 | |
| Average Intel Wi-Fi 6 AX201 (390 - 1670, n=3) | |


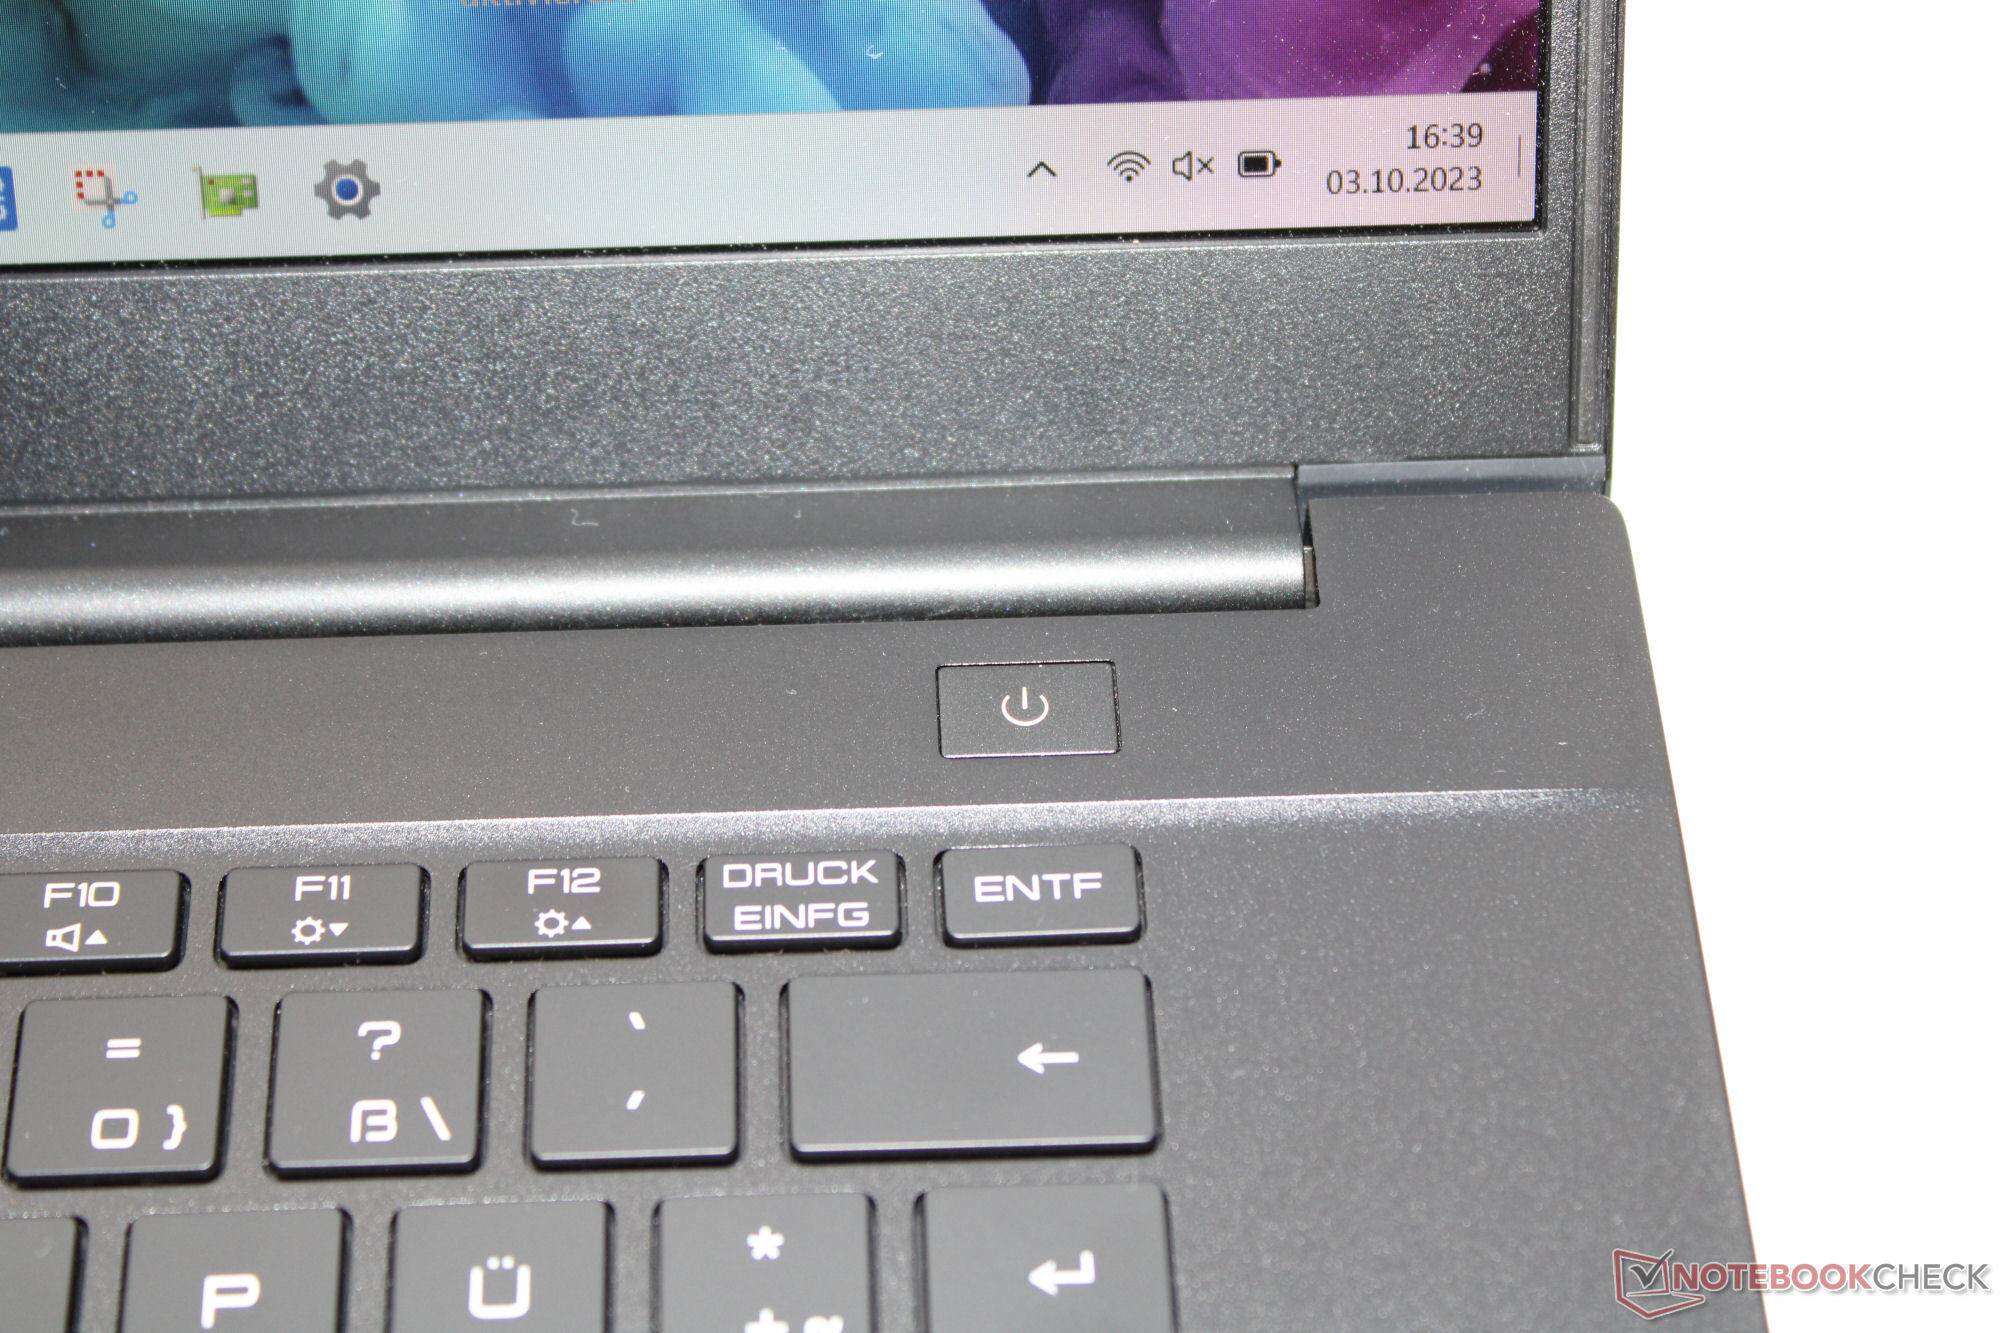
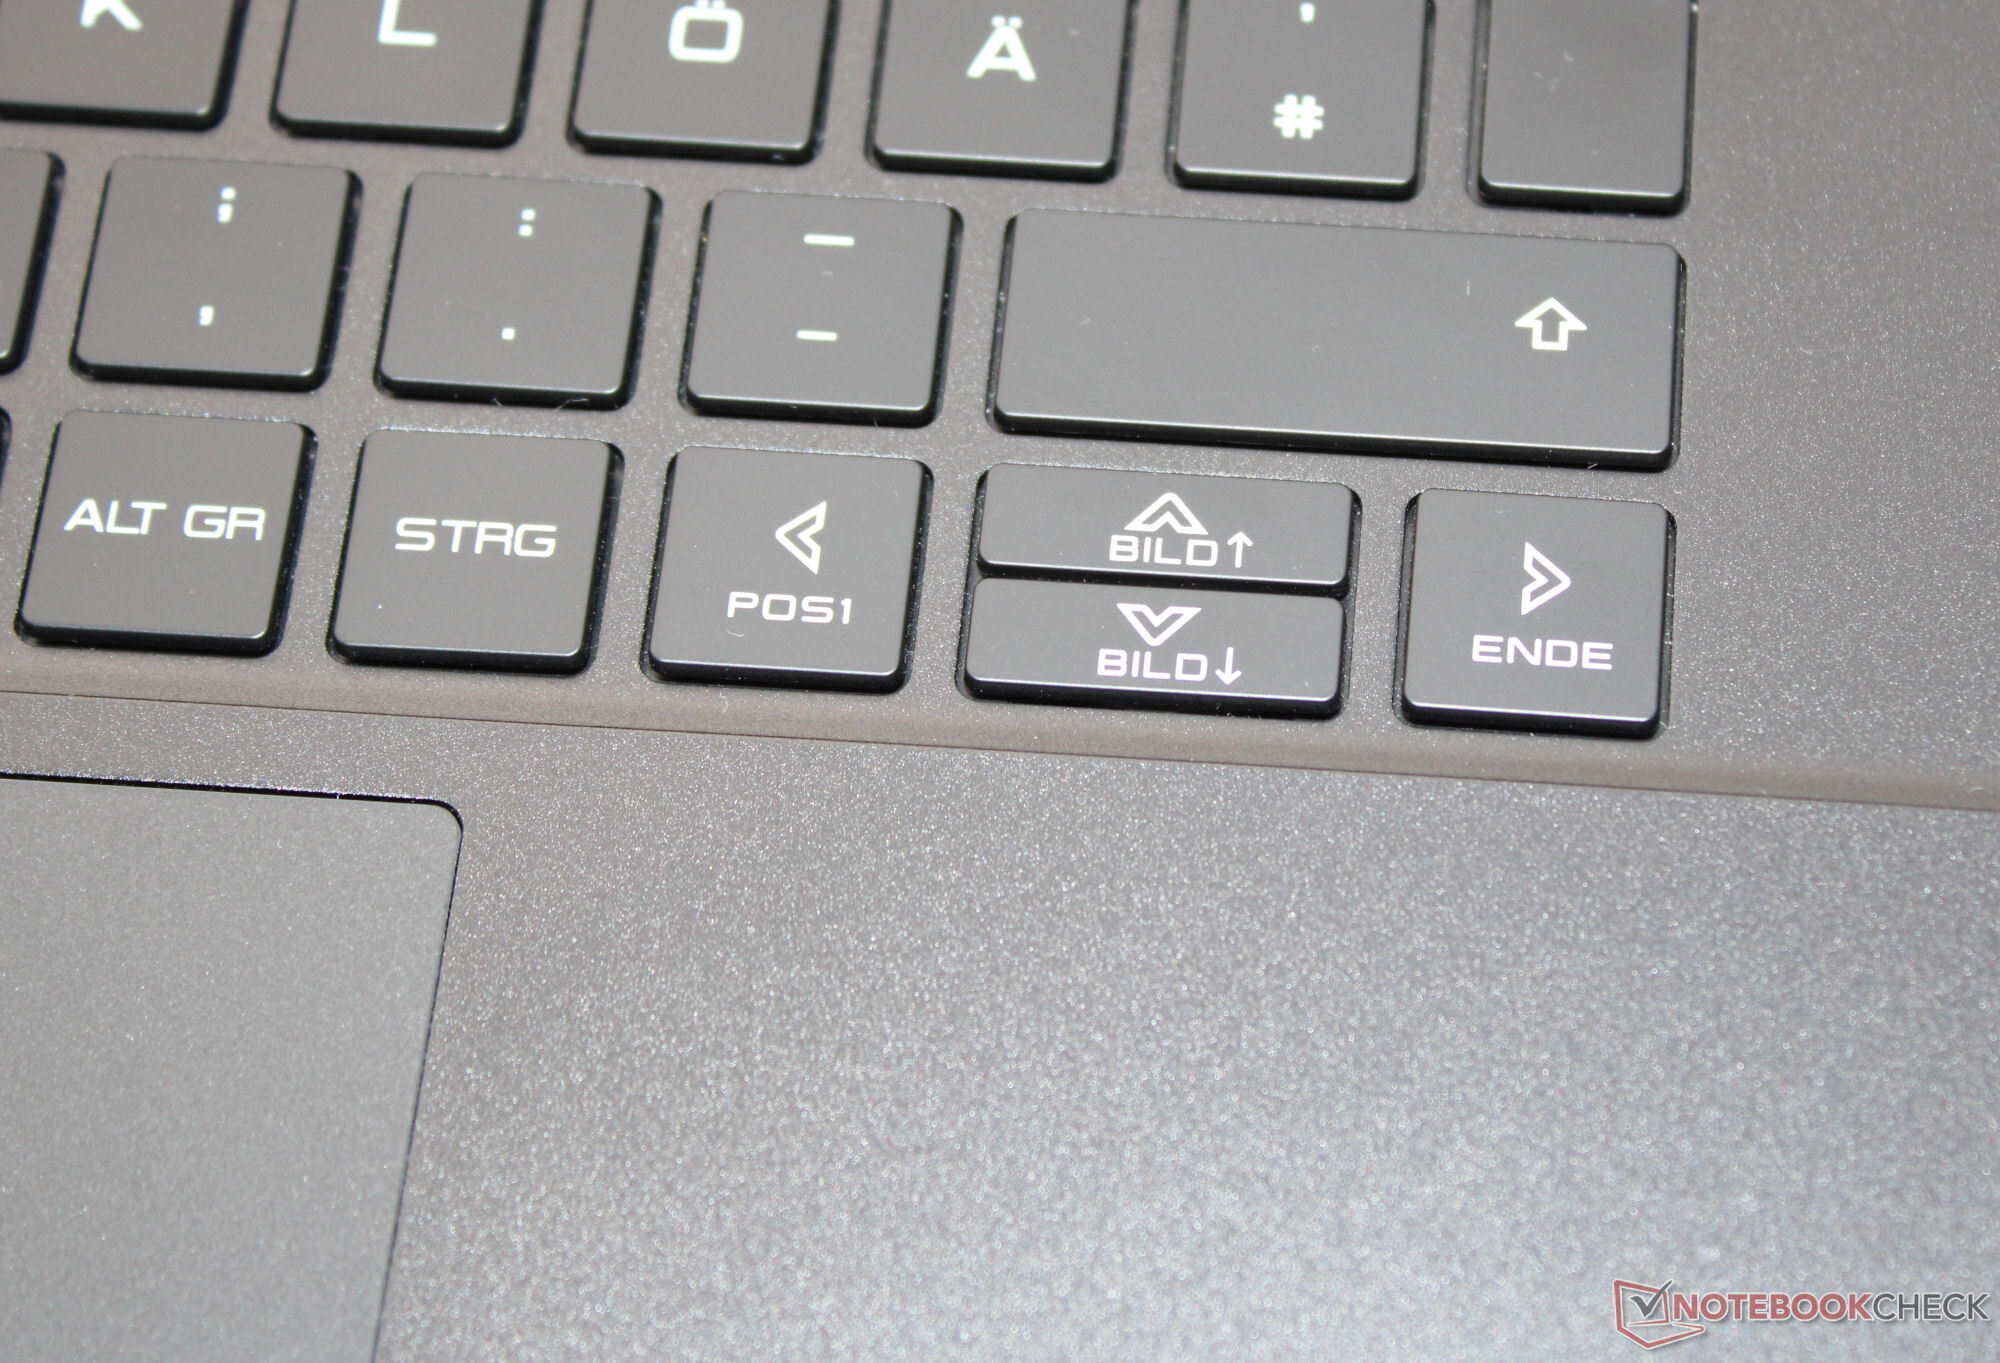
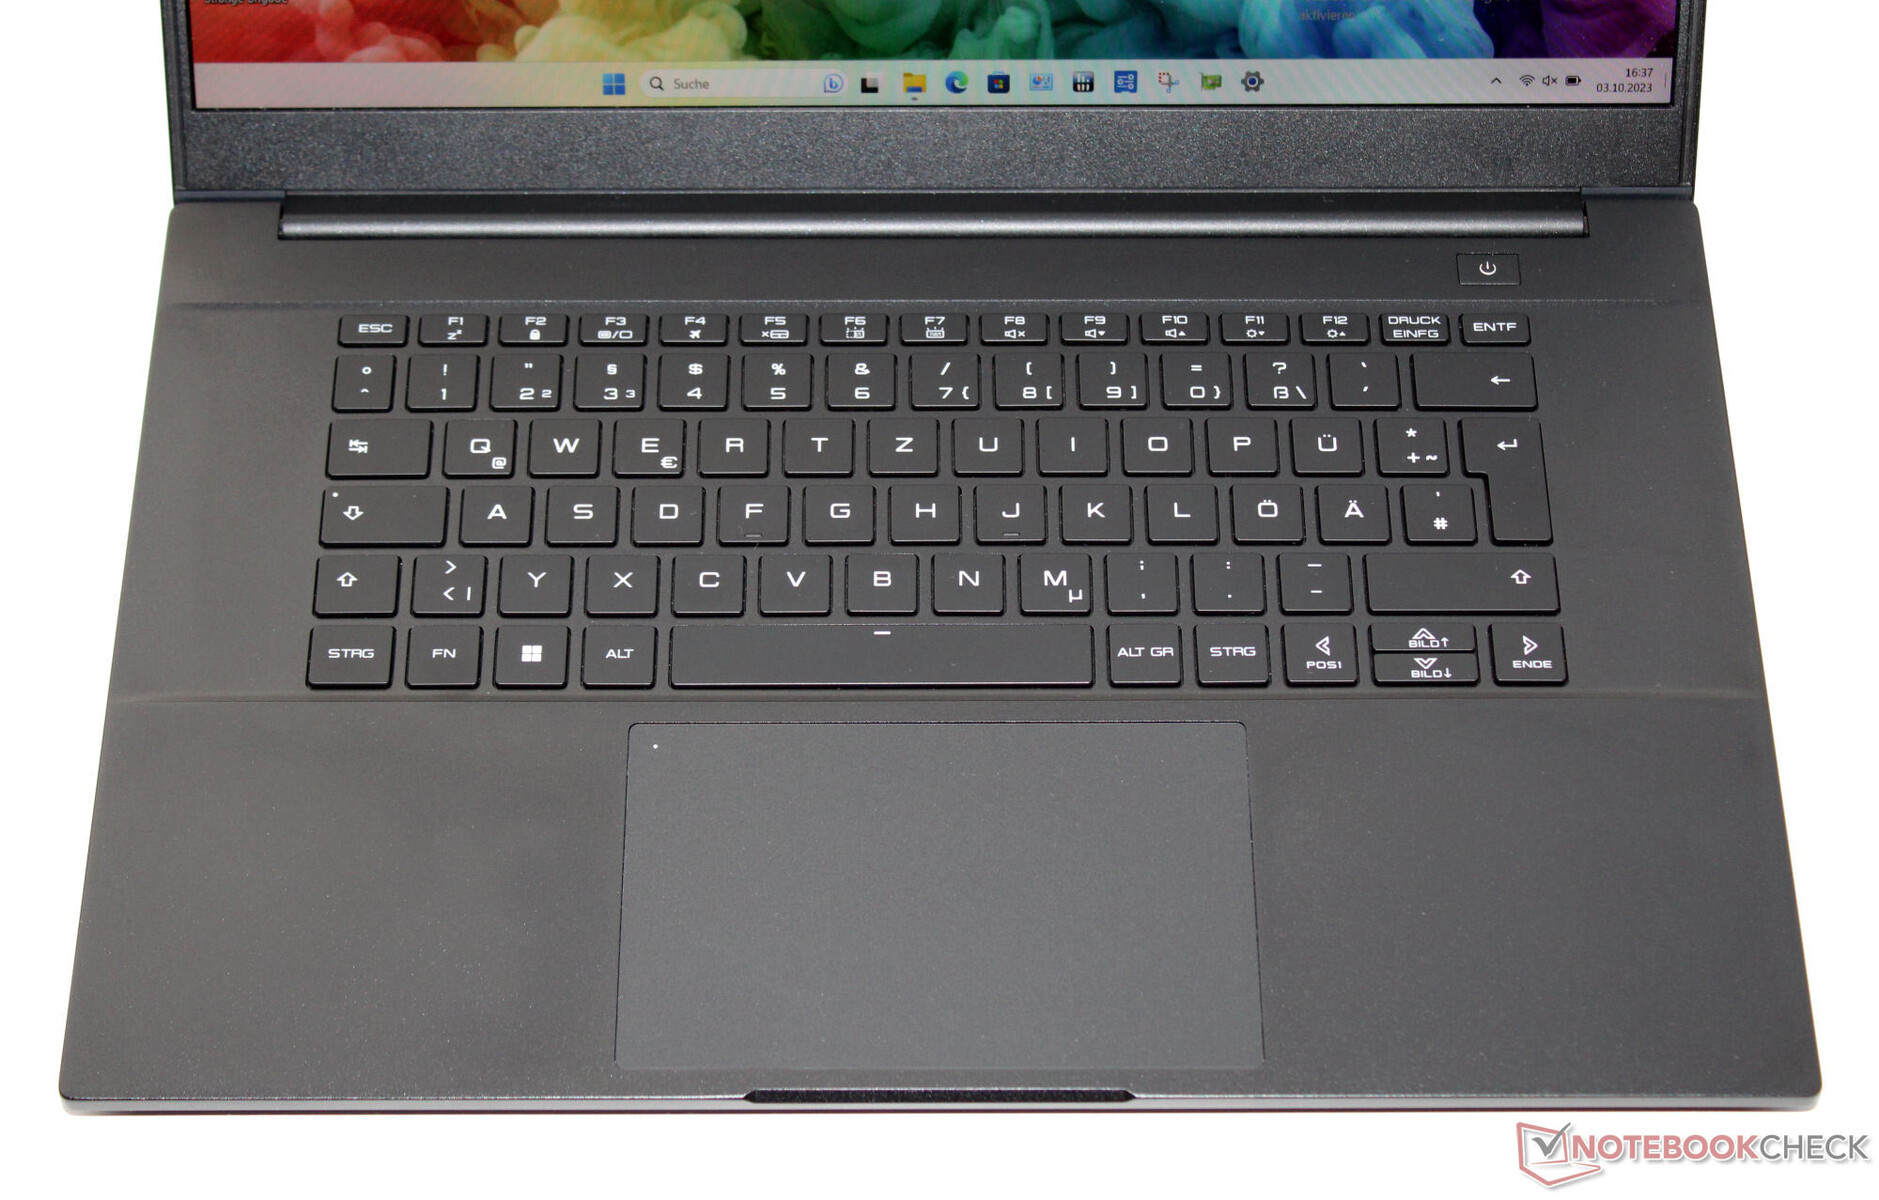
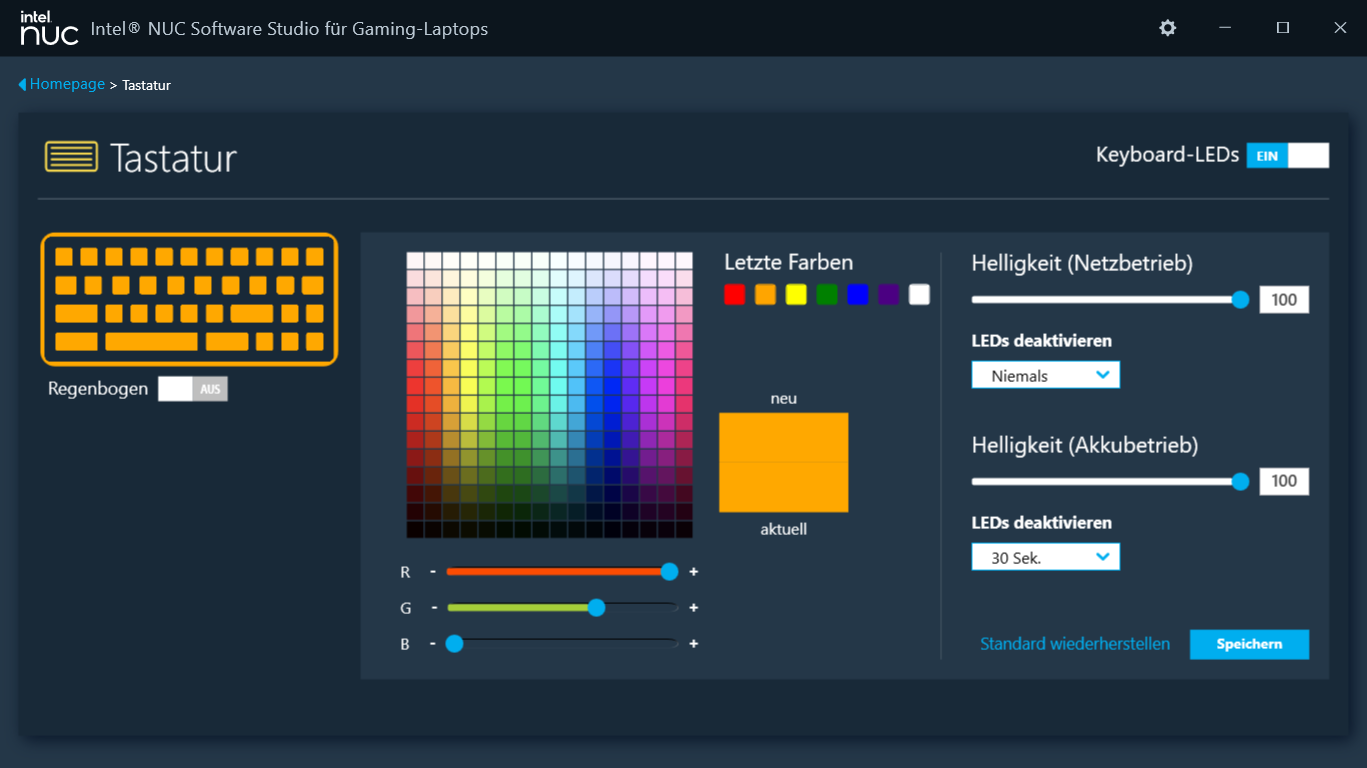
Input devices - A keyboard with RGB lighting
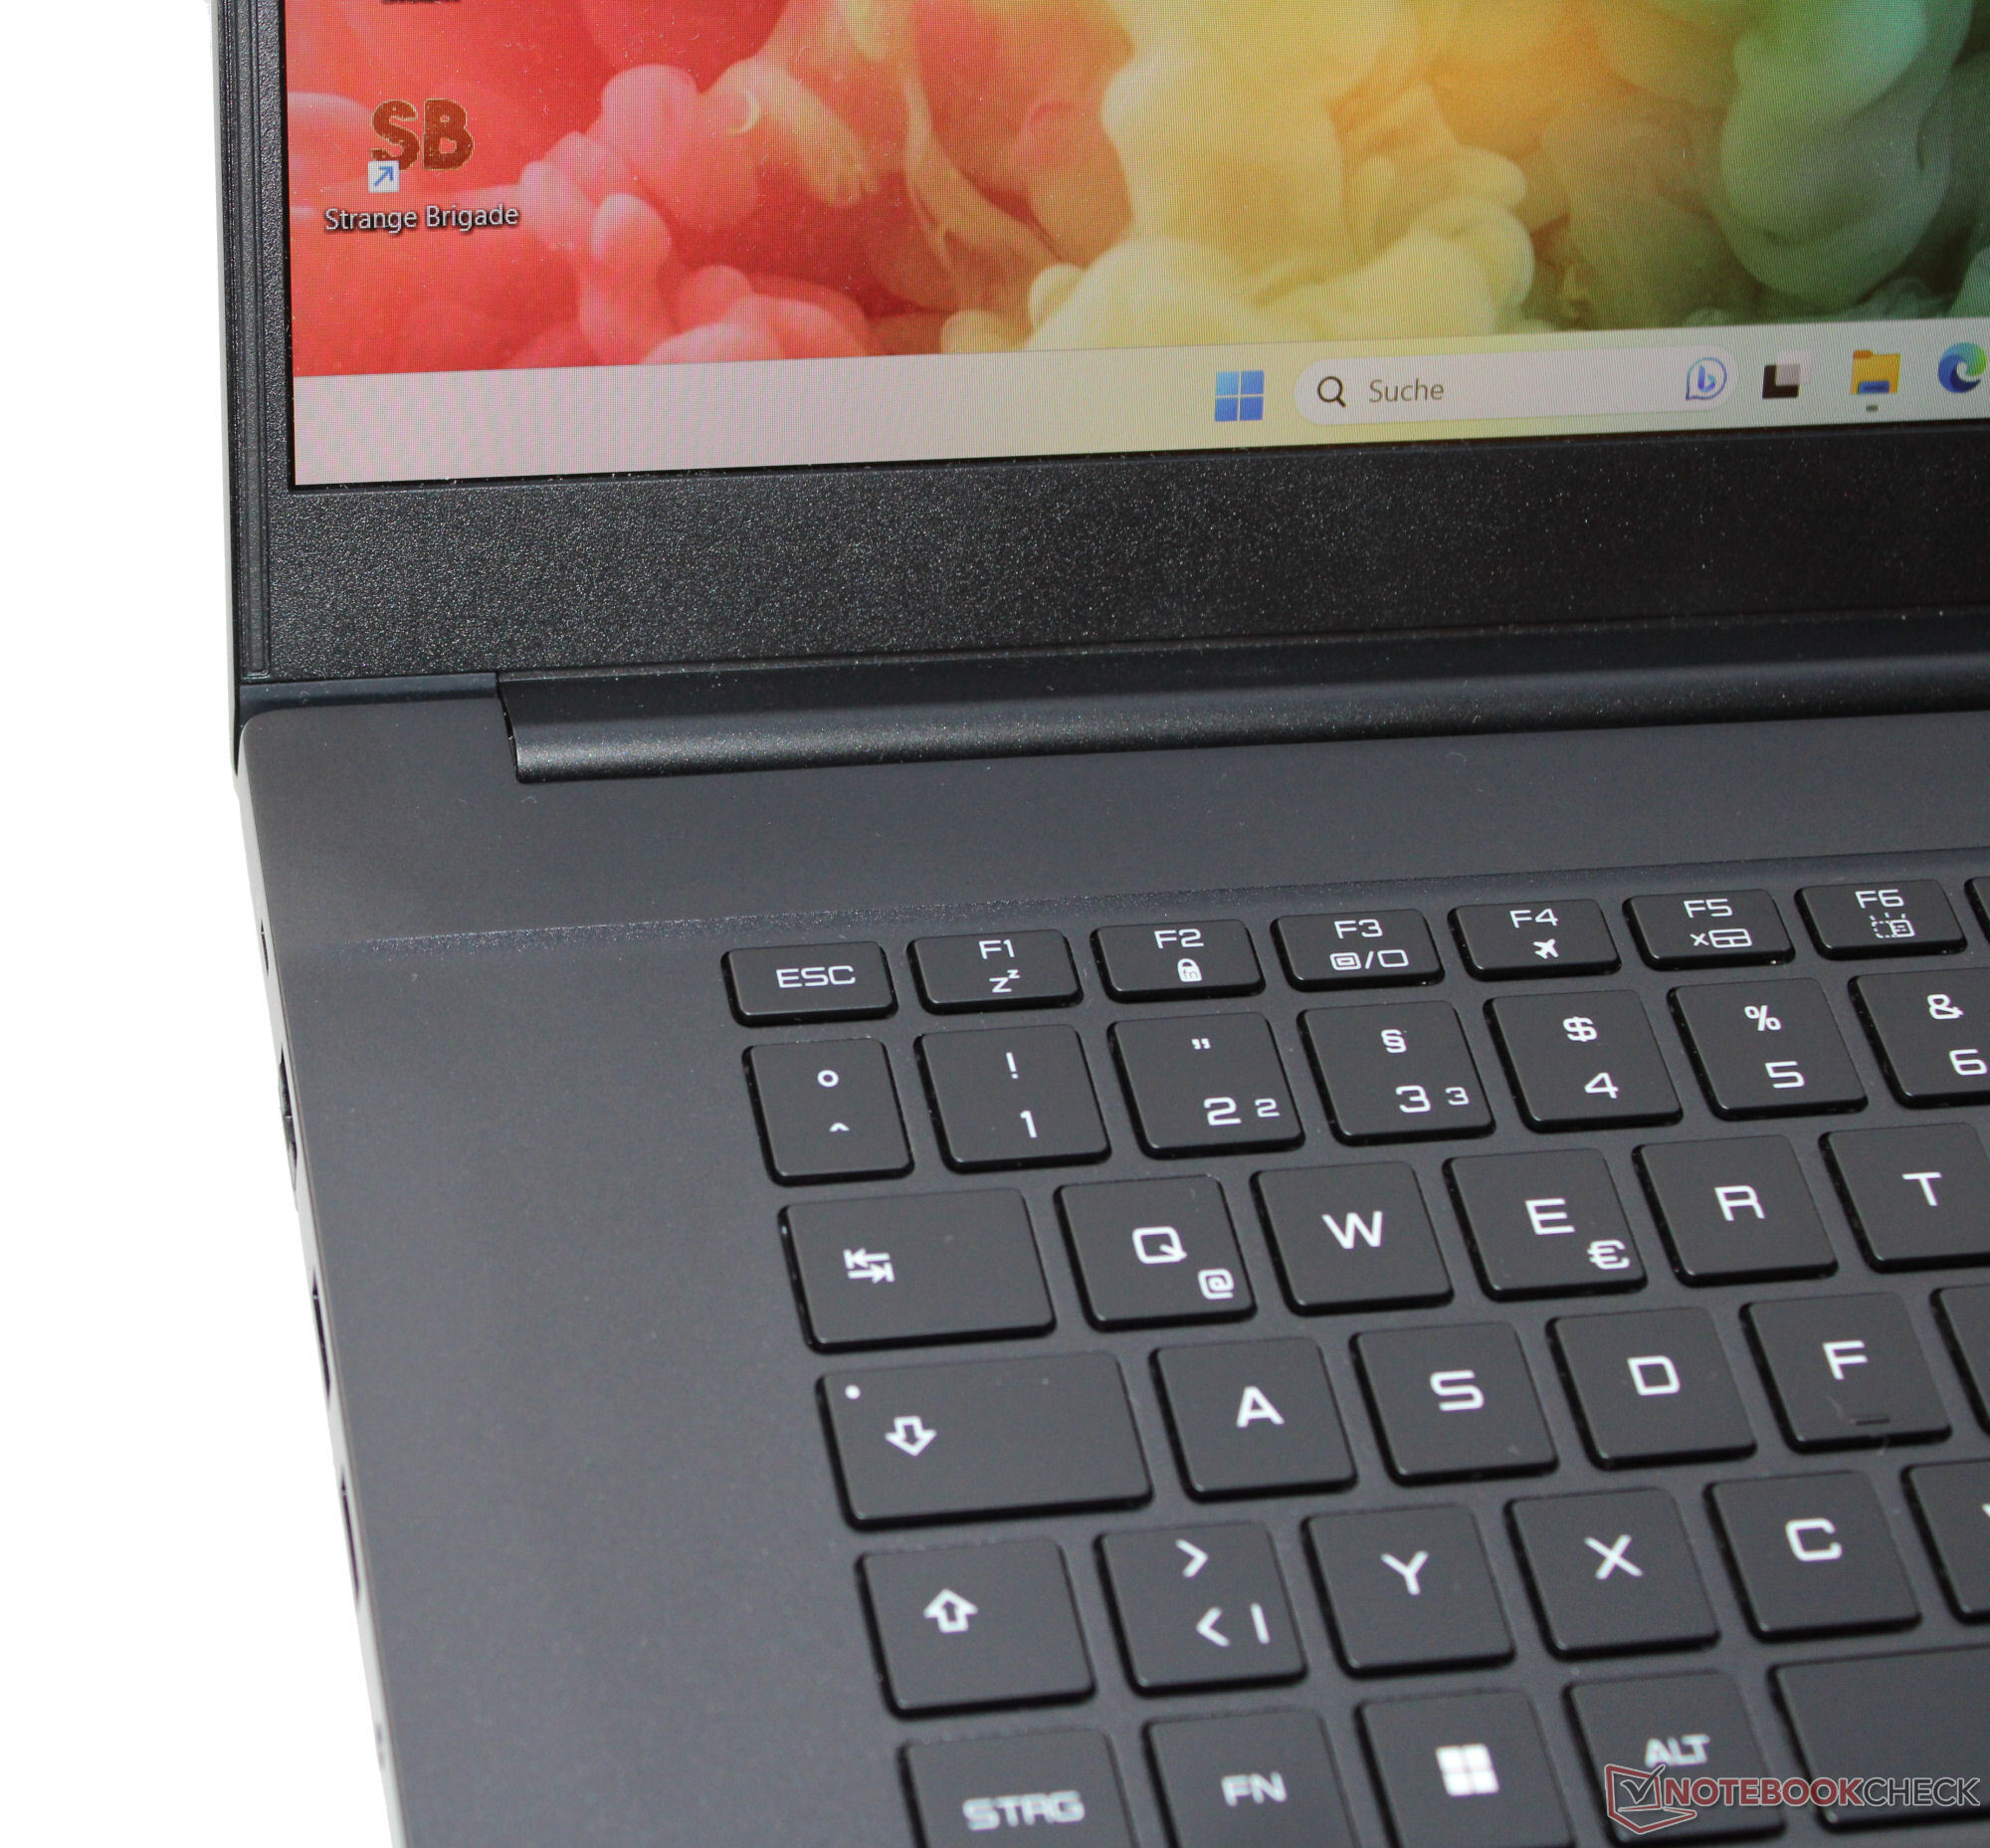
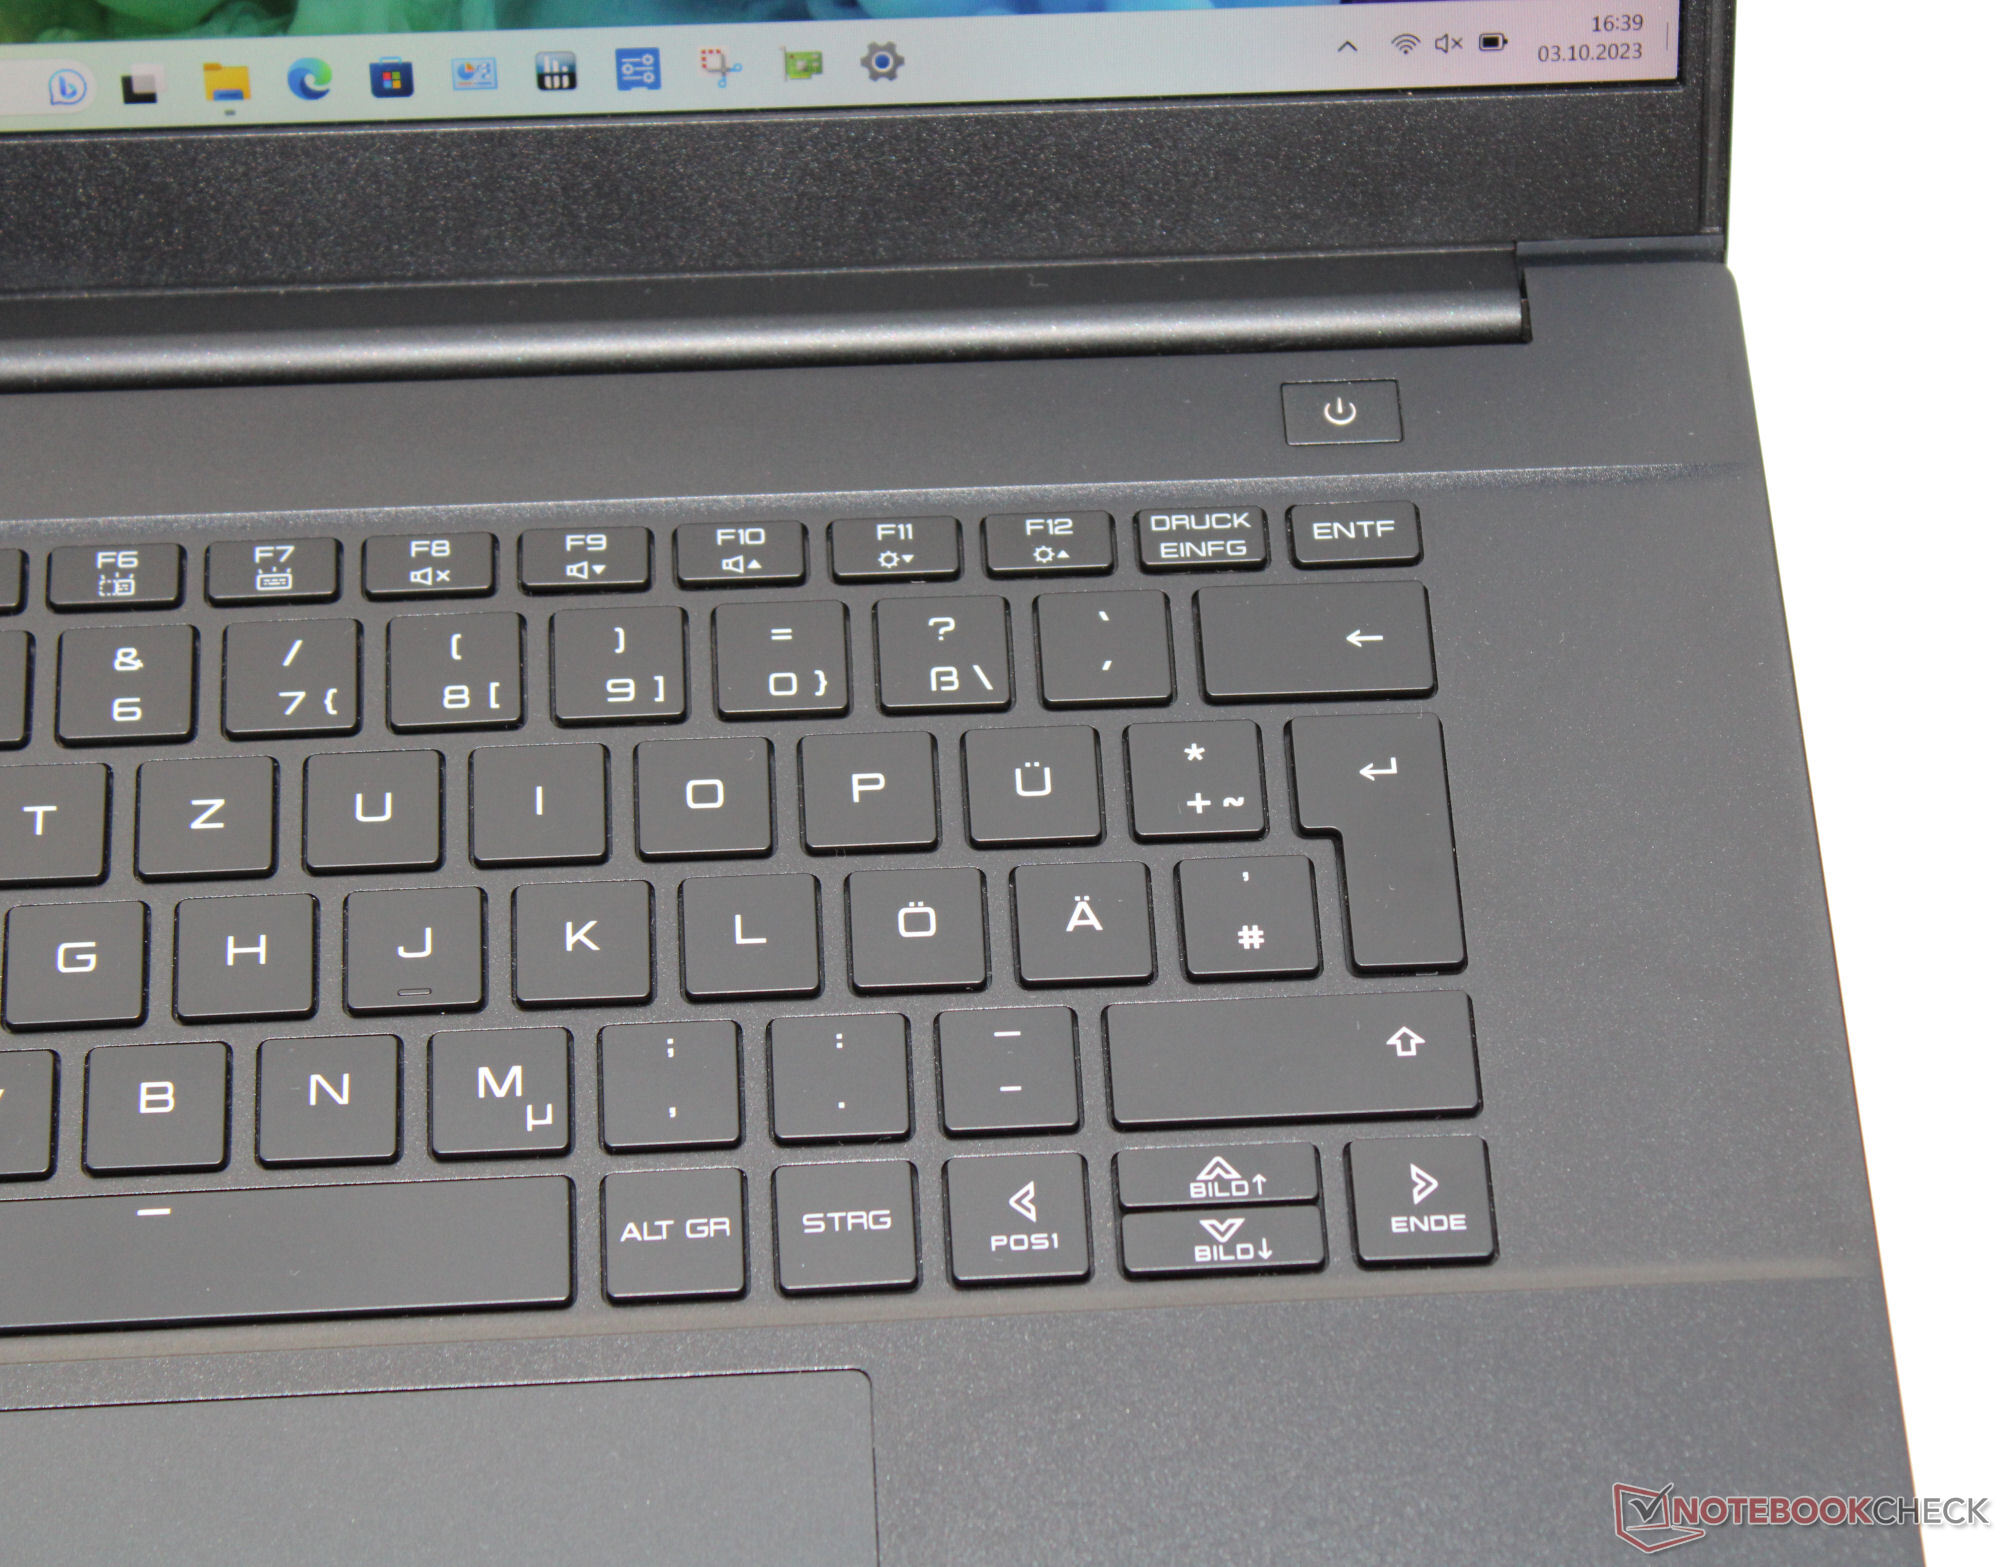
The laptop's chiclet keyboard (RGB illumination) doesn't feature a numerical keypad, even though there would be enough space for one. Its even, smooth keys feature a medium lift and a clear pressure point. The key resistance could do with being a little more crisp. The keyboard doesn't warp when you type on it. In total, Intel has delivered a keyboard fit for everyday use. A clickpad (ca. 13.3 x 8.3 cm) is installed as a mouse replacement and it features a short lift and a clear pressure point.
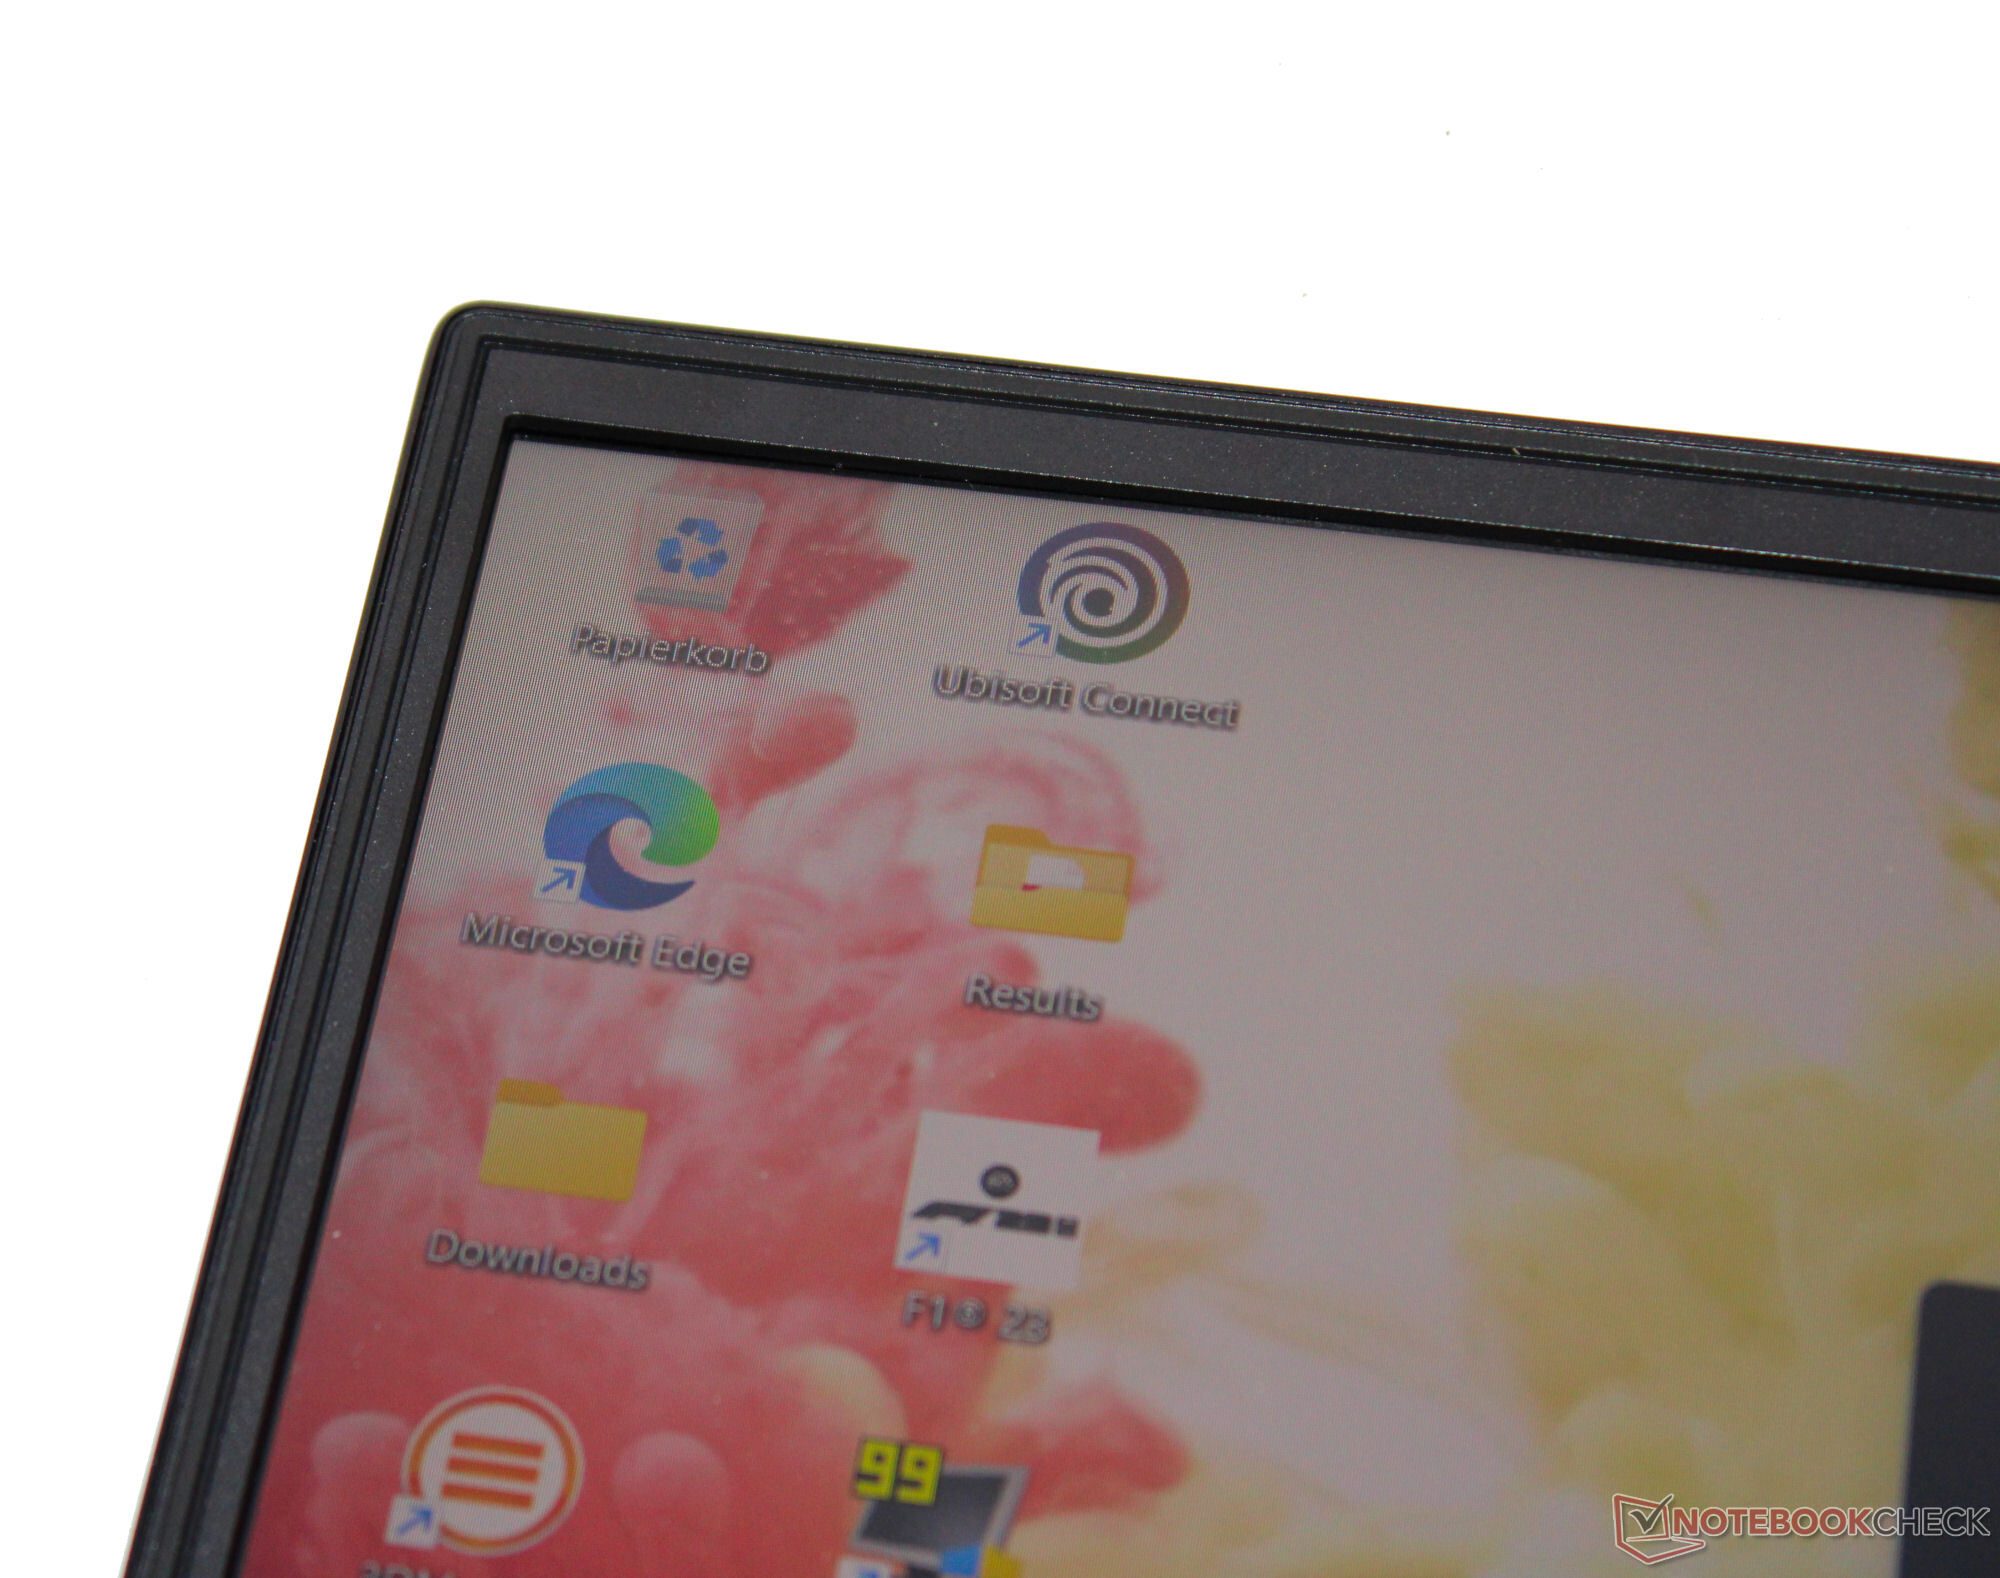
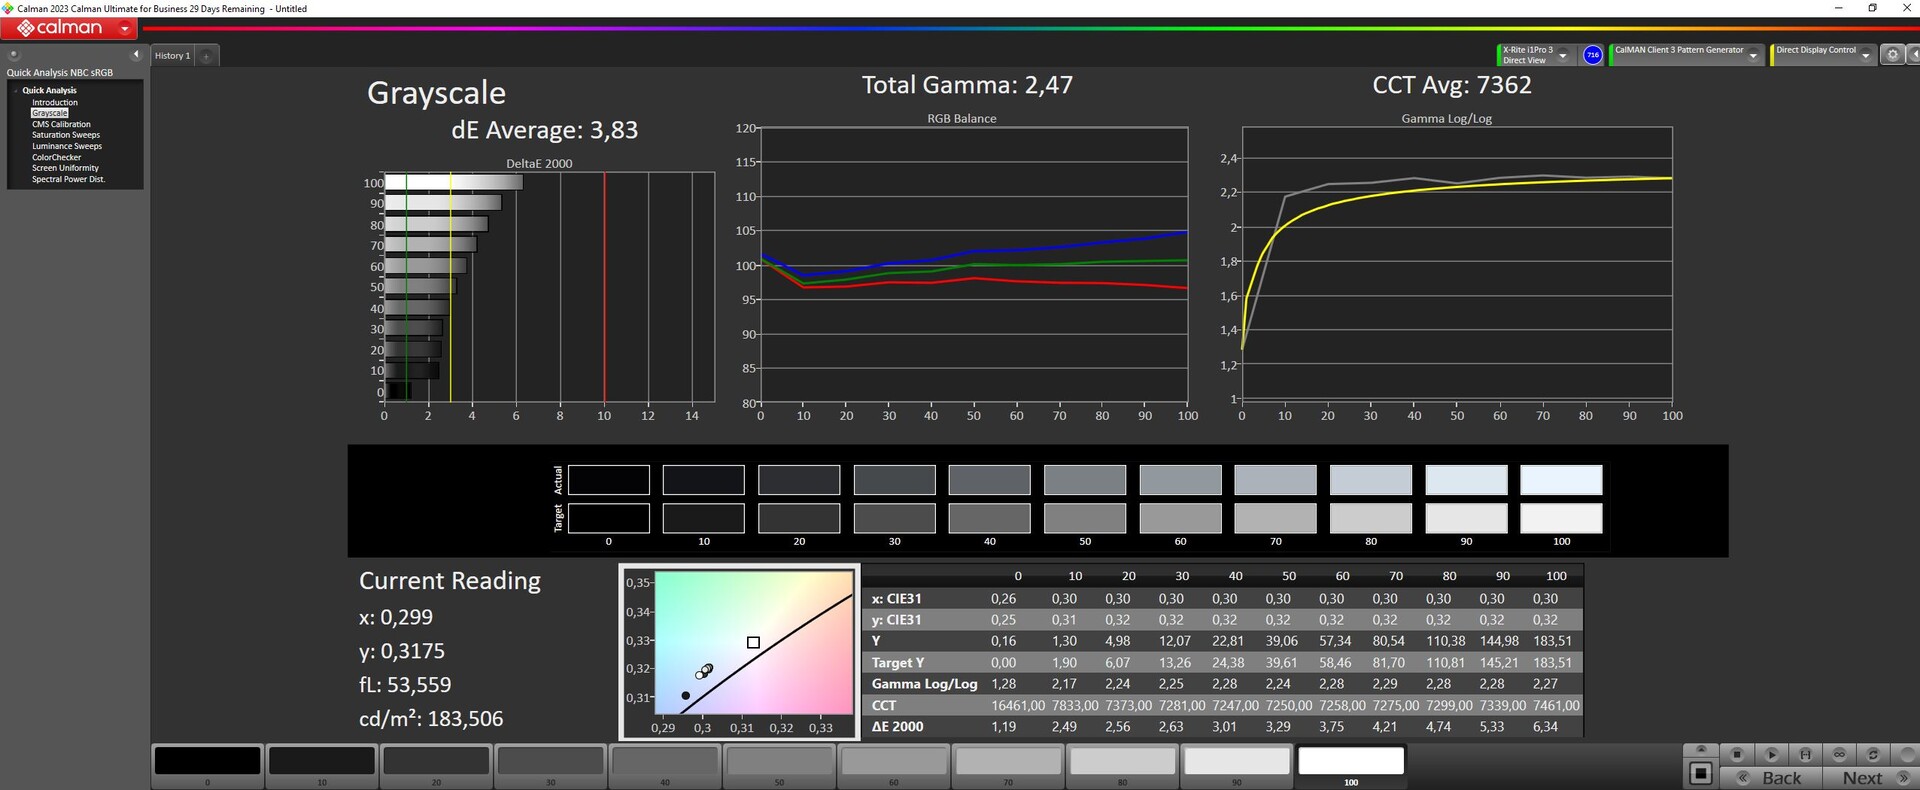
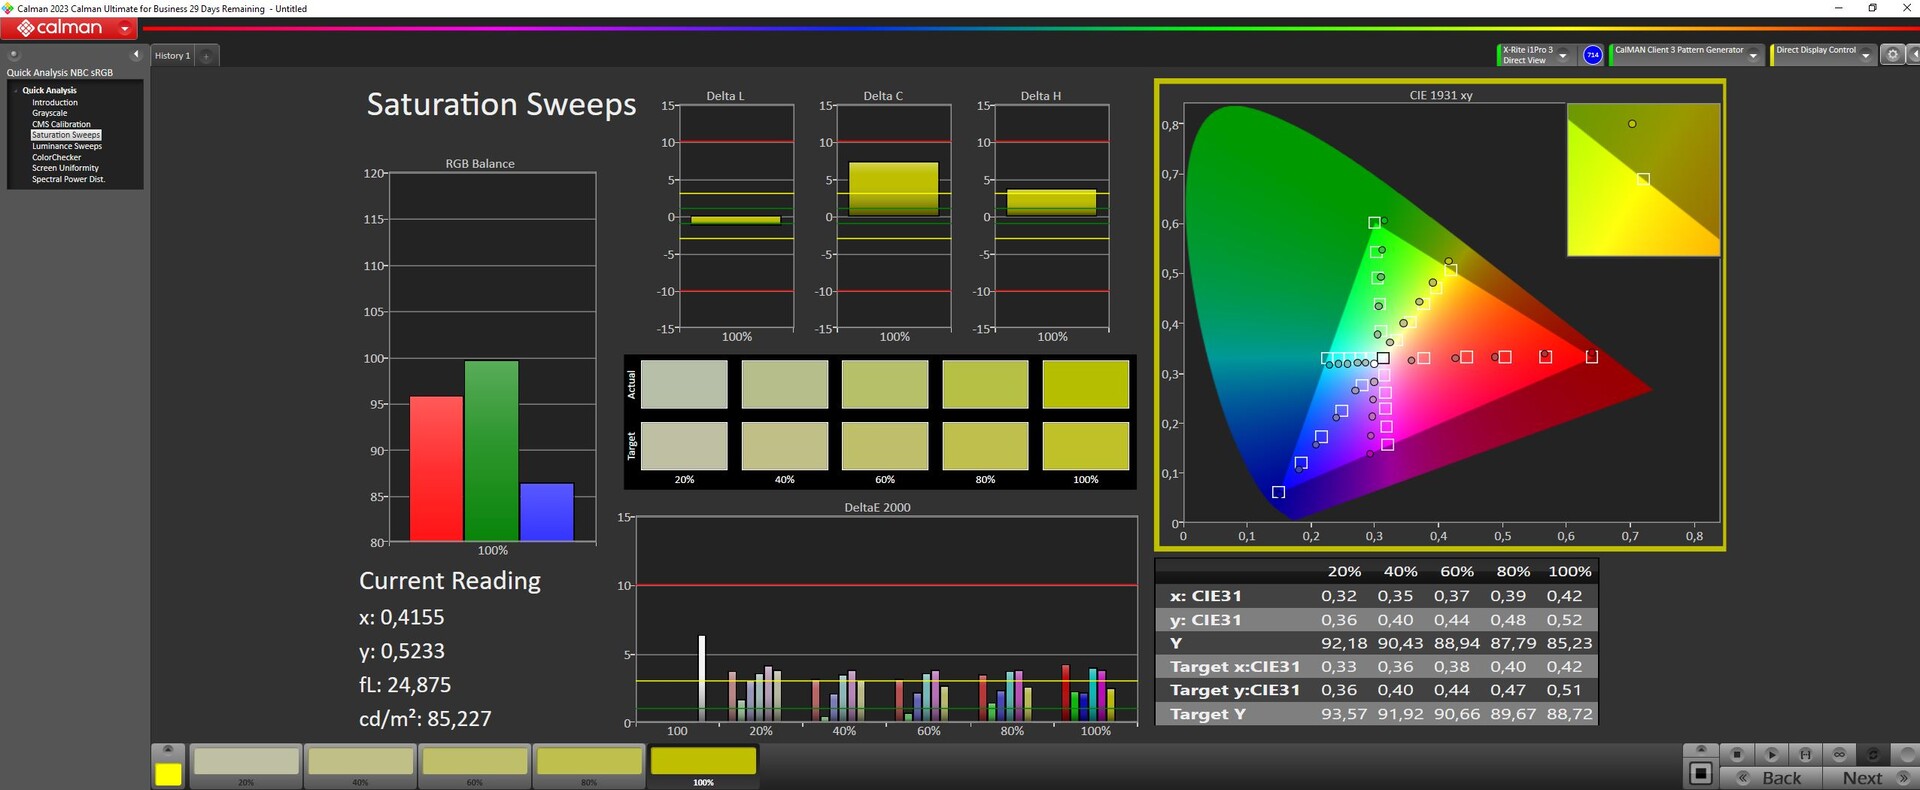
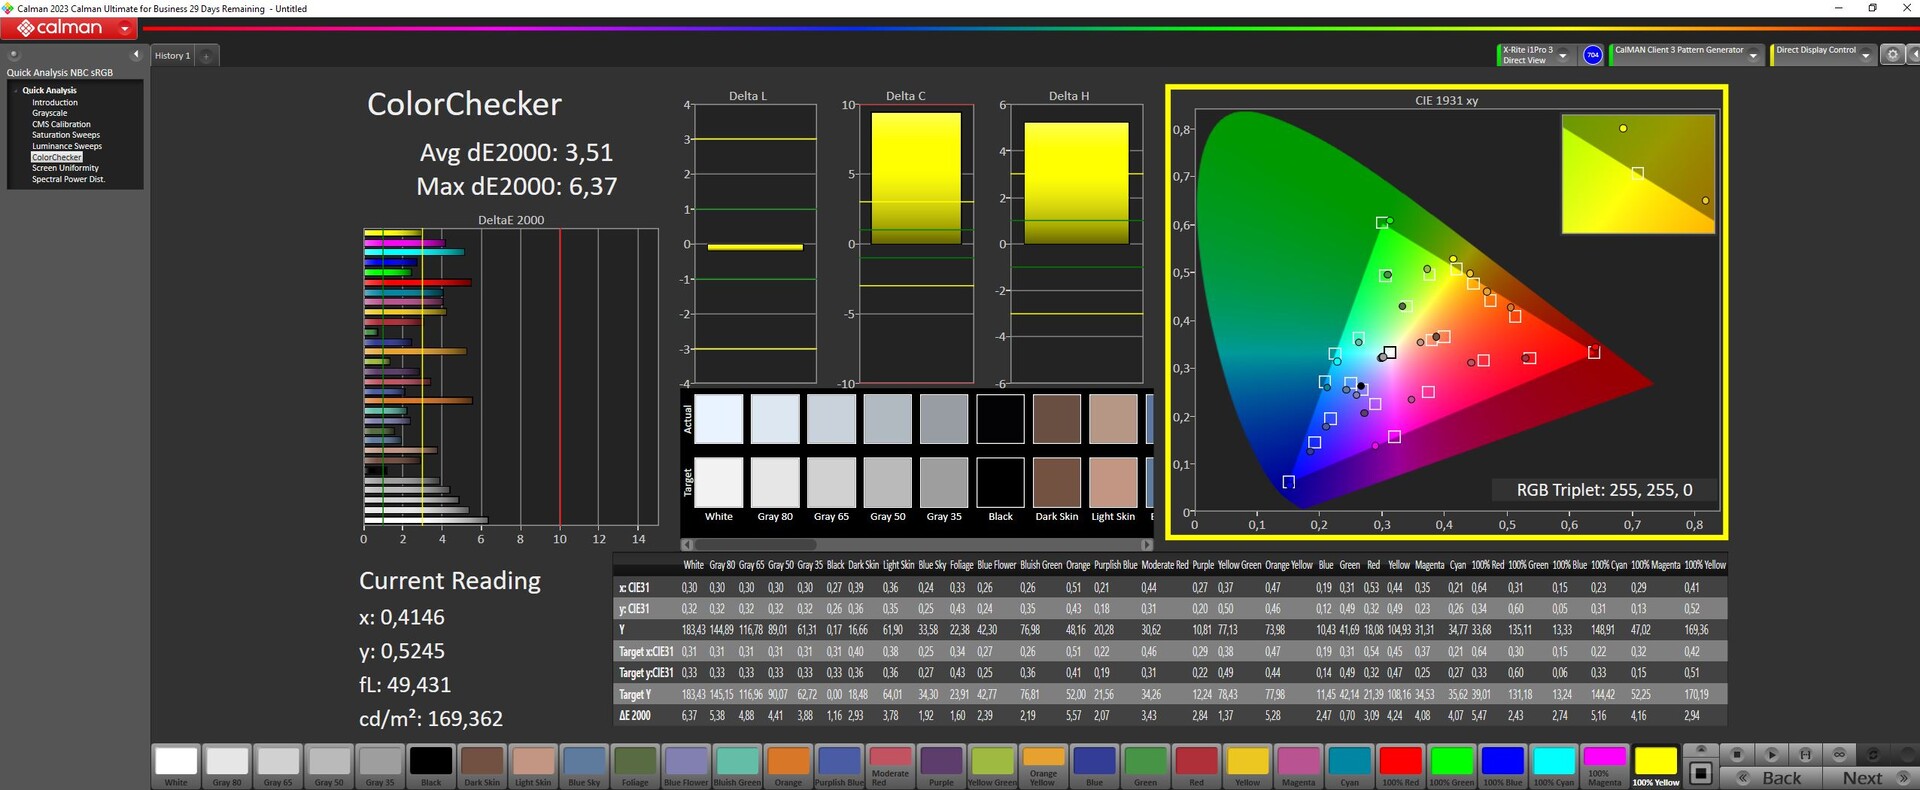
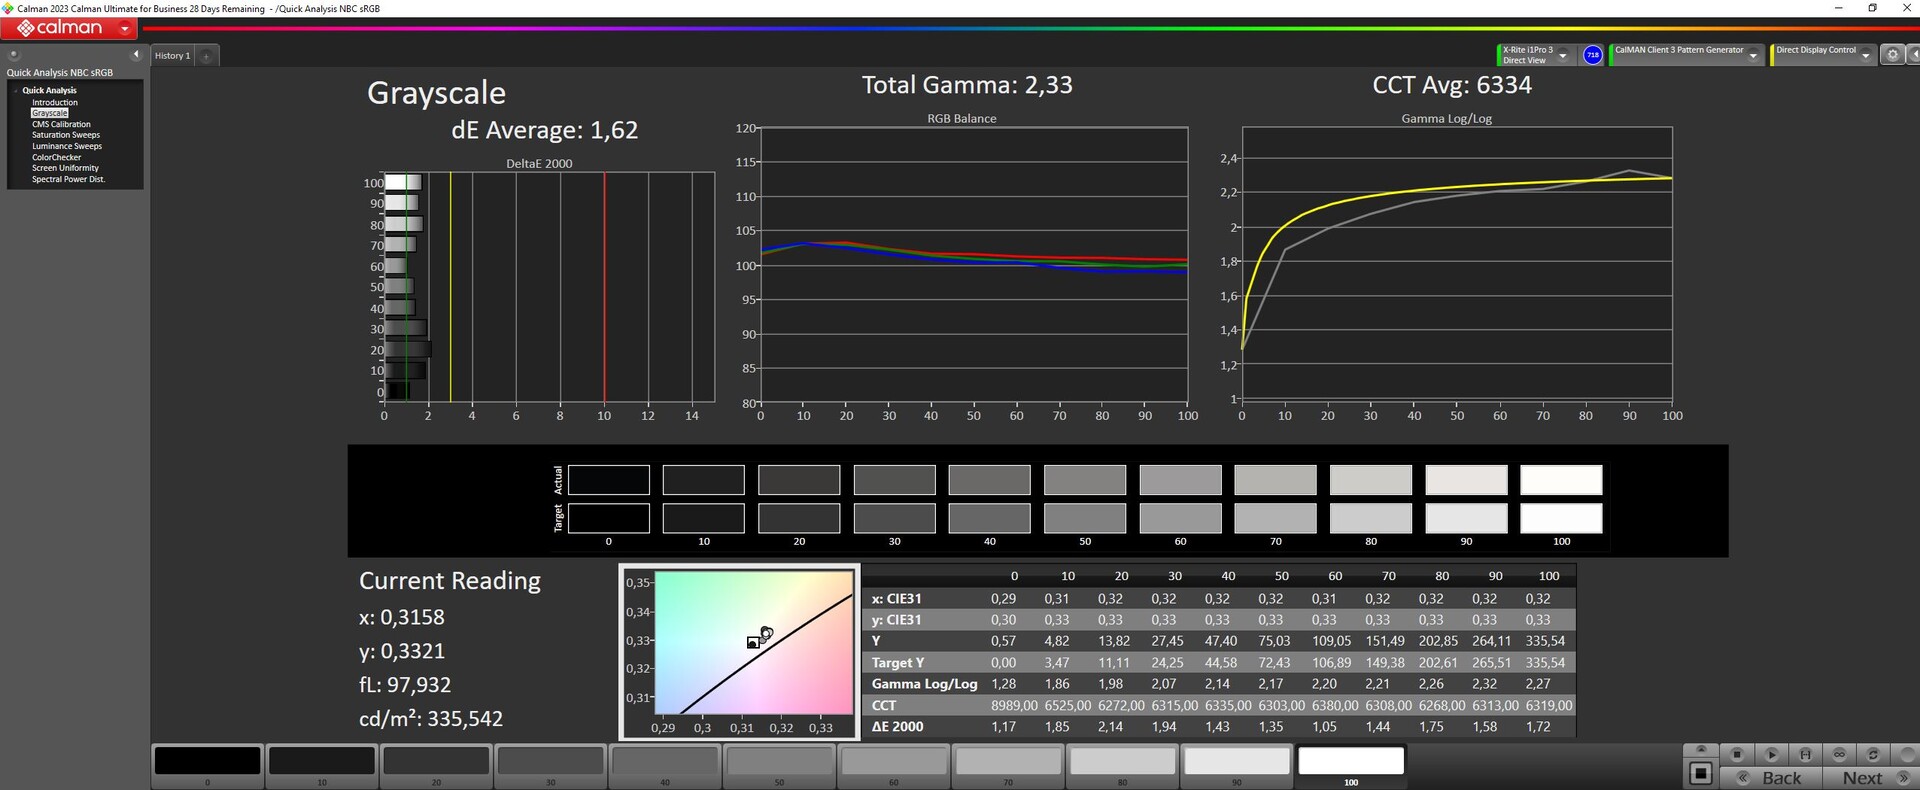
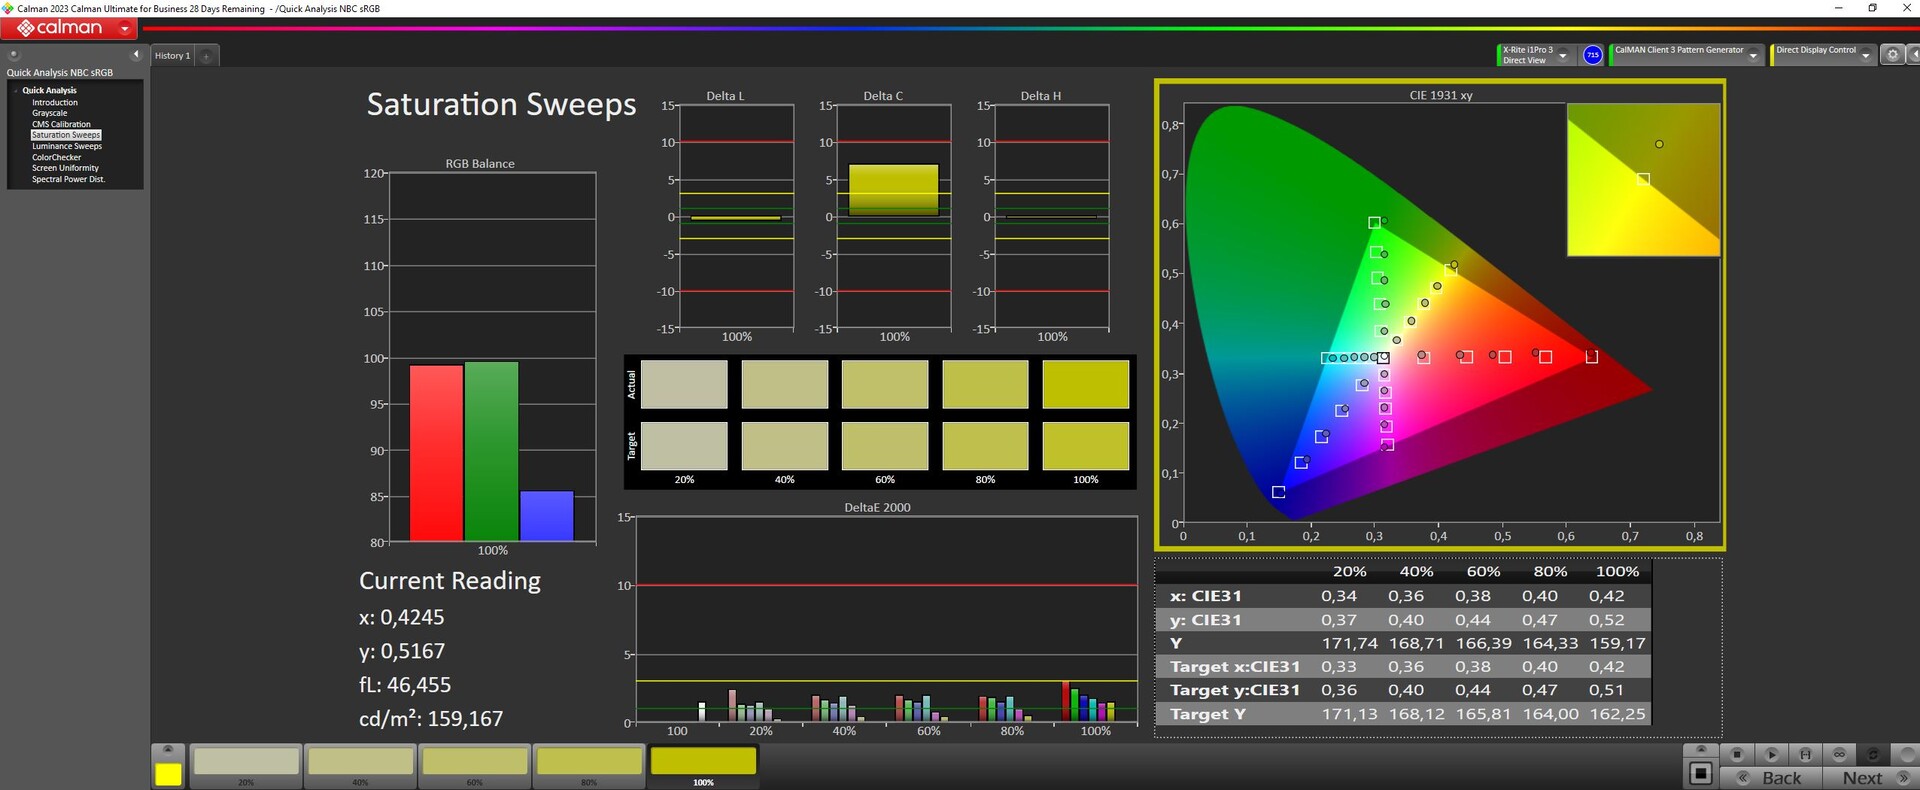
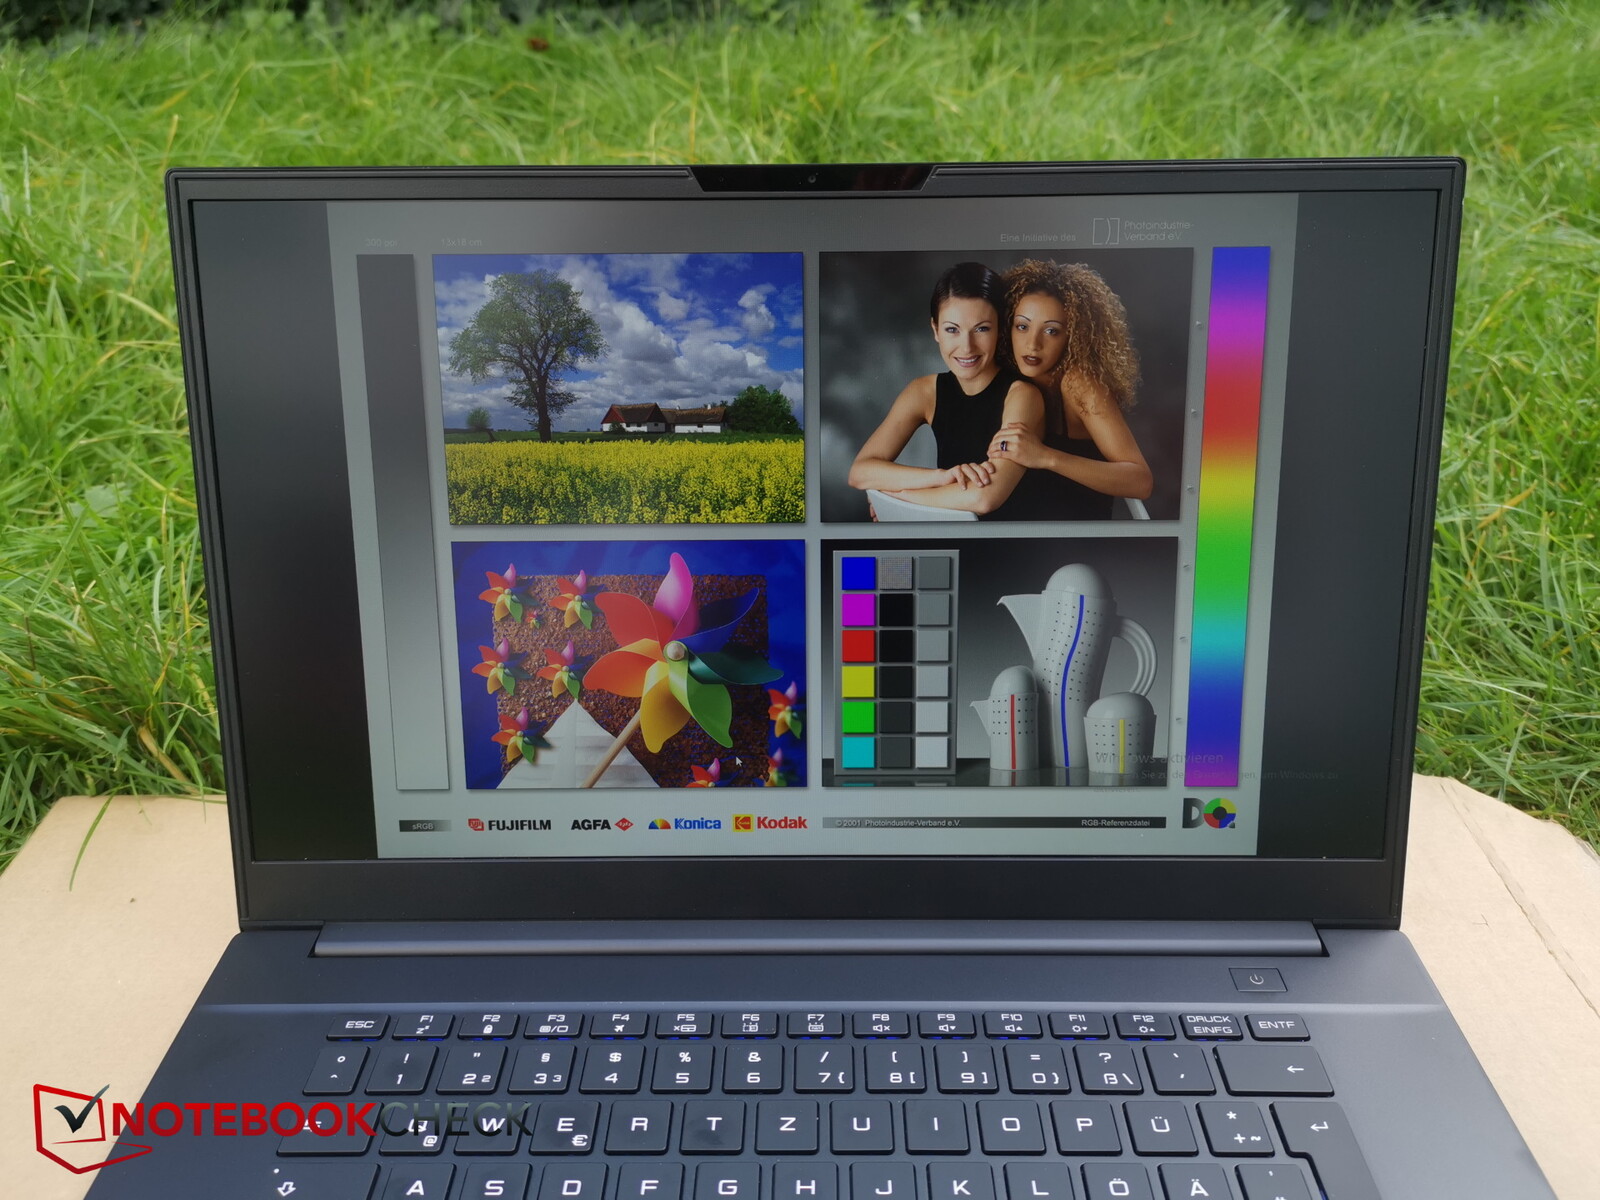
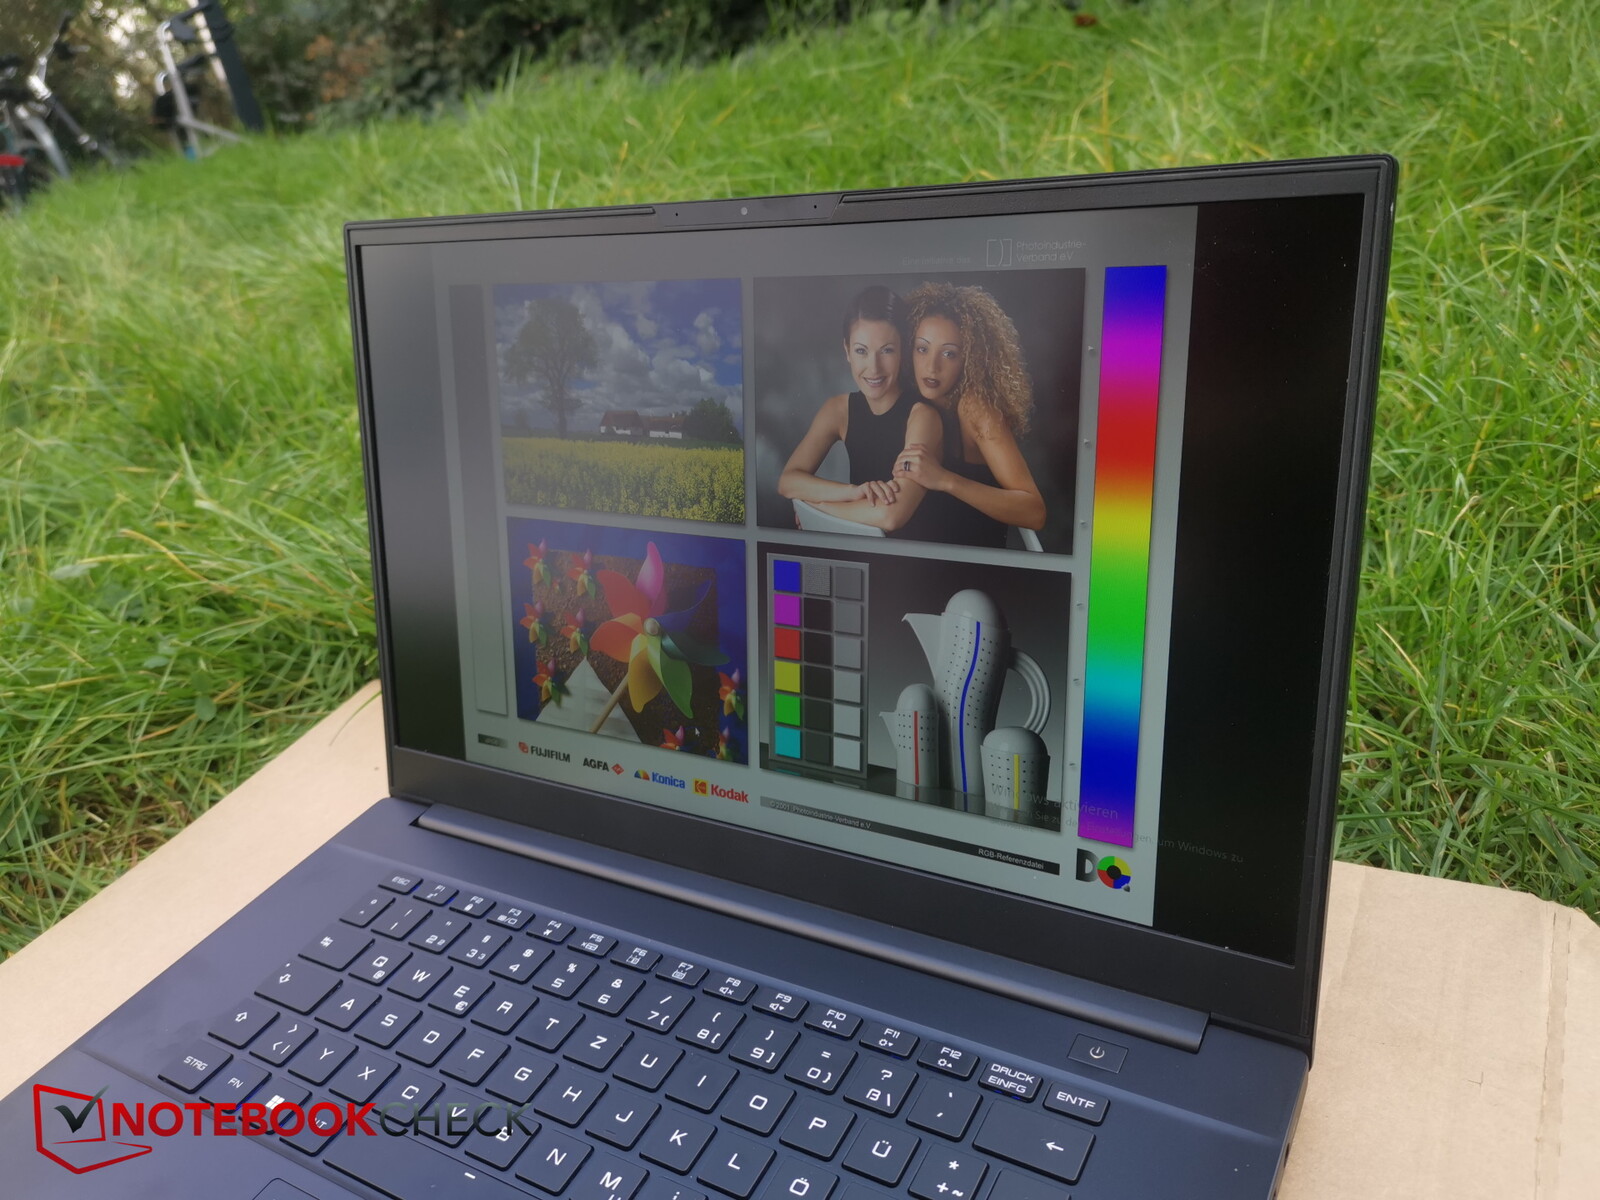
Display - The LAPAC71H features a high-contrast FHD panel
The fast-reacting 144 Hz panel with an aspect ratio of 16:9 shows no PWM flickering at any brightness level. The 15.6-inch display's (1,920 x 1,080 pixels) brightness and contrast targets have been hit (> 300 cd/m² and 1.000:1). Its relatively high contrast value deserves to be mentioned. Other display options are not available.


| |||||||||||||||||||||||||
Brightness Distribution: 86 %
Center on Battery: 366 cd/m²
Contrast: 2147:1 (Black: 0.17 cd/m²)
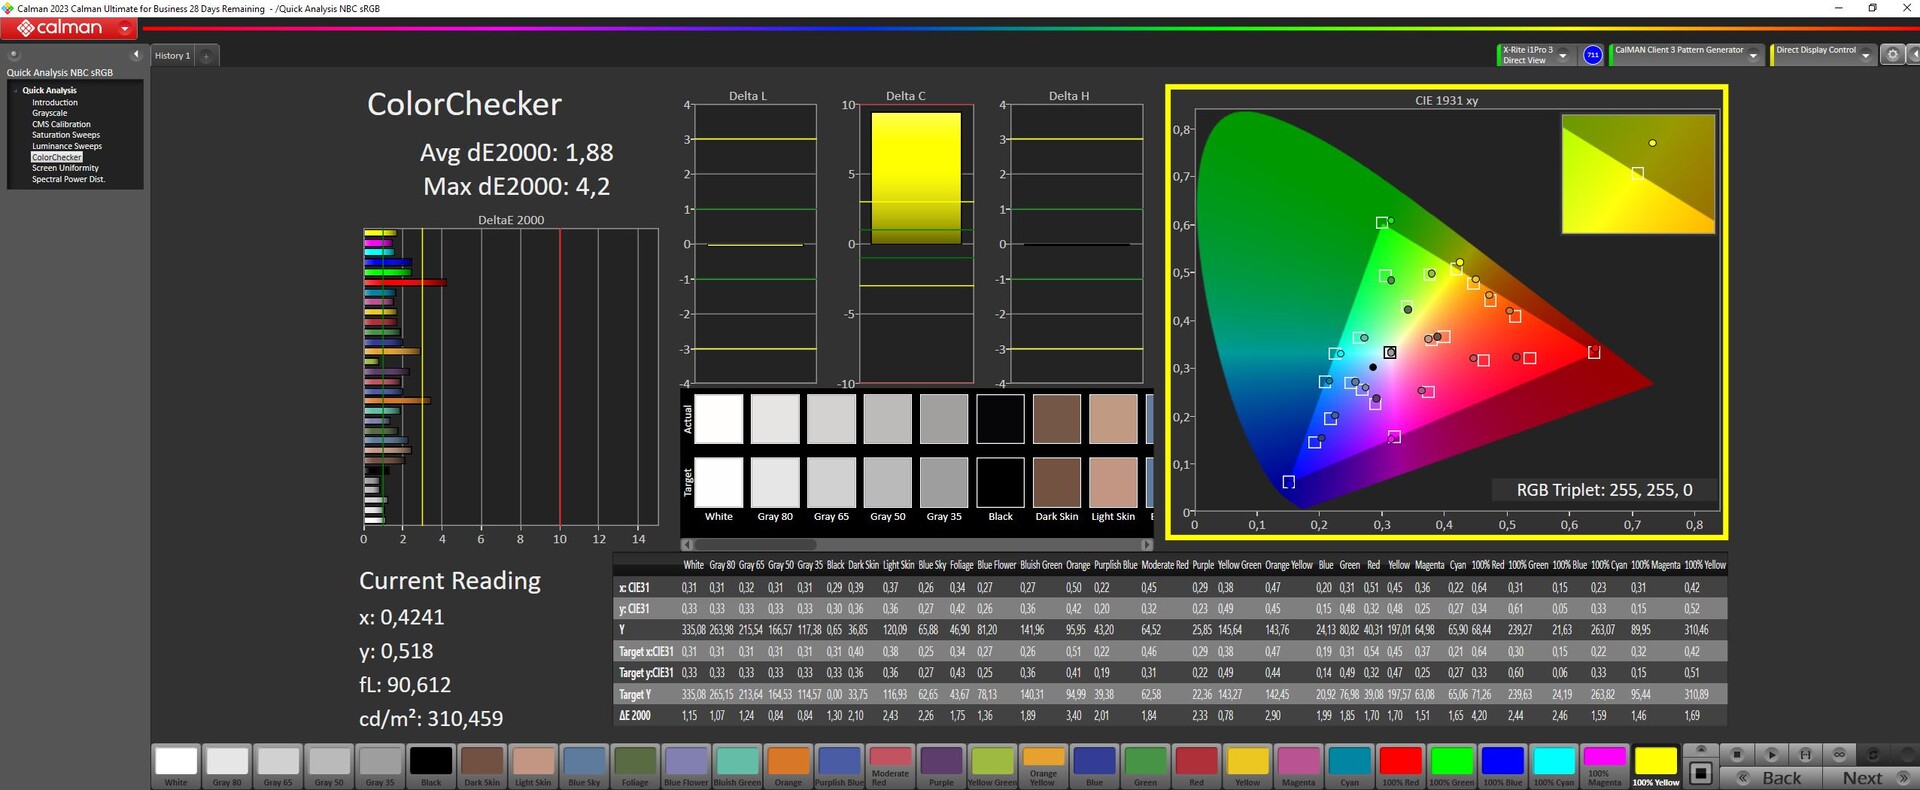
ΔE Color 3.51 | 0.5-29.43 Ø5.1, calibrated: 1.88
ΔE Greyscale 3.83 | 0.57-98 Ø5.3
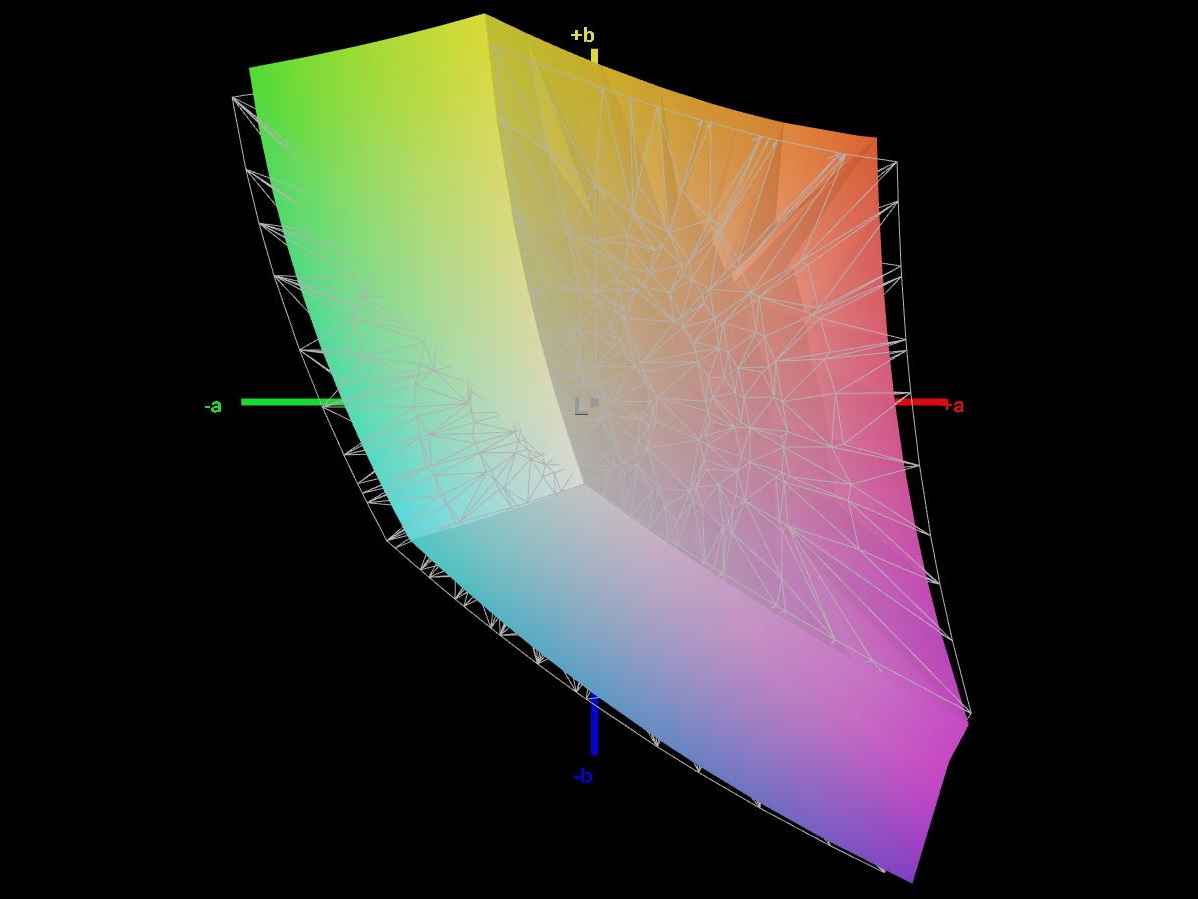
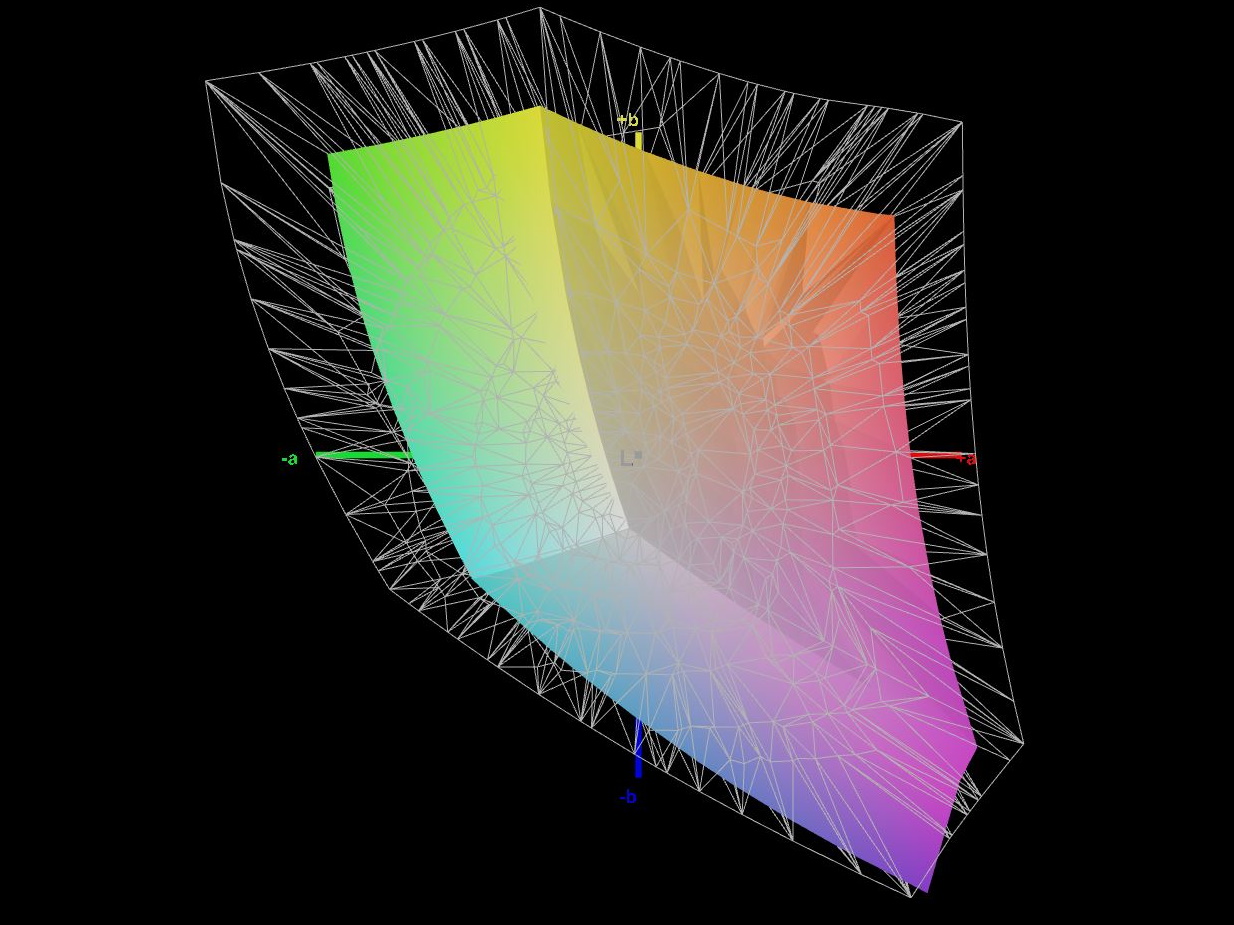
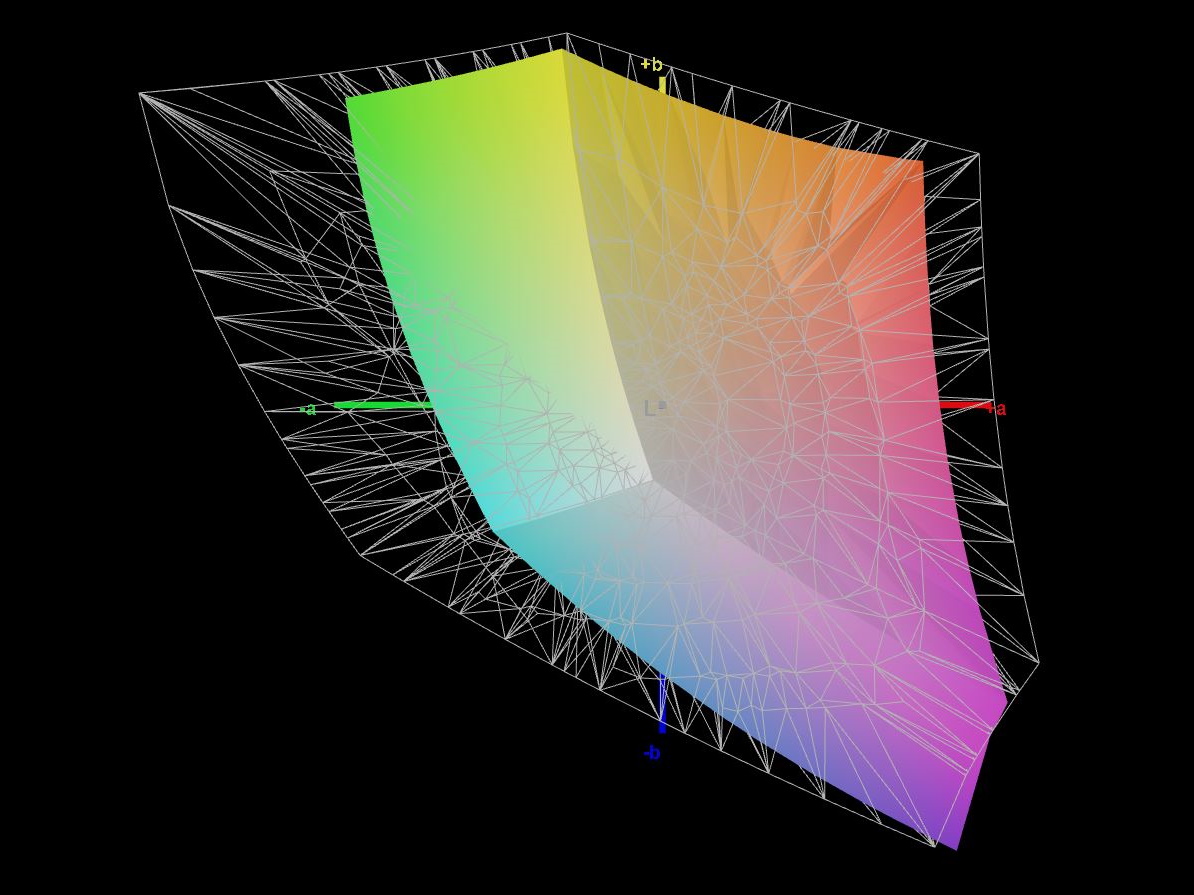
66.3% AdobeRGB 1998 (Argyll 2.2.0 3D)
92.6% sRGB (Argyll 2.2.0 3D)
64.9% Display P3 (Argyll 2.2.0 3D)
Gamma: 2.47
| Intel NUC X15 LAPAC71H BOE HF NV156FHM-N4G, IPS, 1920x1080, 15.60 | Asus TUF A15 FA507 N156HMA-GA1, IPS, 1920x1080, 15.60 | Gigabyte G5 KE Chi Mei N156HRA-EA1, IPS, 1920x1080, 15.60 | Dell Inspiron 16 Plus 7630 LG Philips 160WQ2, IPS, 2560x1600, 16.00 | Asus VivoBook Pro 16 Au Optronics B160QAN02.L, IPS, 2560x1600, 16.00 | MSI Cyborg 15 A12VF AU Optronics B156HAN15.1, IPS, 1920x1080, 15.60 | |
|---|---|---|---|---|---|---|
| Display | 1% | -36% | 8% | 30% | -34% | |
| Display P3 Coverage | 64.9 | 64.9 0% | 40.7 -37% | 70.1 8% | 98.5 52% | 42.3 -35% |
| sRGB Coverage | 92.6 | 96.5 4% | 61 -34% | 99.6 8% | 99.9 8% | 62.6 -32% |
| AdobeRGB 1998 Coverage | 66.3 | 66.6 0% | 42.1 -37% | 72.3 9% | 86.1 30% | 43.7 -34% |
| Response Times | -238% | -199% | -291% | 32% | -137% | |
| Response Time Grey 50% / Grey 80% * | 7.8 ? | 30.4 ? -290% | 26.64 ? -242% | 35 ? -349% | 2 ? 74% | 22 ? -182% |
| Response Time Black / White * | 7.3 ? | 20.8 ? -185% | 18.65 ? -155% | 24.2 ? -232% | 8 ? -10% | 14 ? -92% |
| PWM Frequency | ||||||
| Screen | 13% | -67% | -10% | 5% | -27% | |
| Brightness middle | 365 | 288 -21% | 269 -26% | 299.4 -18% | 504 38% | 247 -32% |
| Brightness | 356 | 271 -24% | 248 -30% | 290 -19% | 465 31% | 234 -34% |
| Brightness Distribution | 86 | 91 6% | 85 -1% | 92 7% | 87 1% | 89 3% |
| Black Level * | 0.17 | 0.17 -0% | 0.5 -194% | 0.21 -24% | 0.35 -106% | 0.25 -47% |
| Contrast | 2147 | 1694 -21% | 538 -75% | 1426 -34% | 1440 -33% | 988 -54% |
| Colorchecker dE 2000 * | 3.51 | 1.9 46% | 4.54 -29% | 4.25 -21% | 1.83 48% | 3.78 -8% |
| Colorchecker dE 2000 max. * | 6.37 | 3.3 48% | 17.28 -171% | 6.71 -5% | 5.51 14% | 6.42 -1% |
| Colorchecker dE 2000 calibrated * | 1.88 | 0.9 52% | 3.34 -78% | 0.52 72% | 1.34 29% | 3.94 -110% |
| Greyscale dE 2000 * | 3.83 | 2.7 30% | 3.8 1% | 5.5 -44% | 3.02 21% | 2.16 44% |
| Gamma | 2.47 89% | 2.32 95% | 2.17 101% | 2.35 94% | 2.39 92% | 2.33 94% |
| CCT | 7362 88% | 6535 99% | 7408 88% | 6368 102% | 6688 97% | 6906 94% |
| Total Average (Program / Settings) | -75% /
-25% | -101% /
-79% | -98% /
-46% | 22% /
14% | -66% /
-44% |
* ... smaller is better
Ex works, the display shows relatively good color depiction: With a deviation of around 3.5, its target (DeltaE < 3) was just missed. Calibrating the screen lowers the deviation to 1.9 and leads to more balanced gray tones. The panel can almost completely cover the sRGB color space, but not AdobeRGB or DCI P3. Most of its competitors' panels paint a similar picture. Only the VivoBook's display can cover the P3 color space.
Display Response Times
| ↔ Response Time Black to White | ||
|---|---|---|
| 7.3 ms ... rise ↗ and fall ↘ combined | ↗ 3.3 ms rise | 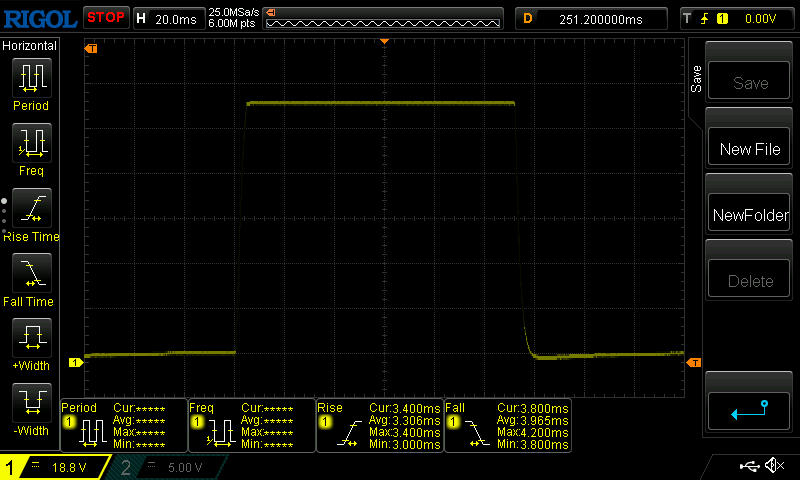 |
| ↘ 4 ms fall | ||
| The screen shows very fast response rates in our tests and should be very well suited for fast-paced gaming. In comparison, all tested devices range from 0.1 (minimum) to 240 (maximum) ms. » 15 % of all devices are better. This means that the measured response time is better than the average of all tested devices (21.8 ms). | ||
| ↔ Response Time 50% Grey to 80% Grey | ||
| 7.8 ms ... rise ↗ and fall ↘ combined | ↗ 3.9 ms rise | 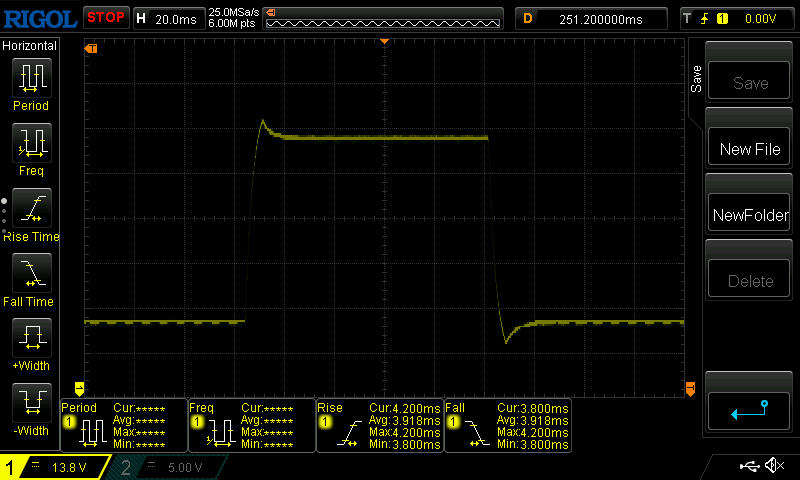 |
| ↘ 3.9 ms fall | ||
| The screen shows very fast response rates in our tests and should be very well suited for fast-paced gaming. In comparison, all tested devices range from 0.2 (minimum) to 636 (maximum) ms. » 14 % of all devices are better. This means that the measured response time is better than the average of all tested devices (34.3 ms). | ||
Screen Flickering / PWM (Pulse-Width Modulation)
| Screen flickering / PWM not detected | 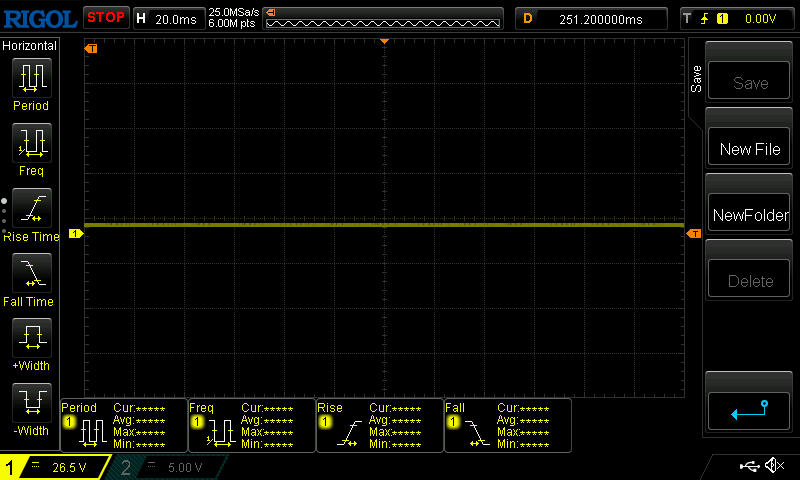 | ||
In comparison: 53 % of all tested devices do not use PWM to dim the display. If PWM was detected, an average of 18752 (minimum: 5 - maximum: 3846000) Hz was measured. | |||
The viewing-angle stable IPS panel remains legible from every angle. Outside, you can read from the display as long as the sun isn't shining too brightly.

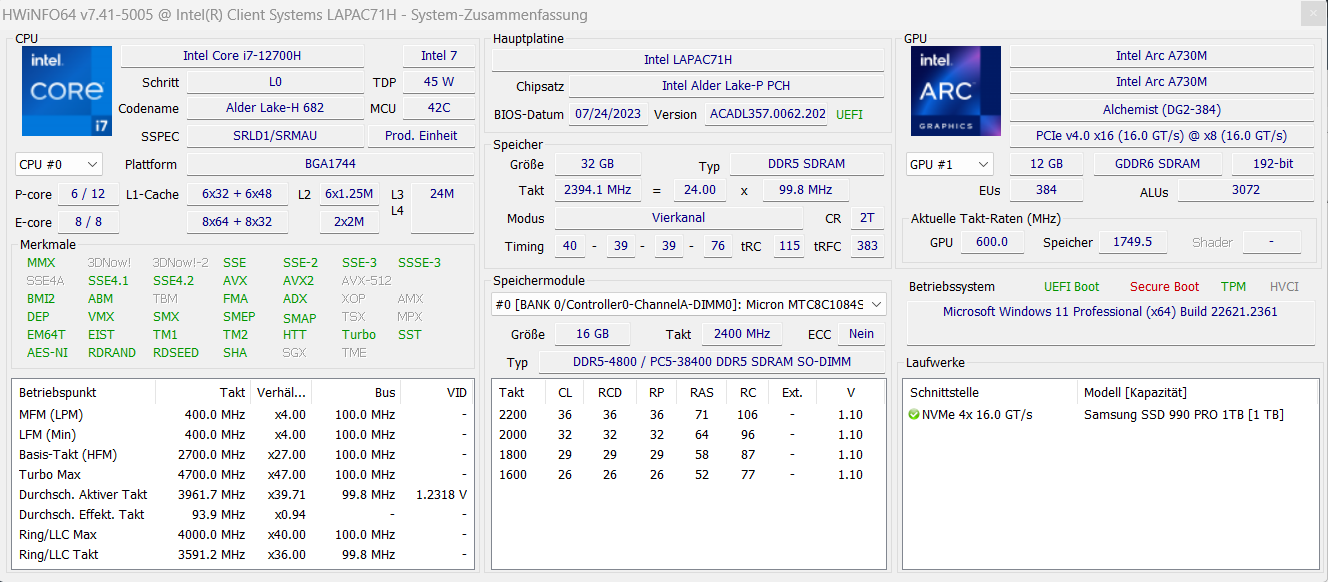
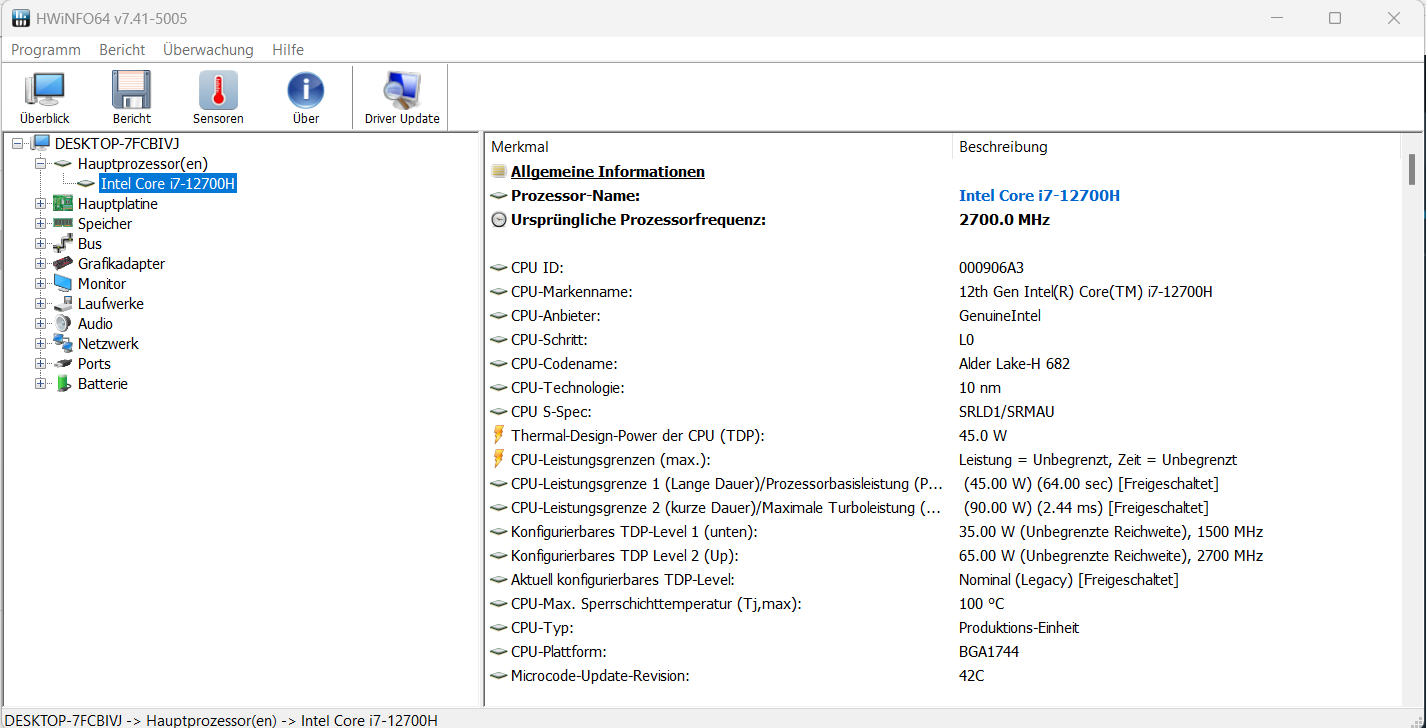
Performance - An Intel team powers the gaming laptop
A Core i7-12700H and Arc A730M power the gamer- and creator-directed Intel NUC X15 LAPAC71H. Other options are not available. The laptop can currently be found from around US$1,050. The present variant costs about US$1,280. You will possibly have to factor in additional costs for a Windows license.
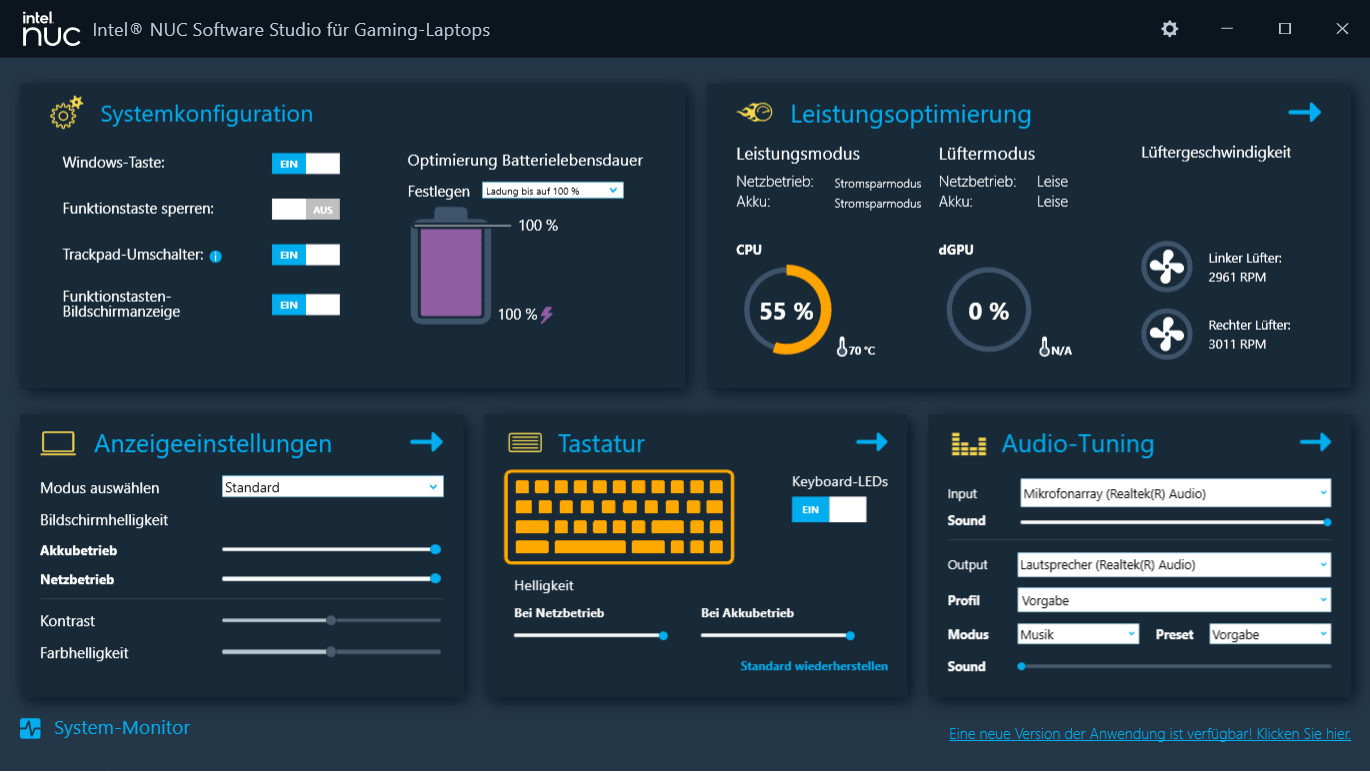
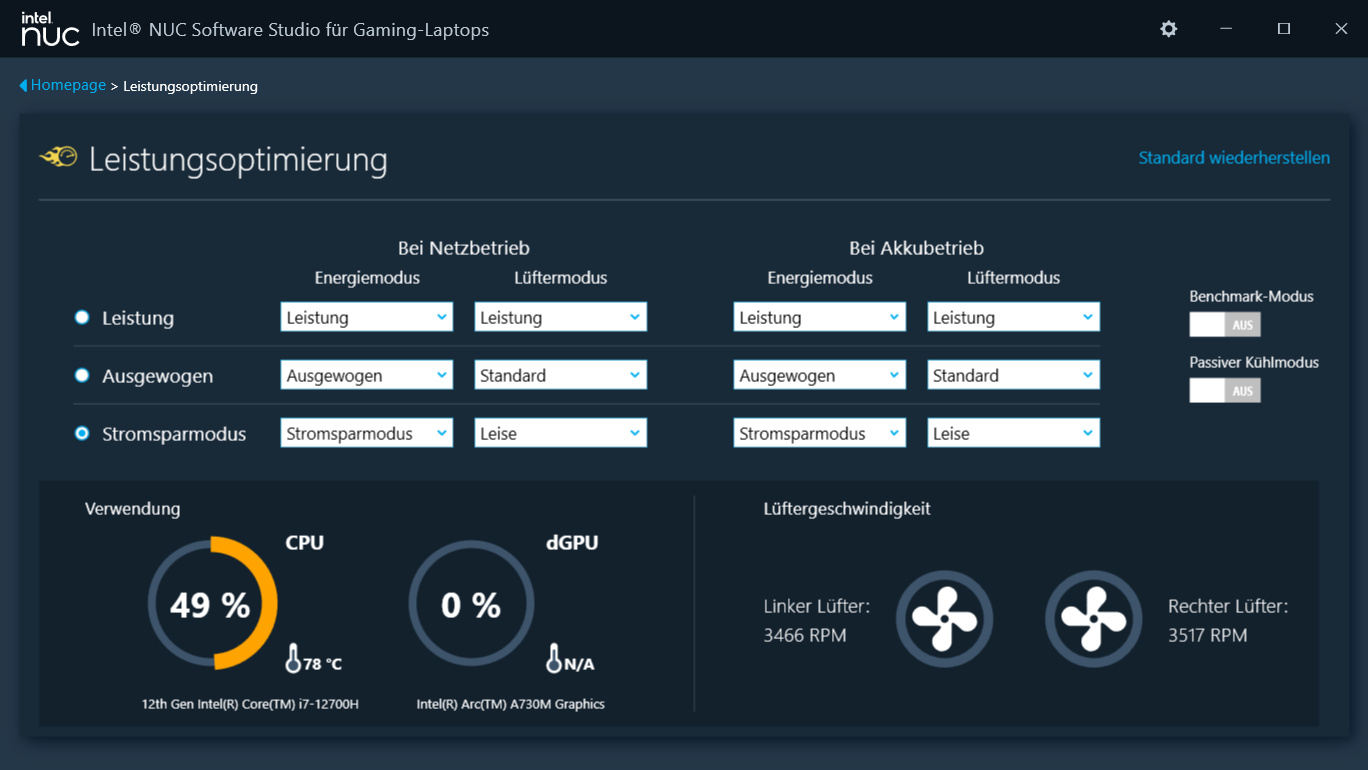
Testing conditions
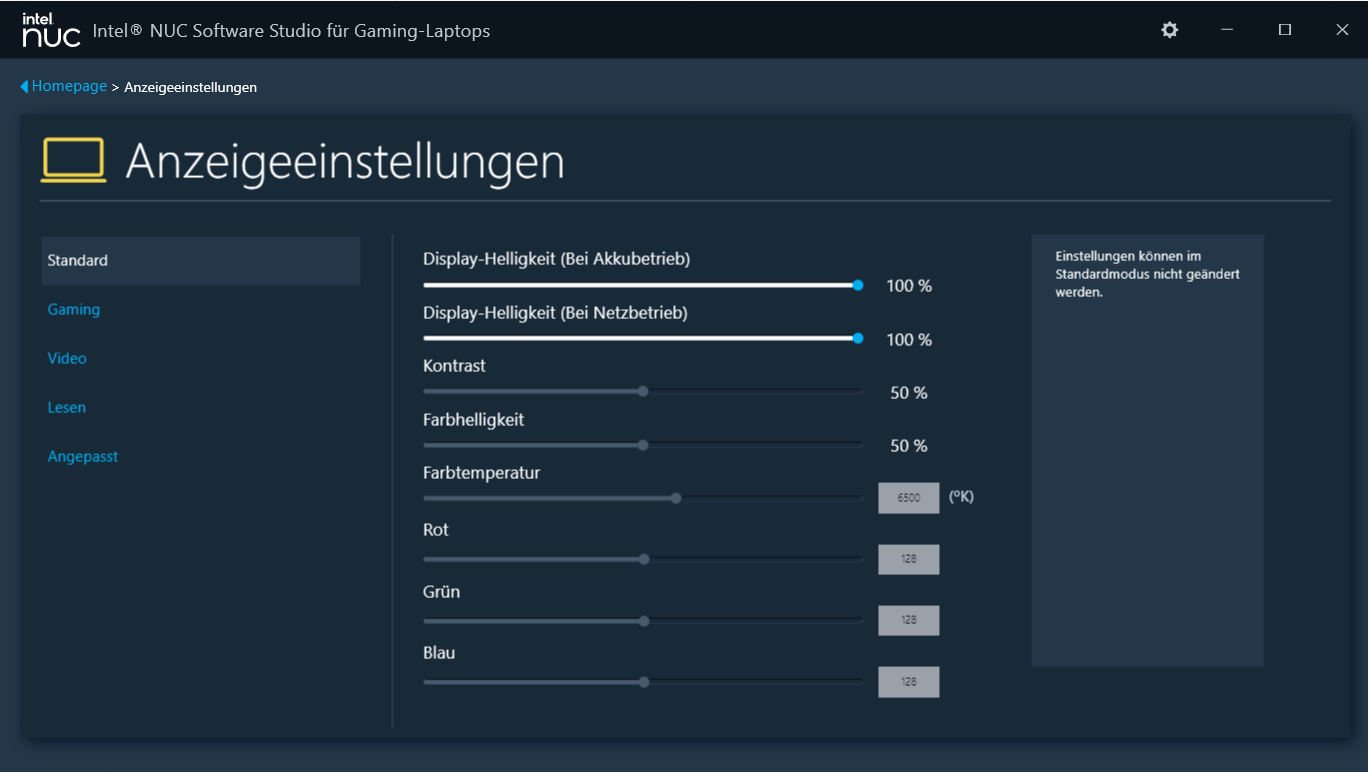
The Intel NUC Software Studio (Control Center) provides three profiles to influence its performance and fan control (see table). The profiles "Performance" (benchmarks) and "Power Saving Mode" (battery tests) were used to perform this test. Its maximum performance is only available after activating the "Benchmark Mode" option. However, the fans then also run permanently at full power.
| Performance | Balanced | Power Saving Mode | Benchmark Mode | |
|---|---|---|---|---|
| Power Limit 1 (HWInfo) | 45 watts | 35 watts | 35 watts | 45 watts |
| Power Limit 2 (HWInfo) | 90 watts | 80 watts | 65 watts | 90 watts |
| TGP (Arc Control) | 75 watts | 65 watts | 55 watts | 85 watts |
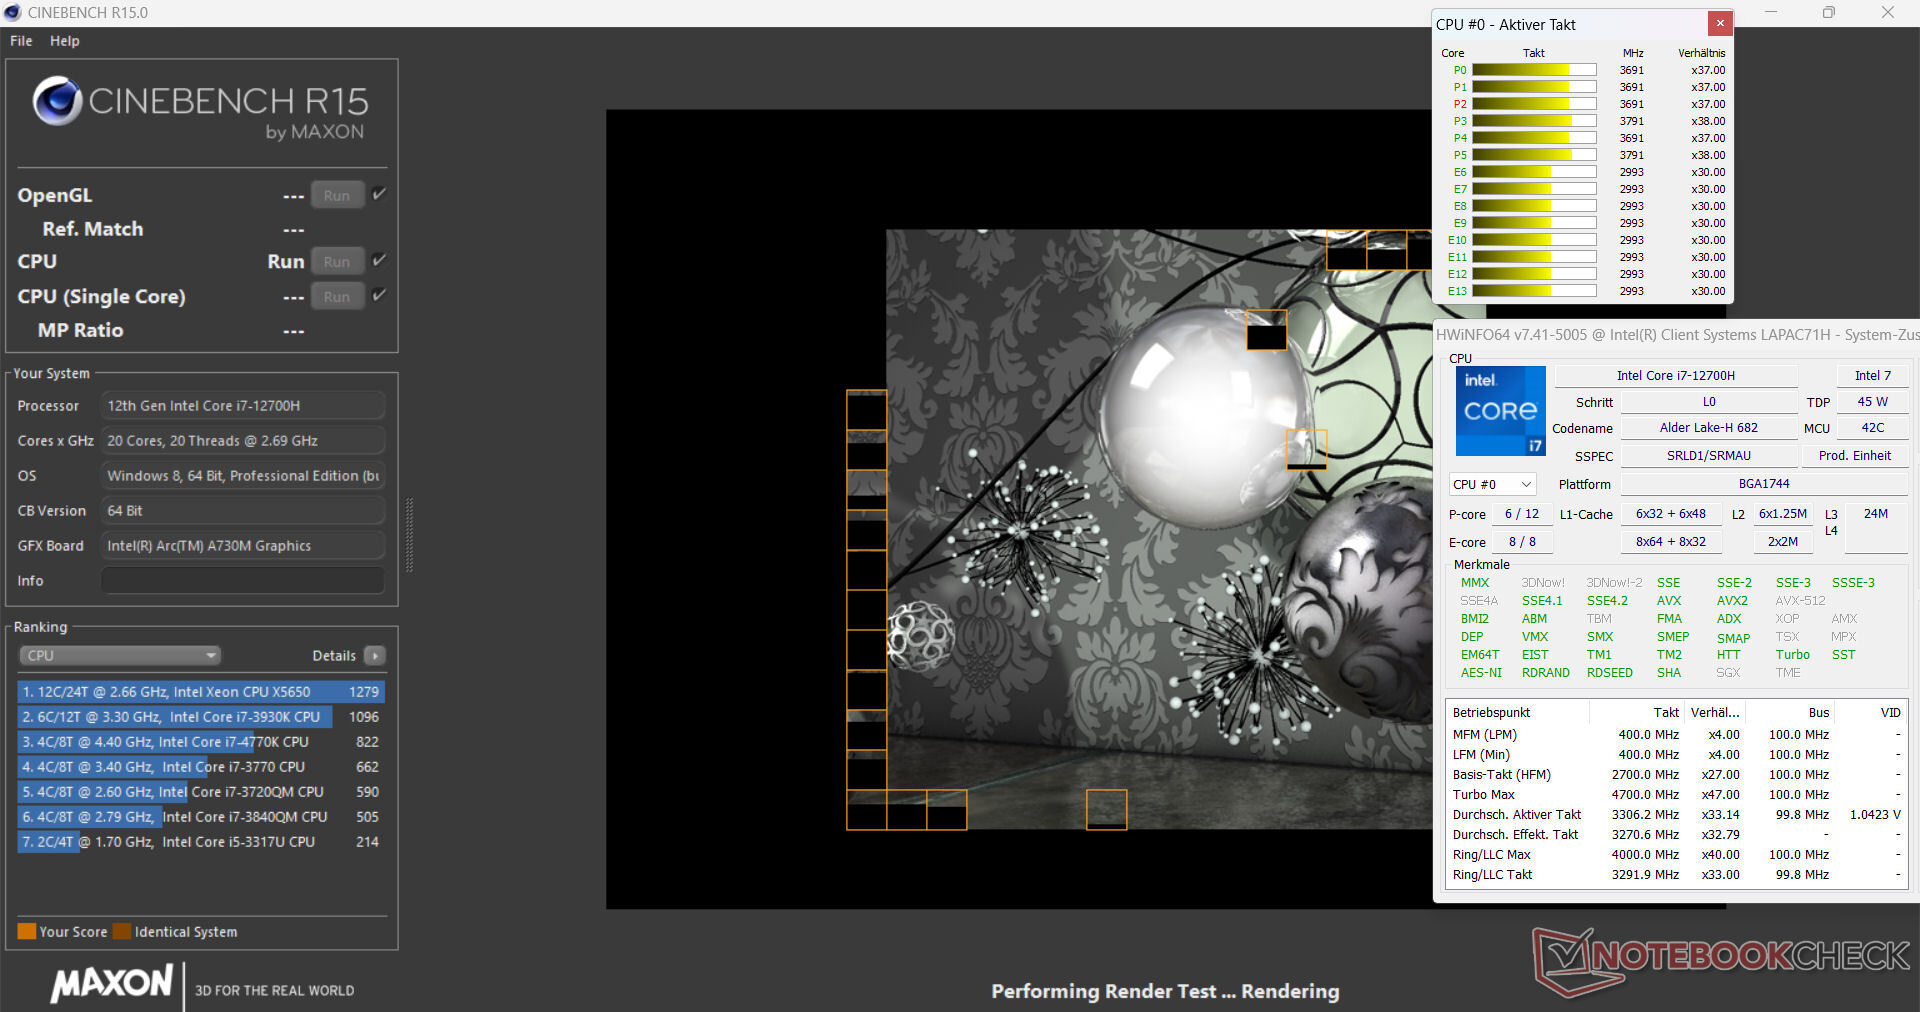
Processor
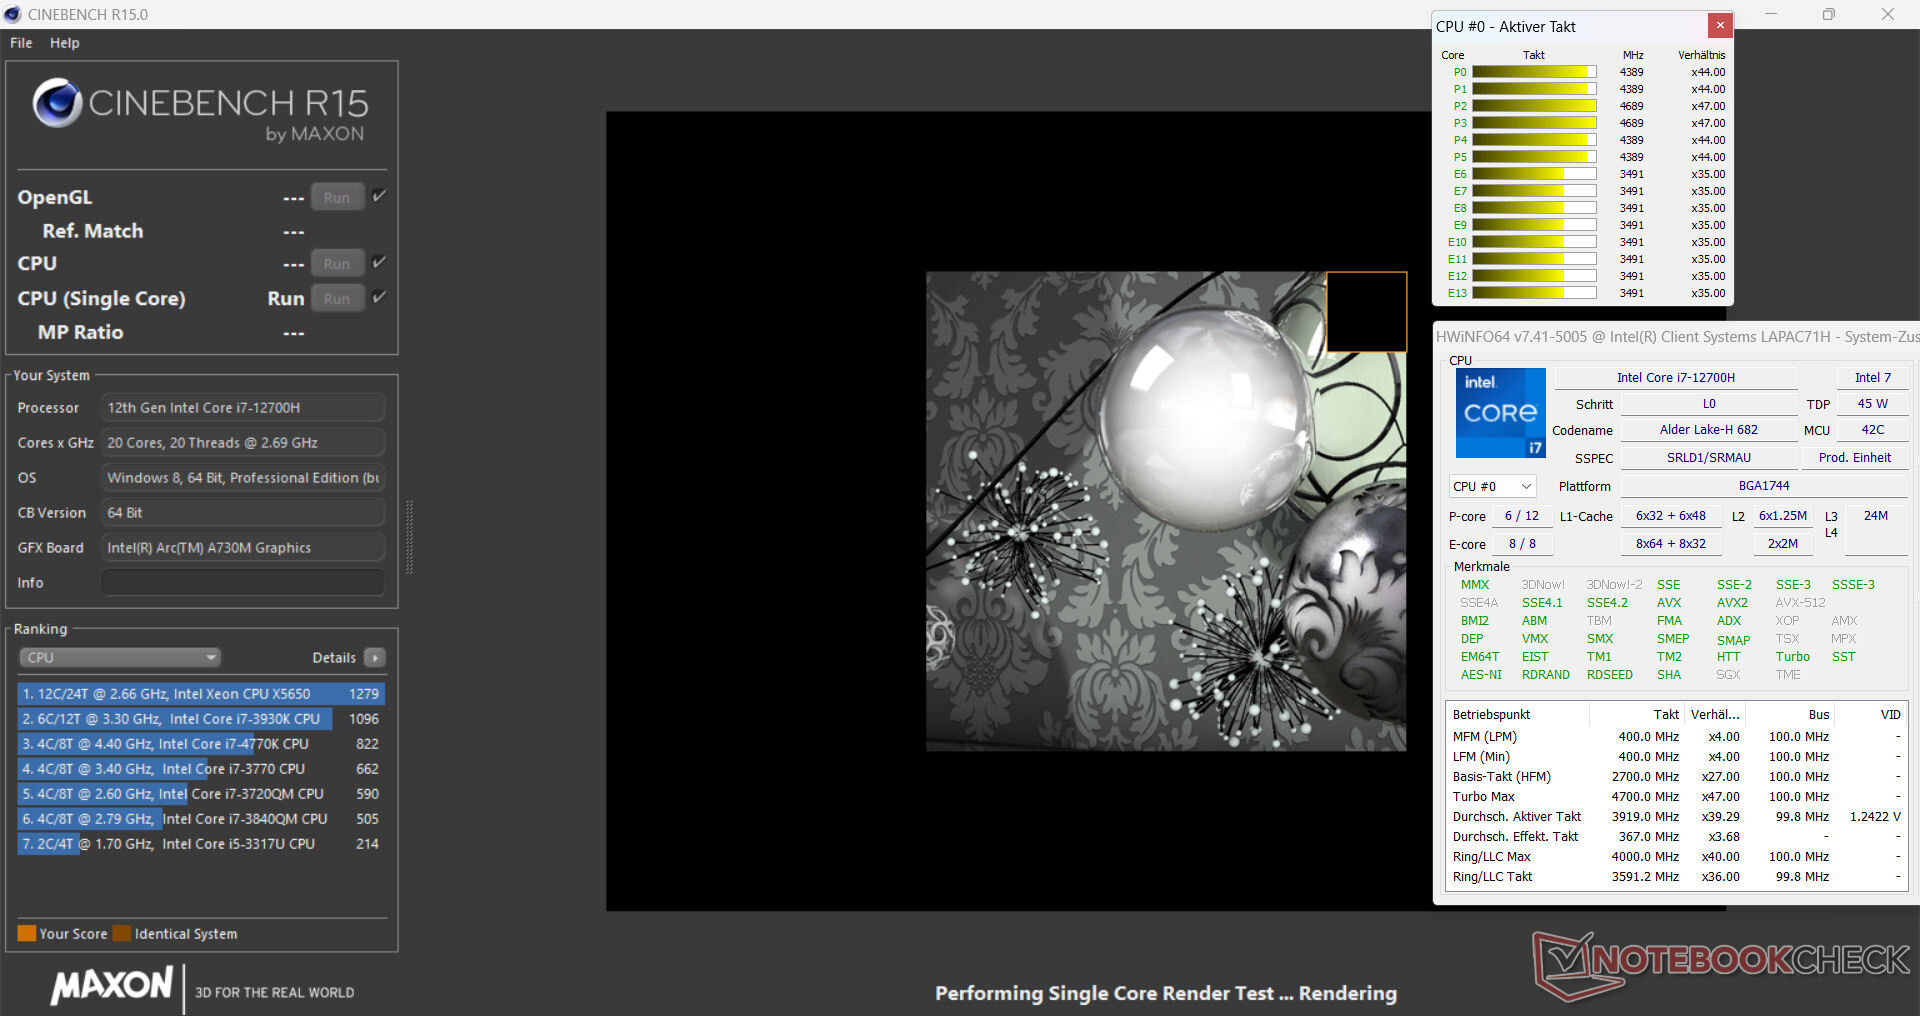
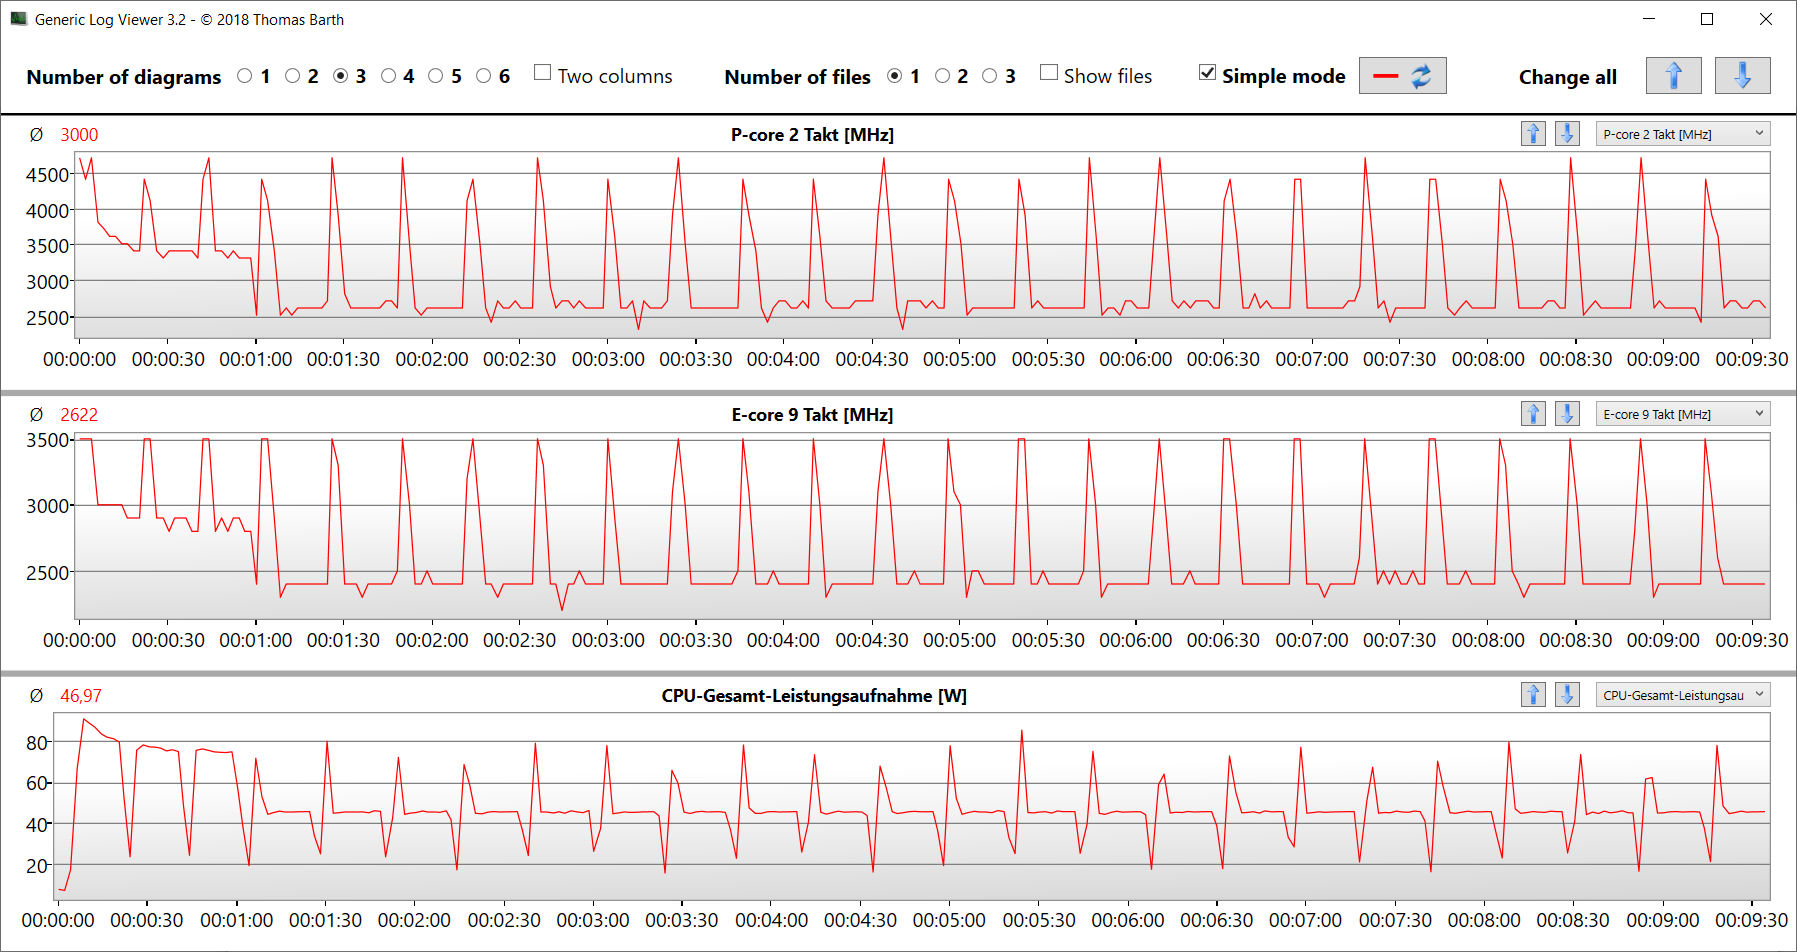
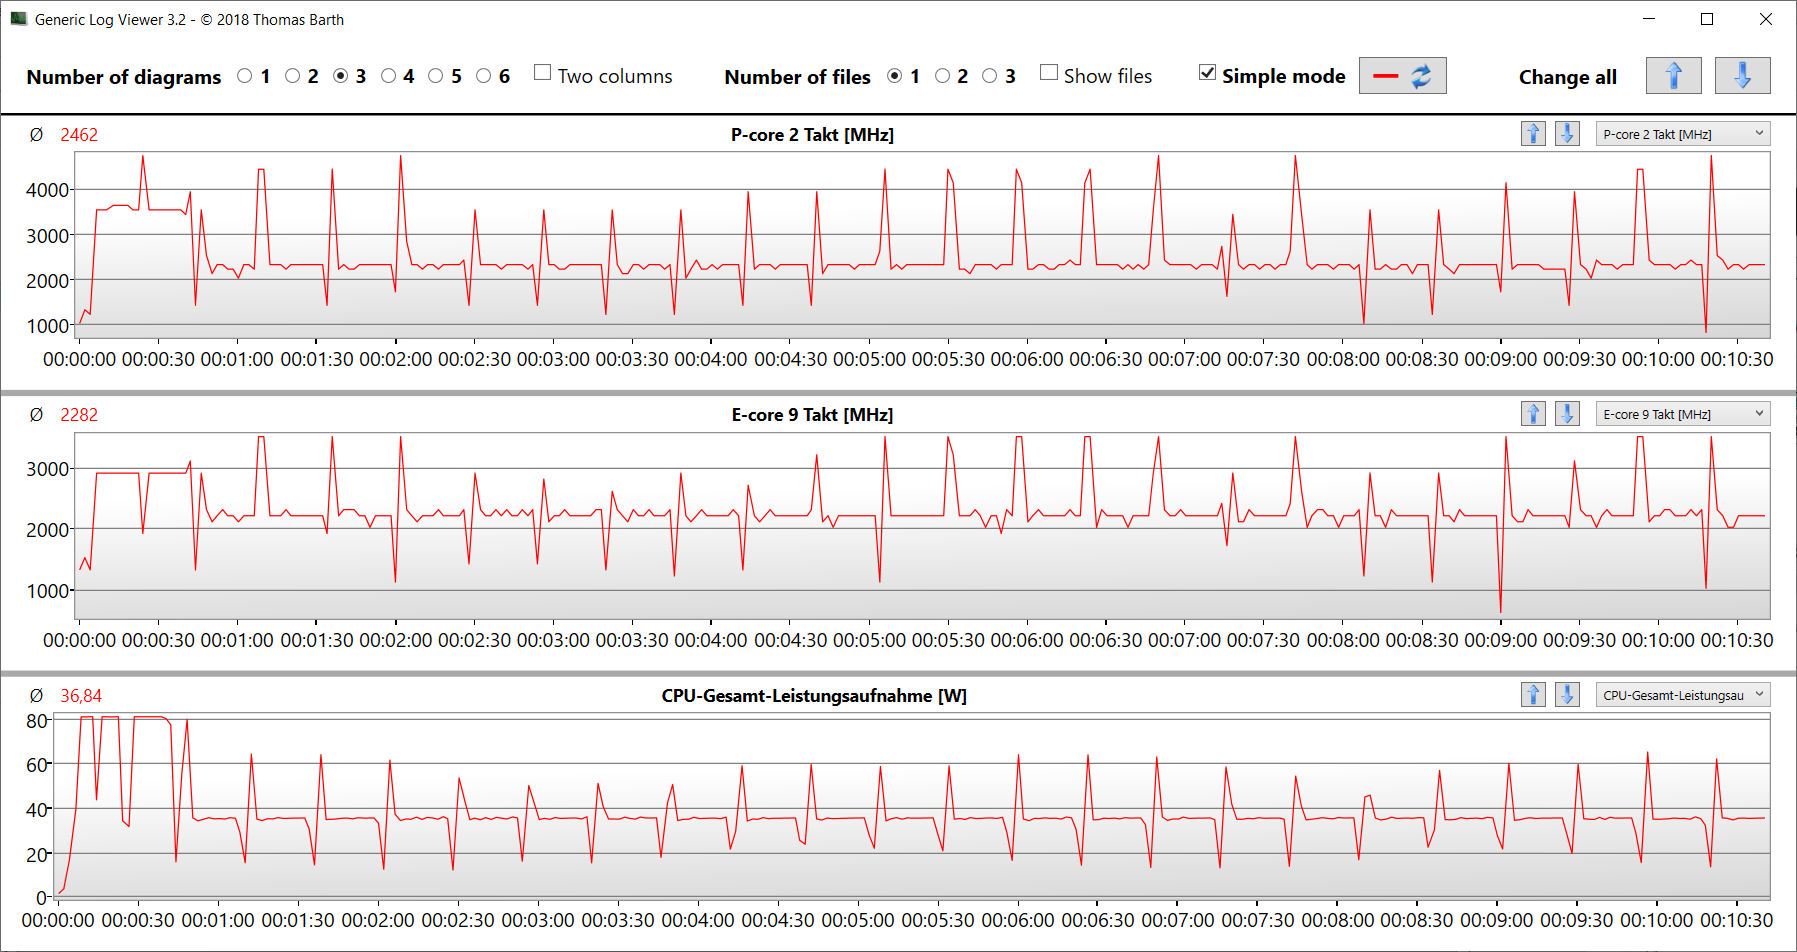
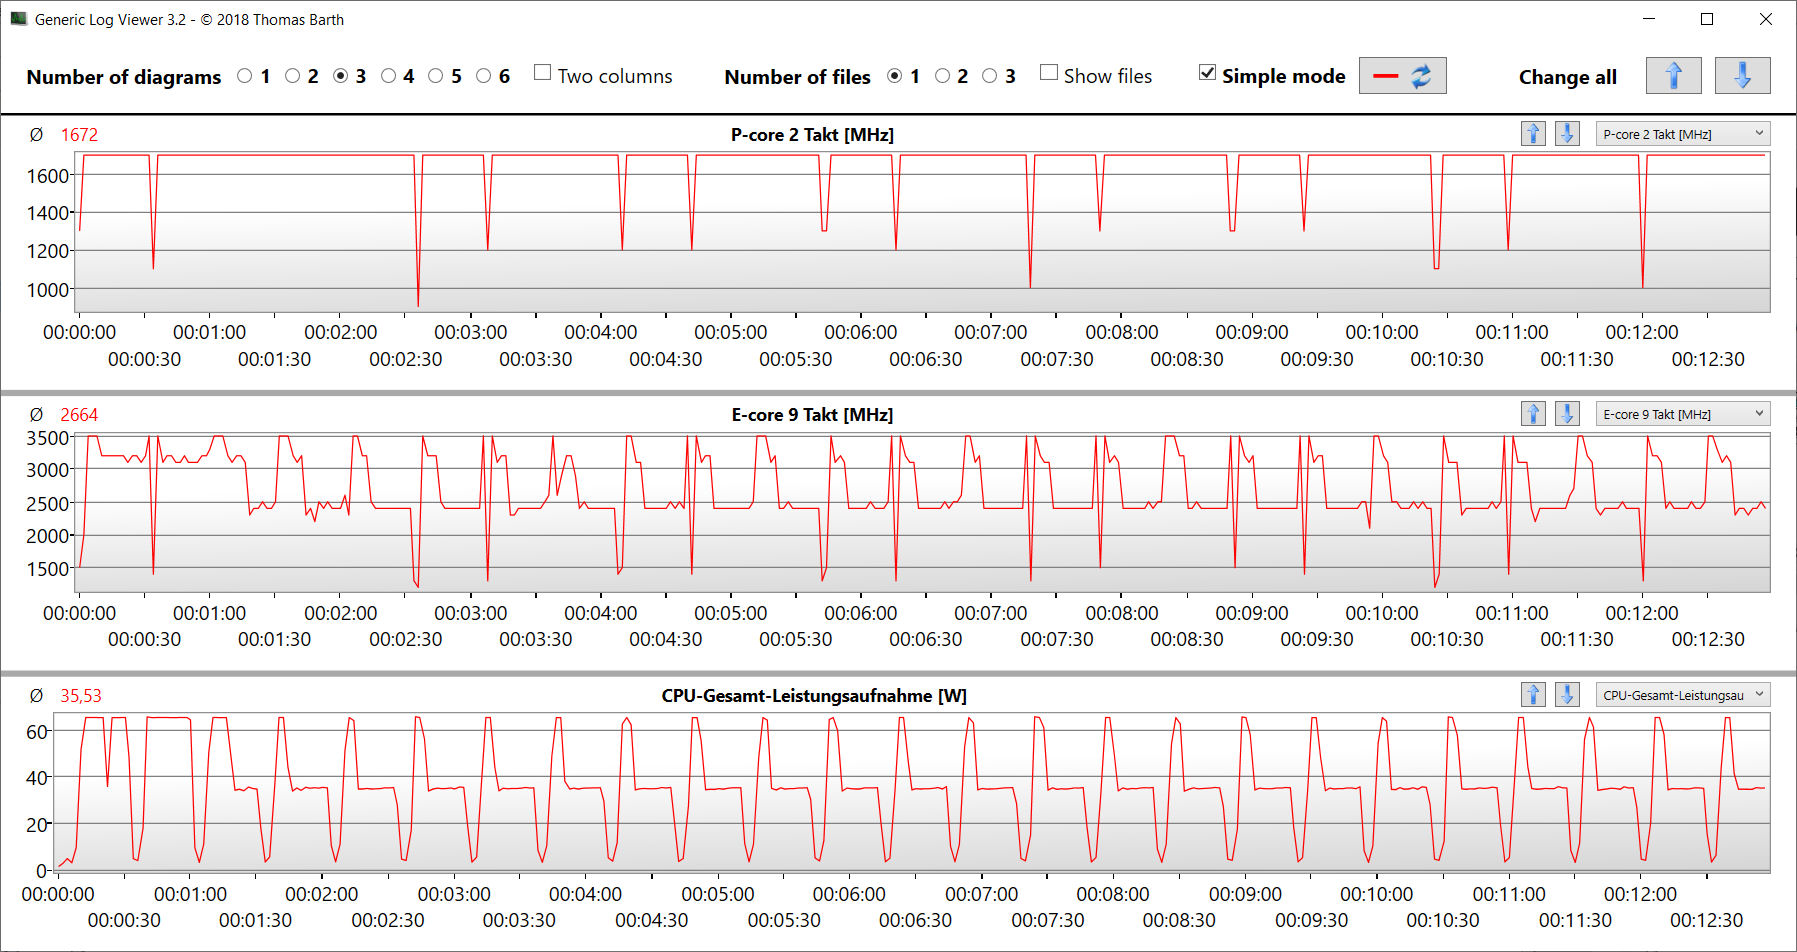
The Core i7-12700H's 14 CPU cores (6P, 8E) achieve maximum clock rates of 4.7 GHz (P) and 3.5 GHz (E). Continuous multi-thread performance (CB15 Loop) led the turbo clock to sink from the first to the second run. After this, it remained stable.
The benchmark results were slightly above the CPU average when connected to the mains. In battery mode, its more relevant single-thread performance (213 points) dropped to a lesser extent than its multi-thread performance (1,012 points).
Cinebench R15 Multi continuous test
| Cinebench R23 | |
| Multi Core | |
| Intel NUC X15 LAPAC71H | |
| Dell Inspiron 16 Plus 7630 | |
| Average Intel Core i7-12700H (4032 - 19330, n=63) | |
| Asus VivoBook Pro 16 | |
| MSI Cyborg 15 A12VF | |
| Asus TUF A15 FA507 | |
| Gigabyte G5 KE | |
| Average of class Multimedia (3127 - 30789, n=96, last 2 years) | |
| Single Core | |
| Dell Inspiron 16 Plus 7630 | |
| Intel NUC X15 LAPAC71H | |
| MSI Cyborg 15 A12VF | |
| Average Intel Core i7-12700H (778 - 1826, n=62) | |
| Asus VivoBook Pro 16 | |
| Average of class Multimedia (819 - 2110, n=93, last 2 years) | |
| Gigabyte G5 KE | |
| Asus TUF A15 FA507 | |
| Cinebench R20 | |
| CPU (Multi Core) | |
| Intel NUC X15 LAPAC71H | |
| Dell Inspiron 16 Plus 7630 | |
| Average Intel Core i7-12700H (1576 - 7407, n=63) | |
| Asus VivoBook Pro 16 | |
| MSI Cyborg 15 A12VF | |
| Asus TUF A15 FA507 | |
| Gigabyte G5 KE | |
| Average of class Multimedia (1192 - 11768, n=94, last 2 years) | |
| CPU (Single Core) | |
| Dell Inspiron 16 Plus 7630 | |
| Intel NUC X15 LAPAC71H | |
| MSI Cyborg 15 A12VF | |
| Average Intel Core i7-12700H (300 - 704, n=63) | |
| Asus VivoBook Pro 16 | |
| Gigabyte G5 KE | |
| Average of class Multimedia (316 - 812, n=94, last 2 years) | |
| Asus TUF A15 FA507 | |
| Cinebench R15 | |
| CPU Multi 64Bit | |
| Average Intel Core i7-12700H (1379 - 2916, n=69) | |
| Intel NUC X15 LAPAC71H | |
| Asus VivoBook Pro 16 | |
| Dell Inspiron 16 Plus 7630 | |
| Asus TUF A15 FA507 | |
| MSI Cyborg 15 A12VF | |
| Average of class Multimedia (570 - 4703, n=100, last 2 years) | |
| Gigabyte G5 KE | |
| CPU Single 64Bit | |
| Dell Inspiron 16 Plus 7630 | |
| Intel NUC X15 LAPAC71H | |
| Average Intel Core i7-12700H (113 - 263, n=64) | |
| Asus VivoBook Pro 16 | |
| Asus TUF A15 FA507 | |
| Gigabyte G5 KE | |
| MSI Cyborg 15 A12VF | |
| Average of class Multimedia (119 - 308, n=96, last 2 years) | |
| Blender - v2.79 BMW27 CPU | |
| Average of class Multimedia (107 - 956, n=90, last 2 years) | |
| MSI Cyborg 15 A12VF | |
| Intel NUC X15 LAPAC71H | |
| Gigabyte G5 KE | |
| Asus VivoBook Pro 16 | |
| Average Intel Core i7-12700H (168 - 732, n=62) | |
| Asus TUF A15 FA507 | |
| Dell Inspiron 16 Plus 7630 | |
| 7-Zip 18.03 | |
| 7z b 4 | |
| Intel NUC X15 LAPAC71H | |
| Asus TUF A15 FA507 | |
| Average Intel Core i7-12700H (22844 - 73067, n=62) | |
| Dell Inspiron 16 Plus 7630 | |
| MSI Cyborg 15 A12VF | |
| Gigabyte G5 KE | |
| Average of class Multimedia (11813 - 119900, n=90, last 2 years) | |
| Asus VivoBook Pro 16 | |
| 7z b 4 -mmt1 | |
| Intel NUC X15 LAPAC71H | |
| Asus TUF A15 FA507 | |
| MSI Cyborg 15 A12VF | |
| Dell Inspiron 16 Plus 7630 | |
| Average Intel Core i7-12700H (2743 - 5972, n=62) | |
| Asus VivoBook Pro 16 | |
| Average of class Multimedia (2898 - 7163, n=90, last 2 years) | |
| Gigabyte G5 KE | |
| Geekbench 5.5 | |
| Multi-Core | |
| Intel NUC X15 LAPAC71H | |
| Dell Inspiron 16 Plus 7630 | |
| Average Intel Core i7-12700H (5144 - 13745, n=63) | |
| MSI Cyborg 15 A12VF | |
| Gigabyte G5 KE | |
| Average of class Multimedia (3307 - 20053, n=98, last 2 years) | |
| Asus TUF A15 FA507 | |
| Asus VivoBook Pro 16 | |
| Single-Core | |
| Dell Inspiron 16 Plus 7630 | |
| MSI Cyborg 15 A12VF | |
| Intel NUC X15 LAPAC71H | |
| Average Intel Core i7-12700H (803 - 1851, n=63) | |
| Asus VivoBook Pro 16 | |
| Average of class Multimedia (843 - 2137, n=98, last 2 years) | |
| Gigabyte G5 KE | |
| Asus TUF A15 FA507 | |
| HWBOT x265 Benchmark v2.2 - 4k Preset | |
| Asus TUF A15 FA507 | |
| Intel NUC X15 LAPAC71H | |
| Average Intel Core i7-12700H (4.67 - 21.8, n=63) | |
| Gigabyte G5 KE | |
| MSI Cyborg 15 A12VF | |
| MSI Cyborg 15 A12VF | |
| Dell Inspiron 16 Plus 7630 | |
| Asus VivoBook Pro 16 | |
| Average of class Multimedia (4.12 - 30.5, n=88, last 2 years) | |
| LibreOffice - 20 Documents To PDF | |
| Gigabyte G5 KE | |
| Asus TUF A15 FA507 | |
| Average of class Multimedia (6.7 - 89.1, n=90, last 2 years) | |
| Asus VivoBook Pro 16 | |
| Average Intel Core i7-12700H (34.2 - 95.3, n=62) | |
| Dell Inspiron 16 Plus 7630 | |
| MSI Cyborg 15 A12VF | |
| Intel NUC X15 LAPAC71H | |
| R Benchmark 2.5 - Overall mean | |
| Average of class Multimedia (0.3826 - 0.994, n=90, last 2 years) | |
| Asus TUF A15 FA507 | |
| Asus VivoBook Pro 16 | |
| Gigabyte G5 KE | |
| Average Intel Core i7-12700H (0.4441 - 1.052, n=62) | |
| MSI Cyborg 15 A12VF | |
| Intel NUC X15 LAPAC71H | |
| Dell Inspiron 16 Plus 7630 | |
* ... smaller is better
AIDA64: FP32 Ray-Trace | FPU Julia | CPU SHA3 | CPU Queen | FPU SinJulia | FPU Mandel | CPU AES | CPU ZLib | FP64 Ray-Trace | CPU PhotoWorxx
| Performance Rating | |
| Asus TUF A15 FA507 | |
| Intel NUC X15 LAPAC71H | |
| Dell Inspiron 16 Plus 7630 | |
| Gigabyte G5 KE | |
| Asus VivoBook Pro 16 | |
| MSI Cyborg 15 A12VF | |
| Average Intel Core i7-12700H | |
| Average of class Multimedia | |
| AIDA64 / FP32 Ray-Trace | |
| Asus TUF A15 FA507 | |
| Asus VivoBook Pro 16 | |
| Dell Inspiron 16 Plus 7630 | |
| Intel NUC X15 LAPAC71H | |
| MSI Cyborg 15 A12VF | |
| Gigabyte G5 KE | |
| Average of class Multimedia (2677 - 27340, n=87, last 2 years) | |
| Average Intel Core i7-12700H (2585 - 17957, n=62) | |
| AIDA64 / FPU Julia | |
| Asus TUF A15 FA507 | |
| Asus VivoBook Pro 16 | |
| MSI Cyborg 15 A12VF | |
| Dell Inspiron 16 Plus 7630 | |
| Gigabyte G5 KE | |
| Intel NUC X15 LAPAC71H | |
| Average of class Multimedia (12762 - 136048, n=87, last 2 years) | |
| Average Intel Core i7-12700H (12439 - 90760, n=62) | |
| AIDA64 / CPU SHA3 | |
| Asus TUF A15 FA507 | |
| Asus VivoBook Pro 16 | |
| Gigabyte G5 KE | |
| Average Intel Core i7-12700H (833 - 4242, n=62) | |
| Dell Inspiron 16 Plus 7630 | |
| Intel NUC X15 LAPAC71H | |
| MSI Cyborg 15 A12VF | |
| Average of class Multimedia (841 - 6681, n=87, last 2 years) | |
| AIDA64 / CPU Queen | |
| Dell Inspiron 16 Plus 7630 | |
| Asus TUF A15 FA507 | |
| Asus VivoBook Pro 16 | |
| Intel NUC X15 LAPAC71H | |
| Average Intel Core i7-12700H (57923 - 103202, n=62) | |
| Average of class Multimedia (31314 - 134321, n=87, last 2 years) | |
| MSI Cyborg 15 A12VF | |
| Gigabyte G5 KE | |
| AIDA64 / FPU SinJulia | |
| Asus TUF A15 FA507 | |
| Average Intel Core i7-12700H (3249 - 9939, n=62) | |
| Asus VivoBook Pro 16 | |
| Dell Inspiron 16 Plus 7630 | |
| Average of class Multimedia (3099 - 15484, n=87, last 2 years) | |
| MSI Cyborg 15 A12VF | |
| Intel NUC X15 LAPAC71H | |
| Gigabyte G5 KE | |
| AIDA64 / FPU Mandel | |
| Asus TUF A15 FA507 | |
| Asus VivoBook Pro 16 | |
| Dell Inspiron 16 Plus 7630 | |
| Gigabyte G5 KE | |
| Intel NUC X15 LAPAC71H | |
| MSI Cyborg 15 A12VF | |
| Average of class Multimedia (7417 - 68591, n=87, last 2 years) | |
| Average Intel Core i7-12700H (7135 - 44760, n=62) | |
| AIDA64 / CPU AES | |
| Intel NUC X15 LAPAC71H | |
| Gigabyte G5 KE | |
| Average Intel Core i7-12700H (31839 - 144360, n=62) | |
| Average of class Multimedia (23702 - 151546, n=87, last 2 years) | |
| Asus TUF A15 FA507 | |
| Asus VivoBook Pro 16 | |
| MSI Cyborg 15 A12VF | |
| Dell Inspiron 16 Plus 7630 | |
| AIDA64 / CPU ZLib | |
| Average Intel Core i7-12700H (305 - 1171, n=62) | |
| Asus VivoBook Pro 16 | |
| Gigabyte G5 KE | |
| MSI Cyborg 15 A12VF | |
| Intel NUC X15 LAPAC71H | |
| Dell Inspiron 16 Plus 7630 | |
| Average of class Multimedia (228 - 1901, n=88, last 2 years) | |
| Asus TUF A15 FA507 | |
| AIDA64 / FP64 Ray-Trace | |
| Asus TUF A15 FA507 | |
| Asus VivoBook Pro 16 | |
| Dell Inspiron 16 Plus 7630 | |
| Gigabyte G5 KE | |
| Intel NUC X15 LAPAC71H | |
| MSI Cyborg 15 A12VF | |
| Average of class Multimedia (1501 - 14155, n=88, last 2 years) | |
| Average Intel Core i7-12700H (1437 - 9692, n=62) | |
| AIDA64 / CPU PhotoWorxx | |
| Intel NUC X15 LAPAC71H | |
| Dell Inspiron 16 Plus 7630 | |
| MSI Cyborg 15 A12VF | |
| Average Intel Core i7-12700H (12863 - 52207, n=62) | |
| Average of class Multimedia (7419 - 52727, n=88, last 2 years) | |
| Gigabyte G5 KE | |
| Asus TUF A15 FA507 | |
| Asus VivoBook Pro 16 | |
System performance
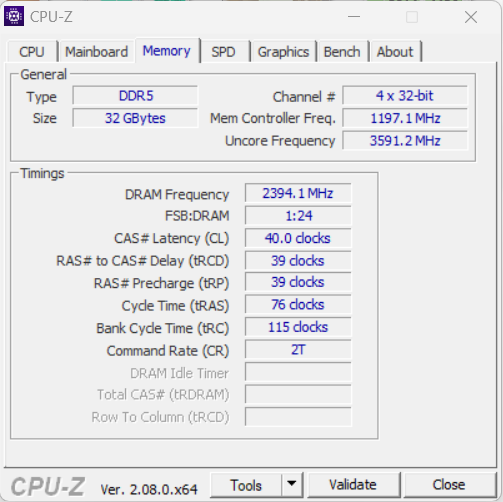
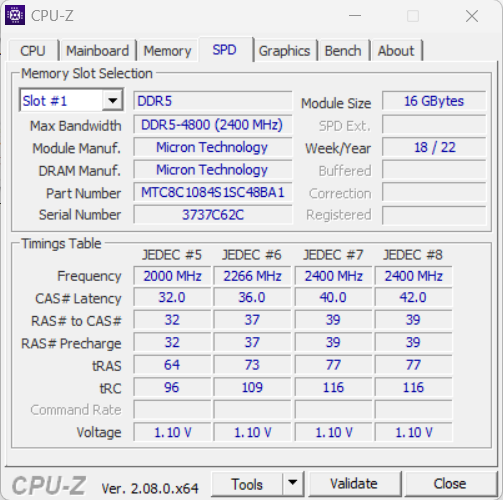
The smoothly running system does not lack computing power. The laptop handles gaming, streaming and rendering without any problems. The RAM's transfer rates are on a normal level for DDR5-4800 RAM.
CrossMark: Overall | Productivity | Creativity | Responsiveness
| PCMark 10 / Score | |
| Dell Inspiron 16 Plus 7630 | |
| Asus TUF A15 FA507 | |
| Gigabyte G5 KE | |
| MSI Cyborg 15 A12VF | |
| Intel NUC X15 LAPAC71H | |
| Average Intel Core i7-12700H, Intel Arc A730M (6830 - 6845, n=2) | |
| Asus VivoBook Pro 16 | |
| Average of class Multimedia (4039 - 8083, n=83, last 2 years) | |
| PCMark 10 / Essentials | |
| Dell Inspiron 16 Plus 7630 | |
| Gigabyte G5 KE | |
| Average Intel Core i7-12700H, Intel Arc A730M (10529 - 11116, n=2) | |
| MSI Cyborg 15 A12VF | |
| Asus TUF A15 FA507 | |
| Intel NUC X15 LAPAC71H | |
| Average of class Multimedia (8448 - 12144, n=83, last 2 years) | |
| Asus VivoBook Pro 16 | |
| PCMark 10 / Productivity | |
| MSI Cyborg 15 A12VF | |
| Gigabyte G5 KE | |
| Dell Inspiron 16 Plus 7630 | |
| Asus TUF A15 FA507 | |
| Asus VivoBook Pro 16 | |
| Average of class Multimedia (5462 - 11186, n=83, last 2 years) | |
| Average Intel Core i7-12700H, Intel Arc A730M (7070 - 7260, n=2) | |
| Intel NUC X15 LAPAC71H | |
| PCMark 10 / Digital Content Creation | |
| Intel NUC X15 LAPAC71H | |
| Dell Inspiron 16 Plus 7630 | |
| Average Intel Core i7-12700H, Intel Arc A730M (10714 - 11691, n=2) | |
| Asus TUF A15 FA507 | |
| Gigabyte G5 KE | |
| Asus VivoBook Pro 16 | |
| MSI Cyborg 15 A12VF | |
| Average of class Multimedia (3861 - 11777, n=83, last 2 years) | |
| CrossMark / Overall | |
| Intel NUC X15 LAPAC71H | |
| Average Intel Core i7-12700H, Intel Arc A730M | |
| Dell Inspiron 16 Plus 7630 | |
| MSI Cyborg 15 A12VF | |
| Gigabyte G5 KE | |
| Asus VivoBook Pro 16 | |
| Average of class Multimedia (970 - 2146, n=78, last 2 years) | |
| Asus TUF A15 FA507 | |
| CrossMark / Productivity | |
| Intel NUC X15 LAPAC71H | |
| Average Intel Core i7-12700H, Intel Arc A730M | |
| Dell Inspiron 16 Plus 7630 | |
| Gigabyte G5 KE | |
| MSI Cyborg 15 A12VF | |
| Asus VivoBook Pro 16 | |
| Average of class Multimedia (921 - 2064, n=78, last 2 years) | |
| Asus TUF A15 FA507 | |
| CrossMark / Creativity | |
| Dell Inspiron 16 Plus 7630 | |
| Intel NUC X15 LAPAC71H | |
| Average Intel Core i7-12700H, Intel Arc A730M | |
| MSI Cyborg 15 A12VF | |
| Average of class Multimedia (933 - 2865, n=78, last 2 years) | |
| Gigabyte G5 KE | |
| Asus TUF A15 FA507 | |
| Asus VivoBook Pro 16 | |
| CrossMark / Responsiveness | |
| Intel NUC X15 LAPAC71H | |
| Average Intel Core i7-12700H, Intel Arc A730M | |
| Gigabyte G5 KE | |
| Asus VivoBook Pro 16 | |
| MSI Cyborg 15 A12VF | |
| Dell Inspiron 16 Plus 7630 | |
| Average of class Multimedia (926 - 2234, n=78, last 2 years) | |
| Asus TUF A15 FA507 | |
| PCMark 10 Score | 6845 points | |
Help | ||
| AIDA64 / Memory Copy | |
| Intel NUC X15 LAPAC71H | |
| Dell Inspiron 16 Plus 7630 | |
| MSI Cyborg 15 A12VF | |
| Average of class Multimedia (20513 - 92447, n=88, last 2 years) | |
| Average Intel Core i7-12700H (25615 - 80511, n=62) | |
| Asus TUF A15 FA507 | |
| Gigabyte G5 KE | |
| Asus VivoBook Pro 16 | |
| AIDA64 / Memory Read | |
| Dell Inspiron 16 Plus 7630 | |
| Intel NUC X15 LAPAC71H | |
| MSI Cyborg 15 A12VF | |
| Average Intel Core i7-12700H (25586 - 79442, n=62) | |
| Average of class Multimedia (22917 - 79656, n=87, last 2 years) | |
| Asus TUF A15 FA507 | |
| Gigabyte G5 KE | |
| Asus VivoBook Pro 16 | |
| AIDA64 / Memory Write | |
| Intel NUC X15 LAPAC71H | |
| Dell Inspiron 16 Plus 7630 | |
| Average of class Multimedia (20226 - 95196, n=87, last 2 years) | |
| MSI Cyborg 15 A12VF | |
| Asus TUF A15 FA507 | |
| Average Intel Core i7-12700H (23679 - 88660, n=62) | |
| Gigabyte G5 KE | |
| Asus VivoBook Pro 16 | |
| AIDA64 / Memory Latency | |
| Gigabyte G5 KE | |
| Average of class Multimedia (75 - 133.9, n=87, last 2 years) | |
| Dell Inspiron 16 Plus 7630 | |
| Asus VivoBook Pro 16 | |
| MSI Cyborg 15 A12VF | |
| Intel NUC X15 LAPAC71H | |
| Asus TUF A15 FA507 | |
| Average Intel Core i7-12700H (76.2 - 133.9, n=60) | |
* ... smaller is better
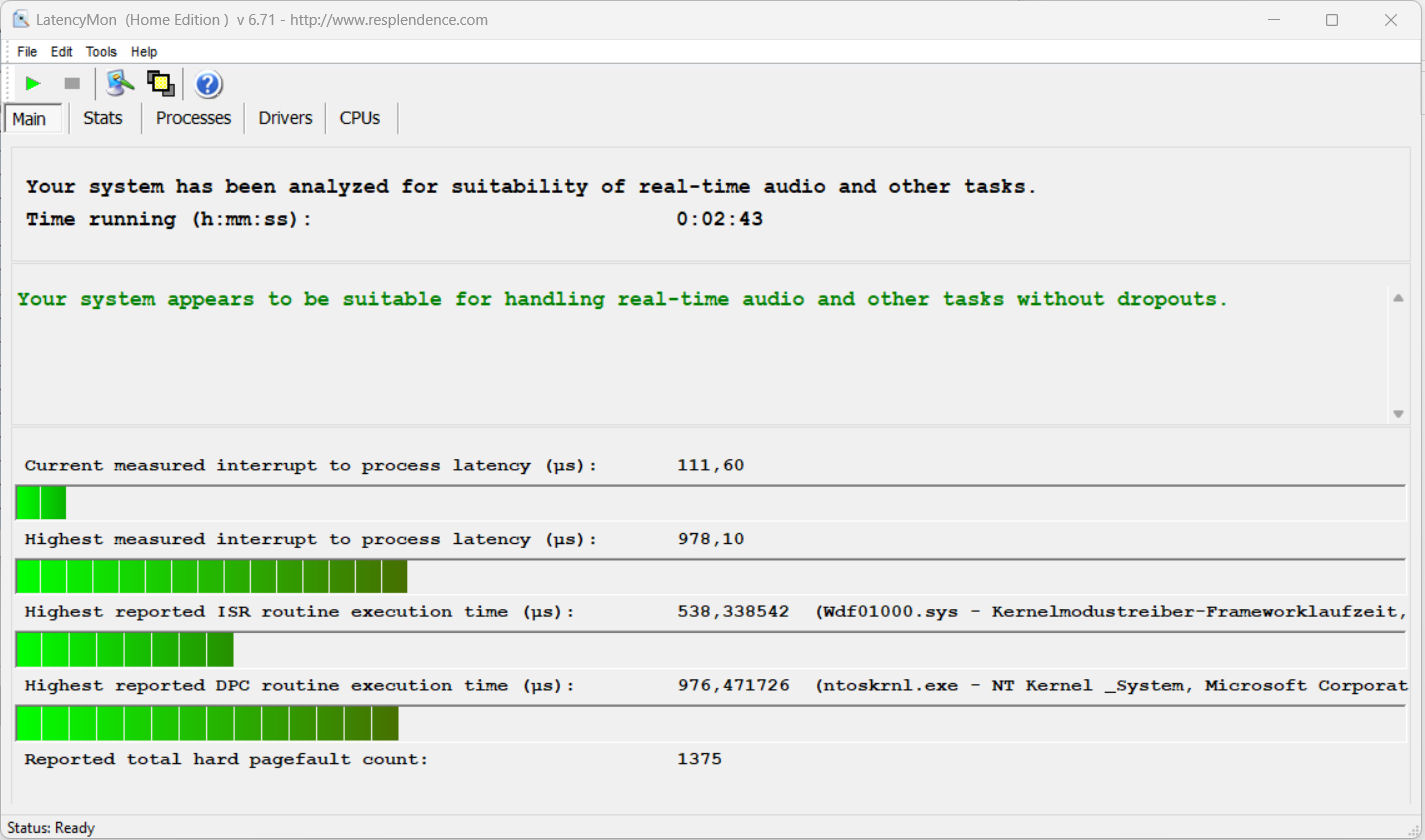
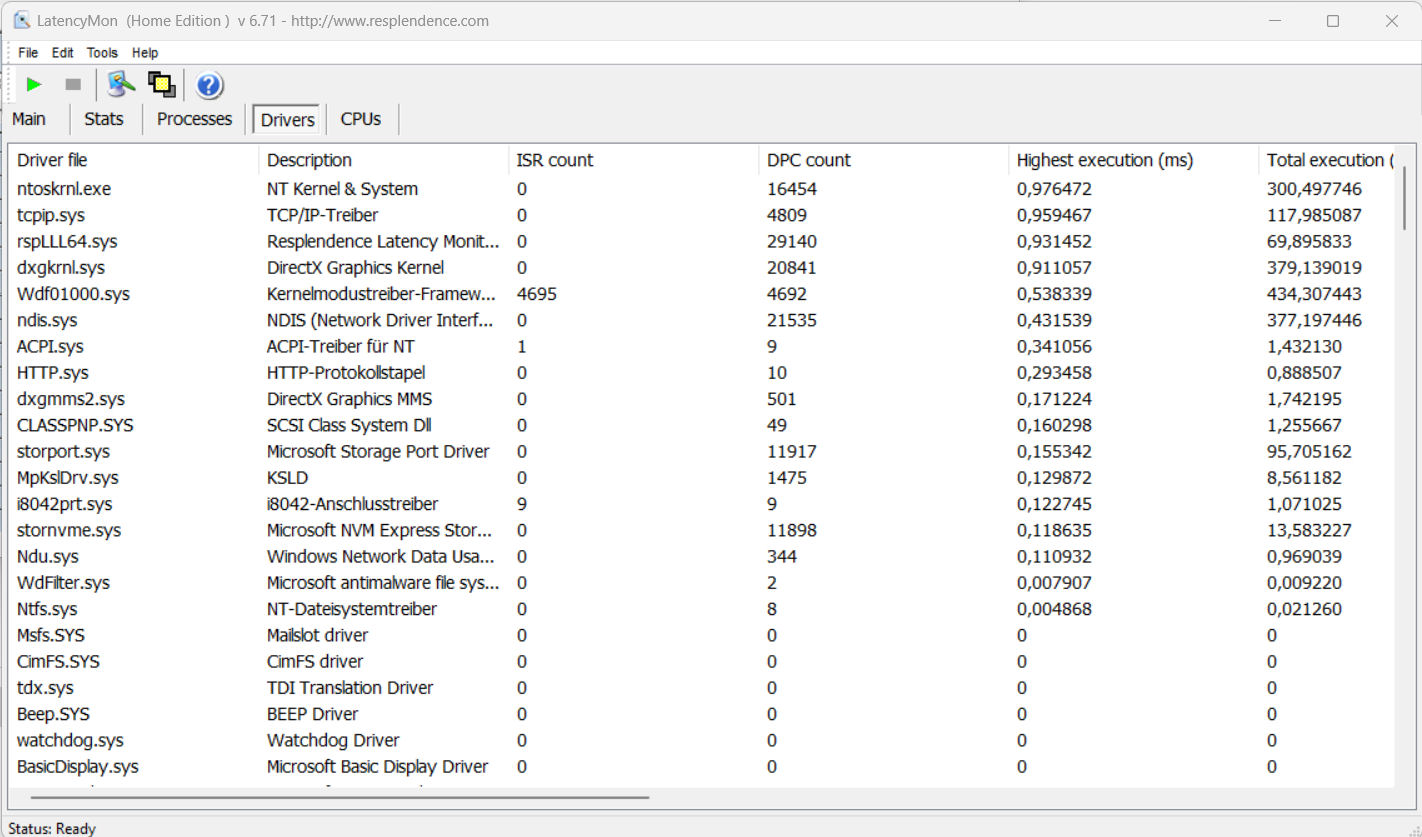
DPC latency
The standardized latency monitor test (web surfing, 4k video playback, Prime95 high-load) did not reveal any abnormalities. The system seems to be suitable for real-time video and audio editing. Future software updates could lead to improvements or even degradations.
| DPC Latencies / LatencyMon - interrupt to process latency (max), Web, Youtube, Prime95 | |
| Asus VivoBook Pro 16 | |
| MSI Cyborg 15 A12VF | |
| Dell Inspiron 16 Plus 7630 | |
| Gigabyte G5 KE | |
| Intel NUC X15 LAPAC71H | |
* ... smaller is better
Storage devices
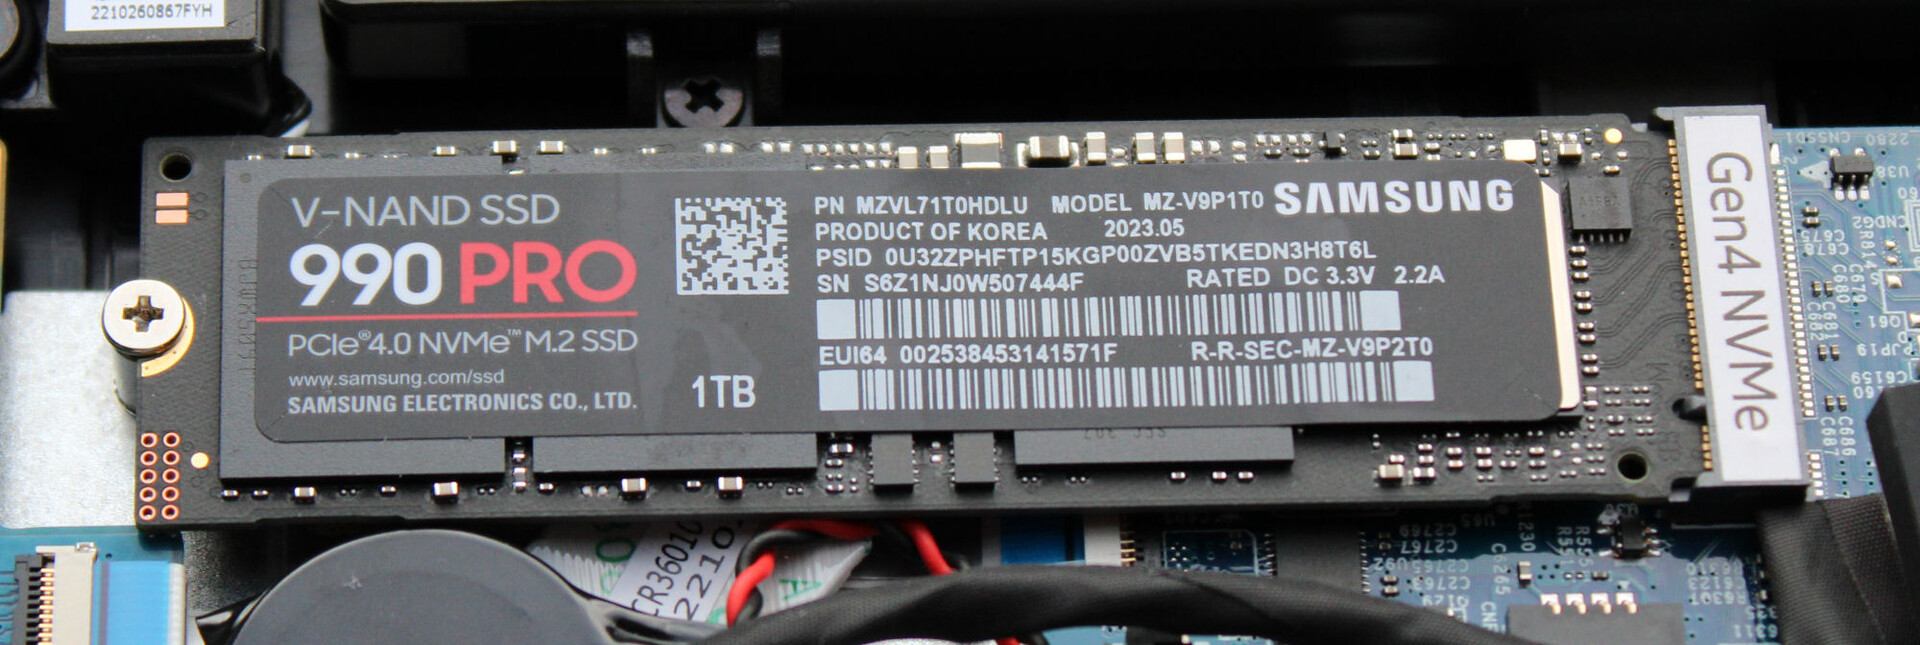
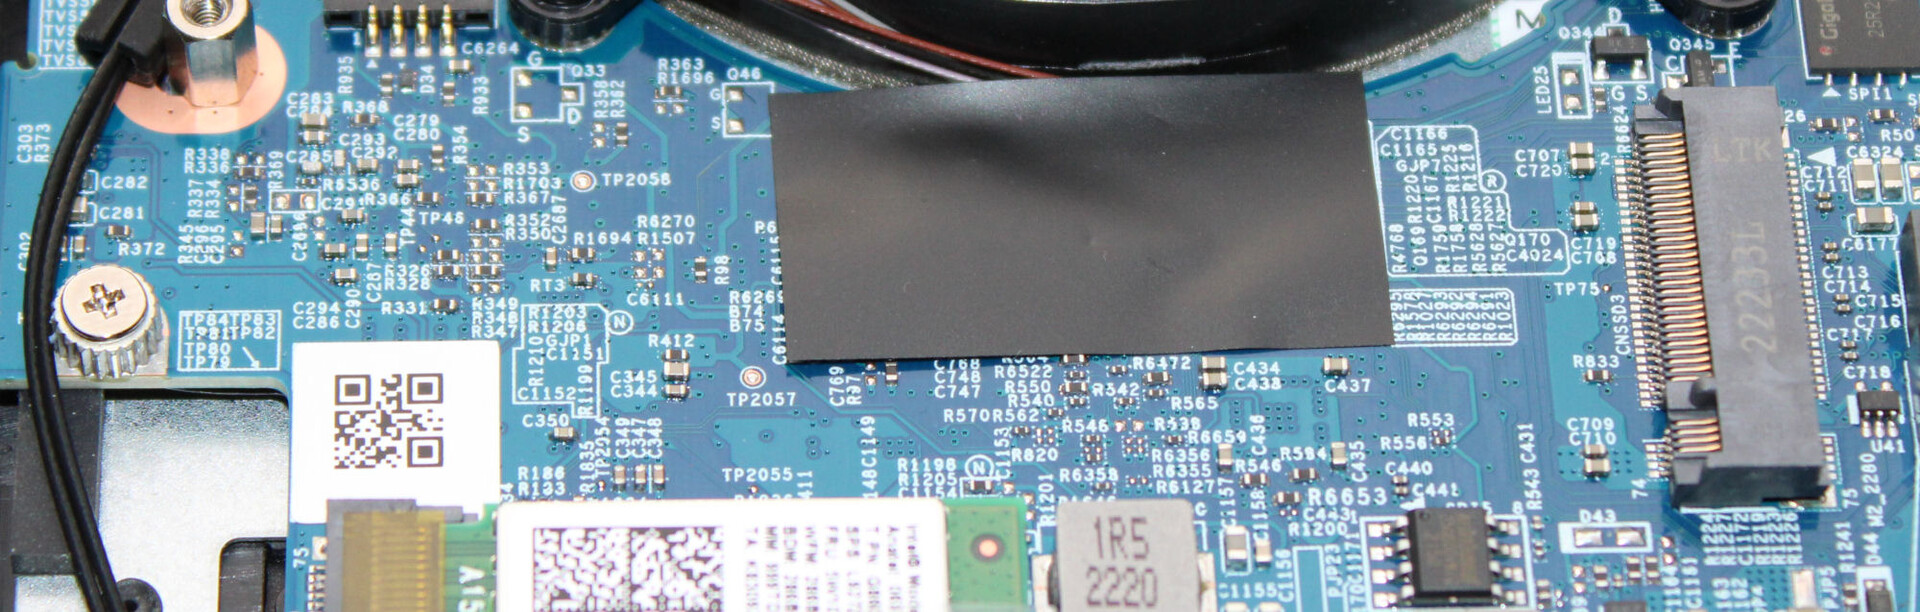
The laptop can accommodate two M.2-2280 SSDs (1x PCIe 4.0, 1x PCIe 3.0/SATA). RAID-0/1 is supported. The Samsung SSD (1 TB, PCIe 4, M.2-2280) within our test device delivered excellent transfer rates. Positive: Thermal throttling did not occur.

* ... smaller is better
Reading continuous performance: DiskSpd Read Loop, Queue Depth 8
Graphics card
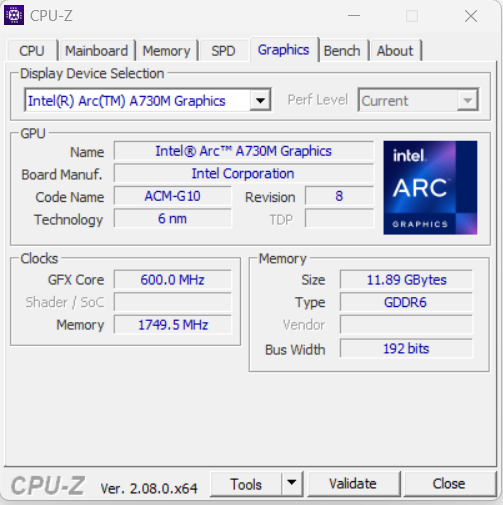
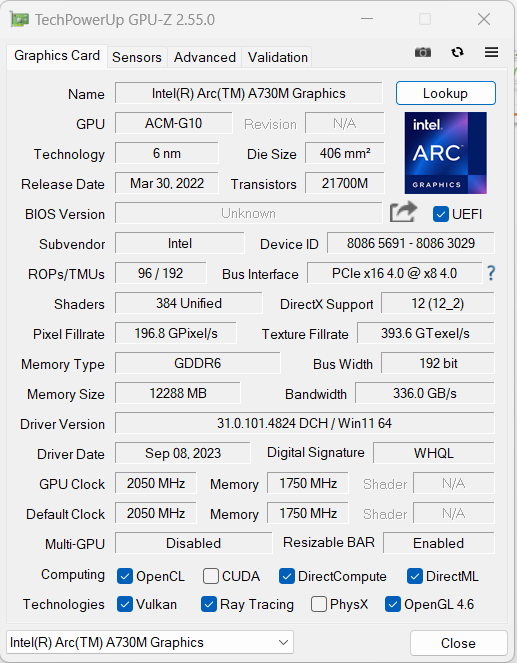
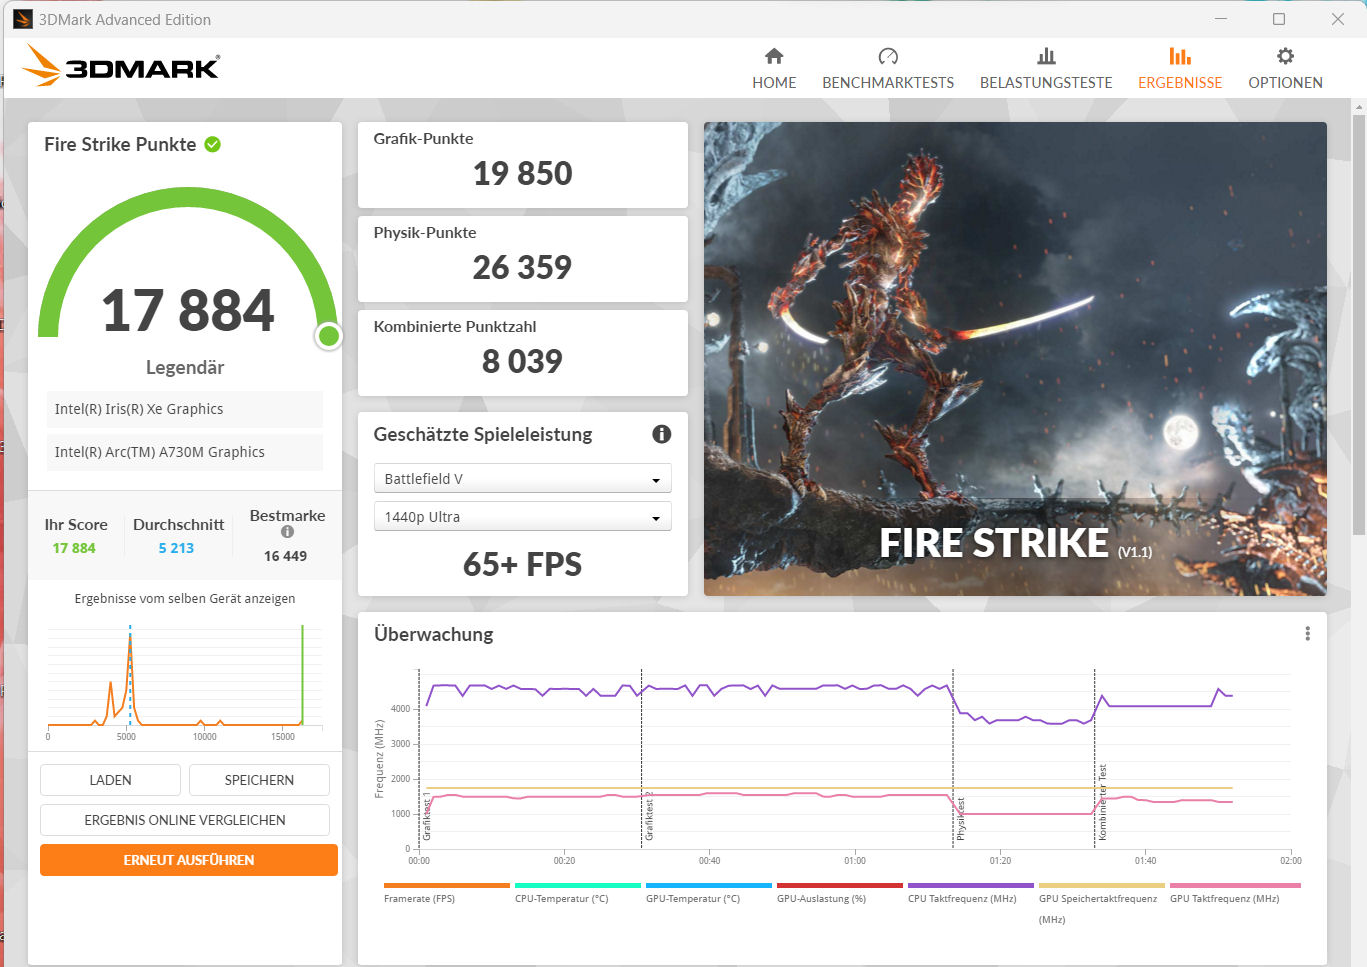
The Arc A730M - Intel's second-most powerful mobile DGPU - has a maximum TGP of 85 watts, relies on super-fast GDDR6 memory (12,288 GB) and can achieve a maximum clock rate of 2.05 GHz. The graphics core is suitable for FHD gaming in medium to high settings. Less demanding games allow for more.
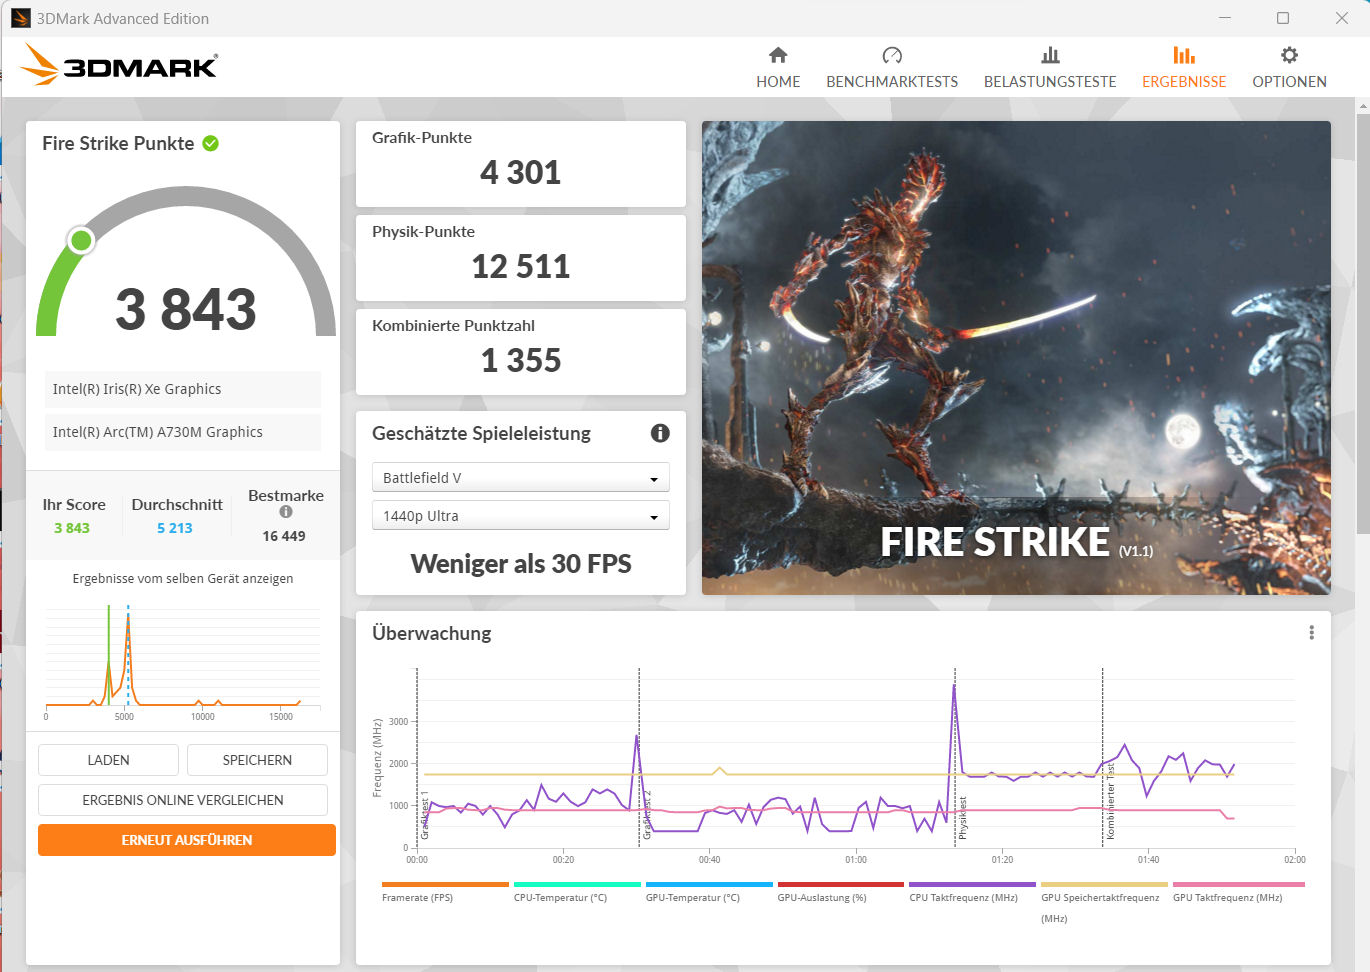
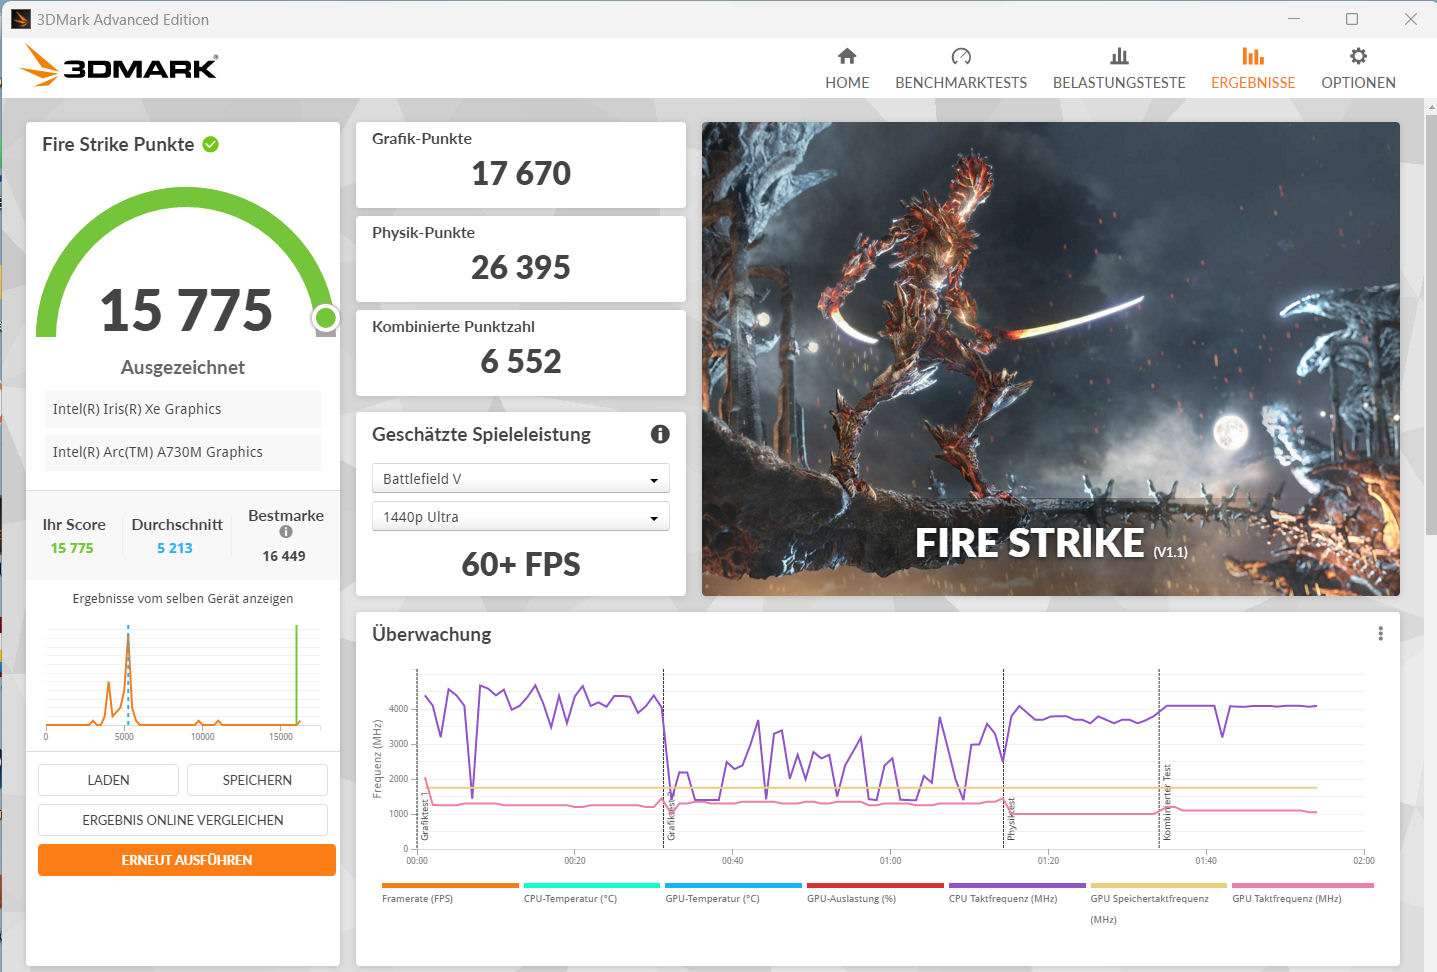
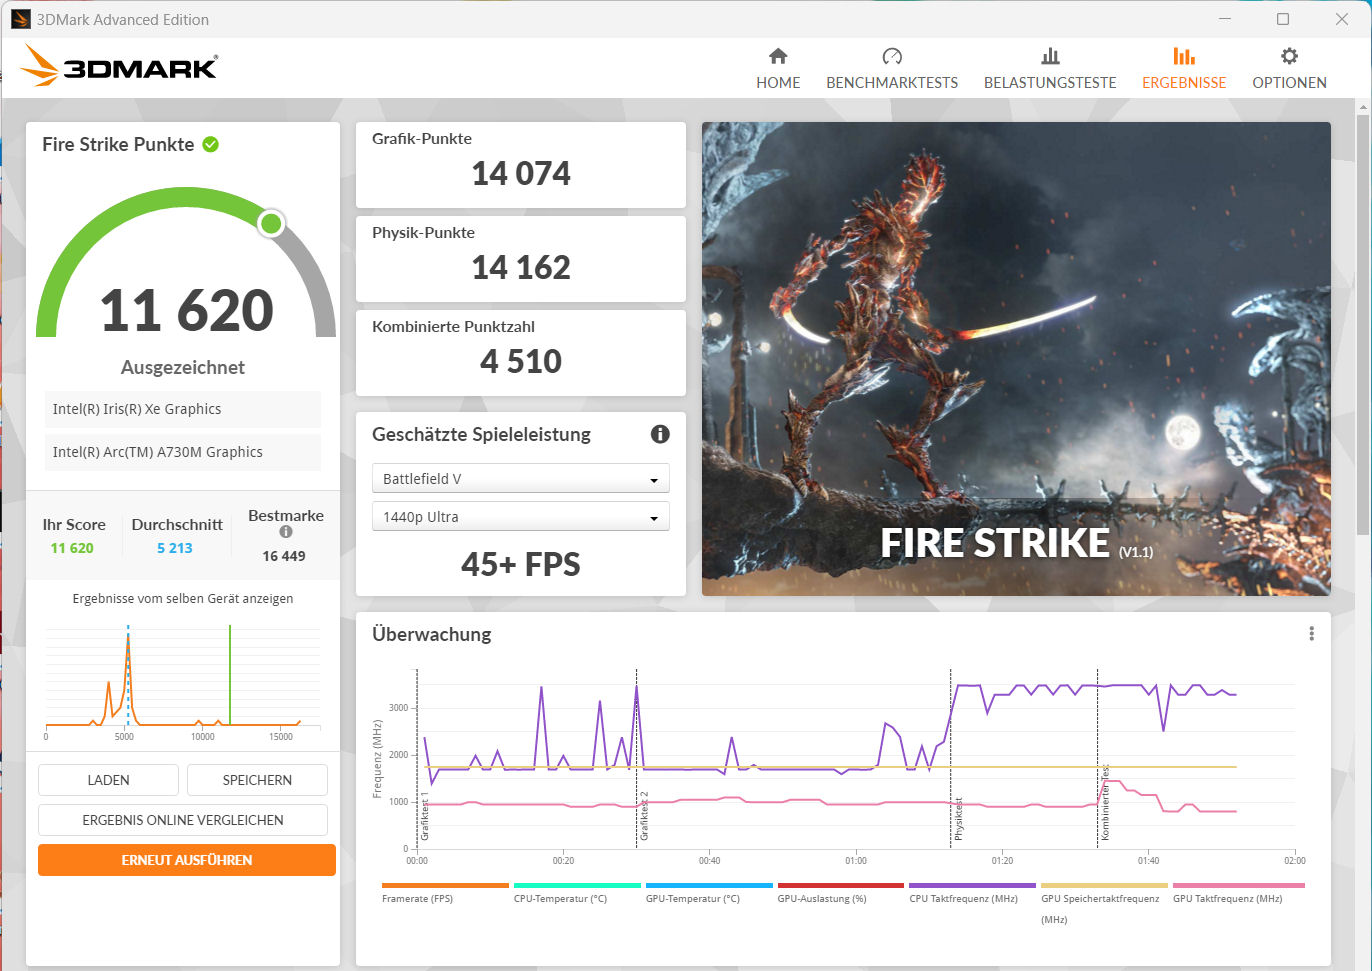
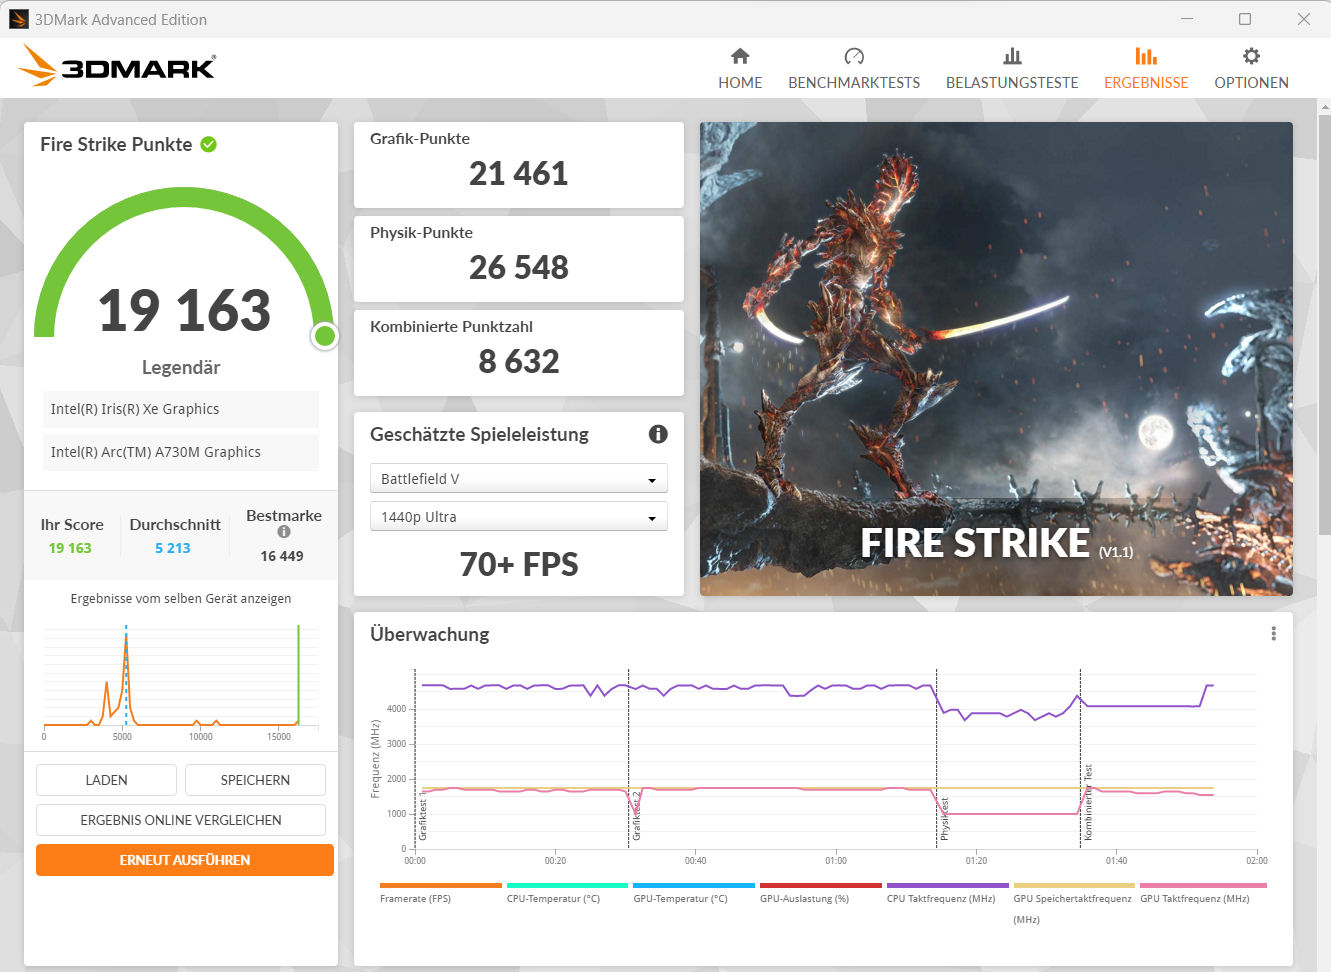
GPU performance greatly depends on which performance mode is used: The profile "Performance" resulted in benchmark results below (synthetic benchmarks) or on par (gaming practice) with the previously determined GPU average. The maximum performance was achieved when "Benchmark Mode" was active (TGP: 85 watts). All in all, the GPU ranked between the GeForce RTX 3050 and RTX 3060 in terms of performance.
| 3DMark Performance Rating - Percent | |
| Asus TUF A15 FA507 -1! | |
| Gigabyte G5 KE | |
| MSI Cyborg 15 A12VF | |
| Dell Inspiron 16 Plus 7630 -1! | |
| Average Intel Arc A730M | |
| Intel NUC X15 LAPAC71H | |
| Asus VivoBook Pro 16 | |
| Average of class Multimedia | |
| 3DMark 11 - 1280x720 Performance GPU | |
| Asus TUF A15 FA507 | |
| Gigabyte G5 KE | |
| Average Intel Arc A730M (24928 - 31551, n=4) | |
| Dell Inspiron 16 Plus 7630 | |
| MSI Cyborg 15 A12VF | |
| Intel NUC X15 LAPAC71H | |
| Average of class Multimedia (3222 - 60250, n=90, last 2 years) | |
| Asus VivoBook Pro 16 | |
| 3DMark | |
| 1280x720 Cloud Gate Standard Graphics | |
| MSI Cyborg 15 A12VF | |
| Gigabyte G5 KE | |
| Intel NUC X15 LAPAC71H | |
| Average Intel Arc A730M (75370 - 105420, n=4) | |
| Asus VivoBook Pro 16 | |
| Average of class Multimedia (14679 - 150699, n=64, last 2 years) | |
| 1920x1080 Fire Strike Graphics | |
| Asus TUF A15 FA507 | |
| Gigabyte G5 KE | |
| Dell Inspiron 16 Plus 7630 | |
| Average Intel Arc A730M (19850 - 22620, n=4) | |
| MSI Cyborg 15 A12VF | |
| Intel NUC X15 LAPAC71H | |
| Average of class Multimedia (1835 - 46022, n=90, last 2 years) | |
| Asus VivoBook Pro 16 | |
| 2560x1440 Time Spy Graphics | |
| Average Intel Arc A730M (7212 - 10352, n=4) | |
| Asus TUF A15 FA507 | |
| Gigabyte G5 KE | |
| Dell Inspiron 16 Plus 7630 | |
| MSI Cyborg 15 A12VF | |
| Intel NUC X15 LAPAC71H | |
| Average of class Multimedia (622 - 17620, n=90, last 2 years) | |
| Asus VivoBook Pro 16 | |
| 3DMark 11 Performance | 23160 points | |
| 3DMark Cloud Gate Standard Score | 46415 points | |
| 3DMark Fire Strike Score | 17884 points | |
| 3DMark Time Spy Score | 7653 points | |
Help | ||
| Blender - v3.3 Classroom CPU | |
| Average of class Multimedia (190 - 1374, n=61, last 2 years) | |
| Average Intel Arc A730M (315 - 633, n=3) | |
| MSI Cyborg 15 A12VF | |
| Gigabyte G5 KE | |
| Intel NUC X15 LAPAC71H | |
| Dell Inspiron 16 Plus 7630 | |
| Asus VivoBook Pro 16 | |
| Asus TUF A15 FA507 | |
| Asus TUF A15 FA507 | |
| Geekbench 5.5 | |
| OpenCL Score | |
| Gigabyte G5 KE | |
| Dell Inspiron 16 Plus 7630 | |
| MSI Cyborg 15 A12VF | |
| Asus TUF A15 FA507 | |
| Average Intel Arc A730M (20185 - 138625, n=3) | |
| Intel NUC X15 LAPAC71H | |
| Asus VivoBook Pro 16 | |
| Average of class Multimedia (8566 - 130419, n=98, last 2 years) | |
| Vulkan Score | |
| Intel NUC X15 LAPAC71H | |
| Dell Inspiron 16 Plus 7630 | |
| Average Intel Arc A730M (20299 - 61294, n=3) | |
| Asus TUF A15 FA507 | |
| Average of class Multimedia (4239 - 61294, n=93, last 2 years) | |
| MSI Cyborg 15 A12VF | |
| Asus VivoBook Pro 16 | |
| Gigabyte G5 KE | |
| Geekbench 6.2 | |
| GPU Vulkan | |
| Dell Inspiron 16 Plus 7630 | |
| Intel NUC X15 LAPAC71H | |
| Average Intel Arc A730M (74820 - 76553, n=2) | |
| Average of class Multimedia (21215 - 83815, n=7, last 2 years) | |
| GPU OpenCL | |
| Dell Inspiron 16 Plus 7630 | |
| Average of class Multimedia (50447 - 92806, n=8, last 2 years) | |
| Intel NUC X15 LAPAC71H | |
| Average Intel Arc A730M (74442 - 75288, n=2) | |
| V-Ray 5 Benchmark | |
| GPU CUDA | |
| Asus TUF A15 FA507 | |
| Dell Inspiron 16 Plus 7630 | |
| MSI Cyborg 15 A12VF | |
| Average of class Multimedia (209 - 1266, n=27, last 2 years) | |
| Asus VivoBook Pro 16 | |
| Intel NUC X15 LAPAC71H | |
| Average Intel Arc A730M (156 - 274, n=2) | |
| CPU | |
| Intel NUC X15 LAPAC71H | |
| MSI Cyborg 15 A12VF | |
| Dell Inspiron 16 Plus 7630 | |
| Asus VivoBook Pro 16 | |
| Asus TUF A15 FA507 | |
| Average of class Multimedia (2959 - 19998, n=38, last 2 years) | |
| Average Intel Arc A730M (6258 - 10398, n=2) | |
| V-Ray Benchmark Next 4.10 | |
| GPU | |
| Asus TUF A15 FA507 | |
| MSI Cyborg 15 A12VF | |
| Gigabyte G5 KE | |
| Average of class Multimedia (31 - 631, n=65, last 2 years) | |
| Asus VivoBook Pro 16 | |
| Intel NUC X15 LAPAC71H | |
| Average Intel Arc A730M (53 - 88, n=3) | |
| CPU | |
| Intel NUC X15 LAPAC71H | |
| MSI Cyborg 15 A12VF | |
| Asus TUF A15 FA507 | |
| Asus VivoBook Pro 16 | |
| Gigabyte G5 KE | |
| Average Intel Arc A730M (9833 - 15998, n=3) | |
| Average of class Multimedia (5305 - 30140, n=65, last 2 years) | |
| SPECviewperf 2020 v1 | |
| 1920x1080 Solidworks (solidworks-05) | |
| Average of class Multimedia (17.2 - 250, n=7, last 2 years) | |
| Intel NUC X15 LAPAC71H | |
| Average Intel Arc A730M (29.9 - 93.1, n=2) | |
| 1920x1080 Siemens NX (snx-04) | |
| Average of class Multimedia (1.94 - 22.5, n=7, last 2 years) | |
| Average Intel Arc A730M (2.54 - 2.93, n=2) | |
| Intel NUC X15 LAPAC71H | |
| 1920x1080 Medical (medical-03) | |
| Average of class Multimedia (9.05 - 36.2, n=7, last 2 years) | |
| Intel NUC X15 LAPAC71H | |
| Average Intel Arc A730M (23.5 - 24.6, n=2) | |
| 1920x1080 Maya (maya-06) | |
| Average of class Multimedia (72 - 364, n=6, last 2 years) | |
| Intel NUC X15 LAPAC71H | |
| Average Intel Arc A730M (123.1 - 223, n=2) | |
| 1920x1080 Energy (energy-03) | |
| Average Intel Arc A730M (14.1 - 31.9, n=2) | |
| Average of class Multimedia (3.92 - 42, n=7, last 2 years) | |
| Intel NUC X15 LAPAC71H | |
| 1920x1080 Creo (creo-03) | |
| Average of class Multimedia (30.8 - 113, n=6, last 2 years) | |
| Intel NUC X15 LAPAC71H | |
| Average Intel Arc A730M (52 - 57, n=2) | |
| 1920x1080 CATIA (catia-06) | |
| Average of class Multimedia (15.7 - 65.3, n=7, last 2 years) | |
| Intel NUC X15 LAPAC71H | |
| Average Intel Arc A730M (19.9 - 20.7, n=2) | |
| 1920x1080 3ds Max (3dsmax-07) | |
| Average of class Multimedia (20.3 - 121.5, n=7, last 2 years) | |
| Intel NUC X15 LAPAC71H | |
| Average Intel Arc A730M (47.4 - 47.5, n=2) | |
* ... smaller is better
| The Witcher 3 - 1920x1080 Ultra Graphics & Postprocessing (HBAO+) | |
| Dell Inspiron 16 Plus 7630 | |
| Gigabyte G5 KE | |
| Asus TUF A15 FA507 | |
| MSI Cyborg 15 A12VF | |
| Average of class Multimedia (7.5 - 143.2, n=93, last 2 years) | |
| Asus VivoBook Pro 16 | |
| Average Intel Arc A730M (39.8 - 49.4, n=2) | |
| Intel NUC X15 LAPAC71H | |
| GTA V - 1920x1080 Highest Settings possible AA:4xMSAA + FX AF:16x | |
| Gigabyte G5 KE | |
| MSI Cyborg 15 A12VF | |
| Asus TUF A15 FA507 | |
| Average of class Multimedia (4.24 - 123, n=81, last 2 years) | |
| Asus VivoBook Pro 16 | |
| Average Intel Arc A730M (40.1 - 43.1, n=3) | |
| Intel NUC X15 LAPAC71H | |
| Final Fantasy XV Benchmark - 1920x1080 High Quality | |
| Gigabyte G5 KE | |
| Dell Inspiron 16 Plus 7630 | |
| Asus TUF A15 FA507 | |
| MSI Cyborg 15 A12VF | |
| Average of class Multimedia (6.53 - 141.8, n=86, last 2 years) | |
| Asus VivoBook Pro 16 | |
| Average Intel Arc A730M (41.1 - 49.7, n=3) | |
| Intel NUC X15 LAPAC71H | |
| Strange Brigade - 1920x1080 ultra AA:ultra AF:16 | |
| Dell Inspiron 16 Plus 7630 | |
| Gigabyte G5 KE | |
| Asus TUF A15 FA507 | |
| MSI Cyborg 15 A12VF | |
| Average Intel Arc A730M (116.6 - 137.7, n=3) | |
| Intel NUC X15 LAPAC71H | |
| Average of class Multimedia (11 - 233, n=84, last 2 years) | |
| Asus VivoBook Pro 16 | |
| Dota 2 Reborn - 1920x1080 ultra (3/3) best looking | |
| Dell Inspiron 16 Plus 7630 | |
| Gigabyte G5 KE | |
| MSI Cyborg 15 A12VF | |
| Asus TUF A15 FA507 | |
| Asus VivoBook Pro 16 | |
| Average of class Multimedia (26.3 - 171.6, n=90, last 2 years) | |
| Intel NUC X15 LAPAC71H | |
| Average Intel Arc A730M (80.4 - 91.9, n=3) | |
| X-Plane 11.11 - 1920x1080 high (fps_test=3) | |
| Dell Inspiron 16 Plus 7630 | |
| MSI Cyborg 15 A12VF | |
| Asus VivoBook Pro 16 | |
| Gigabyte G5 KE | |
| Asus TUF A15 FA507 | |
| Average of class Multimedia (11 - 131.1, n=93, last 2 years) | |
| Intel NUC X15 LAPAC71H | |
| Average Intel Arc A730M (14.4 - 47.6, n=3) | |
Witcher 3 FPS diagram
| low | med. | high | ultra | |
| GTA V (2015) | 177.4 | 170.6 | 94.3 | 40.1 |
| The Witcher 3 (2015) | 267.3 | 190.3 | 106.9 | 39.8 |
| Dota 2 Reborn (2015) | 102.2 | 101.6 | 96.8 | 91.9 |
| Final Fantasy XV Benchmark (2018) | 98.5 | 67.9 | 41.1 | |
| X-Plane 11.11 (2018) | 70.7 | 55.8 | 47.6 | |
| Strange Brigade (2018) | 377 | 167.8 | 140 | 116.6 |
| Control (2019) | 145.7 | 66 | 51.1 | |
| Flight Simulator 2020 (2020) | 69.3 | 44.2 | 33.7 | 25.7 |
| Cyberpunk 2077 1.6 (2022) | 70.5 | 57.5 | 50.4 | 47 |
| Uncharted Legacy of Thieves Collection (2022) | 31.3 | 35.3 | 27.6 | 26.7 |
| Call of Duty Modern Warfare 2 2022 (2022) | 77 | 65 | 56 | 55 |
| Spider-Man Miles Morales (2022) | 60.5 | 58 | 53.4 | 51.4 |
| The Callisto Protocol (2022) | 80.2 | 72.6 | 67.9 | 47.5 |
| Need for Speed Unbound (2022) | 59.8 | 52.5 | 44.7 | 37.9 |
| High On Life (2023) | 147.9 | 110.1 | 80.9 | 64.7 |
| The Witcher 3 v4.00 (2023) | 126.2 | 102.8 | 51.2 | 44.4 |
| Dead Space Remake (2023) | 48.2 | 46.7 | 42.2 | 41.3 |
| Hogwarts Legacy (2023) | 69.6 | 48.6 | 43.7 | 34.3 |
| Returnal (2023) | 55 | 53 | 49 | 41 |
| Atomic Heart (2023) | 100.1 | 73.3 | 51.1 | 37.5 |
| Company of Heroes 3 (2023) | 111.3 | 90.6 | 74 | 72.8 |
| Sons of the Forest (2023) | 53.1 | 35.2 | 34.9 | 34.2 |
| Resident Evil 4 Remake (2023) | 86.4 | 64.9 | 60 | 41.3 |
| The Last of Us (2023) | 34.3 | 32.2 | 31.3 | 28.7 |
| Star Wars Jedi Survivor (2023) | 44 | 39.4 | 36.7 | 34.7 |
| Diablo 4 (2023) | 129.7 | 115.6 | 104.5 | 87.8 |
| F1 23 (2023) | 164.9 | 150.3 | 109.6 | 33.1 |
| Ratchet & Clank Rift Apart (2023) | 55.4 | 50.7 | 42.5 | 42.1 |
| Baldur's Gate 3 (2023) | 74.6 | 63 | 55.1 | 52.8 |
| Atlas Fallen (2023) | 78 | 74.1 | 70.4 | 59.2 |
| Starfield (2023) | 34 | 30.1 | 24.8 | 22 |
| The Crew Motorfest (2023) | 60 | 57 | 50 | 46 |
| Lies of P (2023) | 97 | 85.8 | 75.1 | 67 |
| Cyberpunk 2077 2.0 Phantom Liberty (2023) | 71.6 | 57 | 50 | 47.7 |
| EA Sports FC 24 (2023) | 121.8 | |||
| Assassin's Creed Mirage (2023) | 60 | 55 | 55 | 44 |
| Total War Pharaoh (2023) | 207.4 | 121.7 | 74.9 | 60.9 |
| Lords of the Fallen (2023) | 45.1 | 40.1 | 36.8 | 35.4 |
Emissions & Power - The NUC X15 delivers meagre runtimes
Noise emissions
When gaming, the laptop's noise emissions rise up to 51 dB(A) ("Performance"). "Benchmark Mode" leads to even louder emissions, as the fans constantly run at full speed. In idle mode and in everyday use (office, internet), the NUC is a lot quieter. However: One of the two fans consistently runs at low speed. By activating the setting "Passive Cooling Mode" within the NUC Software Studio, this can be prevented.
Noise Level
| Idle |
| 23 / 24 / 24 dB(A) |
| Load |
| 50.61 / 50.89 dB(A) |
 | ||
30 dB silent 40 dB(A) audible 50 dB(A) loud |
||
min: | ||
| Intel NUC X15 LAPAC71H A730M, i7-12700H, Samsung 990 Pro 1 TB | Asus TUF A15 FA507 NVIDIA GeForce RTX 4050 Laptop GPU, R7 7735HS, Micron 2400 MTFDKBA512QFM | Gigabyte G5 KE GeForce RTX 3060 Laptop GPU, i5-12500H, Gigabyte AG4512G-SI B10 | Dell Inspiron 16 Plus 7630 NVIDIA GeForce RTX 4060 Laptop GPU, i7-13700H, WD PC SN740 SDDPTQD-1T00 | Asus VivoBook Pro 16 GeForce RTX 3050 Ti Laptop GPU, i7-12700H, Intel SSD 670p SSDPEKNU010TZ | MSI Cyborg 15 A12VF NVIDIA GeForce RTX 4060 Laptop GPU, i7-12650H, Samsung PM9B1 1024GB MZVL41T0HBLB | |
|---|---|---|---|---|---|---|
| Noise | 11% | -15% | 4% | -10% | -28% | |
| off / environment * | 23 | 23.3 -1% | 19.52 15% | 23.2 -1% | 25.2 -10% | 27 -17% |
| Idle Minimum * | 23 | 23.3 -1% | 31.05 -35% | 23.2 -1% | 25.2 -10% | 27 -17% |
| Idle Average * | 24 | 23.3 3% | 31.05 -29% | 23.2 3% | 25.2 -5% | 37.5 -56% |
| Idle Maximum * | 24 | 23.3 3% | 31.05 -29% | 23.2 3% | 25.2 -5% | 38 -58% |
| Load Average * | 50.61 | 29.6 42% | 55.66 -10% | 35.1 31% | 55.1 -9% | 56.3 -11% |
| Witcher 3 ultra * | 50.65 | 43 15% | 55.7 -10% | 52.5 -4% | ||
| Load Maximum * | 50.89 | 43 16% | 55.51 -9% | 52.5 -3% | 61.5 -21% | 56.3 -11% |
* ... smaller is better
Temperature
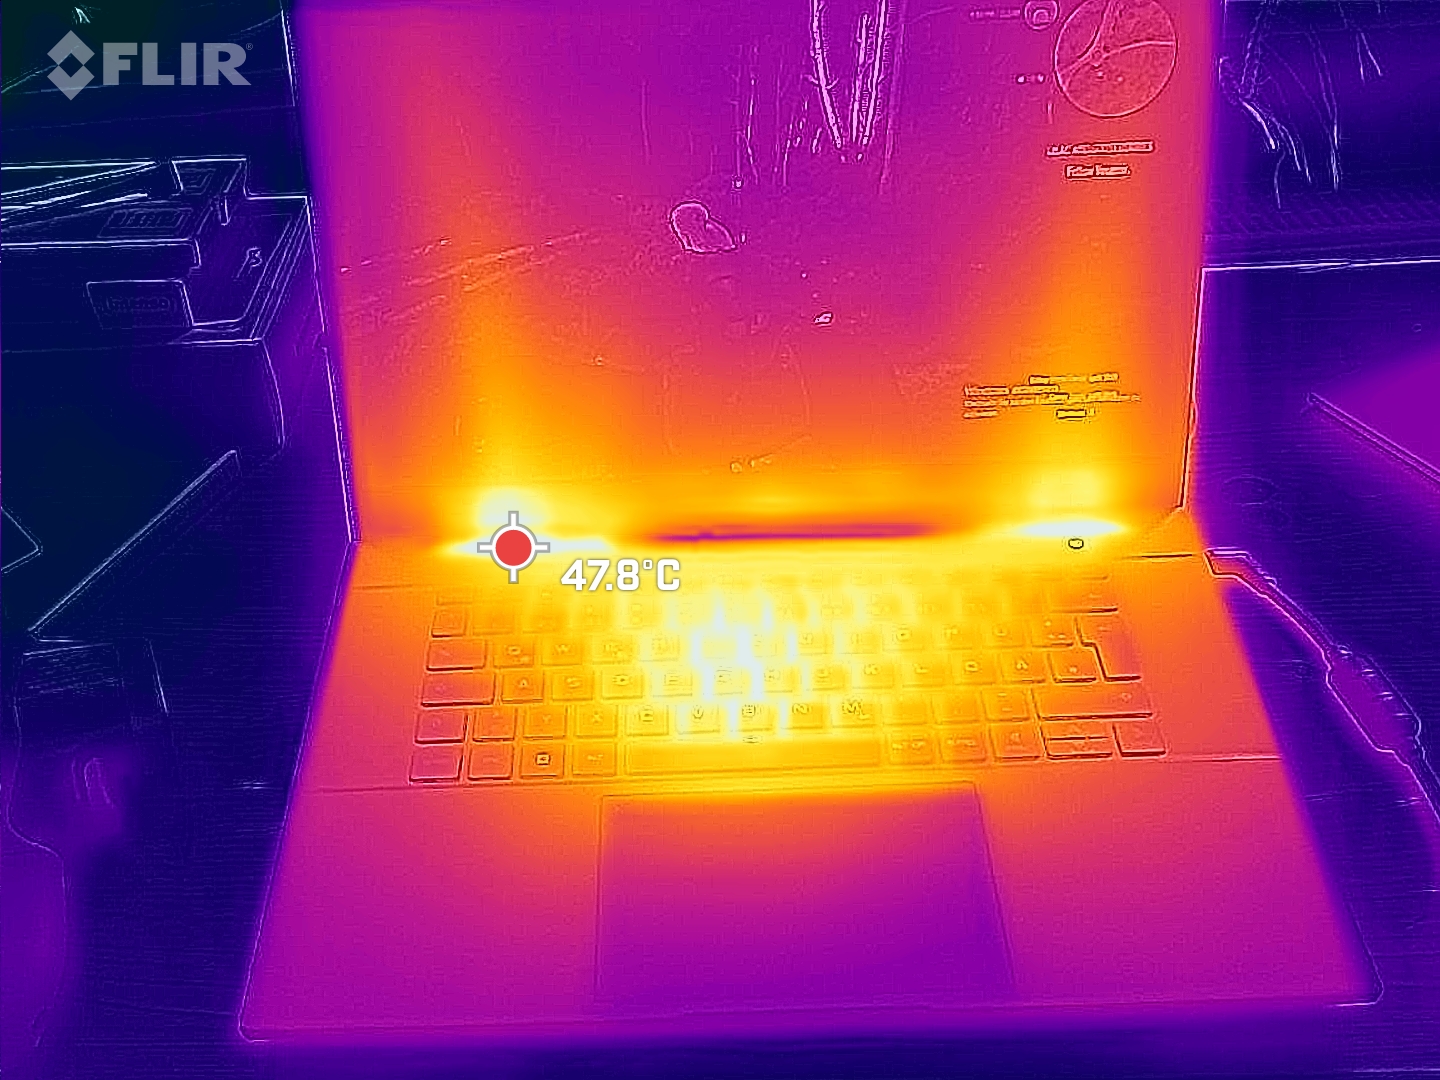
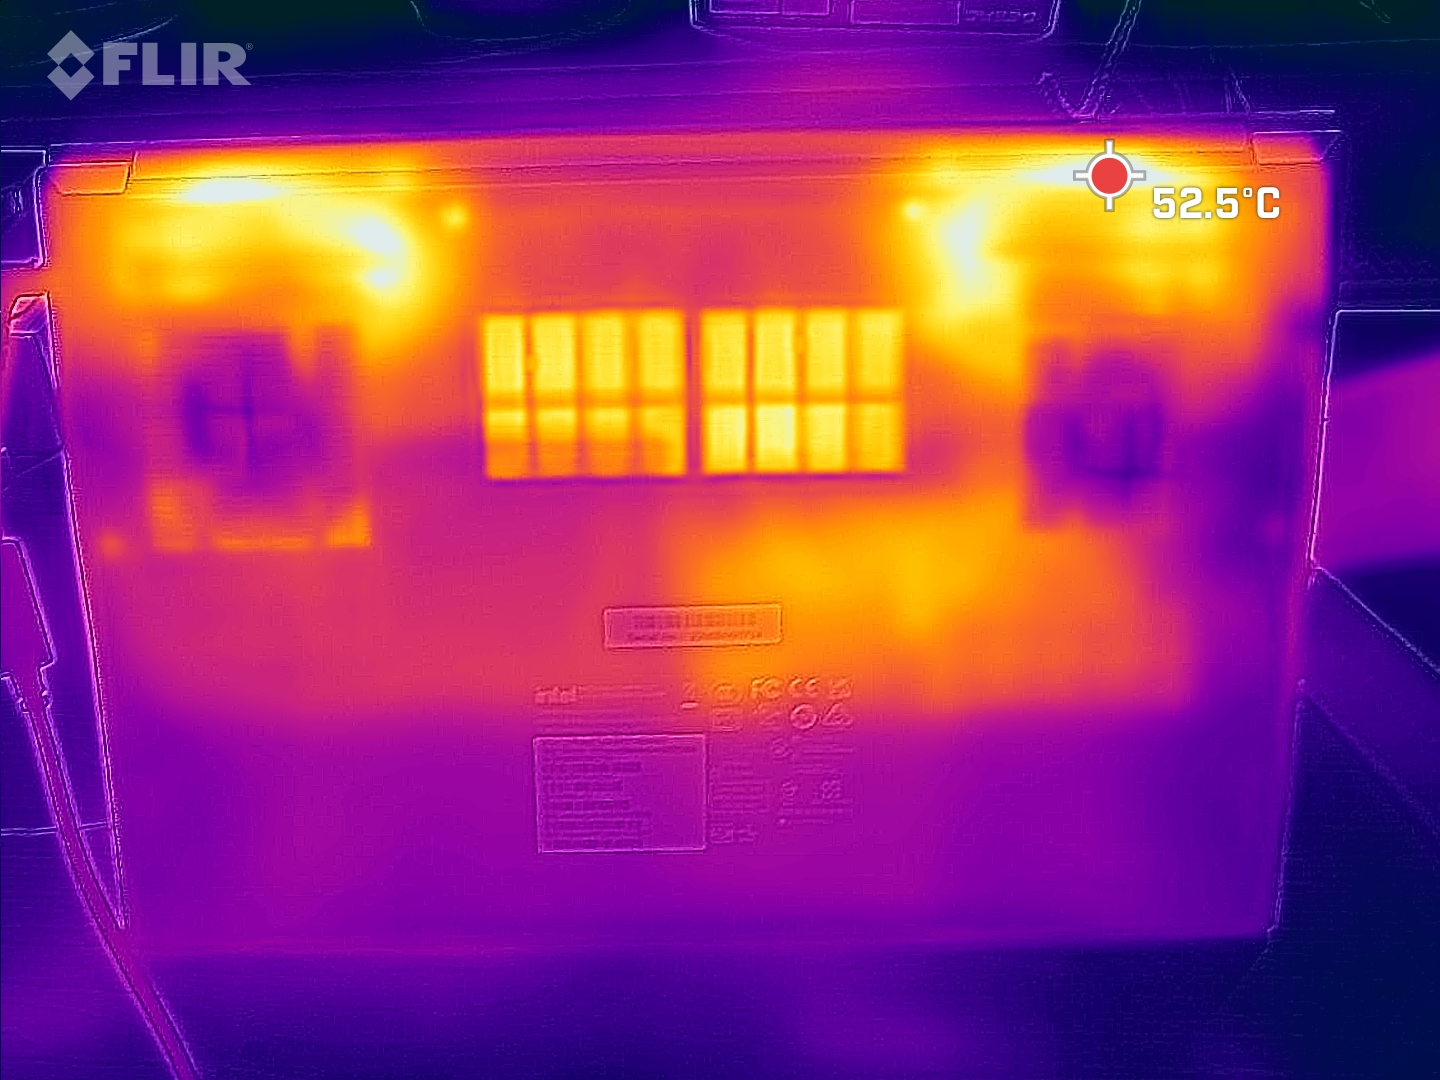
High loads (stress test, Witcher 3 test) cause the laptop to heat up considerably in some areas. All in all, the values never reached critical levels. The case temperatures remain within the green zone in everyday use (office, internet).
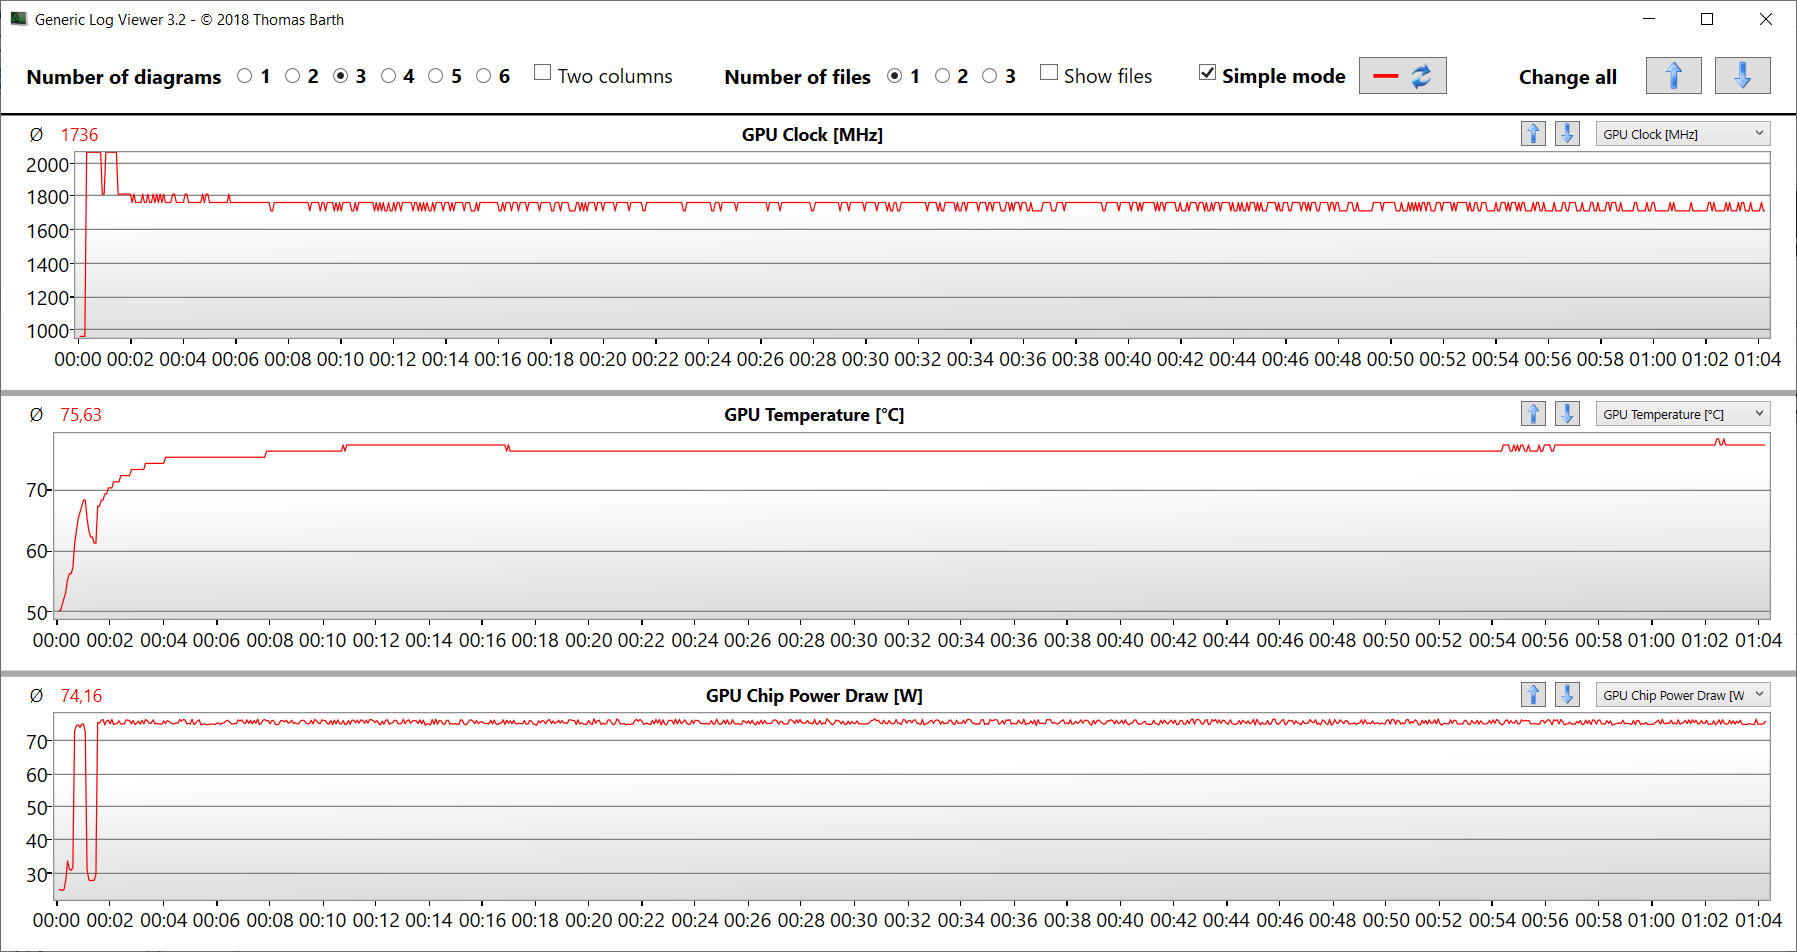
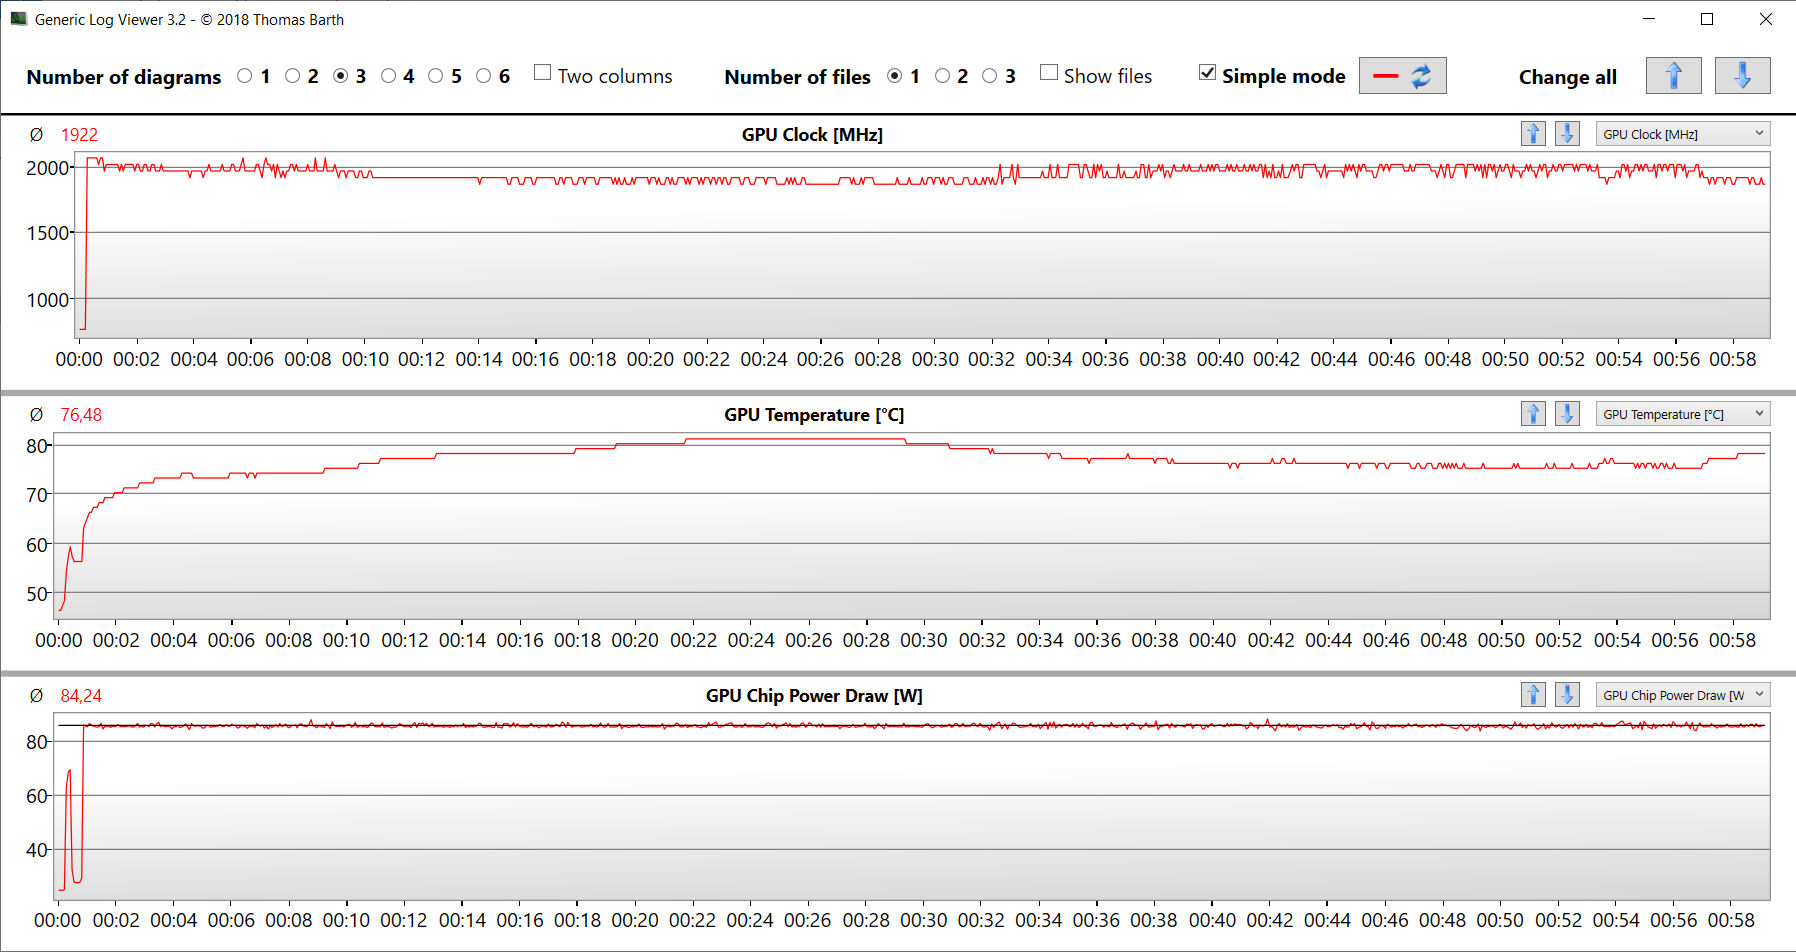
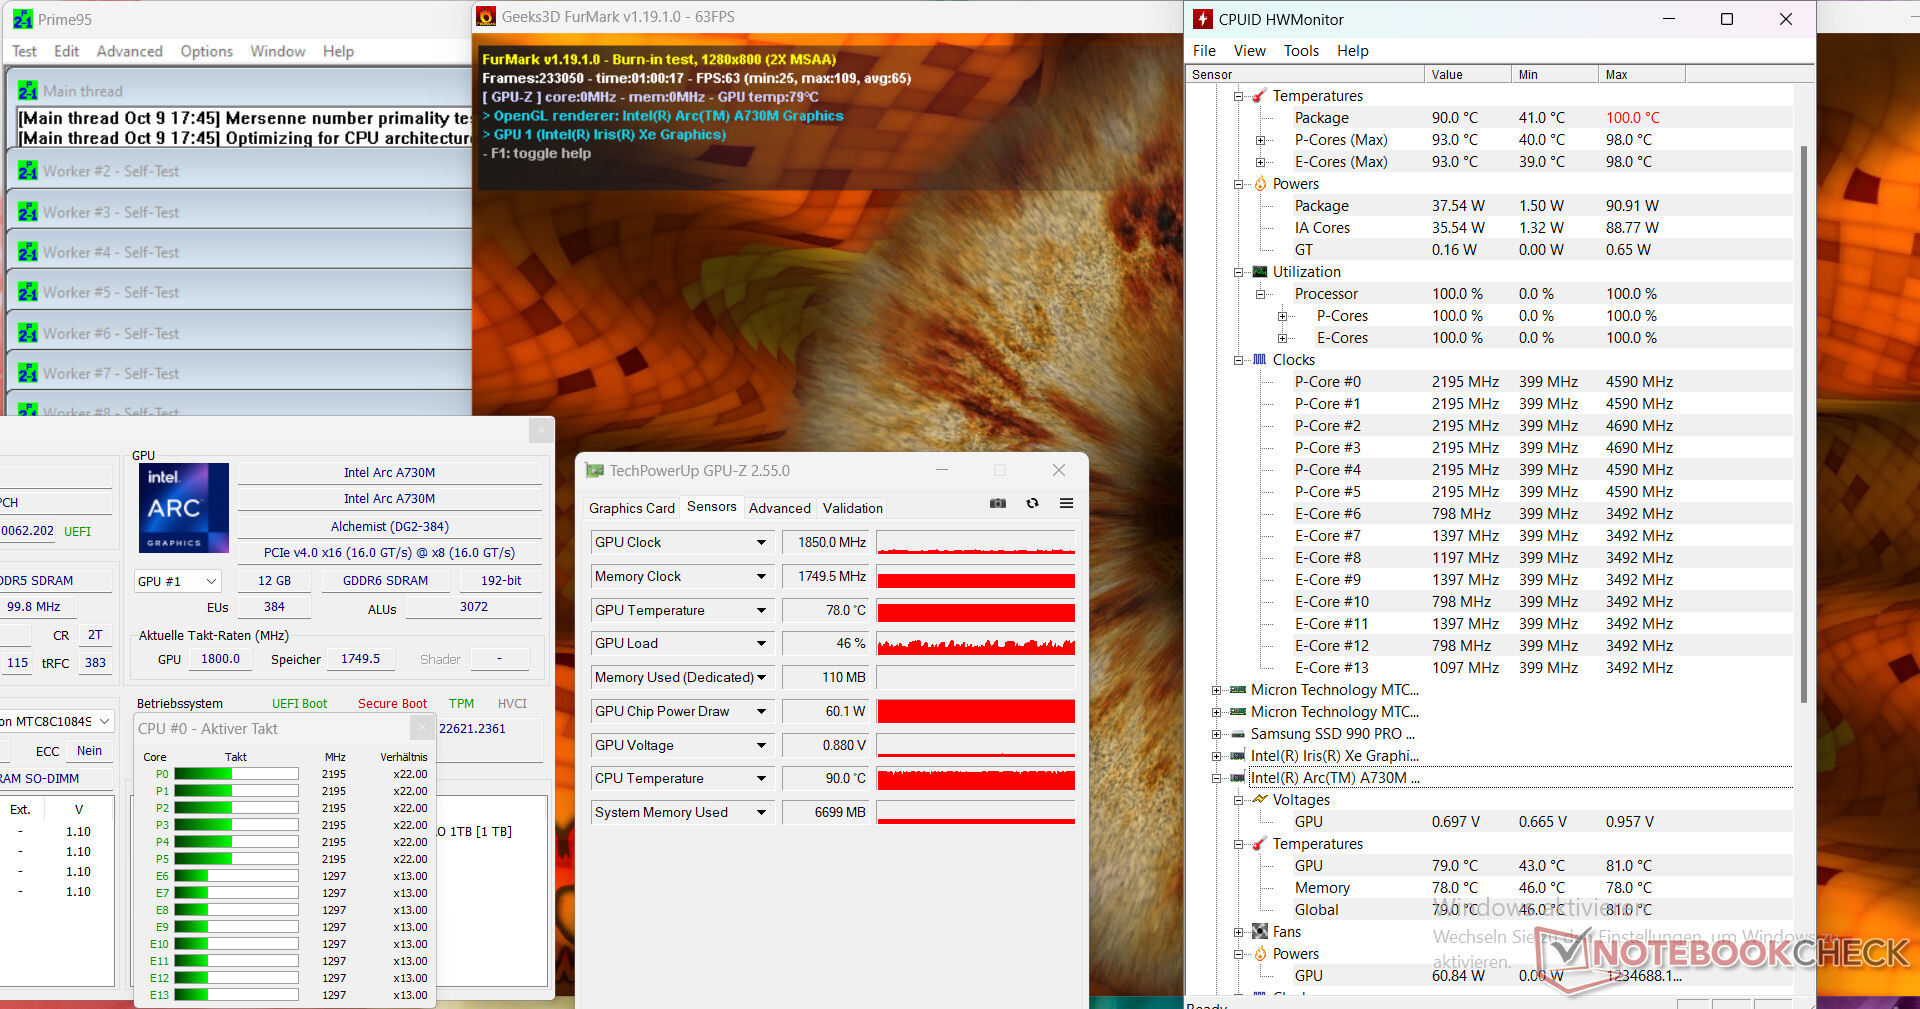
The stress test (Prime95 and Furmark in continuous operation) simulates an extreme scenario in order to test the system's stability under full load. The CPU and GPU clock rates fluctuated in the average range.
(-) The maximum temperature on the upper side is 59 °C / 138 F, compared to the average of 36.9 °C / 98 F, ranging from 21.1 to 71 °C for the class Multimedia.
(-) The bottom heats up to a maximum of 51 °C / 124 F, compared to the average of 39.2 °C / 103 F
(+) In idle usage, the average temperature for the upper side is 27.3 °C / 81 F, compared to the device average of 31.2 °C / 88 F.
(-) Playing The Witcher 3, the average temperature for the upper side is 40.9 °C / 106 F, compared to the device average of 31.2 °C / 88 F.
(±) The palmrests and touchpad can get very hot to the touch with a maximum of 36 °C / 96.8 F.
(-) The average temperature of the palmrest area of similar devices was 28.9 °C / 84 F (-7.1 °C / -12.8 F).
| Intel NUC X15 LAPAC71H Intel Core i7-12700H, Intel Arc A730M | Asus TUF A15 FA507 AMD Ryzen 7 7735HS, NVIDIA GeForce RTX 4050 Laptop GPU | Gigabyte G5 KE Intel Core i5-12500H, NVIDIA GeForce RTX 3060 Laptop GPU | Dell Inspiron 16 Plus 7630 Intel Core i7-13700H, NVIDIA GeForce RTX 4060 Laptop GPU | Asus VivoBook Pro 16 Intel Core i7-12700H, NVIDIA GeForce RTX 3050 Ti Laptop GPU | MSI Cyborg 15 A12VF Intel Core i7-12650H, NVIDIA GeForce RTX 4060 Laptop GPU | |
|---|---|---|---|---|---|---|
| Heat | 10% | -12% | -2% | -6% | 13% | |
| Maximum Upper Side * | 59 | 48.9 17% | 52.6 11% | 47.8 19% | 44.2 25% | 47.5 19% |
| Maximum Bottom * | 51 | 44.6 13% | 62.4 -22% | 42.2 17% | 53 -4% | 35.5 30% |
| Idle Upper Side * | 28 | 27.1 3% | 33.6 -20% | 35.2 -26% | 32.1 -15% | 27.7 1% |
| Idle Bottom * | 30 | 27.5 8% | 34.8 -16% | 35 -17% | 38.4 -28% | 29.5 2% |
* ... smaller is better
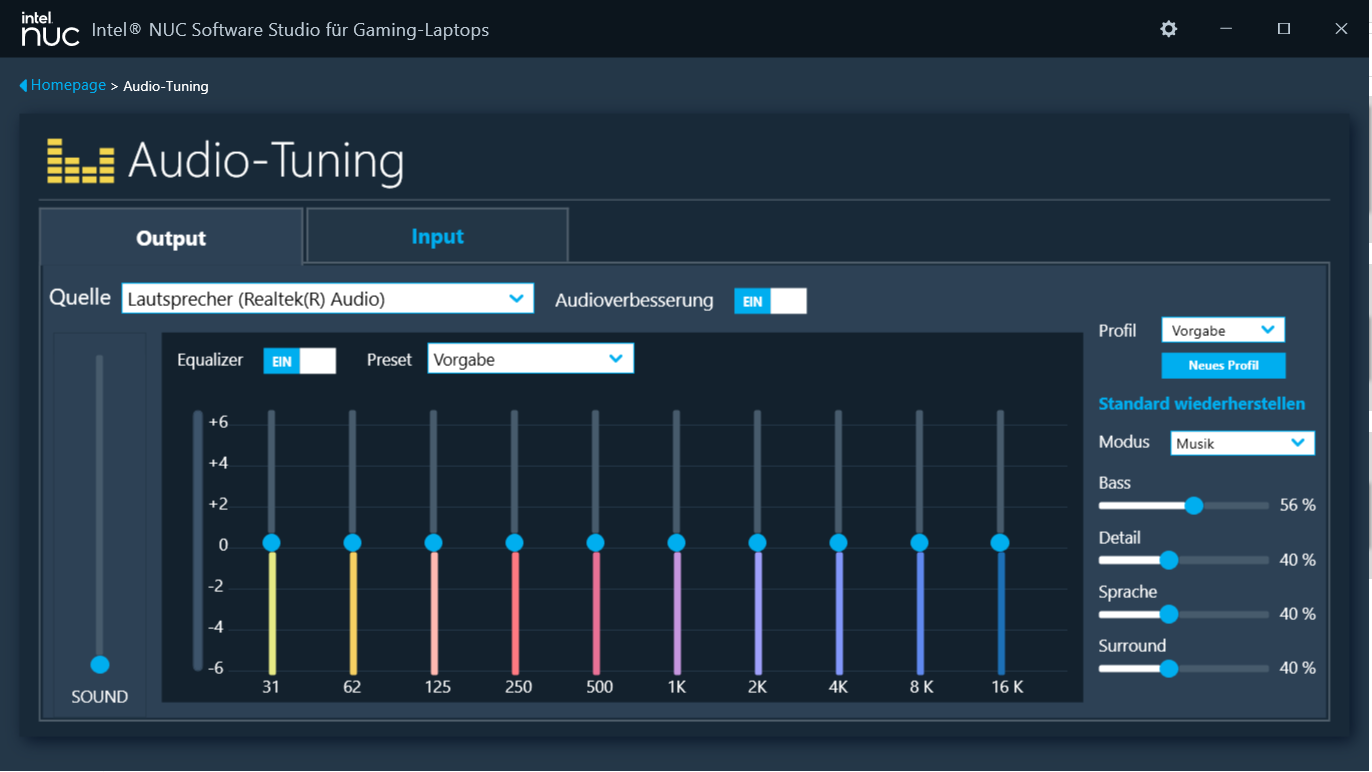
Speakers
The stereo speakers produce a decent sound but with hardly any bass.
Intel NUC X15 LAPAC71H audio analysis
(±) | speaker loudness is average but good (79.38 dB)
Bass 100 - 315 Hz
(-) | nearly no bass - on average 17.1% lower than median
(±) | linearity of bass is average (14.2% delta to prev. frequency)
Mids 400 - 2000 Hz
(+) | balanced mids - only 1.7% away from median
(+) | mids are linear (3.8% delta to prev. frequency)
Highs 2 - 16 kHz
(+) | balanced highs - only 2.2% away from median
(+) | highs are linear (5.4% delta to prev. frequency)
Overall 100 - 16.000 Hz
(+) | overall sound is linear (12.1% difference to median)
Compared to same class
» 12% of all tested devices in this class were better, 2% similar, 86% worse
» The best had a delta of 5%, average was 18%, worst was 45%
Compared to all devices tested
» 6% of all tested devices were better, 2% similar, 92% worse
» The best had a delta of 4%, average was 26%, worst was 134%
Dell Inspiron 16 Plus 7630 audio analysis
(±) | speaker loudness is average but good (81.8 dB)
Bass 100 - 315 Hz
(-) | nearly no bass - on average 17% lower than median
(±) | linearity of bass is average (8.4% delta to prev. frequency)
Mids 400 - 2000 Hz
(±) | higher mids - on average 6.3% higher than median
(+) | mids are linear (6.2% delta to prev. frequency)
Highs 2 - 16 kHz
(+) | balanced highs - only 2.2% away from median
(+) | highs are linear (5.6% delta to prev. frequency)
Overall 100 - 16.000 Hz
(±) | linearity of overall sound is average (15.9% difference to median)
Compared to same class
» 30% of all tested devices in this class were better, 6% similar, 64% worse
» The best had a delta of 5%, average was 18%, worst was 45%
Compared to all devices tested
» 19% of all tested devices were better, 5% similar, 76% worse
» The best had a delta of 4%, average was 26%, worst was 134%
Power consumption
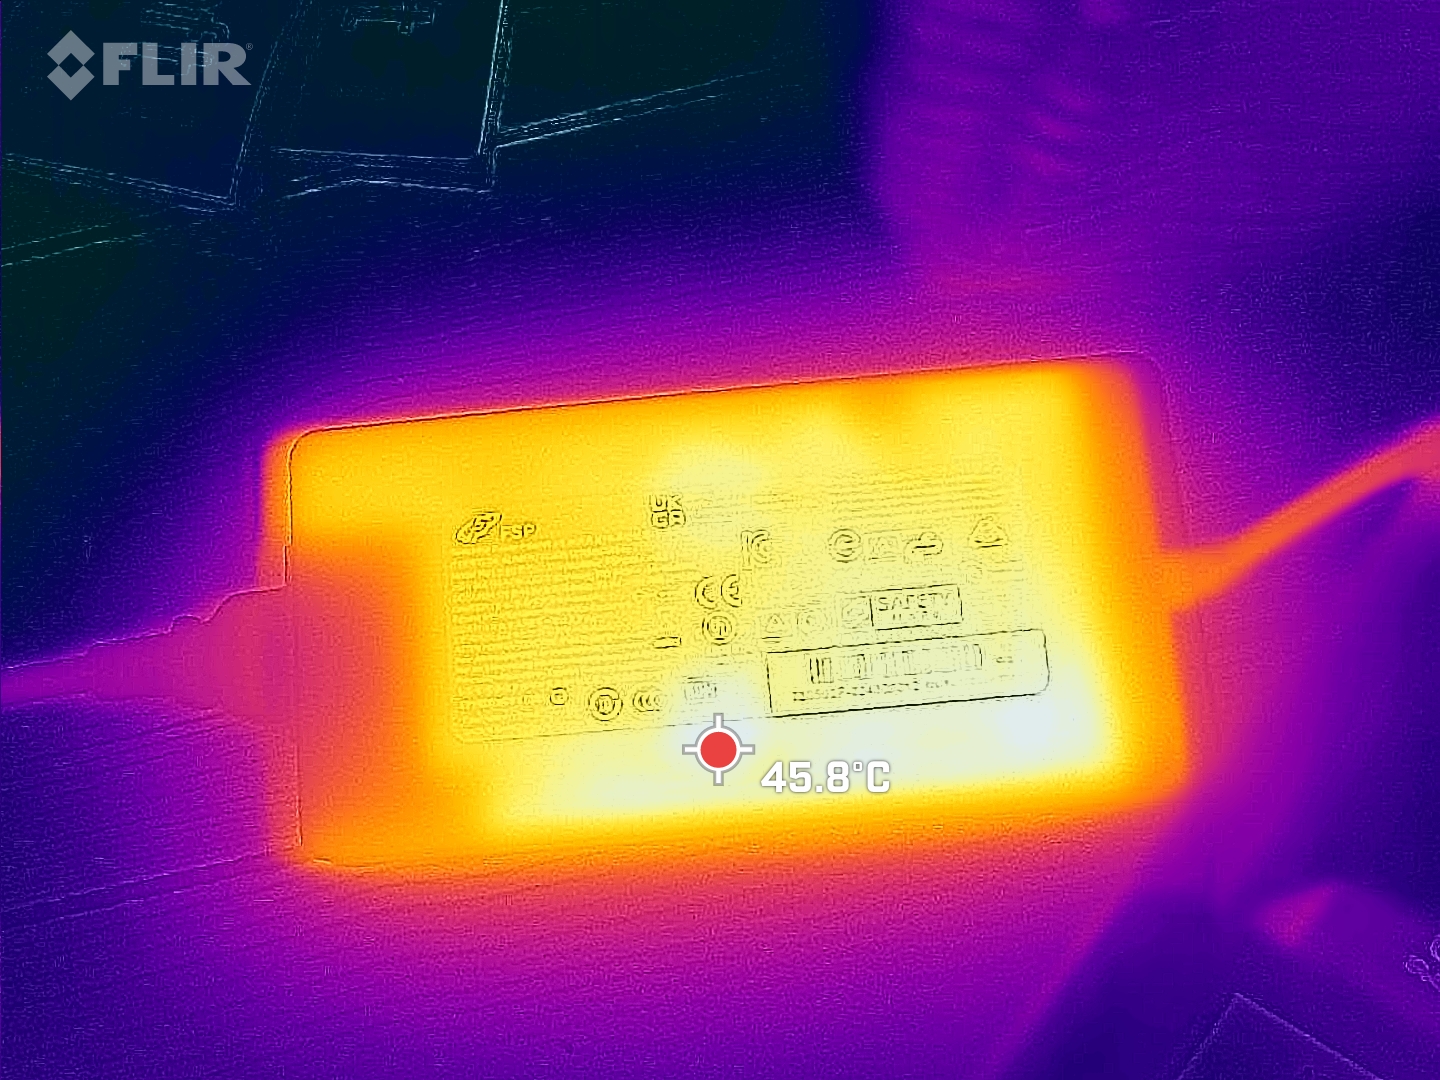
The laptop's power consumption is on the expected level for the installed hardware. The stress test and Witcher 3 test were run with (slightly) fluctuating power consumption levels. The included power supply (230 watts) is sufficiently sized.
Judging by its per-watt performance, the device is very power-hungry. For comparison: The MSI Cyborg only needs about half as much power under load but delivers significantly more gaming performance. The GeForce RTX 4060 within the MSI laptop, which is limited to a TGP of 45 watts, works much more efficiently than the Arc 730M.
| Off / Standby | |
| Idle | |
| Load |
|
| Intel NUC X15 LAPAC71H Intel Core i7-12700H, Intel Arc A730M | Asus TUF A15 FA507 AMD Ryzen 7 7735HS, NVIDIA GeForce RTX 4050 Laptop GPU | Gigabyte G5 KE Intel Core i5-12500H, NVIDIA GeForce RTX 3060 Laptop GPU | Dell Inspiron 16 Plus 7630 Intel Core i7-13700H, NVIDIA GeForce RTX 4060 Laptop GPU | Asus VivoBook Pro 16 Intel Core i7-12700H, NVIDIA GeForce RTX 3050 Ti Laptop GPU | MSI Cyborg 15 A12VF Intel Core i7-12650H, NVIDIA GeForce RTX 4060 Laptop GPU | |
|---|---|---|---|---|---|---|
| Power Consumption | 12% | -1% | -18% | 1% | 32% | |
| Idle Minimum * | 7.5 | 8 -7% | 7.66 -2% | 15.6 -108% | 8.7 -16% | 6 20% |
| Idle Average * | 11.9 | 12.1 -2% | 10.3 13% | 17.7 -49% | 13.1 -10% | 8.8 26% |
| Idle Maximum * | 13.9 | 12.5 10% | 16.05 -15% | 20.6 -48% | 18.3 -32% | 11.9 14% |
| Load Average * | 137 | 74.9 45% | 115.8 15% | 87.4 36% | 116 15% | 89 35% |
| Witcher 3 ultra * | 166 | 136.6 18% | 168.7 -2% | 121.7 27% | 117.6 29% | 90.3 46% |
| Load Maximum * | 203 | 185 9% | 234.6 -16% | 138 32% | 162 20% | 99 51% |
* ... smaller is better
Power consumption Witcher 3 / stress test
Power consumption with external monitor
Runtimes
The 15.6-inch device achieved runtimes of 5:44 h in our realistic WLAN test (mapping the load when calling up web pages using a script) - a decent but not terrific value.
| Battery Runtime - WiFi Websurfing | |
| Asus TUF A15 FA507 | |
| Dell Inspiron 16 Plus 7630 | |
| Average of class Multimedia (225 - 887, n=90, last 2 years) | |
| MSI Cyborg 15 A12VF | |
| Asus VivoBook Pro 16 | |
| Intel NUC X15 LAPAC71H | |
| Gigabyte G5 KE | |
Pros
Cons
Verdict - There is no bargain to be had here
Intel markets toward gamers and creative workers with its NUC X15. This means video and image editing, streaming, rendering and gaming all belong to the laptop's fields of use. A Core i7-12700H and Arc A730M deliver the necessary power - both chips run at consistently high clock rates.
The Intel NUC X15 neither impresses nor does it disappoint. However, taking into account its CPU performance and high power consumption, the laptop's price is simply too high.
Its inefficient Arc GPU delivers less per-watt performance compared to its comparable competitors. The same as on all current GPUs (RX7000, RTX 4000), the A730M features ray-tracing cores and AV1 support (decoding and encoding) - features that are necessary on a creator laptop.
The device's emissions are typical for this class. Practical runtimes of almost 6 hours can be classed as decent. Its USB-C port (Thunderbolt 4) doesn't support Power Delivery but it can output a DisplayPort signal. Furthermore, the laptop features expansion options (docking solution, external GPU). All-in-all, the installed FHD display (15.6 inches, IPS, 144 Hz) left a good impression on us.
An alternative could be the Asus VivoBook Pro 16: It features slightly lower computing performance in total, however, it benefits from longer runtimes, Power Delivery and a 16:10 screen. The Aorus 15 9KF-E3DE383SH could be a good budget alternative. Thanks to its GeForce RTX 4060 (TGP: 140 watts), it delivers much better gaming performance than the X15. You can currently find it online for around US$1,040. We already tested a more powerful version of the Aorus 15.
Price and availability
The Intel NUC X15 LAPAC71H can be individually configured and ordered via Schenker's online shop. The present test device can be had for around US$1,280. The base variant (16 GB RAM, 500 GB SSD) can be purchased for around US$1,050.
Intel NUC X15 LAPAC71H
-
10/13/2023 v7
Sascha Mölck
More articles related to this device
Intel NUC X15 LAPAC71H (NUC X15 Series)Related Articles

Transparency
The present review sample was made available to the author as a loan by the manufacturer or a shop for the purposes of review. The lender had no influence on this review, nor did the manufacturer receive a copy of this review before publication. There was no obligation to publish this review.
Pricecompare

