 Deutsch
 English
 Español
 Français
 Italiano
 Nederlands
 Polski
 Português
 Русский
 Türkçe
 Svenska
 Chinese
 Magyar
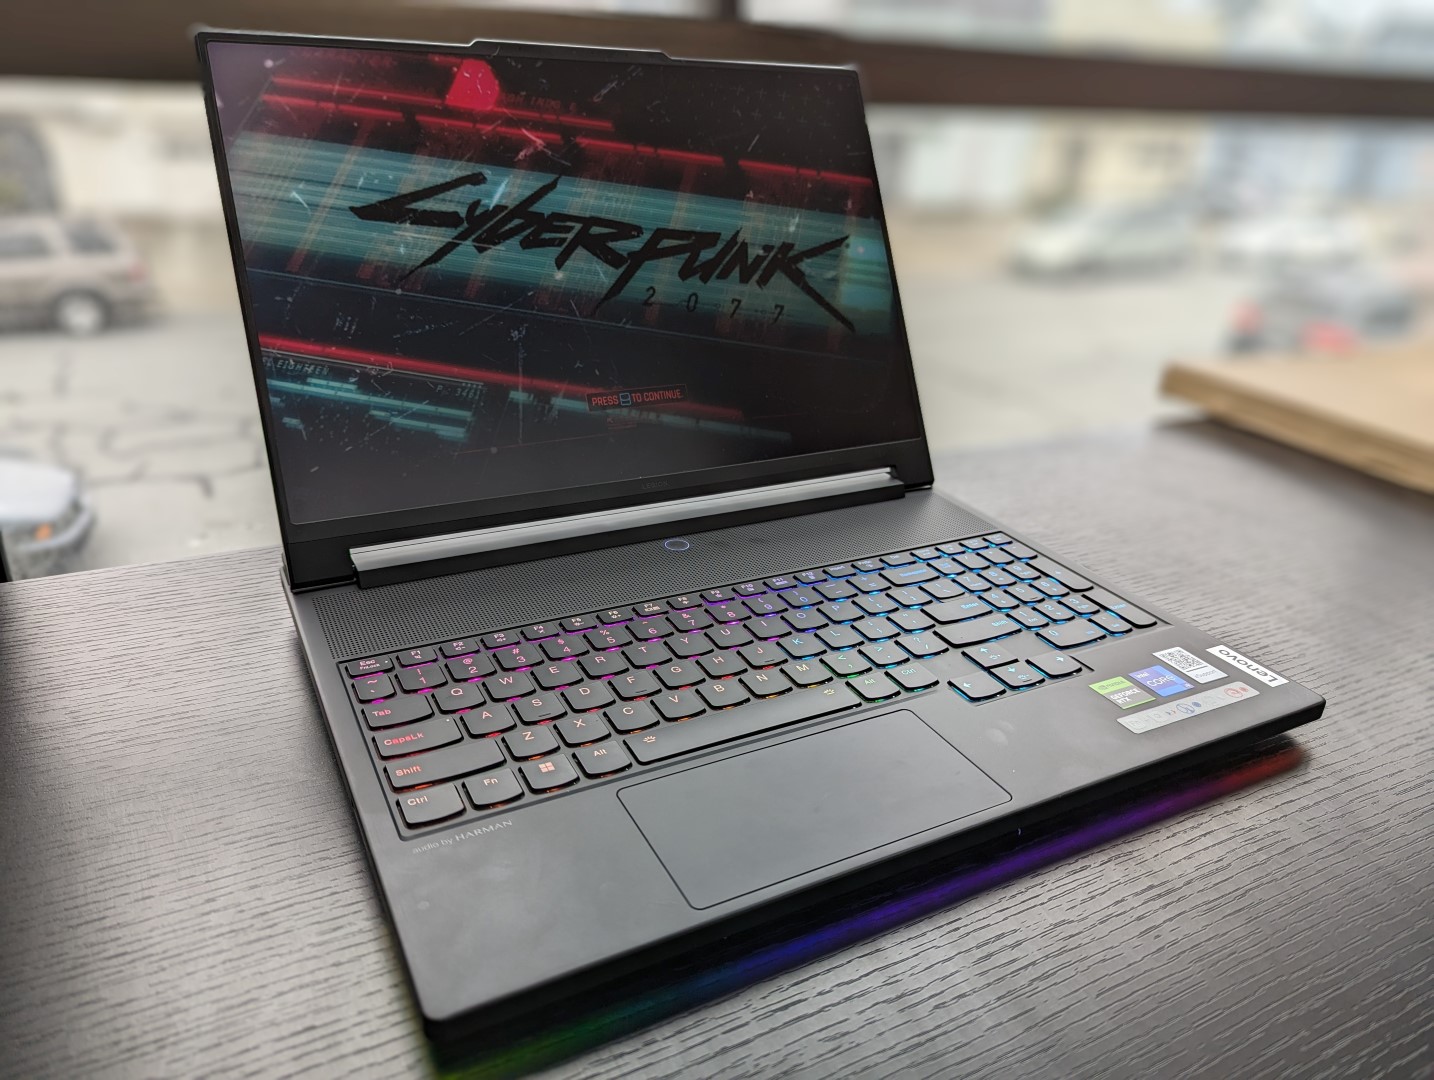
Legion 9i Gen 8 16IRX8 review: Lenovo's most ambitious gaming laptop yet

Unveiled just a few short weeks ago at IFA 2023, the new Legion 9i 16 is the highest-end Legion model available surpassing the midrange Legion 5 series and upper-midrange Legion 7 series. It is the first Legion 9 product in several years after the mediocre Legion Y920 back in 2017. The latest model is notable for its mini-LED display and integrated liquid cooling thermals.
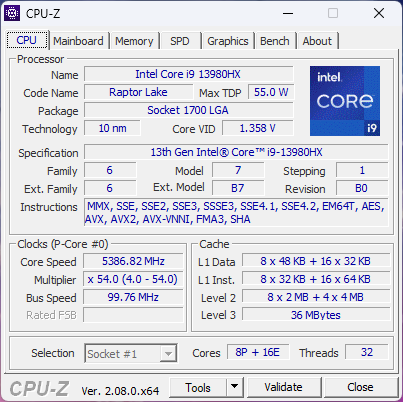
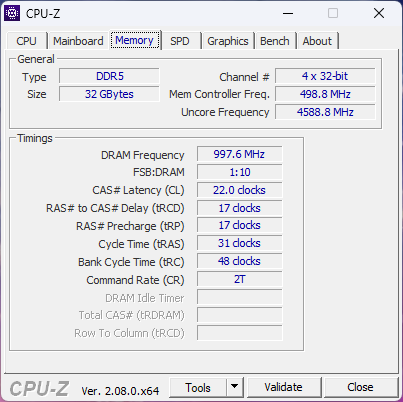
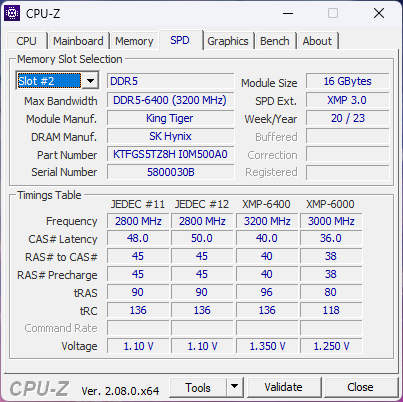
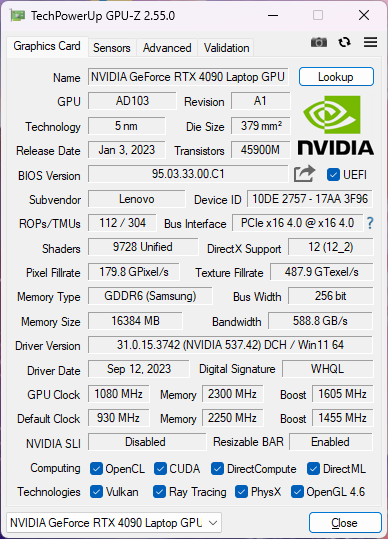
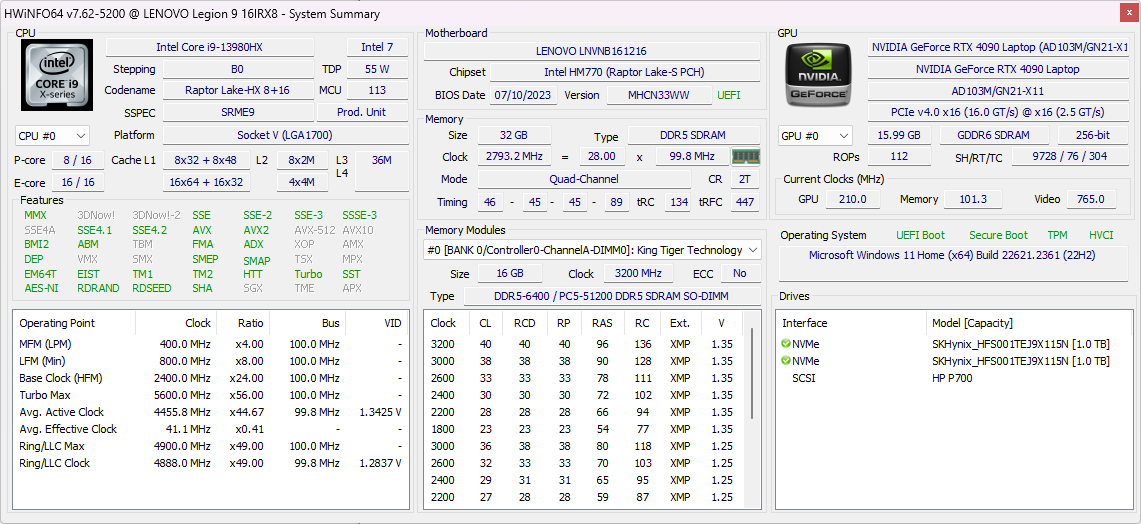
Our unit in review has been configured with everything and the kitchen sink to include a 13th gen Core i9-13980HX CPU, 175 W GeForce RTX 4090 GPU, 1 TB PCIe4 x4 NVMe SSD in RAID 0, and 3.2K (3200 x 2000) mini-LED 165 Hz display with DCI-P3 colors for just under $4000 USD retail. All options at the moment ship with the same Core i9 CPU and mini-LED display while only the GPU can be configured down to the RTX 4080.
Alternatives to the Legion 9i 16 include other 16-inch gaming laptops like the Razer Blade 16, Asus ROG Strix G16, HP Omen Transcend 16, and the Alienware x16 R1.
More Lenovo reviews:
Potential Competitors in Comparison
Rating | Date | Model | Weight | Height | Size | Resolution | Best Price |
|---|---|---|---|---|---|---|---|
| 90.2 % | 10/2023 | Lenovo Legion 9 16IRX8 i9-13980HX, NVIDIA GeForce RTX 4090 Laptop GPU | 2.6 kg | 22.7 mm | 16.00" | 3200x2000 | |
| 87.7 % | 08/2023 | Lenovo Legion Slim 5 16APH8 R7 7840HS, NVIDIA GeForce RTX 4060 Laptop GPU | 2.4 kg | 25.2 mm | 16.00" | 2560x1600 | |
| 89.8 % | 03/2023 | Razer Blade 16 Early 2023 RTX 4090 i9-13950HX, NVIDIA GeForce RTX 4090 Laptop GPU | 2.5 kg | 21.99 mm | 16.00" | 3840x2400 | |
| 88.4 % | 03/2023 | Asus ROG Strix G16 G614JZ i9-13980HX, NVIDIA GeForce RTX 4080 Laptop GPU | 2.4 kg | 30.4 mm | 16.00" | 2560x1600 | |
| 87.9 % | 08/2023 | HP Omen Transcend 16 i9-13900HX, NVIDIA GeForce RTX 4070 Laptop GPU | 2.3 kg | 19.8 mm | 16.00" | 2560x1600 | |
| 88.4 % | 06/2023 | Alienware x16 R1 i9-13900HK, NVIDIA GeForce RTX 4080 Laptop GPU | 2.6 kg | 18.57 mm | 16.00" | 2560x1600 |
Case — An Evolved Legion Design
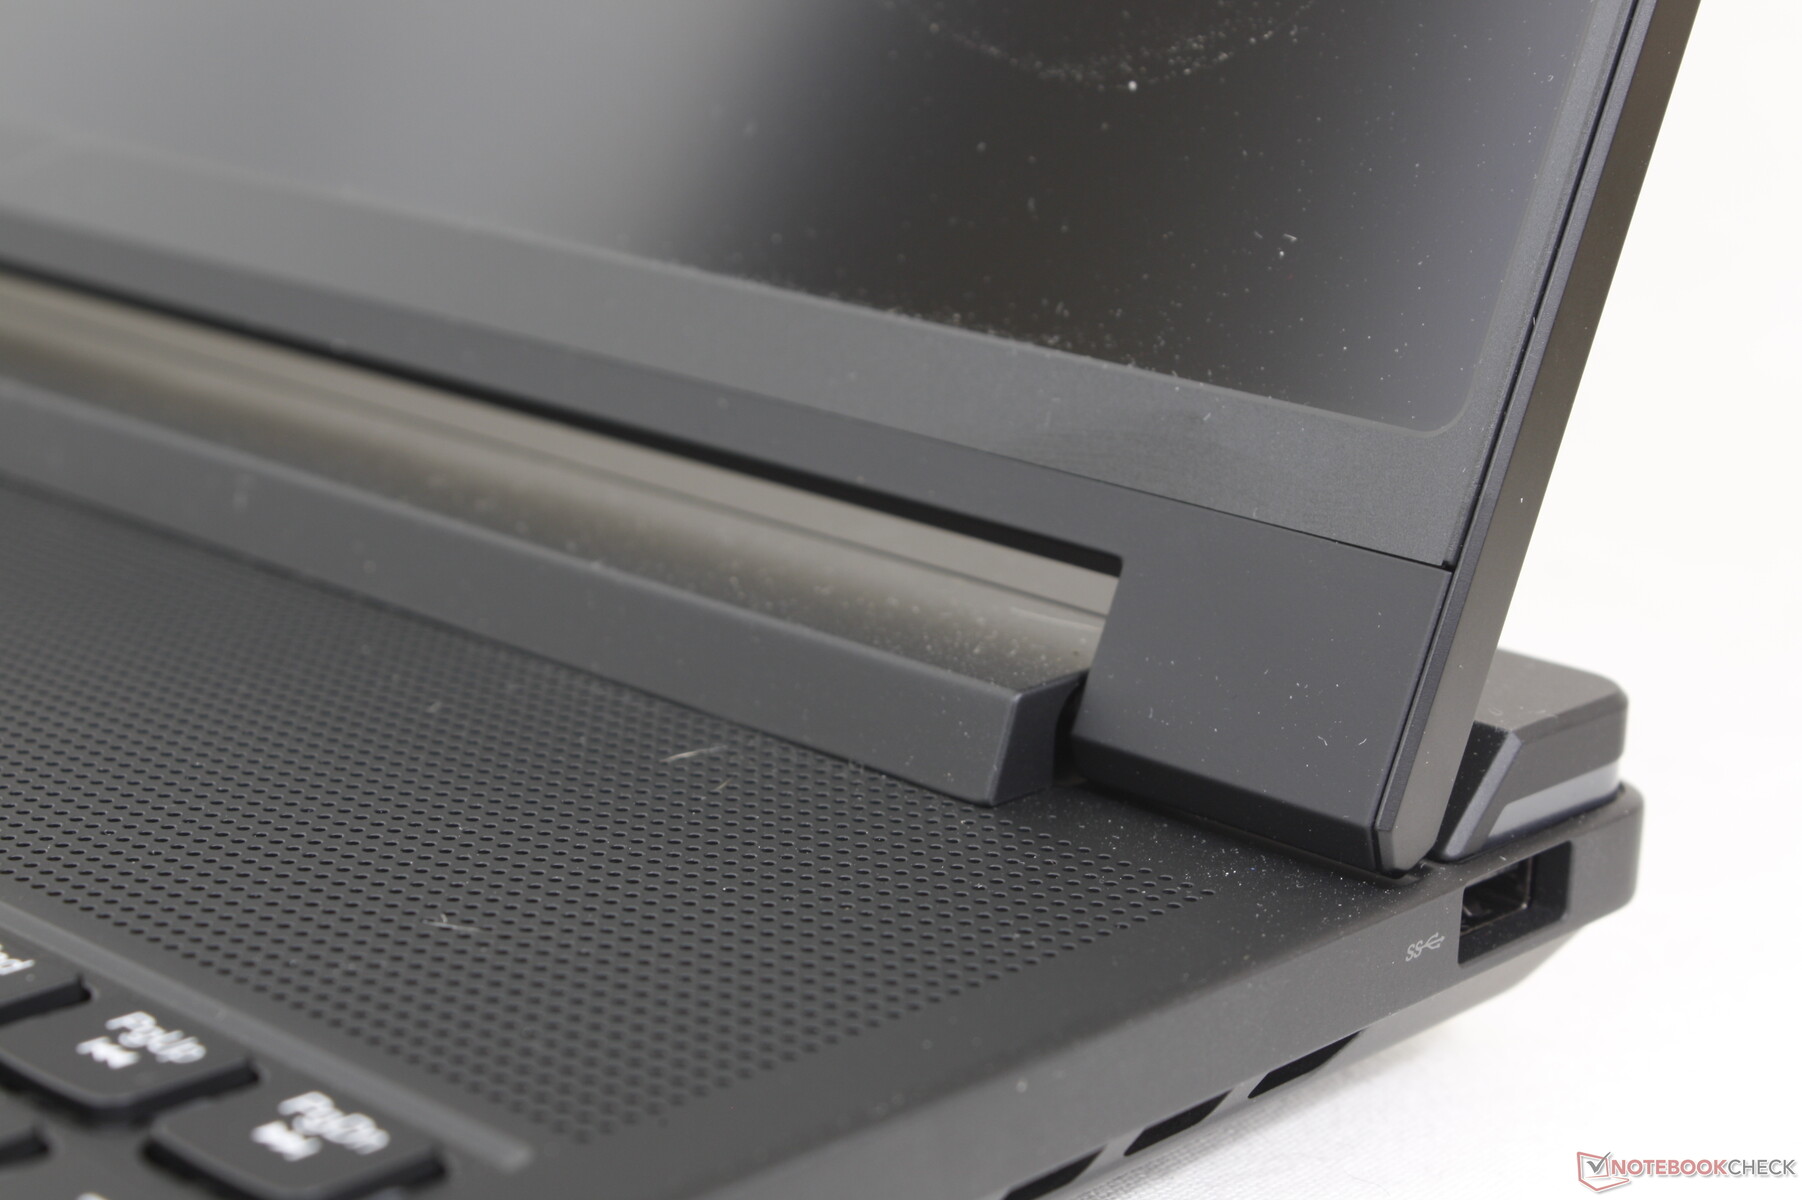
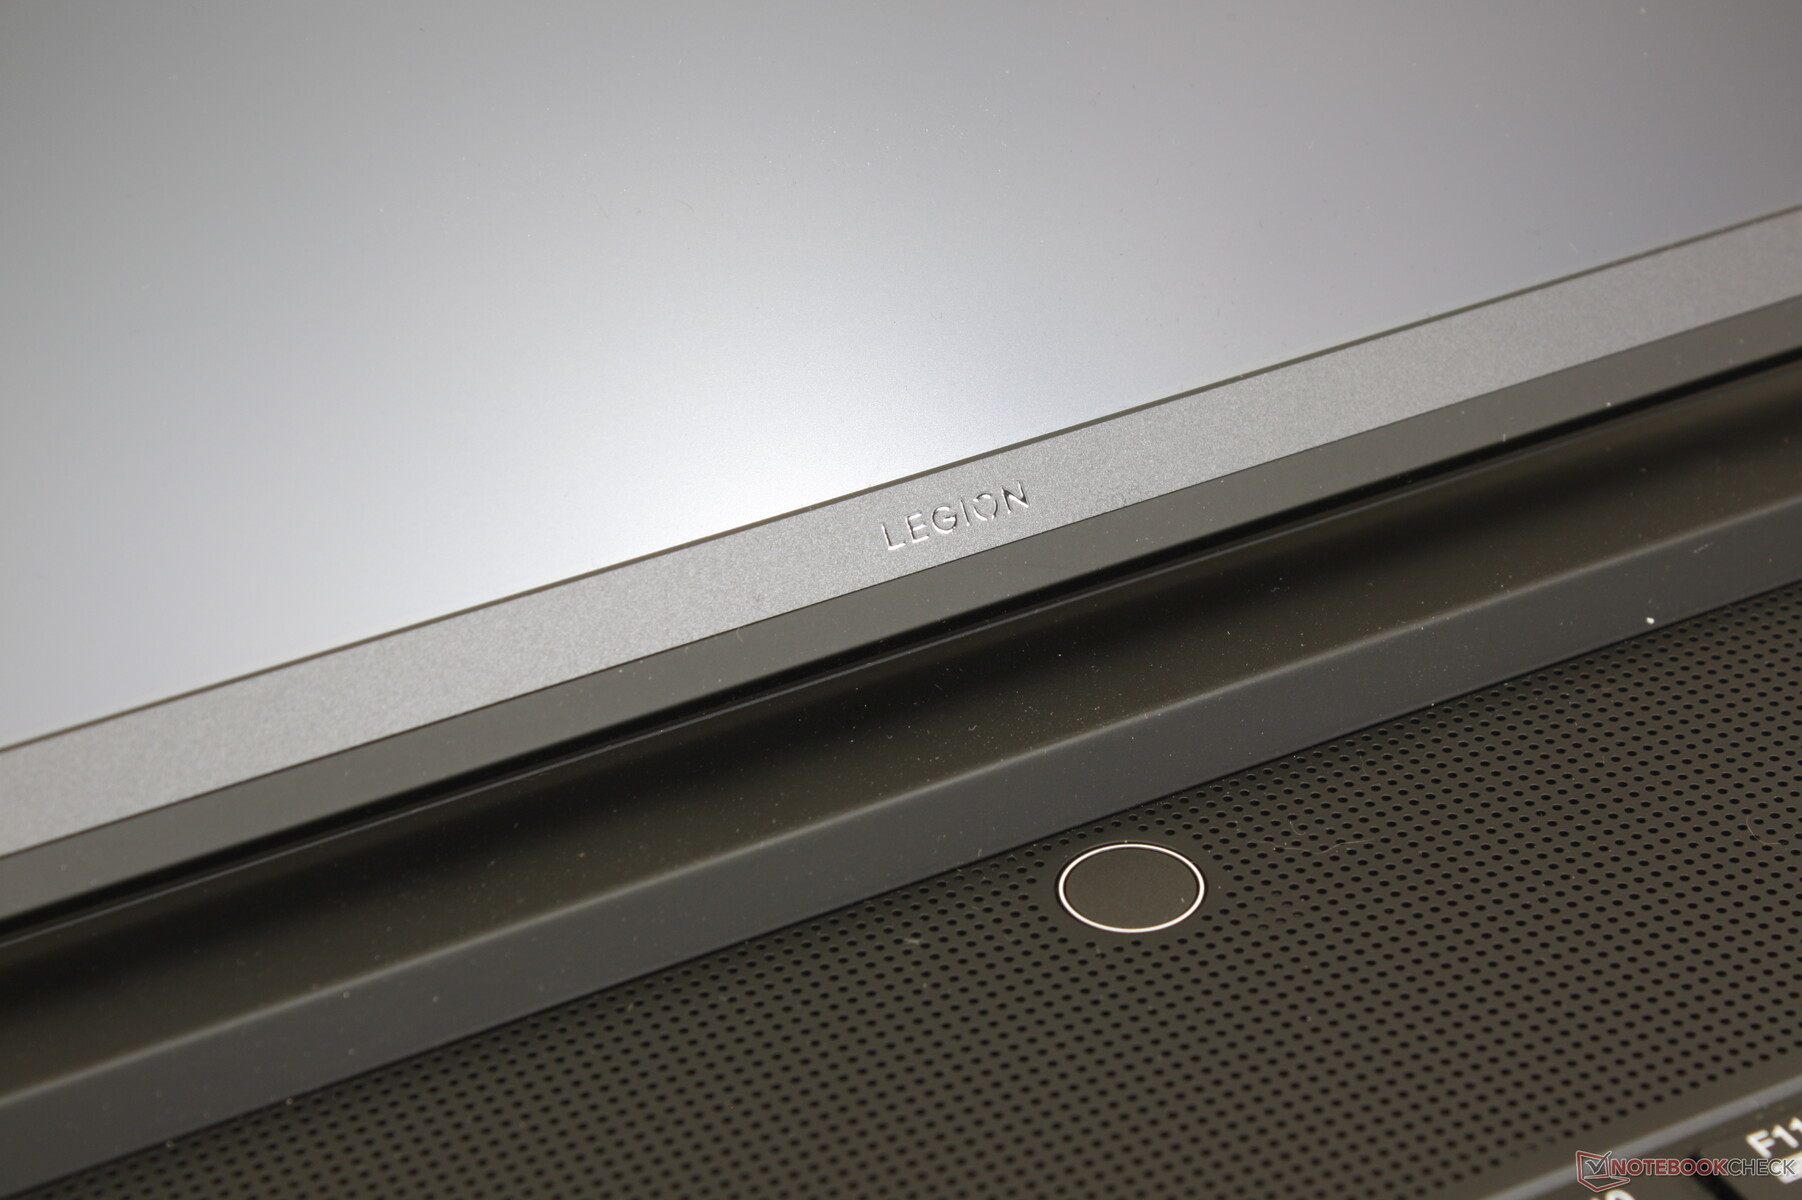
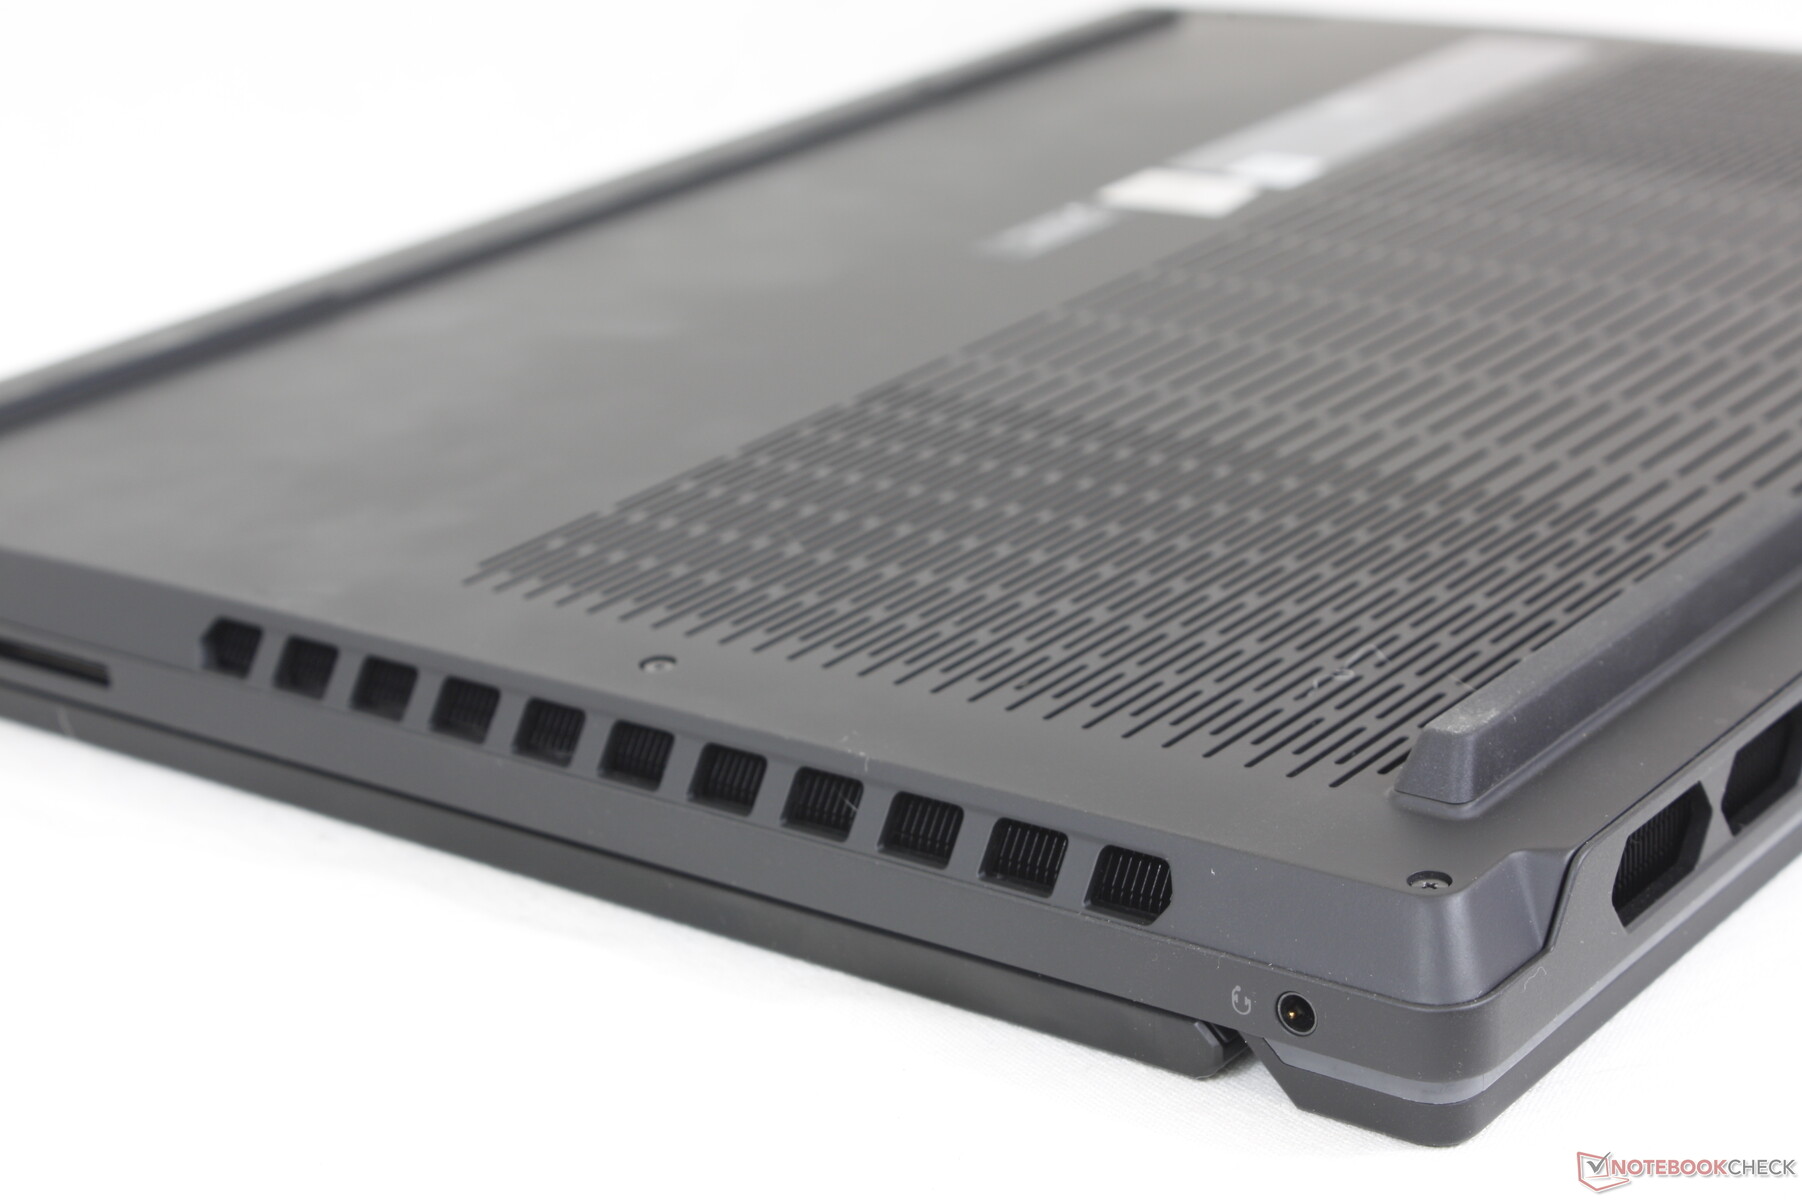
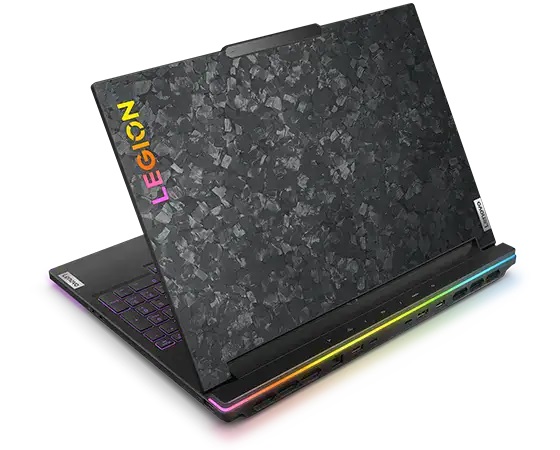
The Legion 9i 16 utilizes similar matte magnesium materials as on the Legion 7 series, but they are visually very different. Firstly, the keyboard has been pushed forward to be closer to the user similar to the Asus Zephyrus S GX531 in order to make room for more ventilation grilles and a larger cooling solution. Secondly, a unique carbon wrap pattern around the outer lid helps to reduce fingerprint buildup while contributing to the gamer aesthetic. And lastly, the protruding rear has thickened to better accommodate all the internal changes and more demanding hardware.
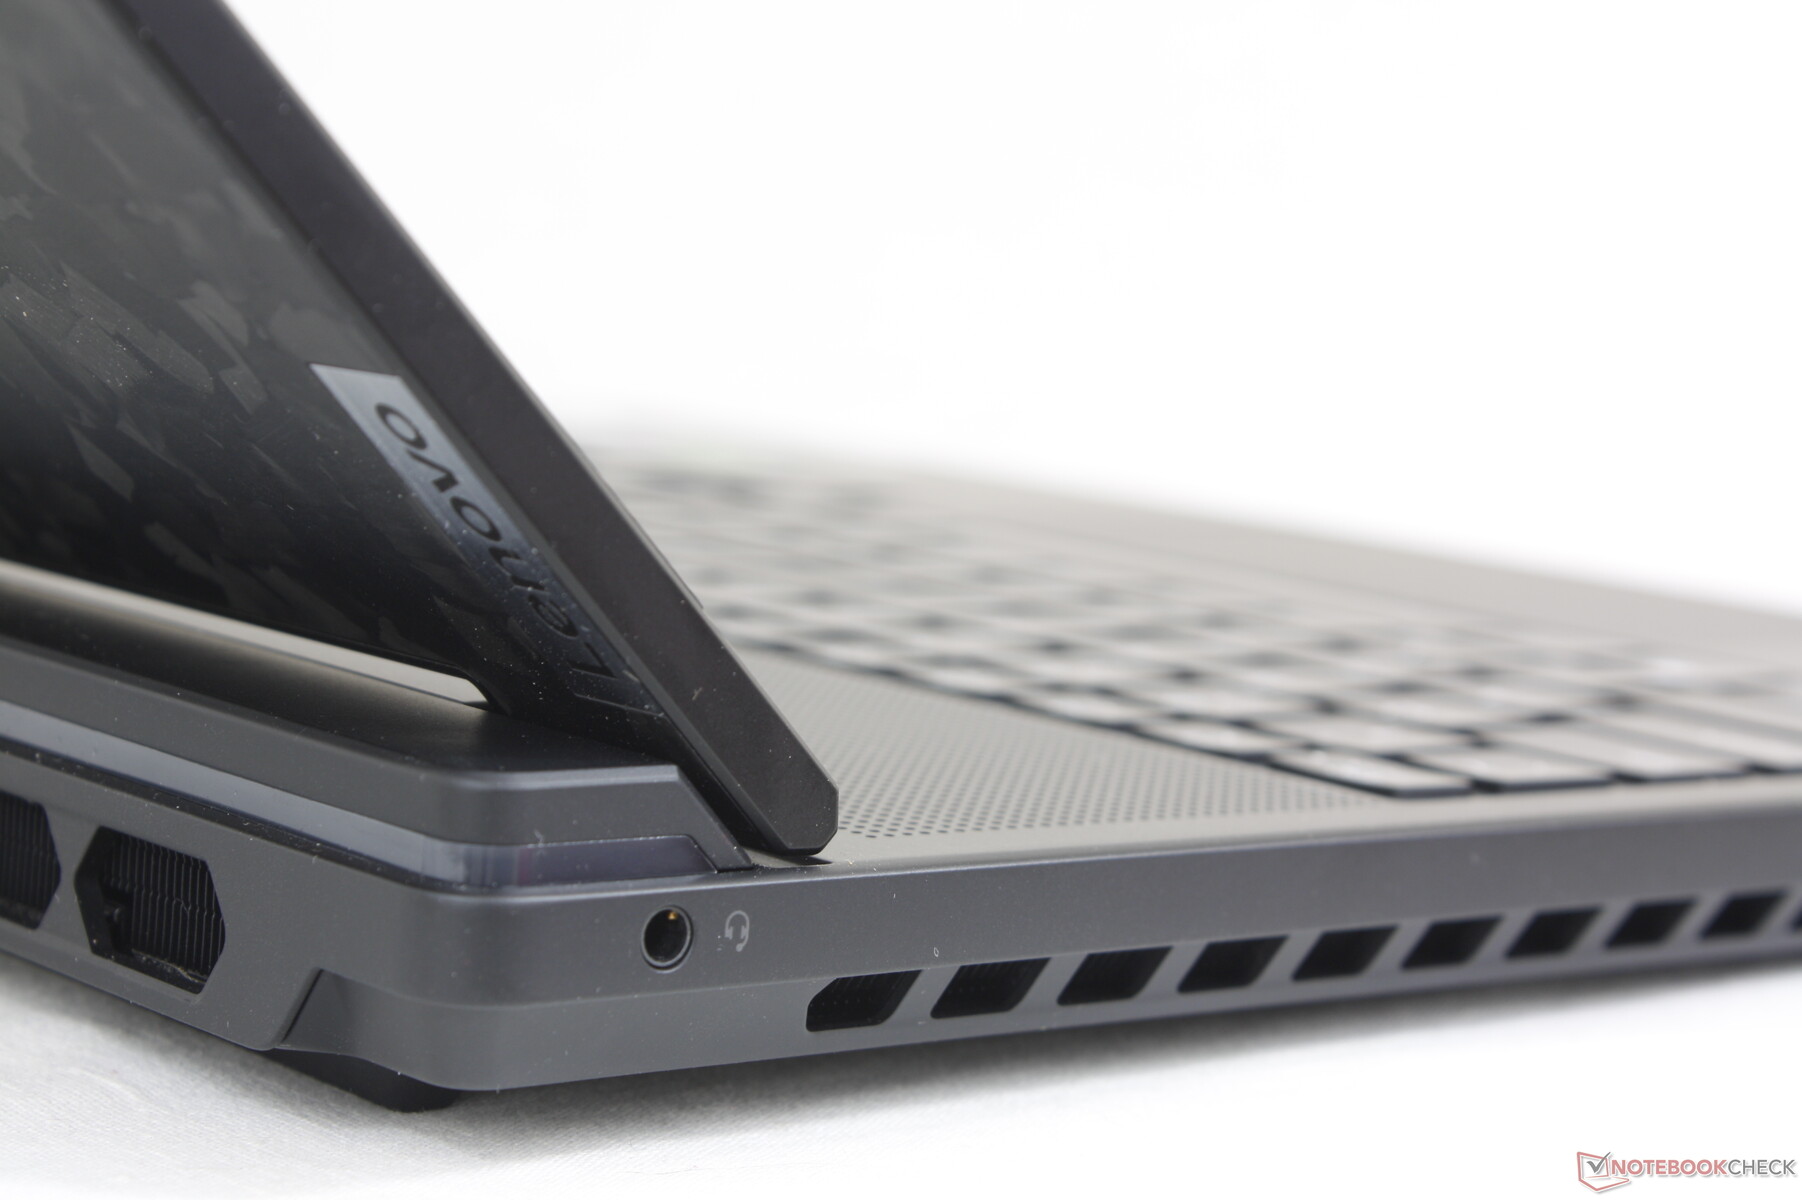
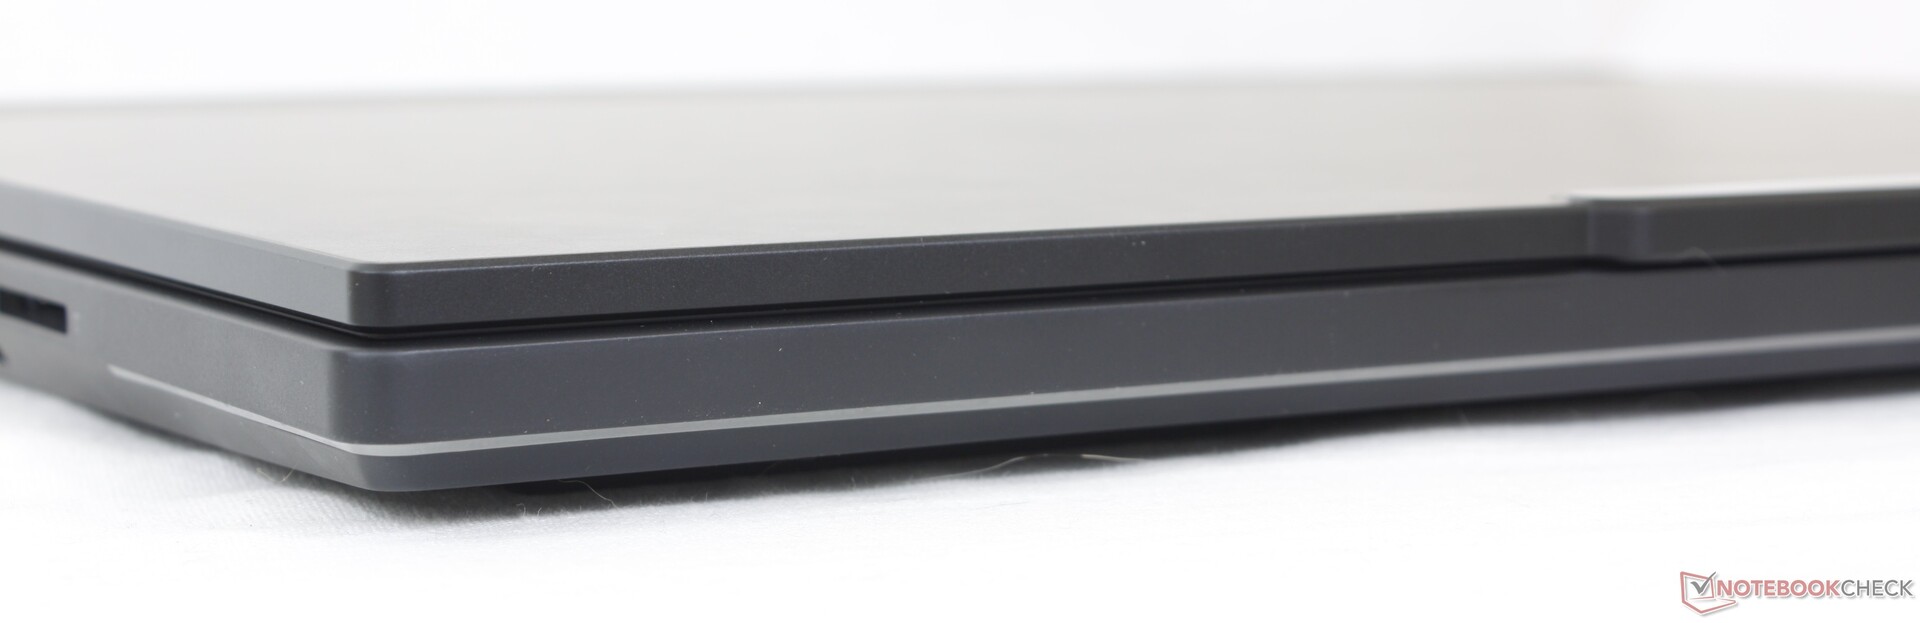
Chassis quality is excellent with only a bit of yielding when attempting to twist the lid or depress the keyboard center or palm rests. It doesn't feel any better or worse than the Legion 7 16 or Alienware x16 R1 in terms of rigidity especially since they all weigh about the same. However, the hinges remain relatively small compared to the much larger hinges of the Asus Strix series or the recent MSI Raider GE68. They may be satisfactory when new, but only time will tell how well they will fare in the long run.
The extended rear and demanding Core i9/RTX 4090 internals have led to a larger and thicker chassis than the Legion 7 16. The differences are noticeable as the Legion 9i 16 is larger than many other 16-inch gaming laptops like the ROG Strix G16, Blade 16, or Omen Transcend 16. High performance and advanced features come at the cost of portability in this regard.
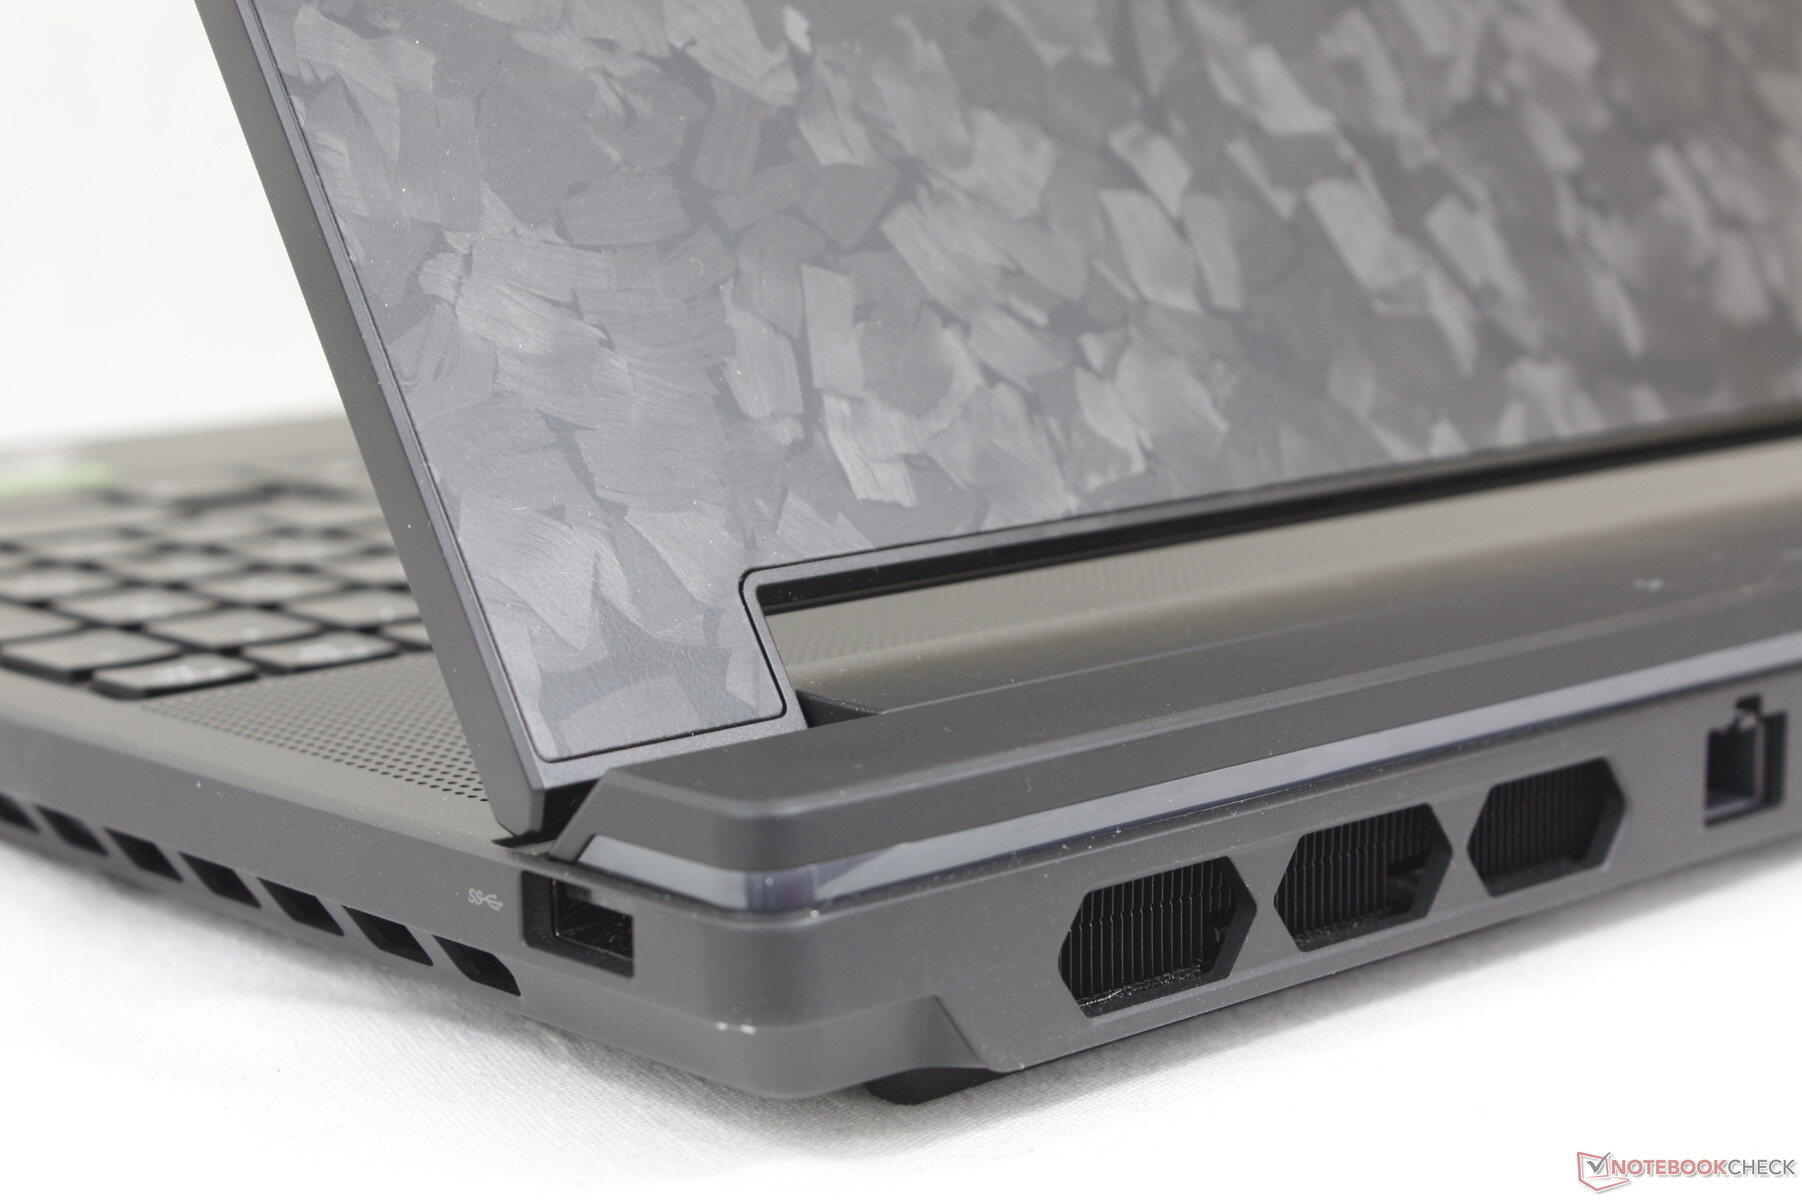
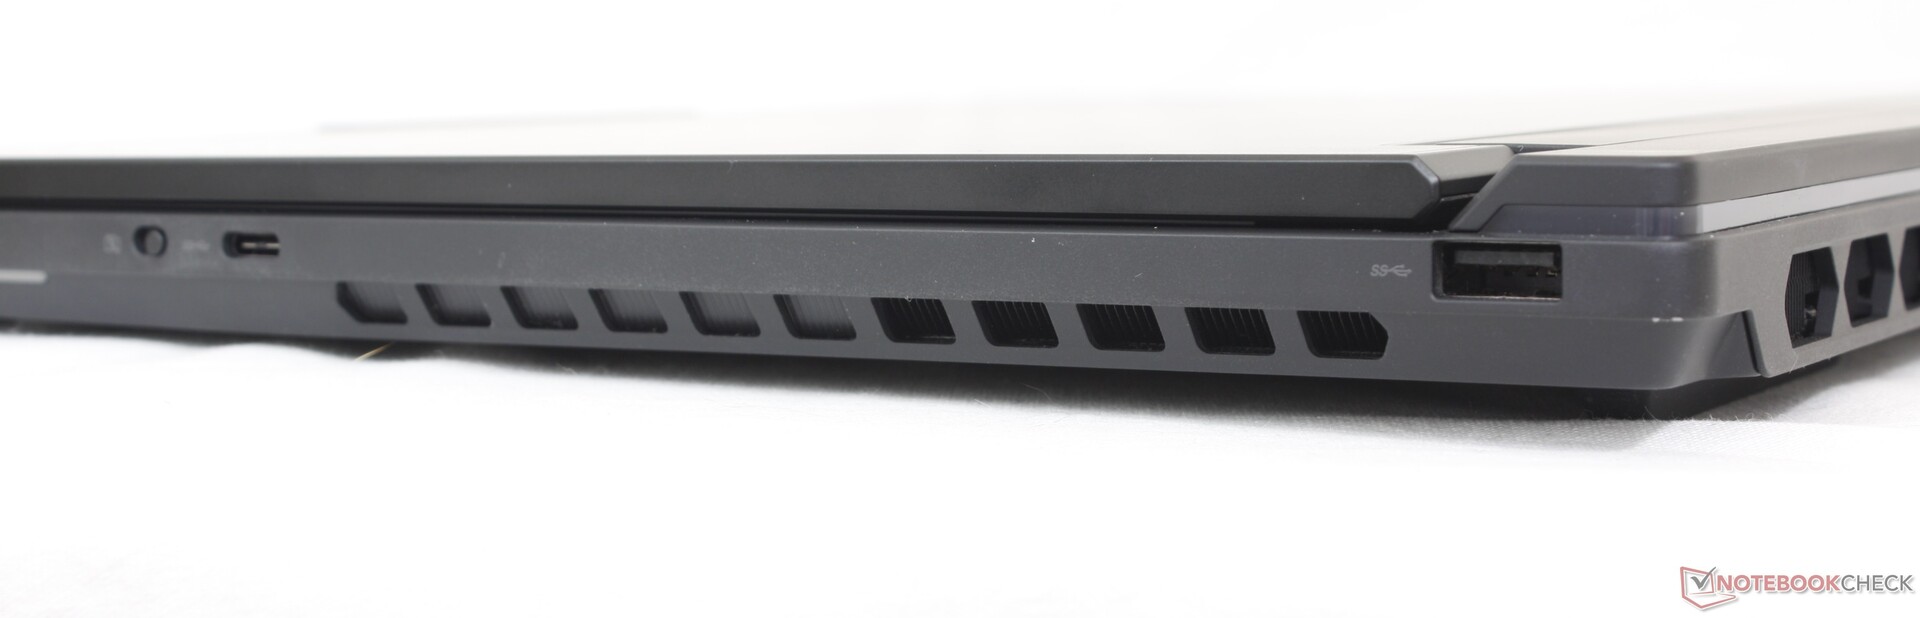
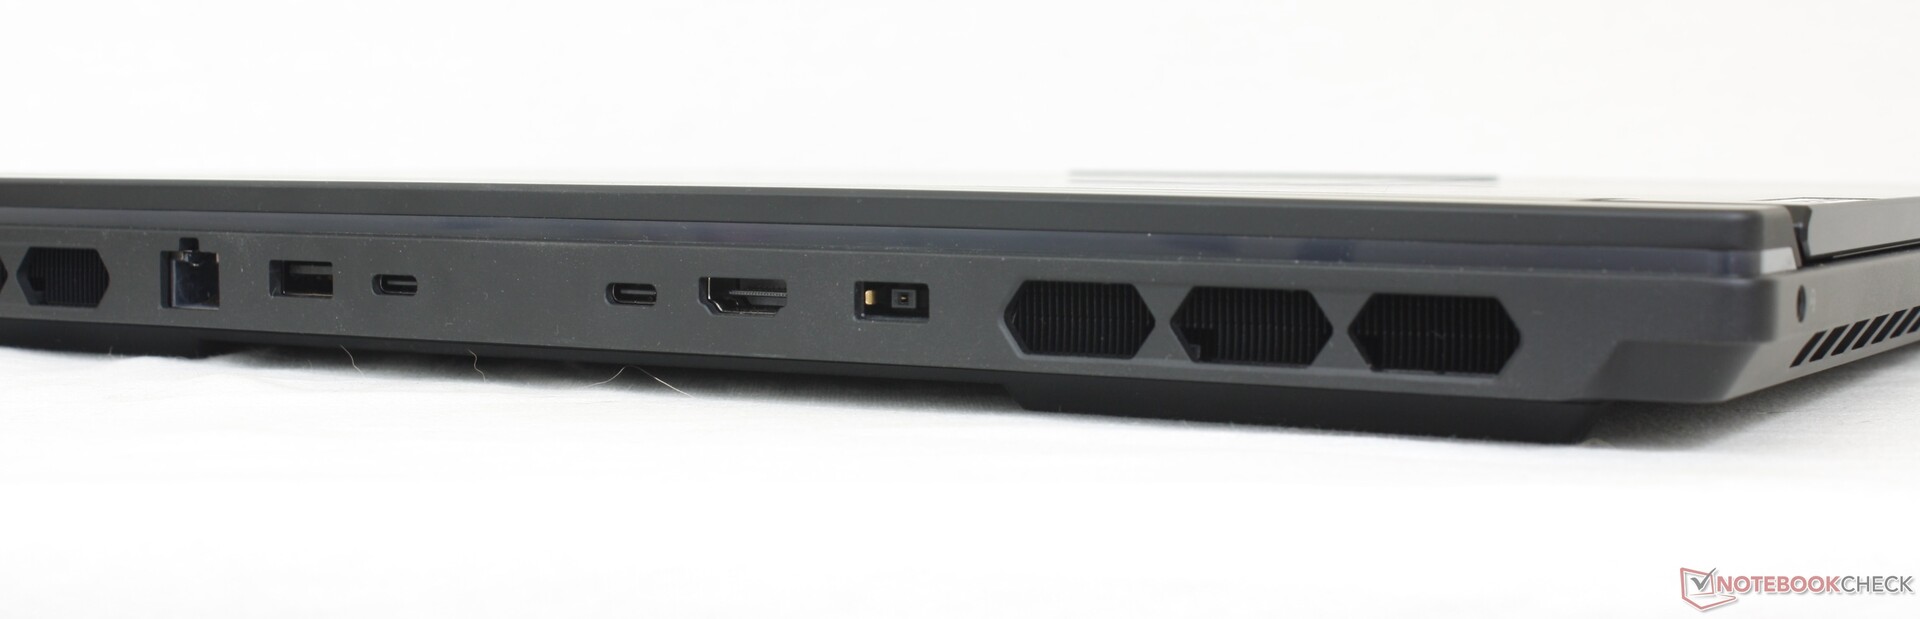
Connectivity — Lots To Choose From
Port options are plentiful with most of them located along the rear instead of the sides. Unlike the rear ports on the Alienware X16 R1, however, the ports on the Lenovo are individually labeled with LED indicators for easier access.
Only the two rear USB-C ports can be used for external monitors or for recharging the laptop via Power Delivery. The third USB-C port along the right edge is for data and charging external devices only.

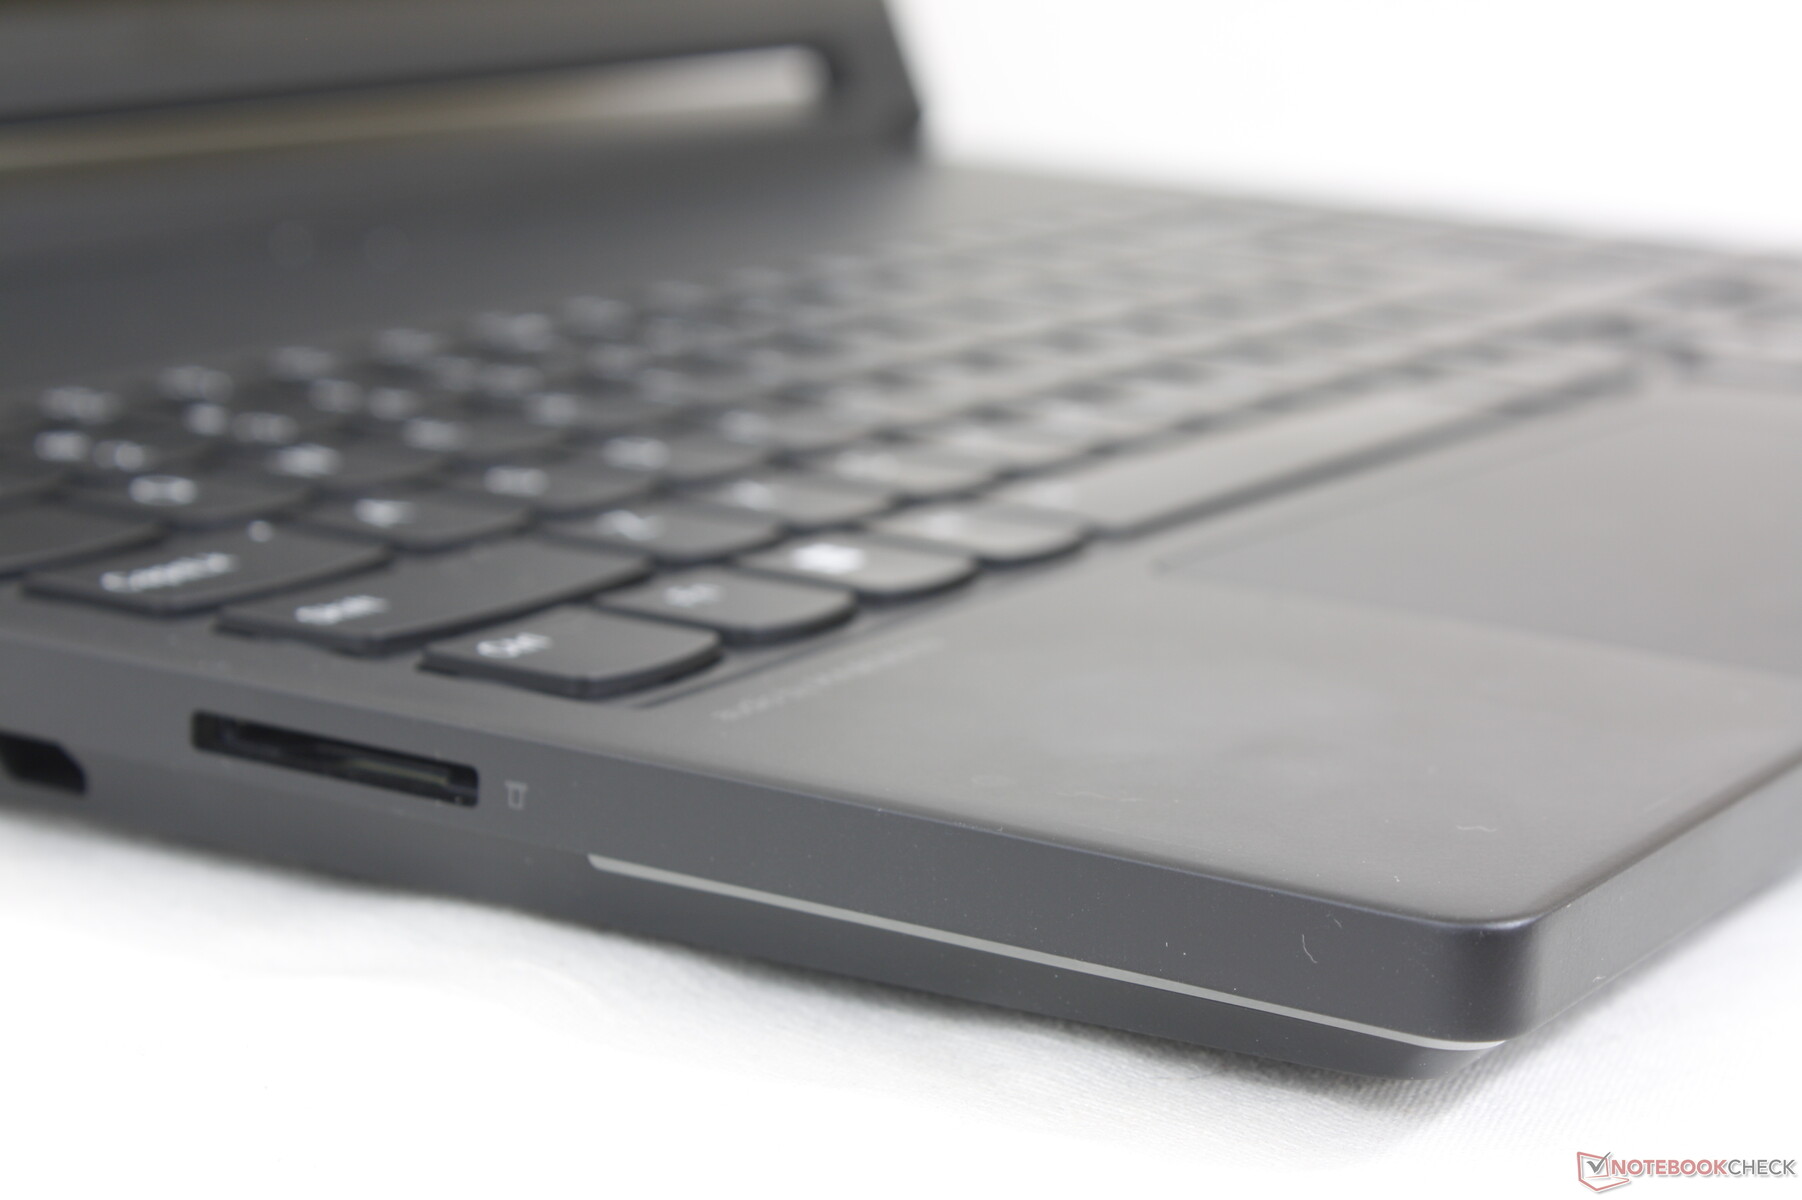
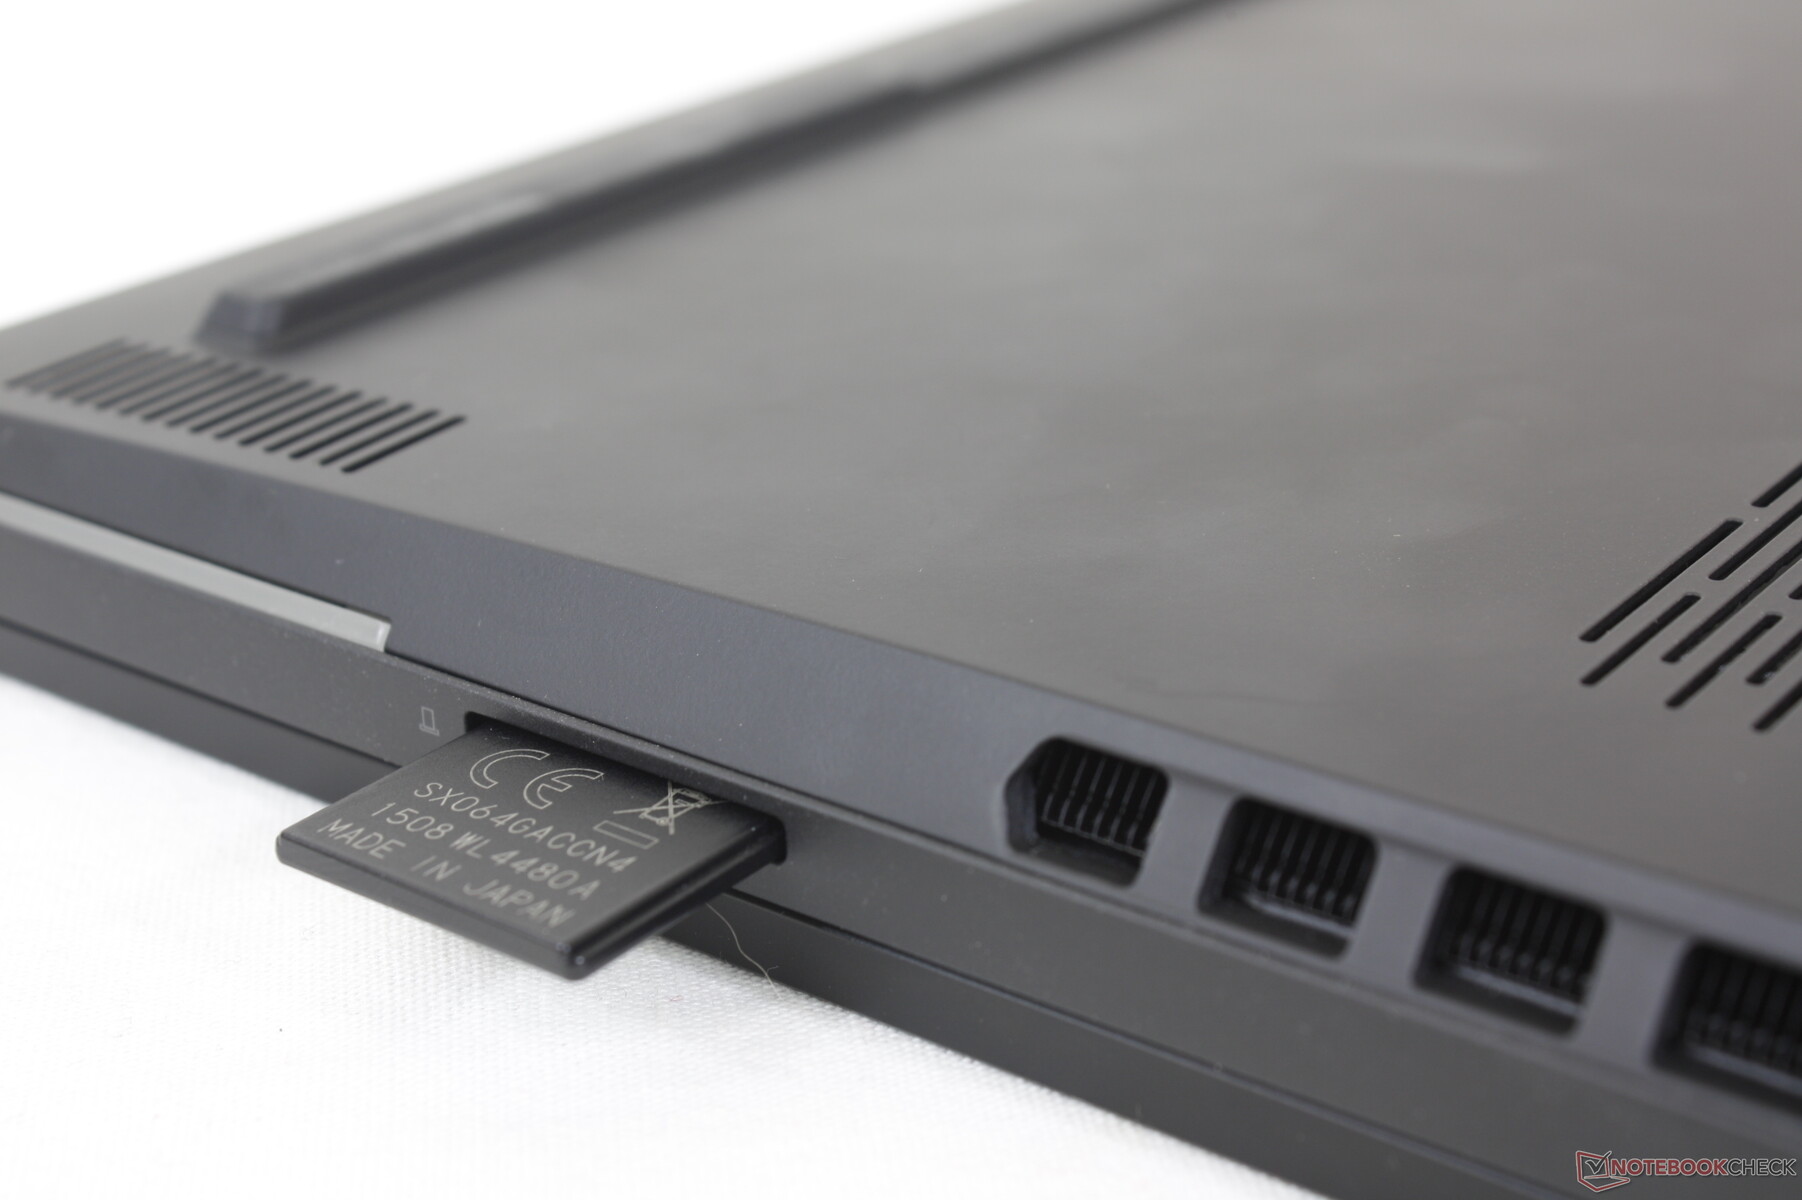
SD Card Reader
The integrated SD reader is an intention to attract content creators as much as hardcore gamers to the Legion 9i. Transfer rates aren't that great, however, at less than half the speed of the SD reader on the Razer Blade 16.
| SD Card Reader | |
| average JPG Copy Test (av. of 3 runs) | |
| Razer Blade 16 Early 2023 RTX 4090 (Angelbird AV PRO 128 GB V60) | |
| Lenovo Legion 9 16IRX8 (Toshiba Exceria Pro SDXC 64 GB UHS-II) | |
| Alienware x16 R1 (AV PRO microSD 128 GB V60) | |
| Lenovo Legion Slim 5 16APH8 (PNY EliteX-Pro60 V60 256 GB) | |
| maximum AS SSD Seq Read Test (1GB) | |
| Alienware x16 R1 (AV PRO microSD 128 GB V60) | |
| Razer Blade 16 Early 2023 RTX 4090 (Angelbird AV PRO 128 GB V60) | |
| Lenovo Legion 9 16IRX8 (Toshiba Exceria Pro SDXC 64 GB UHS-II) | |
| Lenovo Legion Slim 5 16APH8 (PNY EliteX-Pro60 V60 256 GB) | |
Communication
The Killer AX1675i comes standard which is the gaming brand for the regular AX211. Wi-Fi 6E and Bluetooth 5.3 are supported and we experienced no connectivity issues when paired to our Asus AXE11000 6 GHz network.
Webcam
The 2 MP webcam is standard for the gaming laptop category. While there is an integrated camera kill switch, there is no IR sensor.

")
")
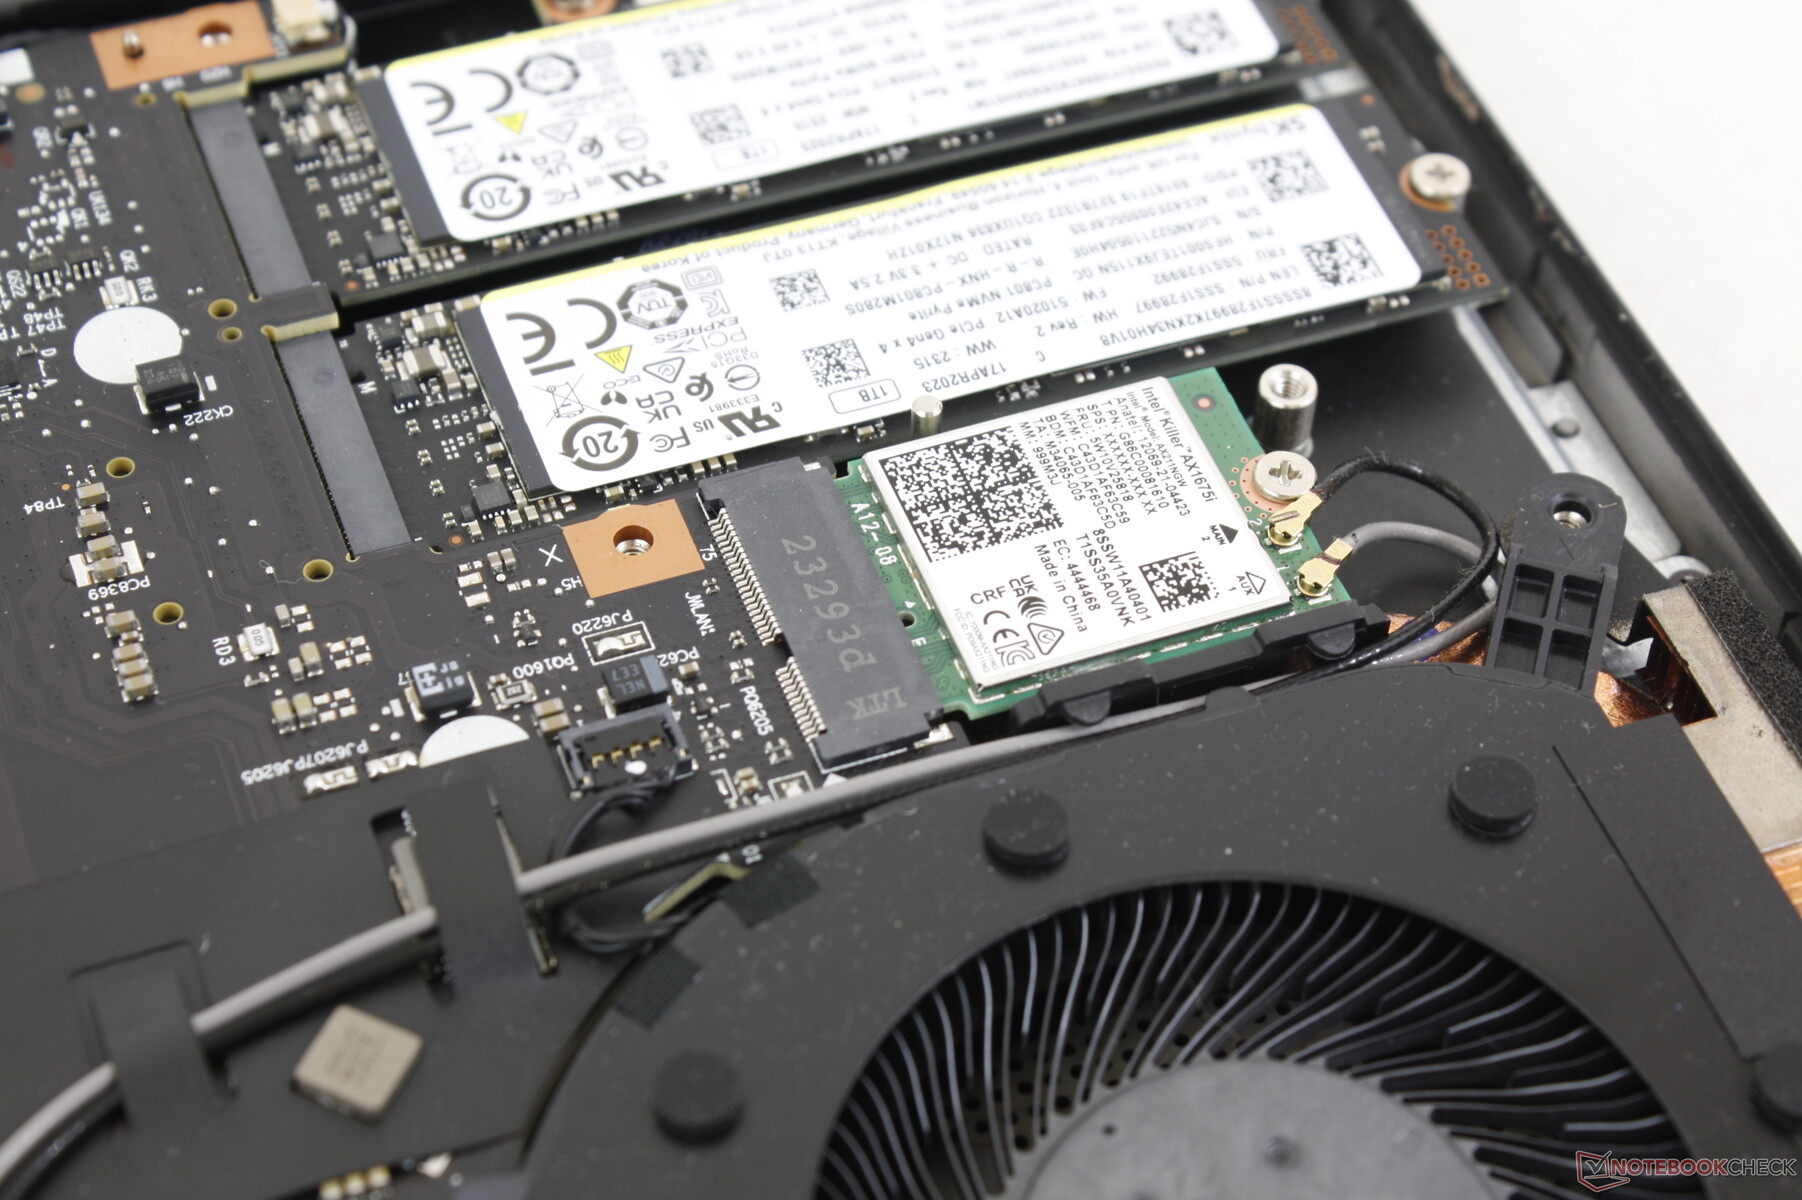
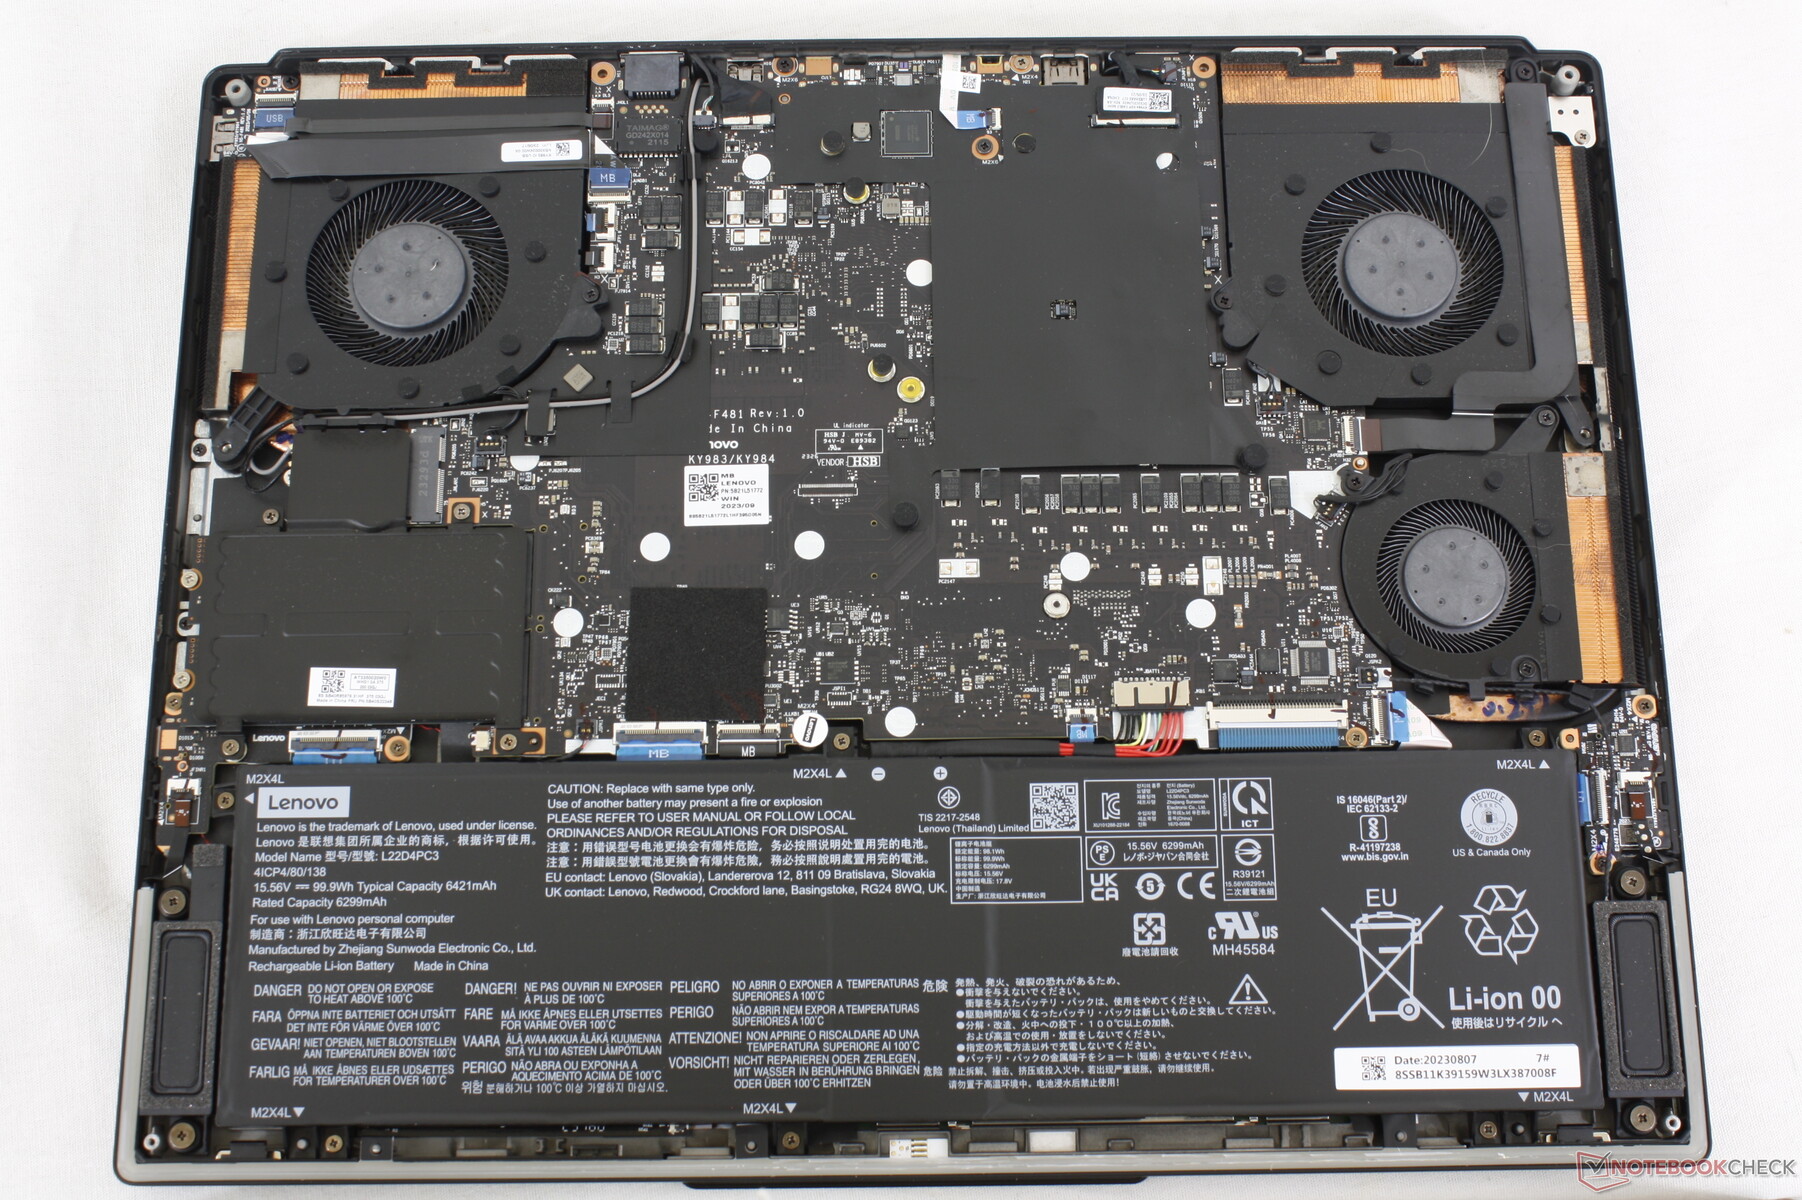
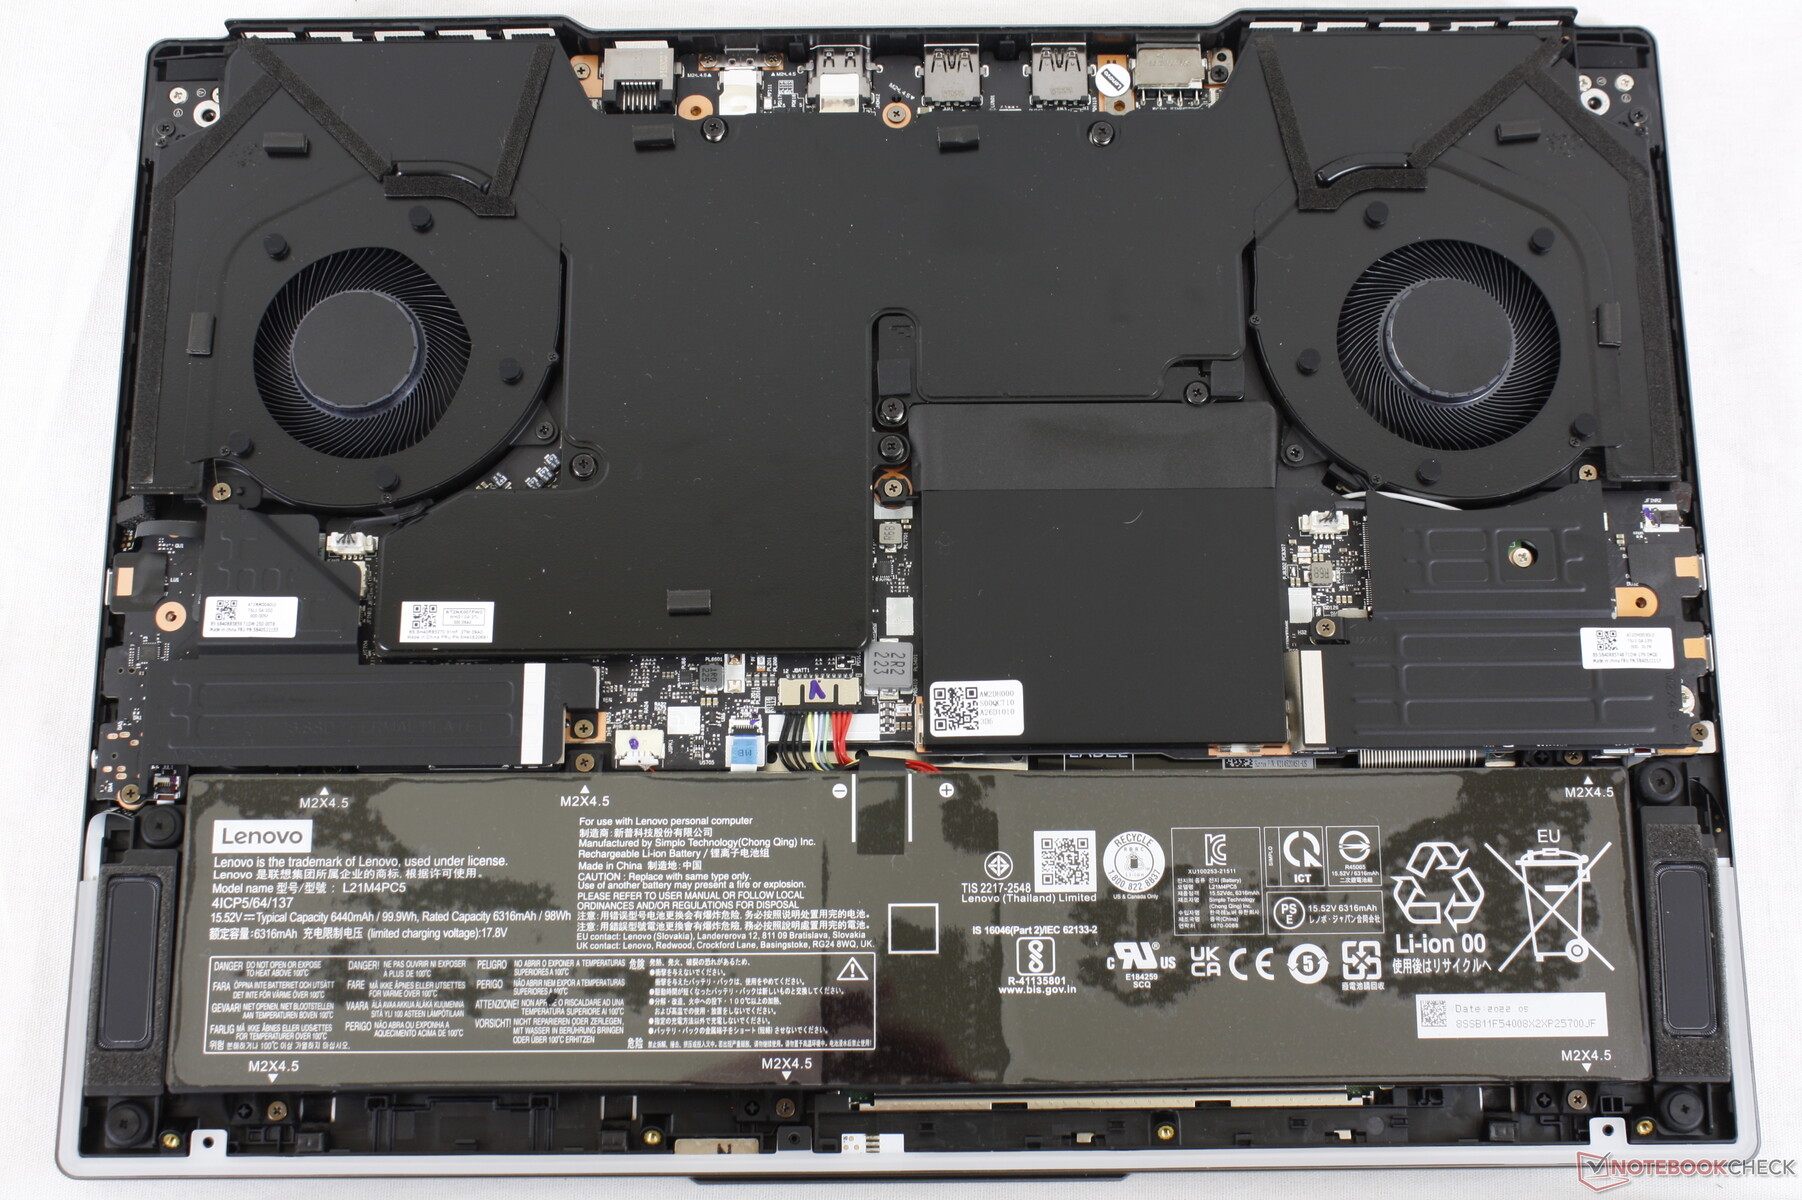
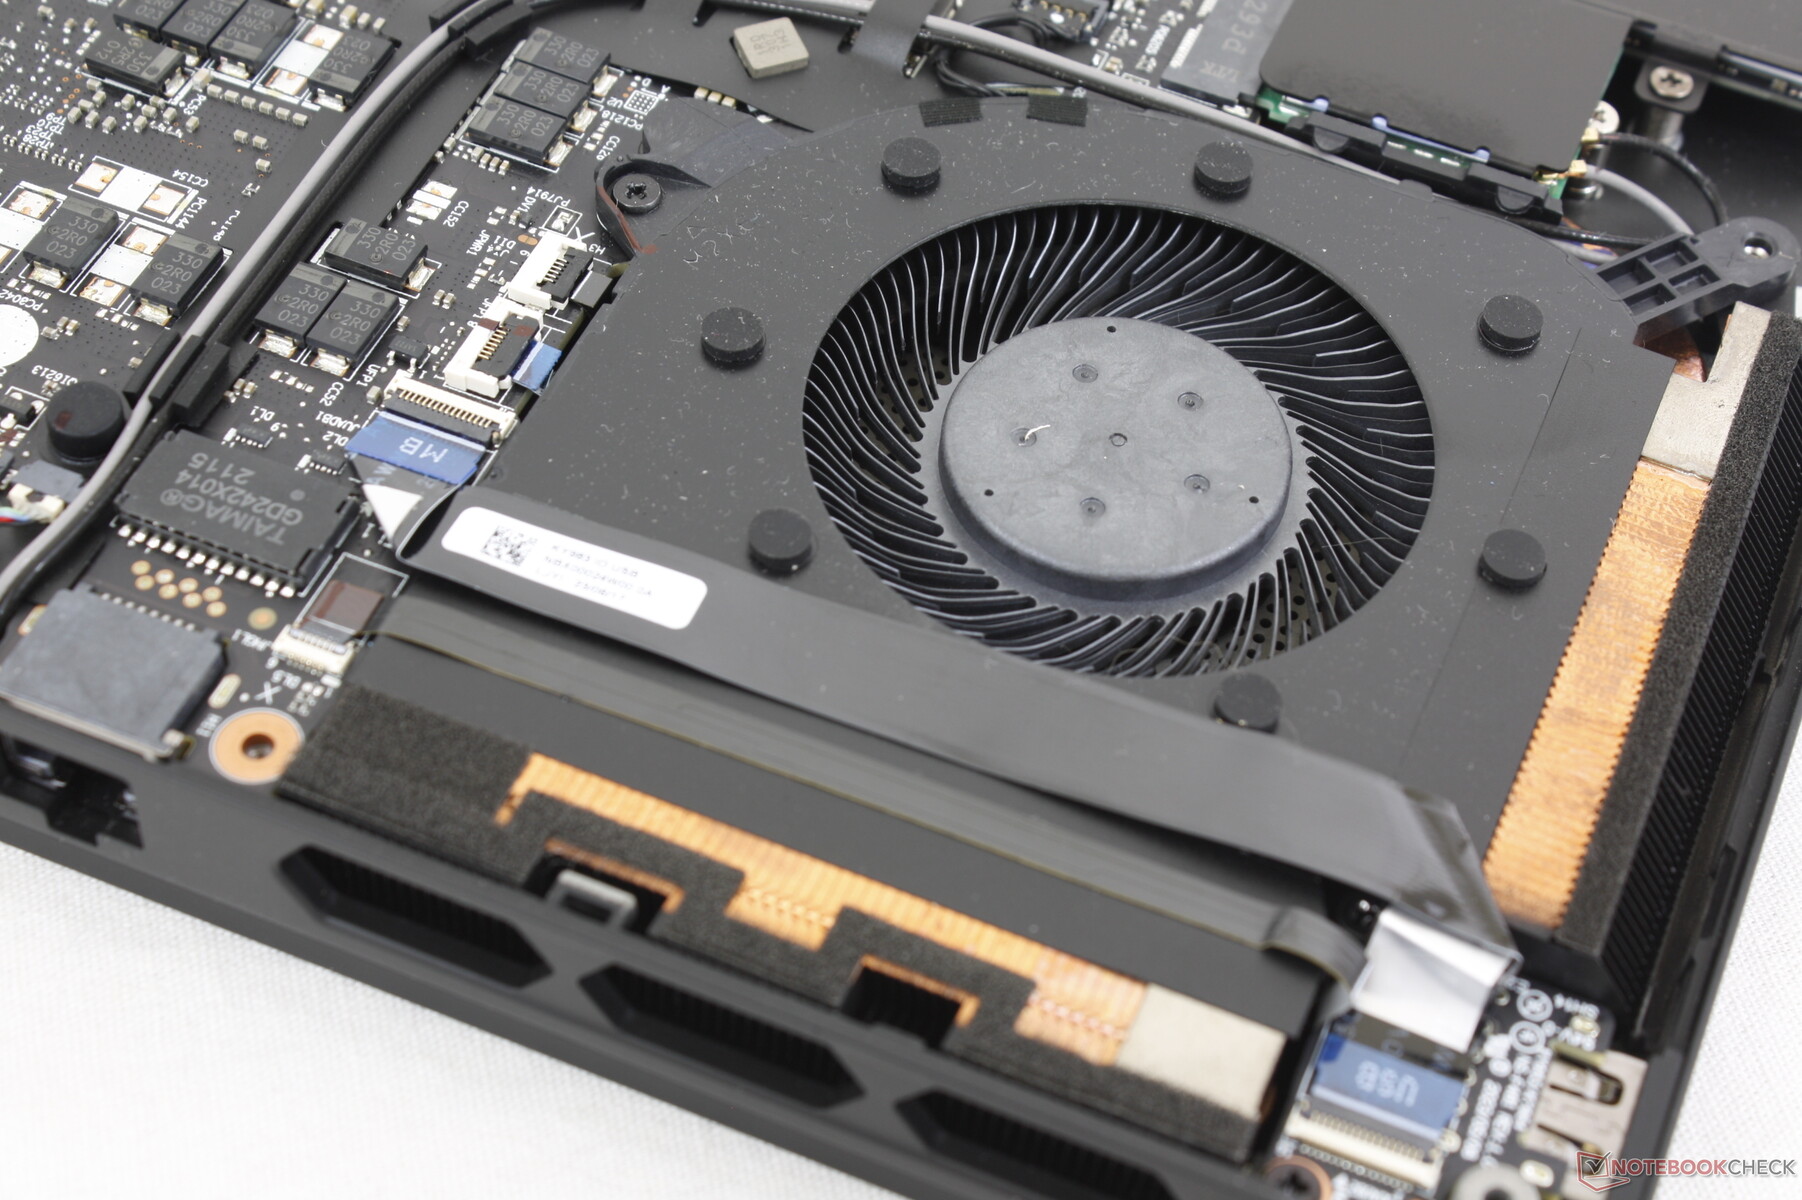
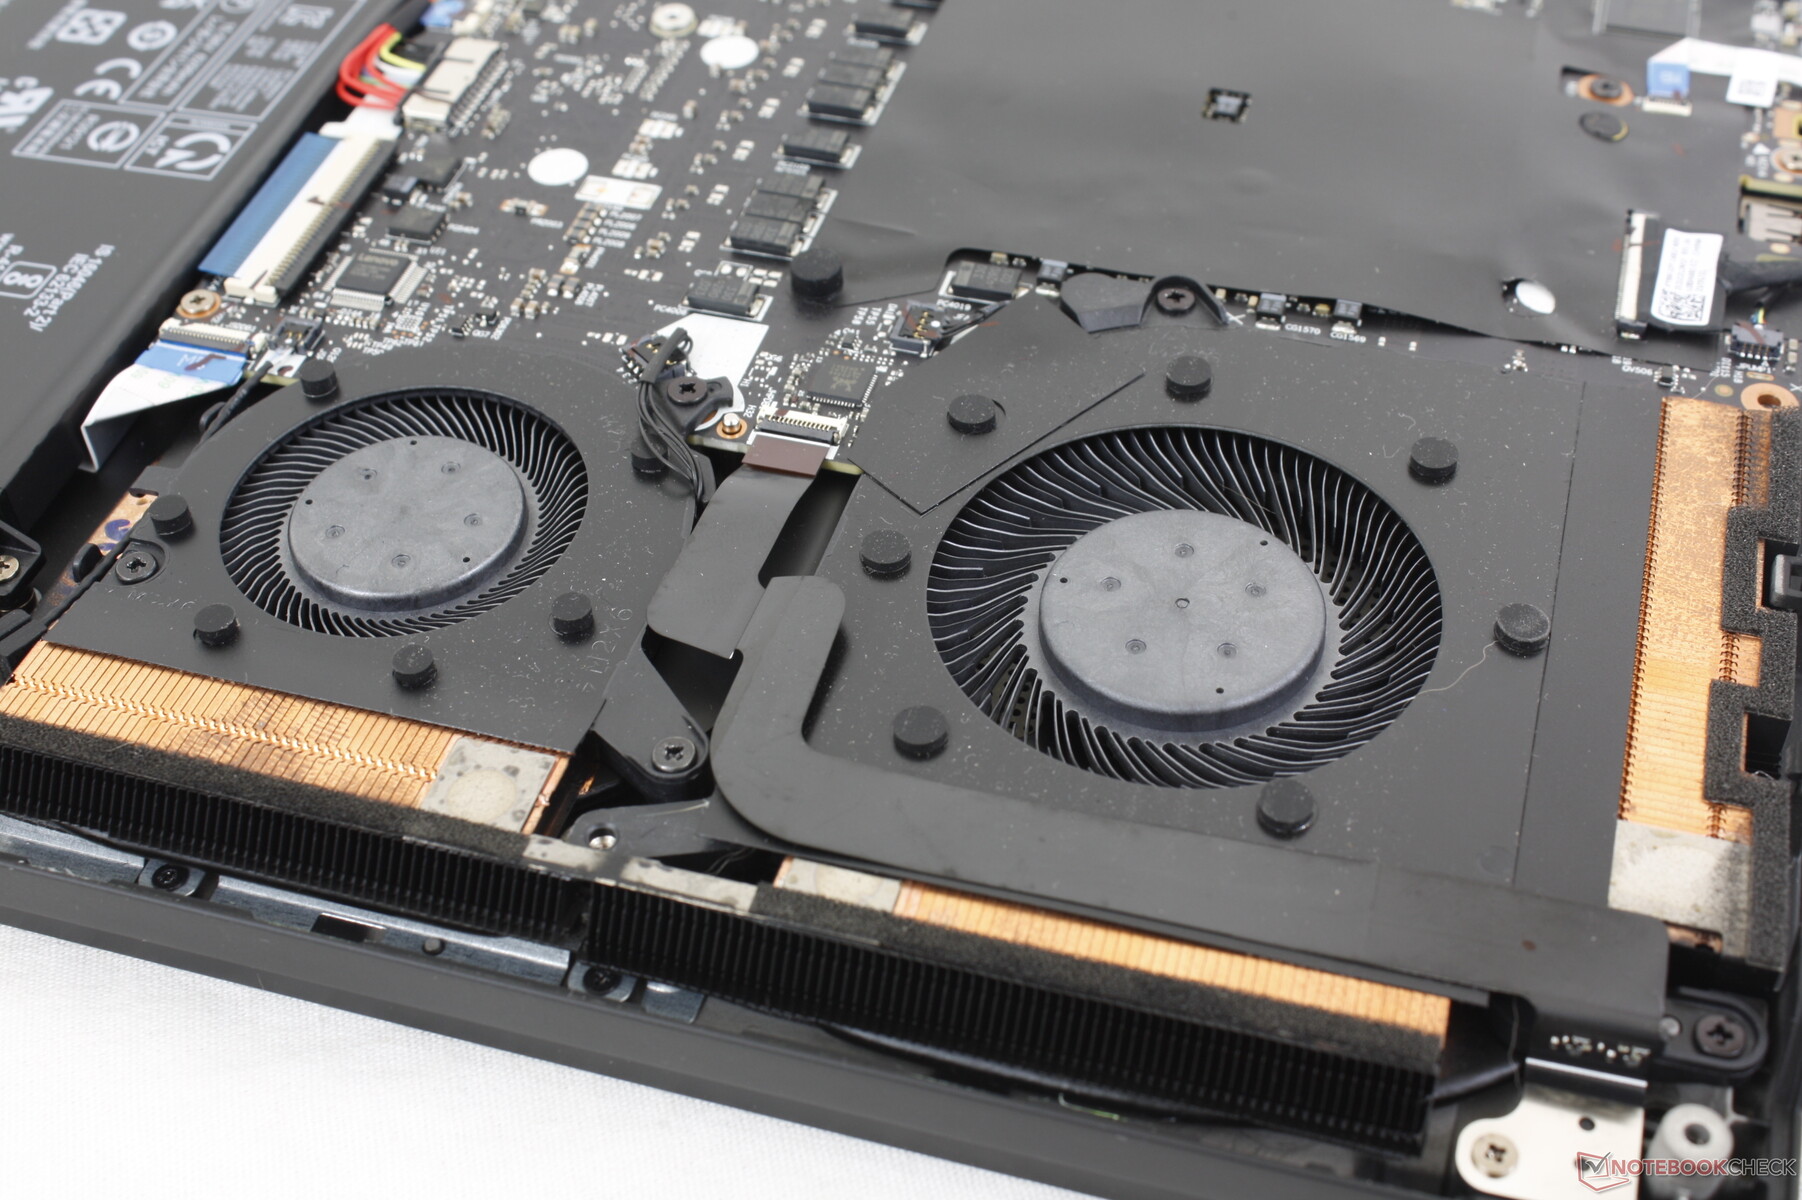
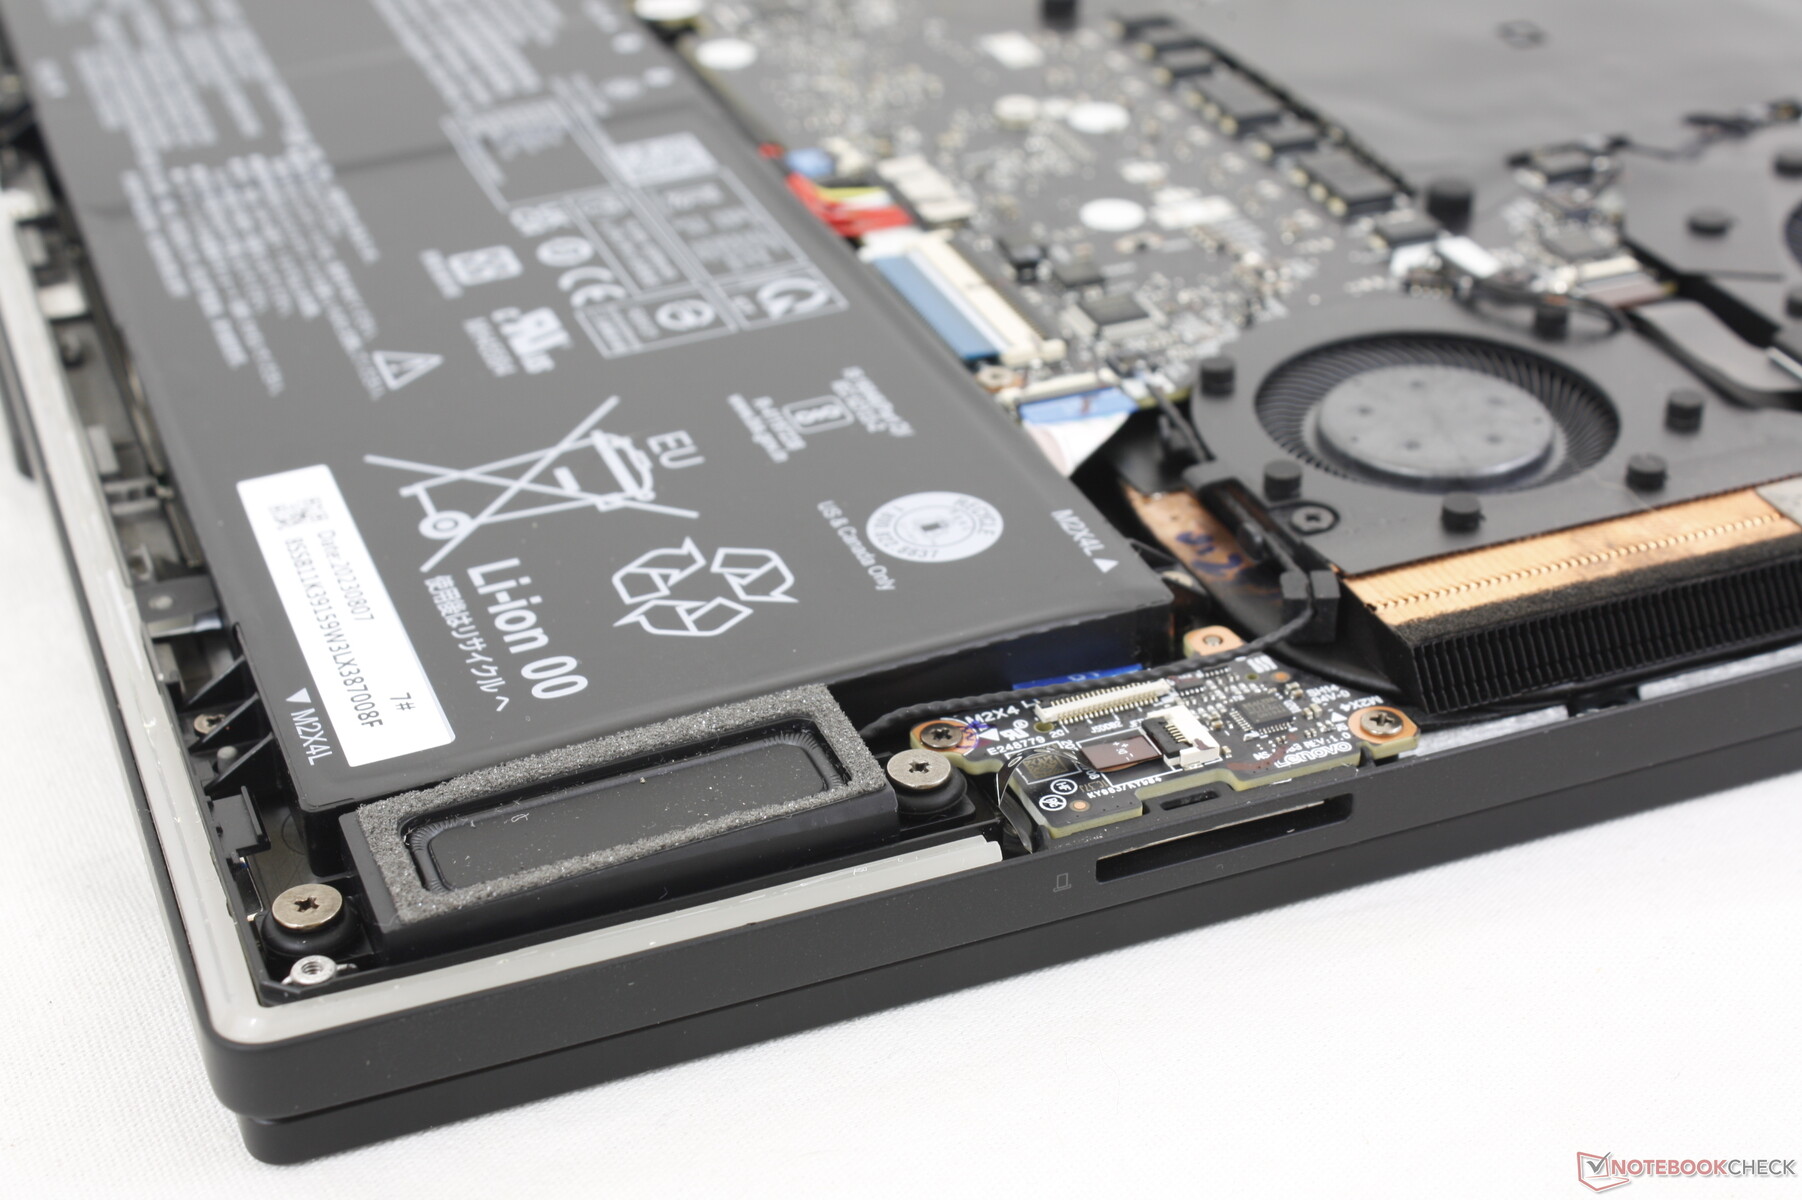
Maintenance
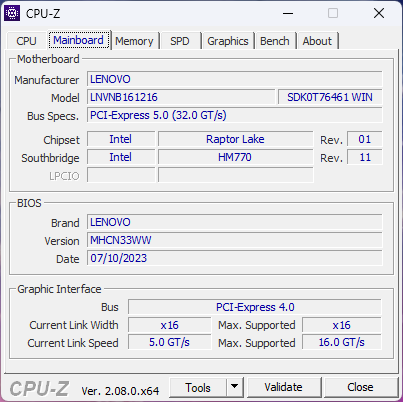
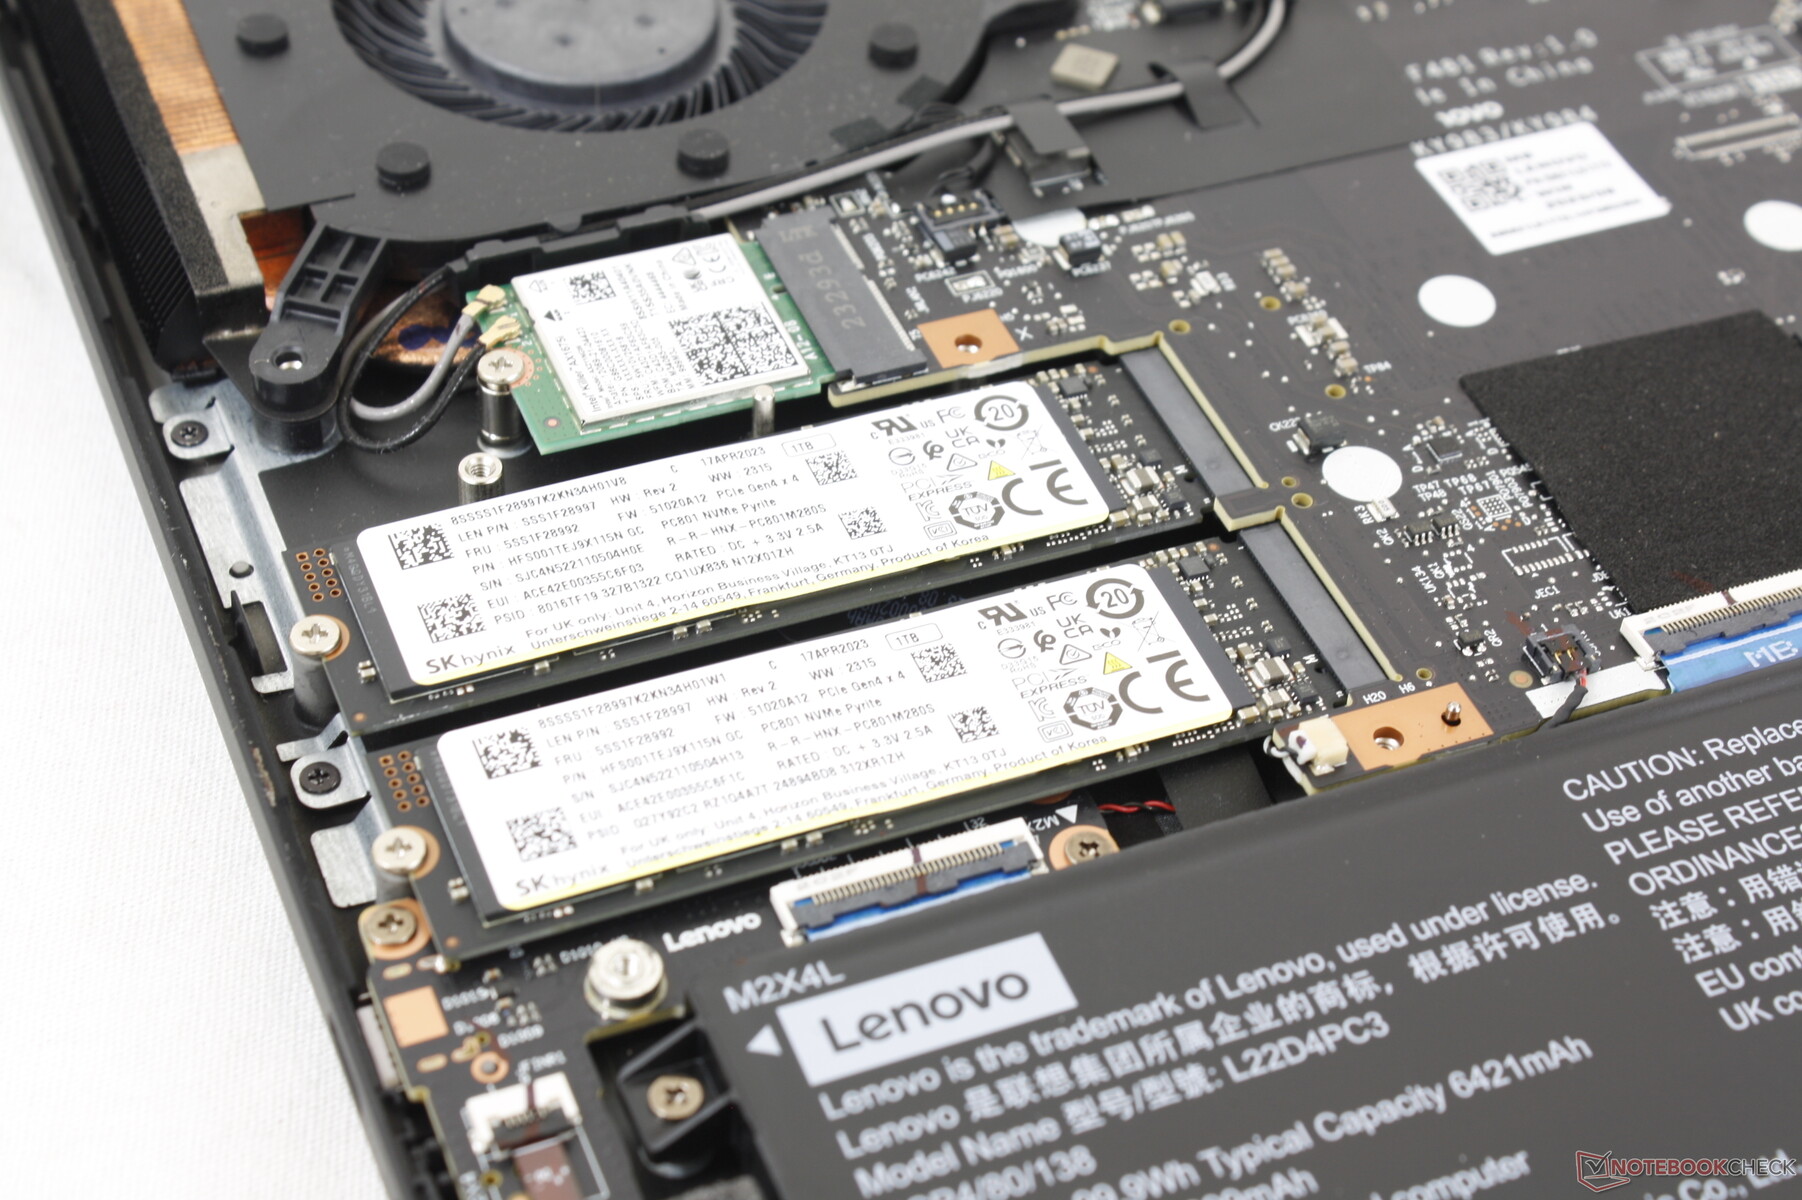
The bottom panel is secured by 8 Phillips screws for relatively easy removal. Unlike on most other laptops, the motherboard on the Legion 9 16 is upside-down and so further disassembly is required to access the cooling solution and RAM modules. At least the two M.2 2280 SSD slots are easily accessible.
Accessories And Warranty
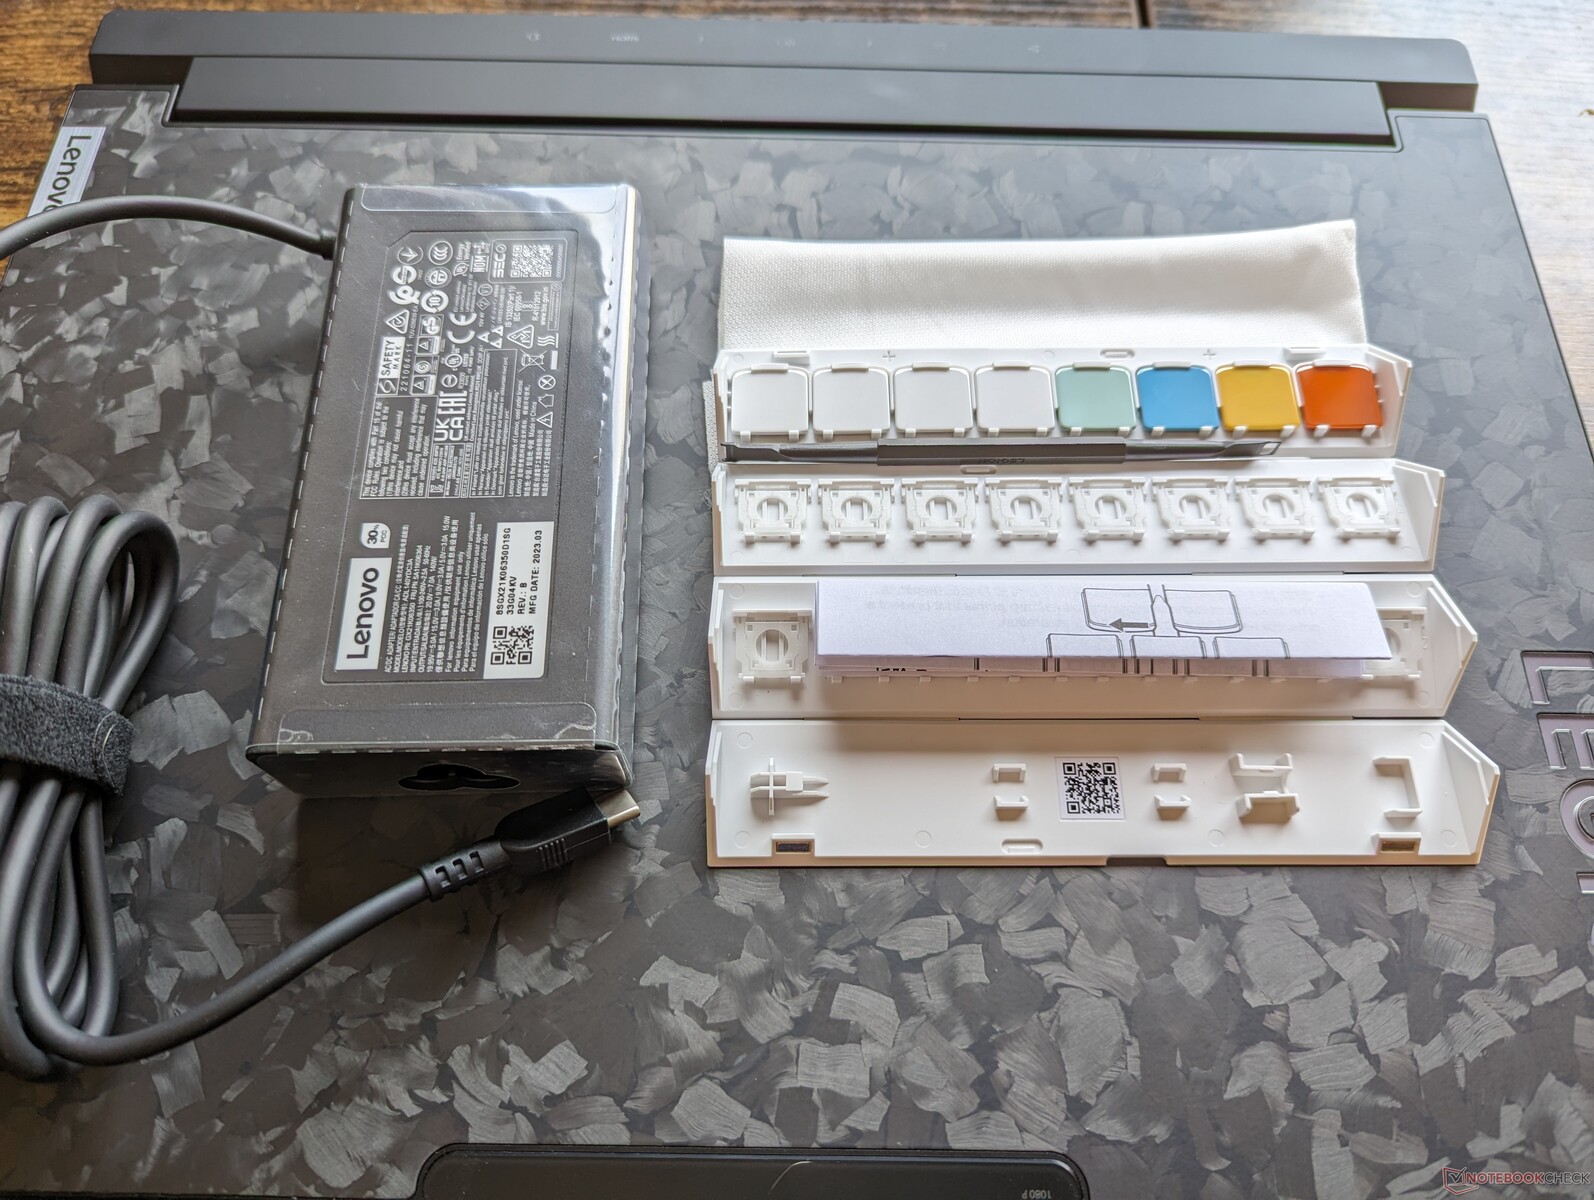
In addition to the usual proprietary AC adapter and paperwork, the retail box also includes a very handy universal 140 W USB-C adapter that can be used to charge this laptop and most other USB-C devices and 8 keycaps.
The standard one-year limited manufacturer warranty applies if purchased in the US.
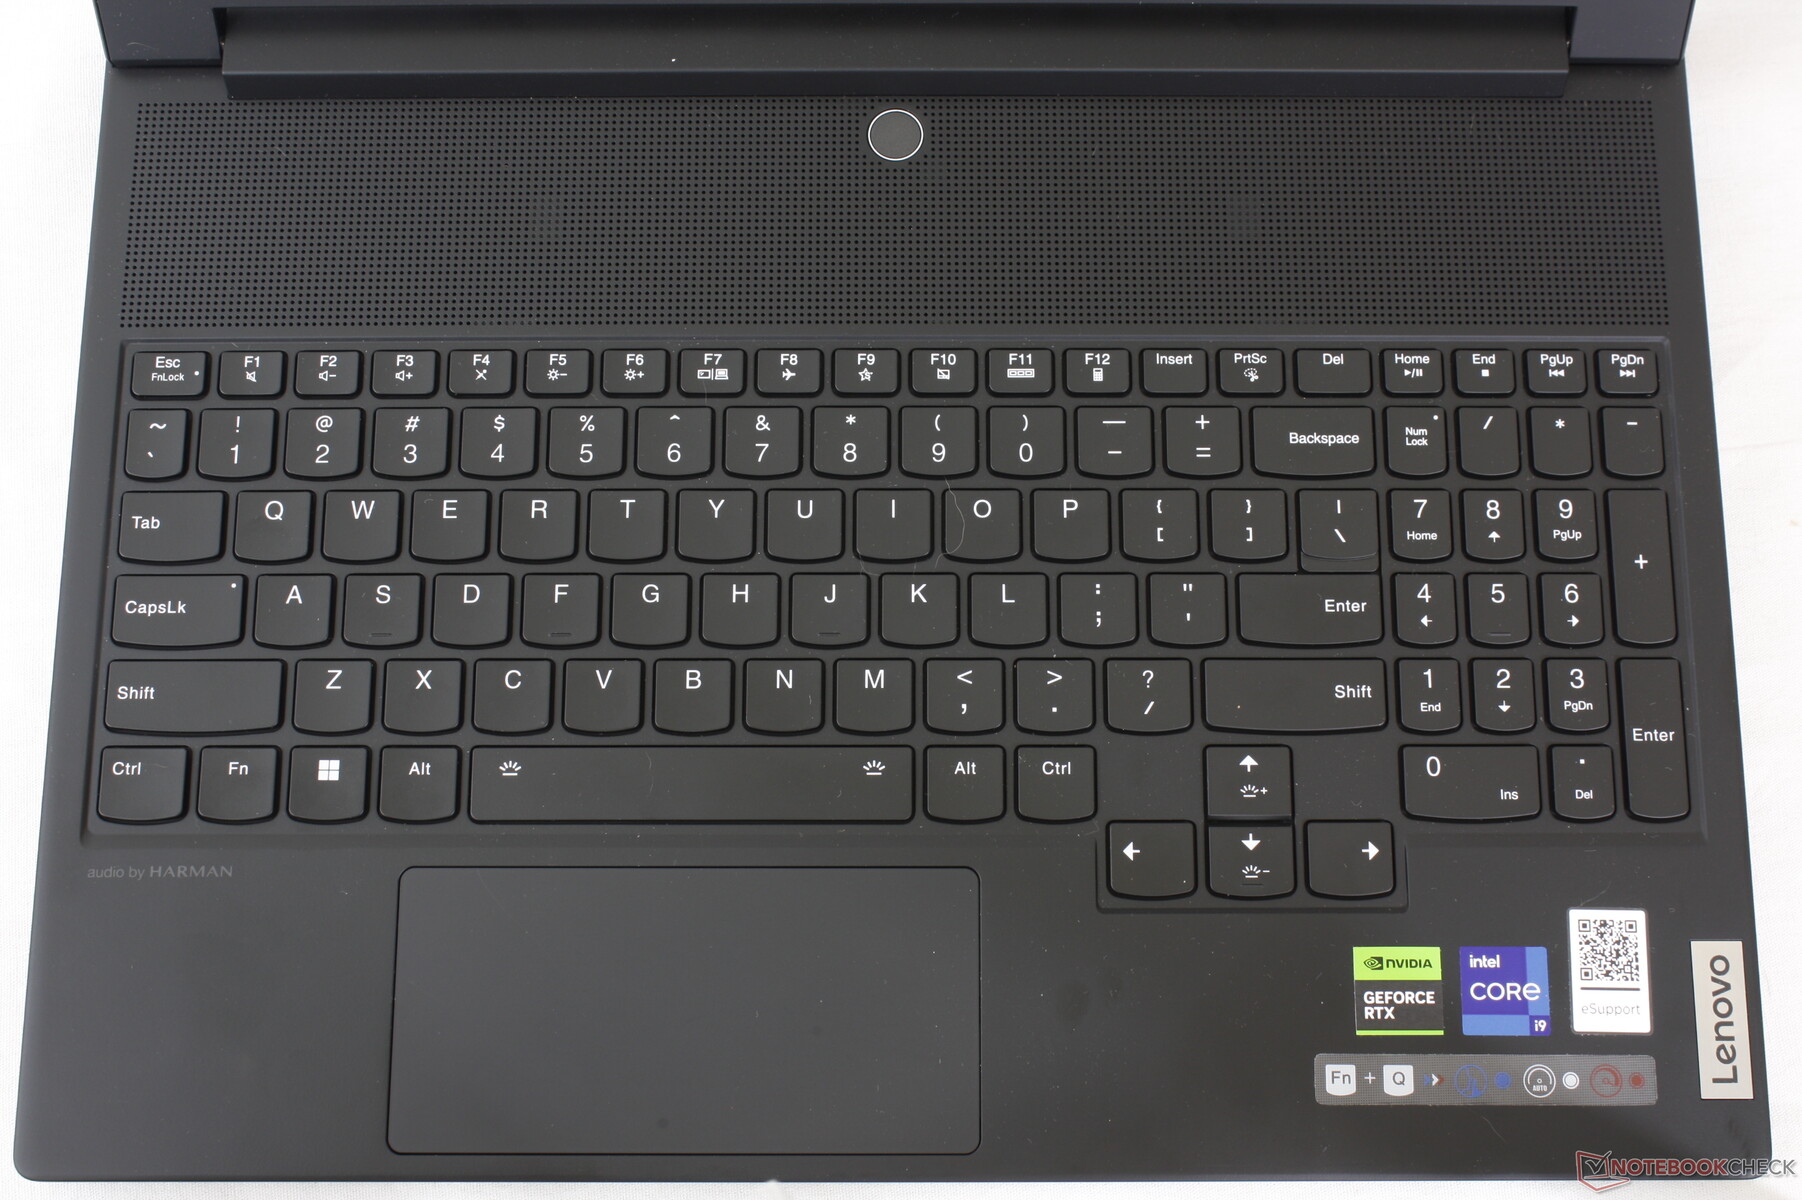
Input Devices — Comfy Keyboard With Cramped Clickpad
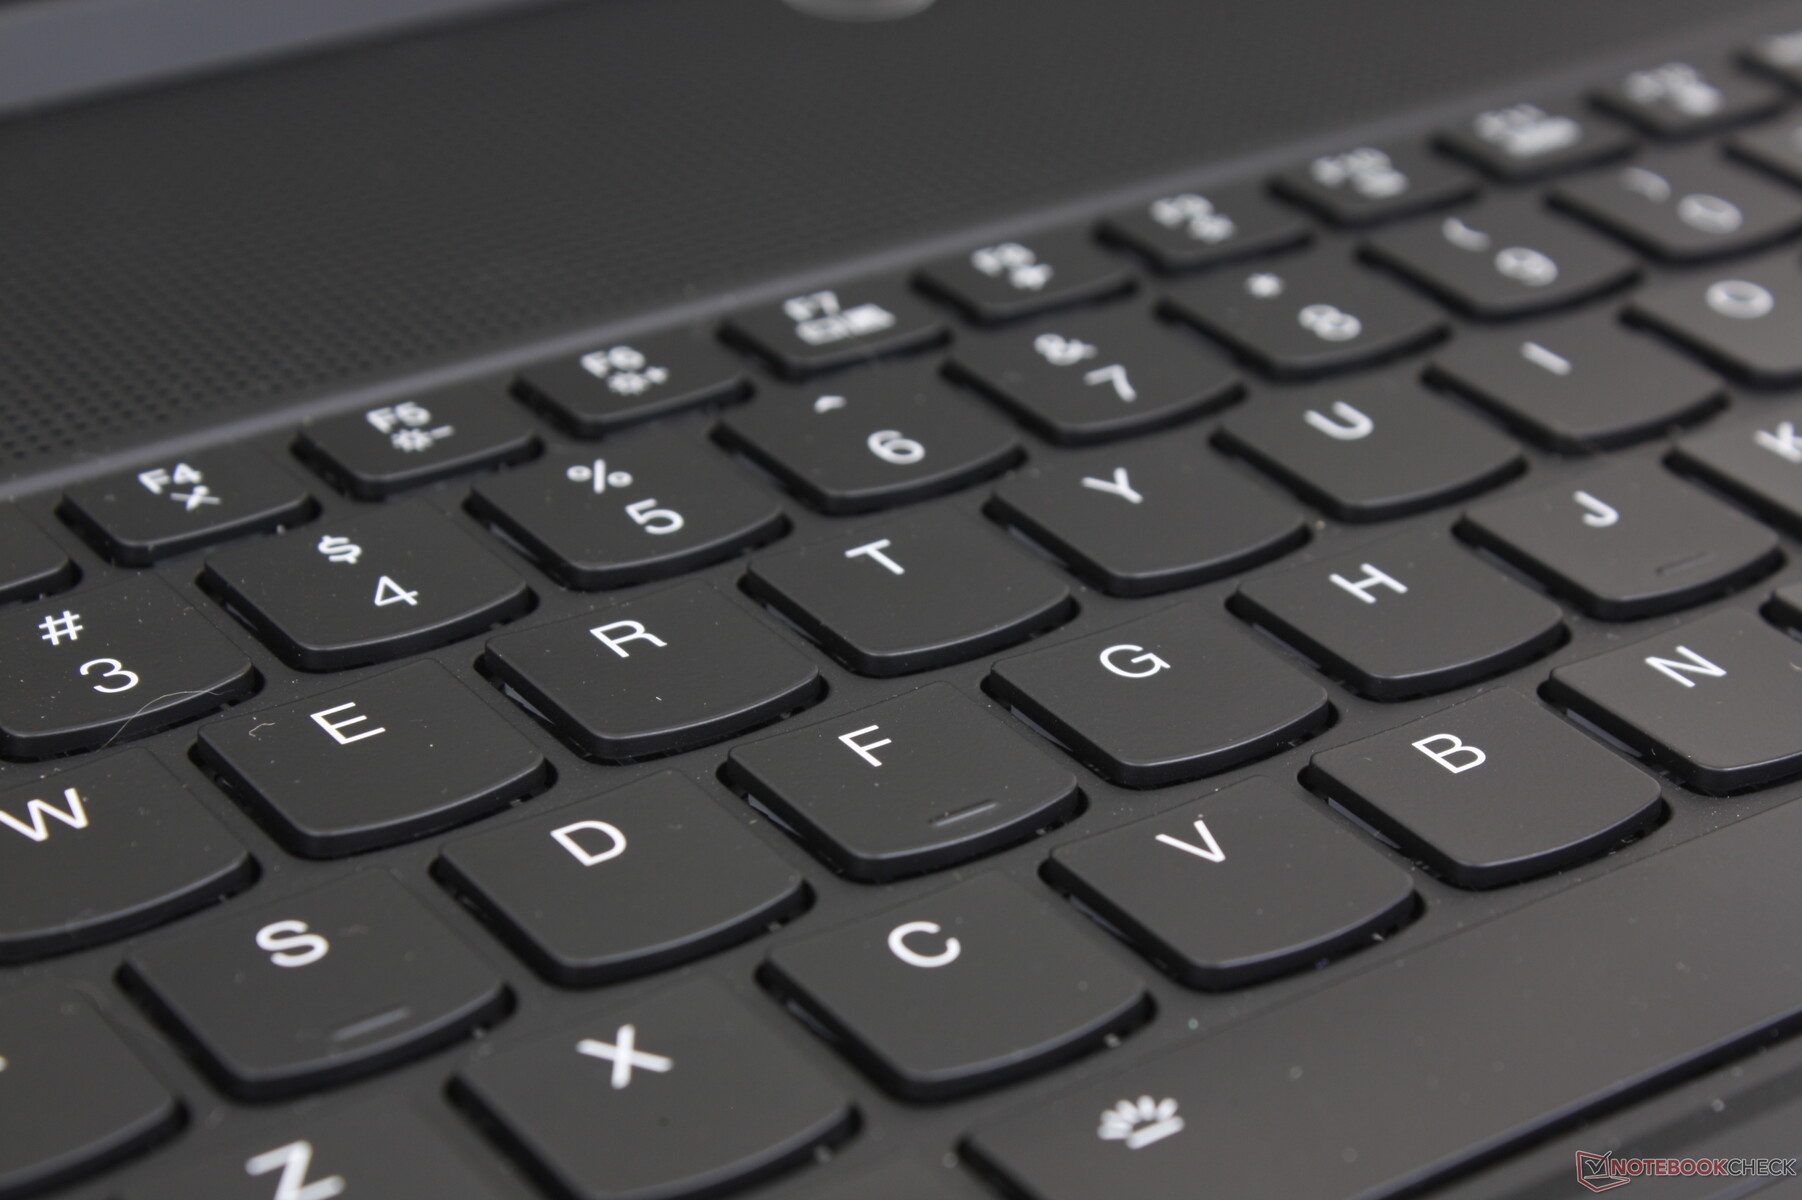
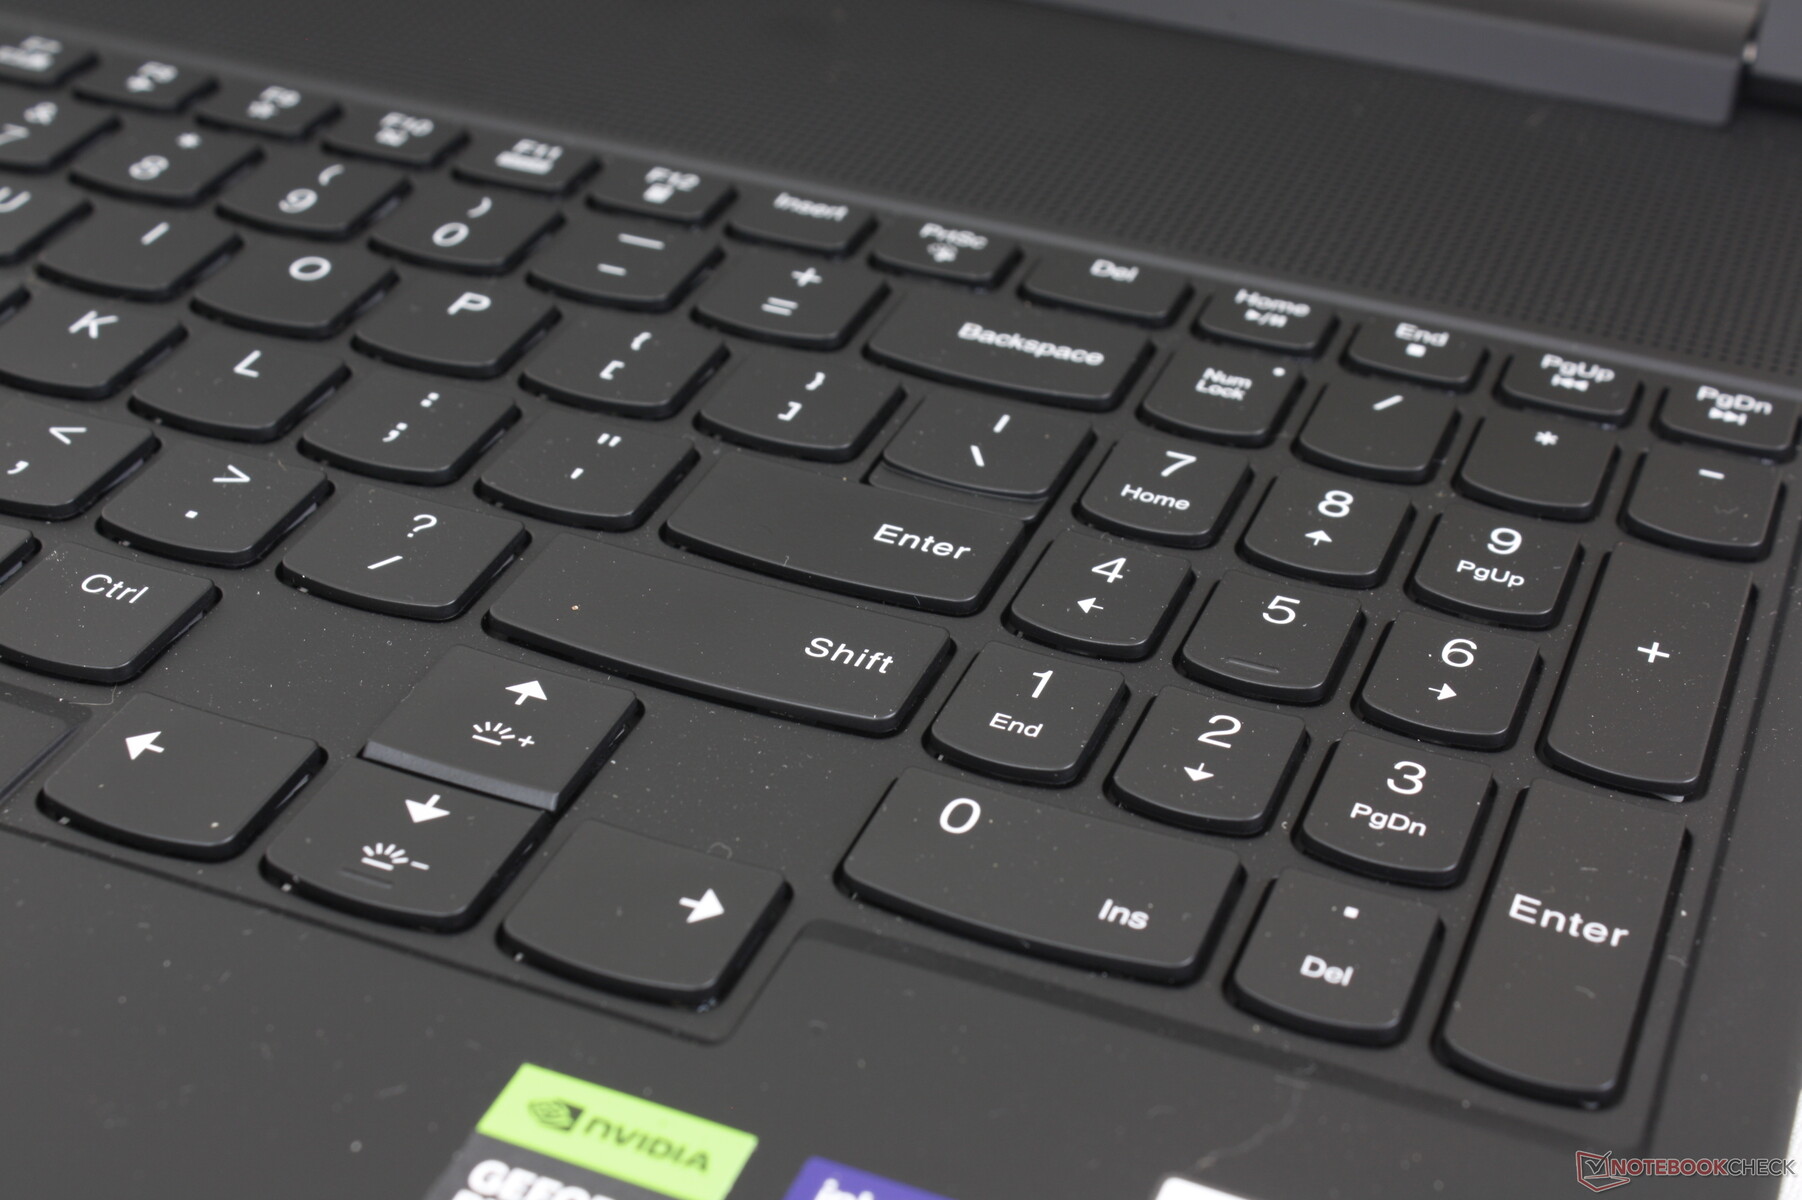
Keyboard
The TrueStrike keyboard offers 1.5 mm key travel to be slightly deeper than the keys on most Ultrabooks. Feedback is surprisingly sharp and comfortable for membrane-based keys to show that you don't need fancy mechanical switches for a good typing experience. The firm keys are louder than the keys on the Blade 16 or Asus Zephyrus M16 but definitely still not as clicky as the mechanical keys on models like the Schenker XMG Neo 15 or Alienware m18.
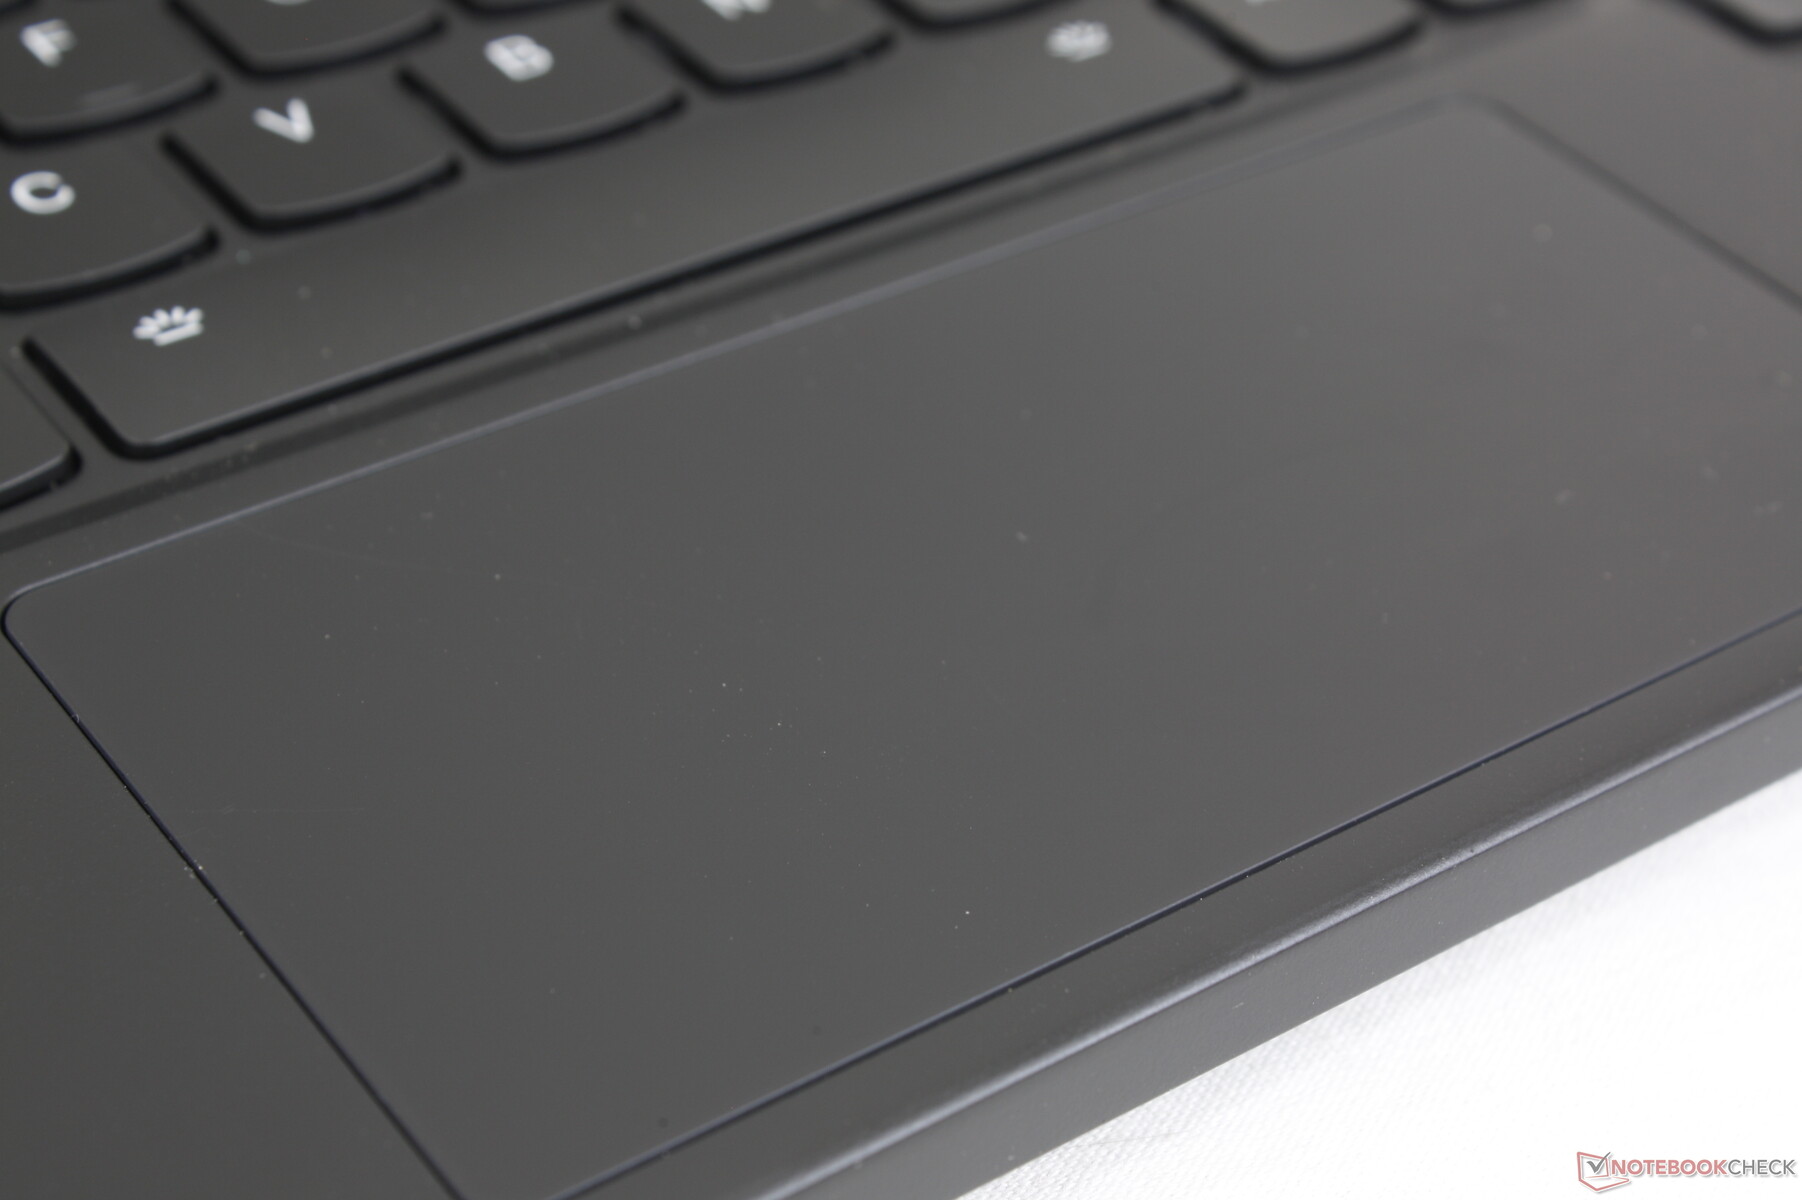
Touchpad
The clickpad has been reduced in size to just (12 x 5.9 cm) due to the positioning of the keyboard. Vertical cursor movements on the tall 16:10 screen feel cramped as a result especially when compared to gaming laptops with much larger clickpads like the Razer Blade 16. Lenovo is banking on gamers using their own USB or Bluetooth mice for the vast majority of scenarios.
Gliding and clicking are otherwise smooth and with a satisfying click despite the small surface area. However, cursor movements would occasionally freeze on our unit when using the clickpad while the same issue would not occur when using an external mouse. We recommend double-checking the clickpad upon purchasing to make sure it is free of any defects.
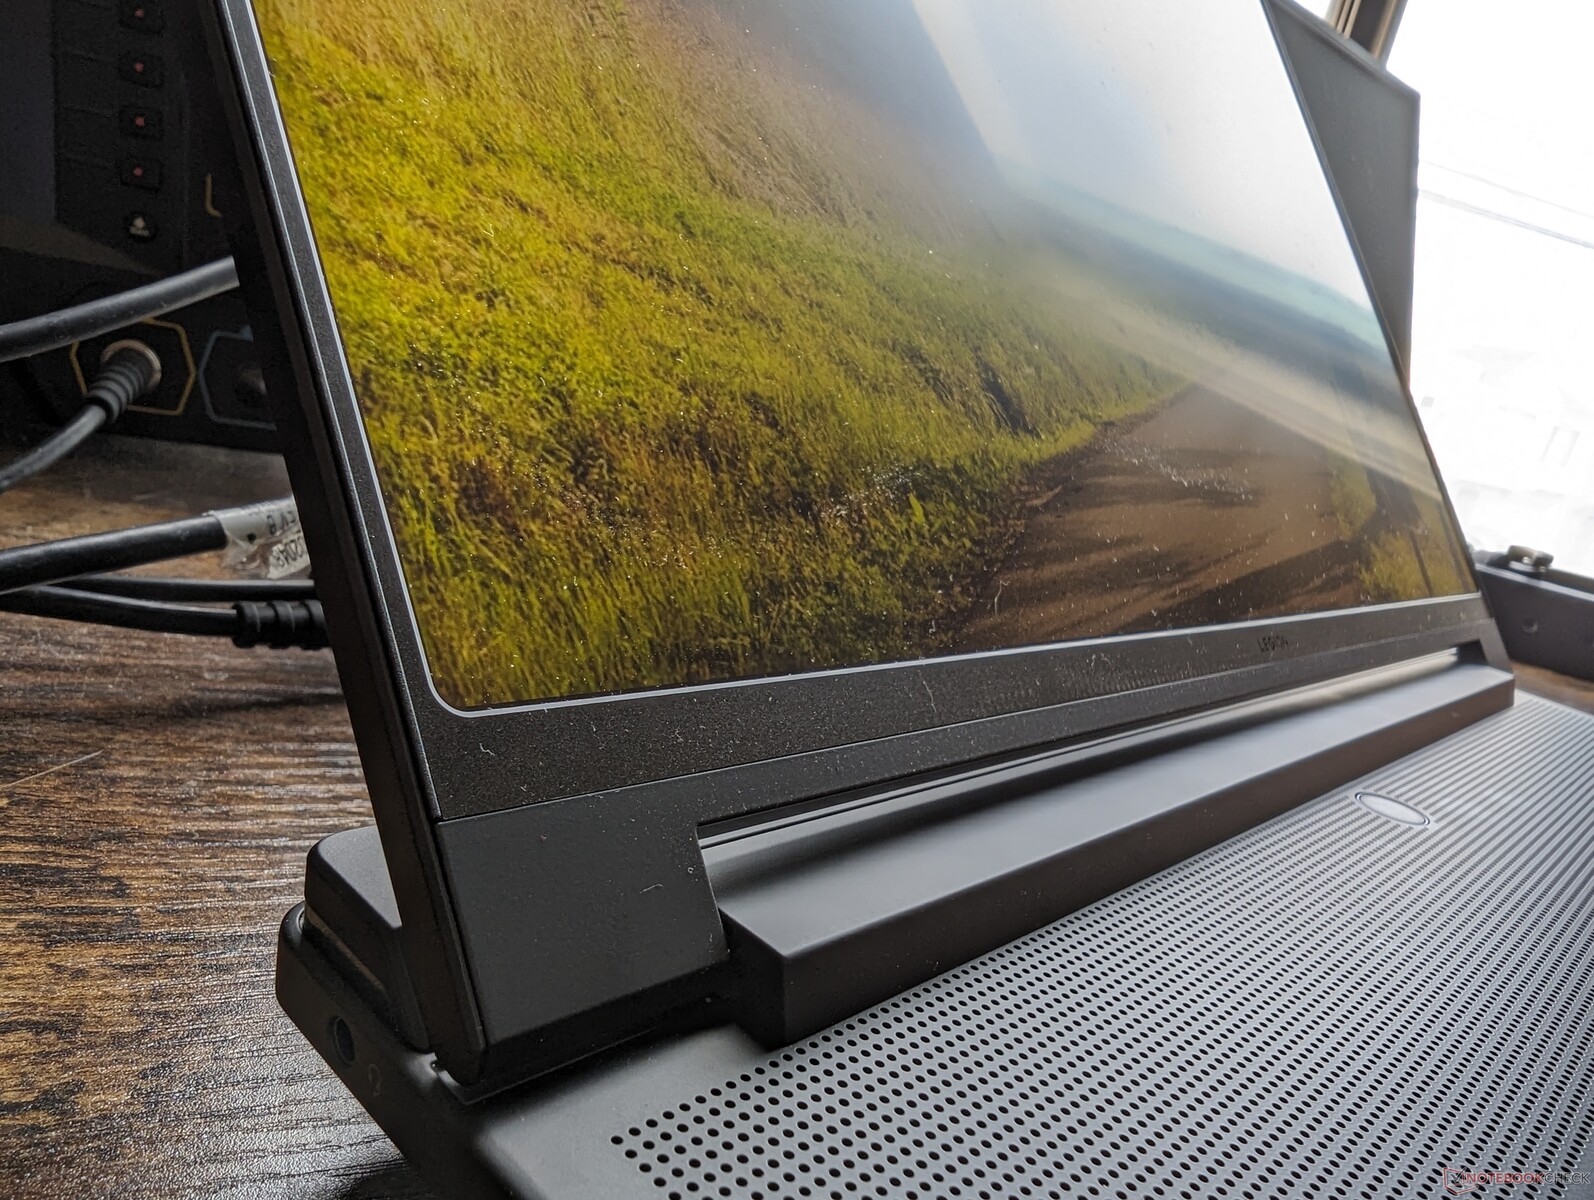
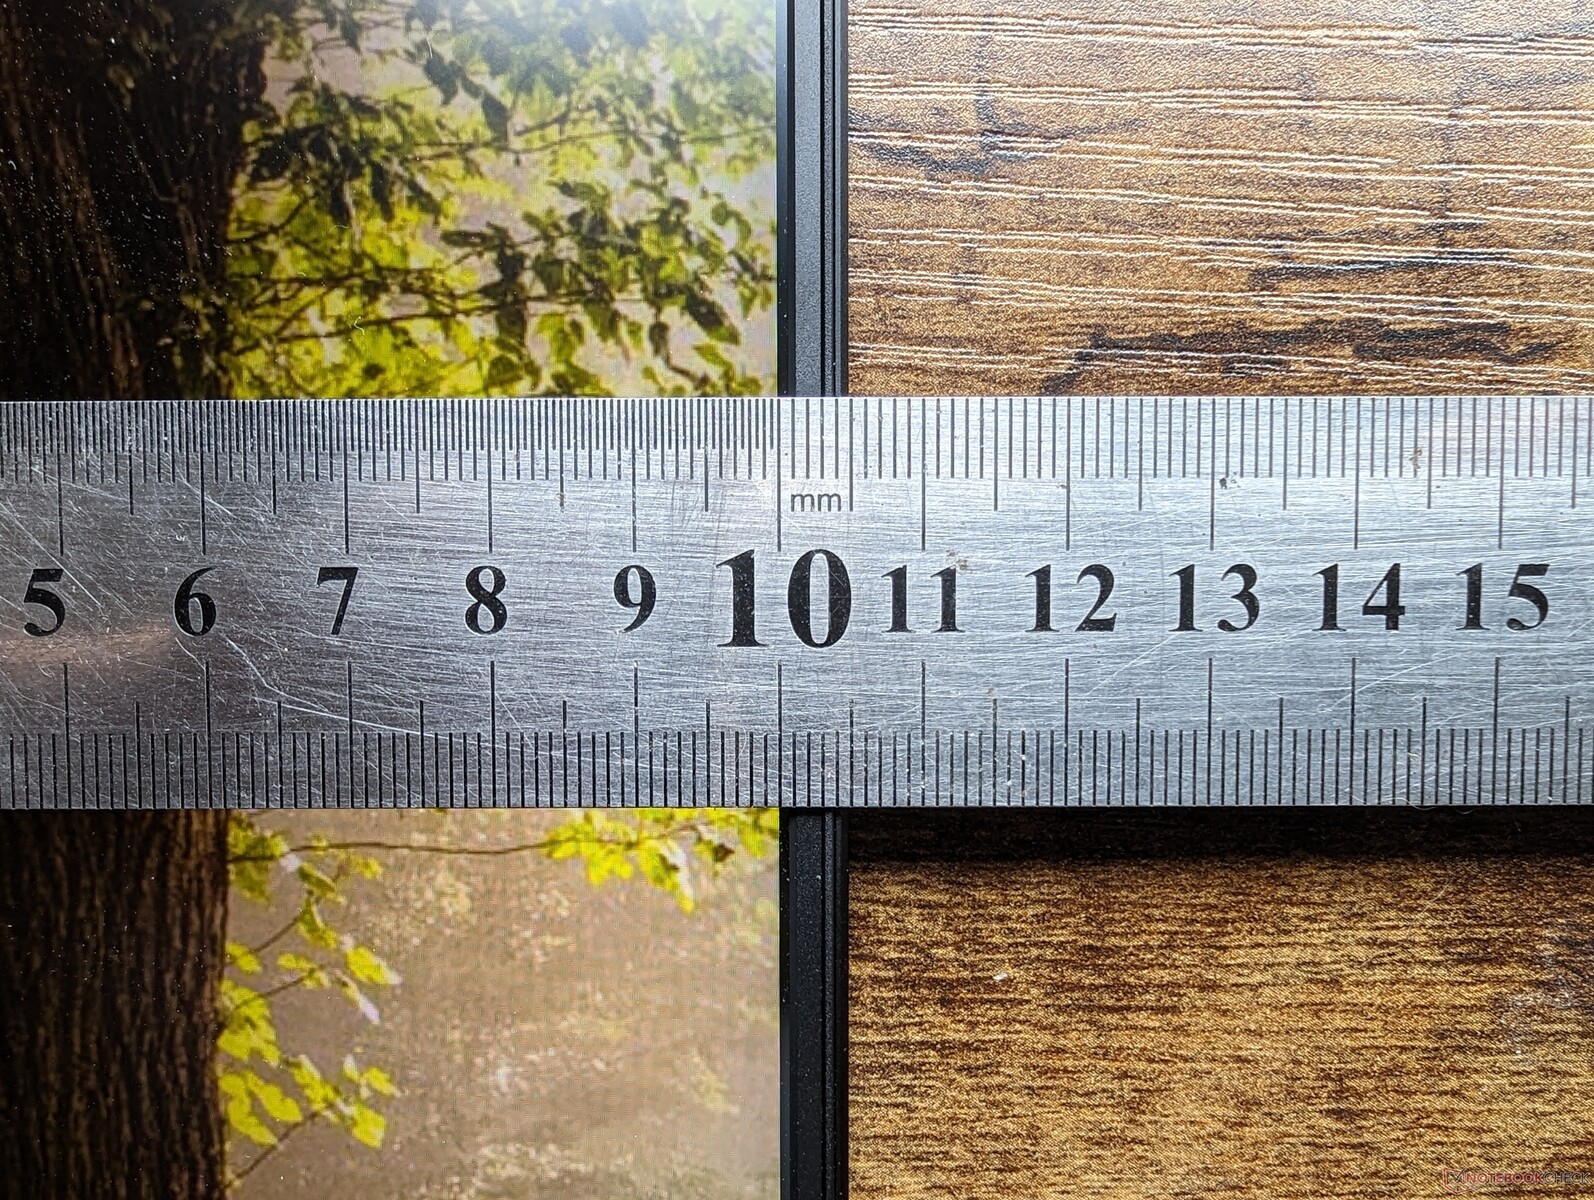
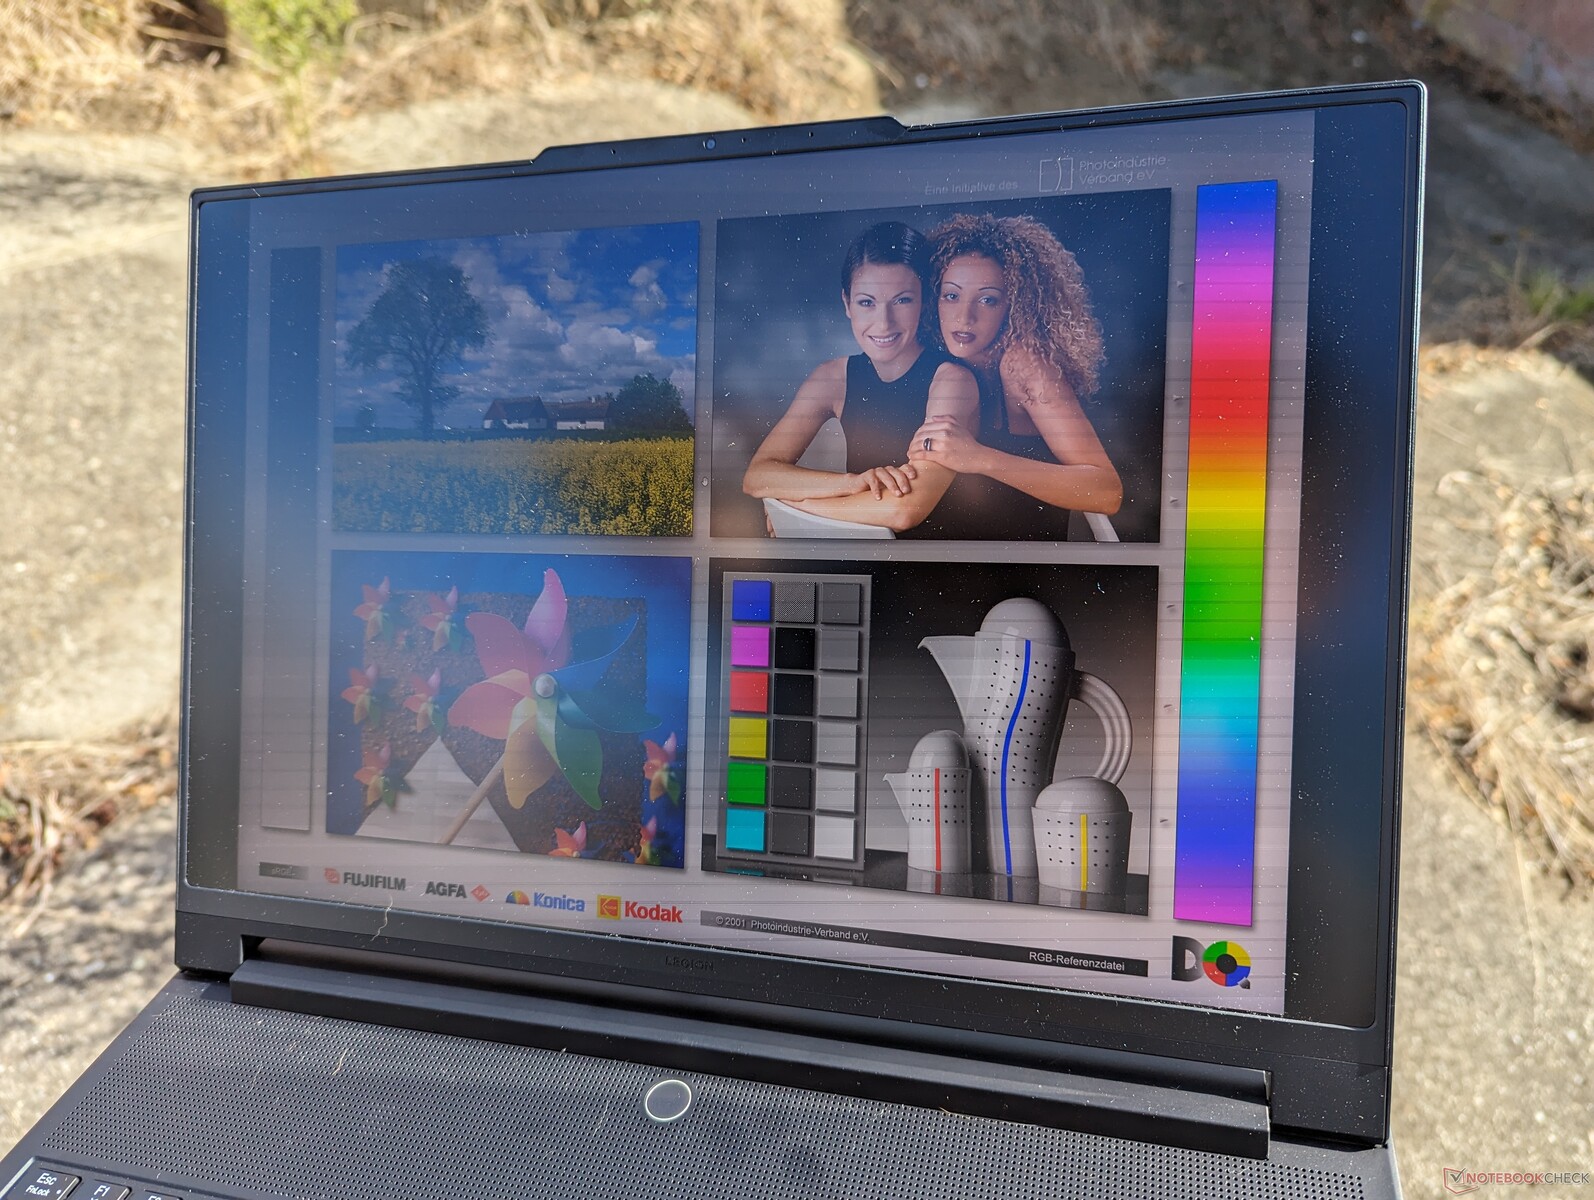
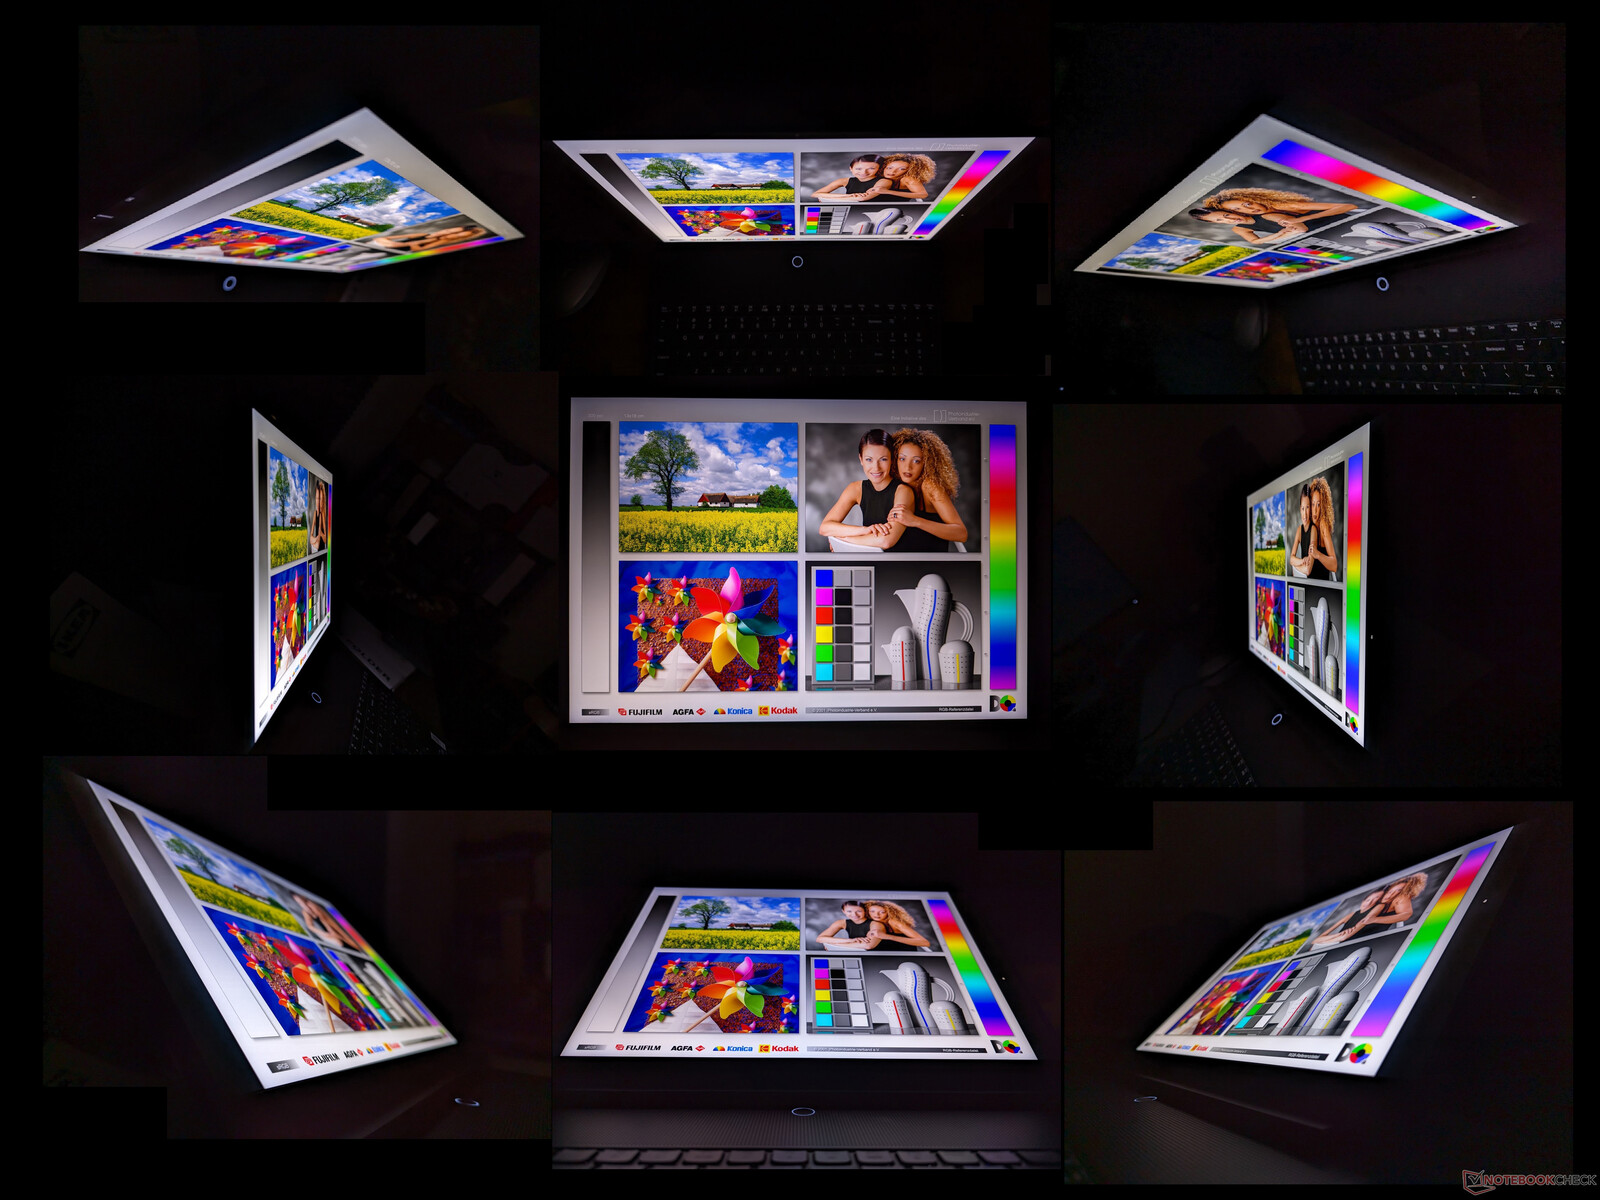
Display — The Main Attraction

When compared to traditional IPS and OLED, mini-LED offers superior black levels than the former and even higher maximum brightness levels than the latter for overall better HDR support. In this case, Lenovo advertises a maximum brightness of 1200 nits for HDR1000 support which is rare to see on laptop displays. We're able to confirm a real-world maximum brightness of 1025 nits when HDR mode is enabled or 675 nits when displaying SDR content. Most IPS and OLED panels on gaming laptops typically range between 300 to 500 nits in comparison. Thus, you'll want to play content in HDR mode whenever possible to better exploit the benefits of mini-LED.
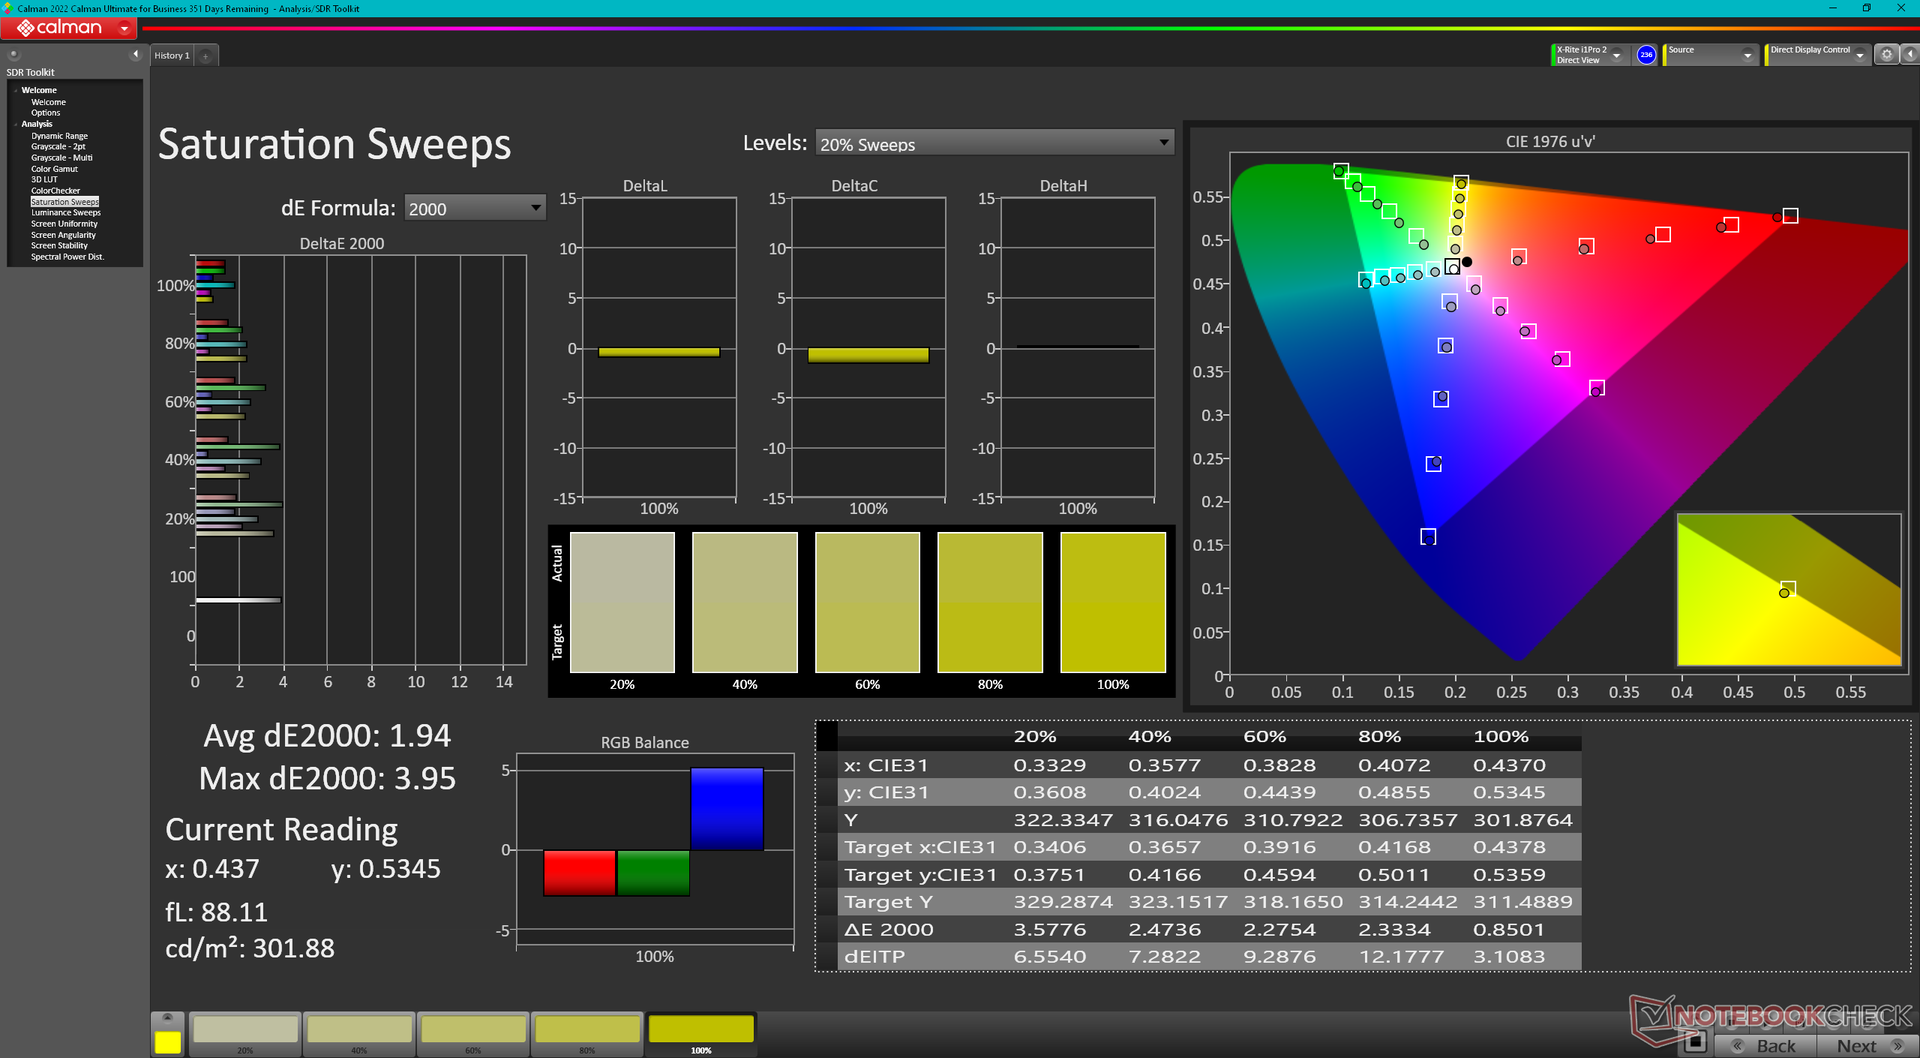
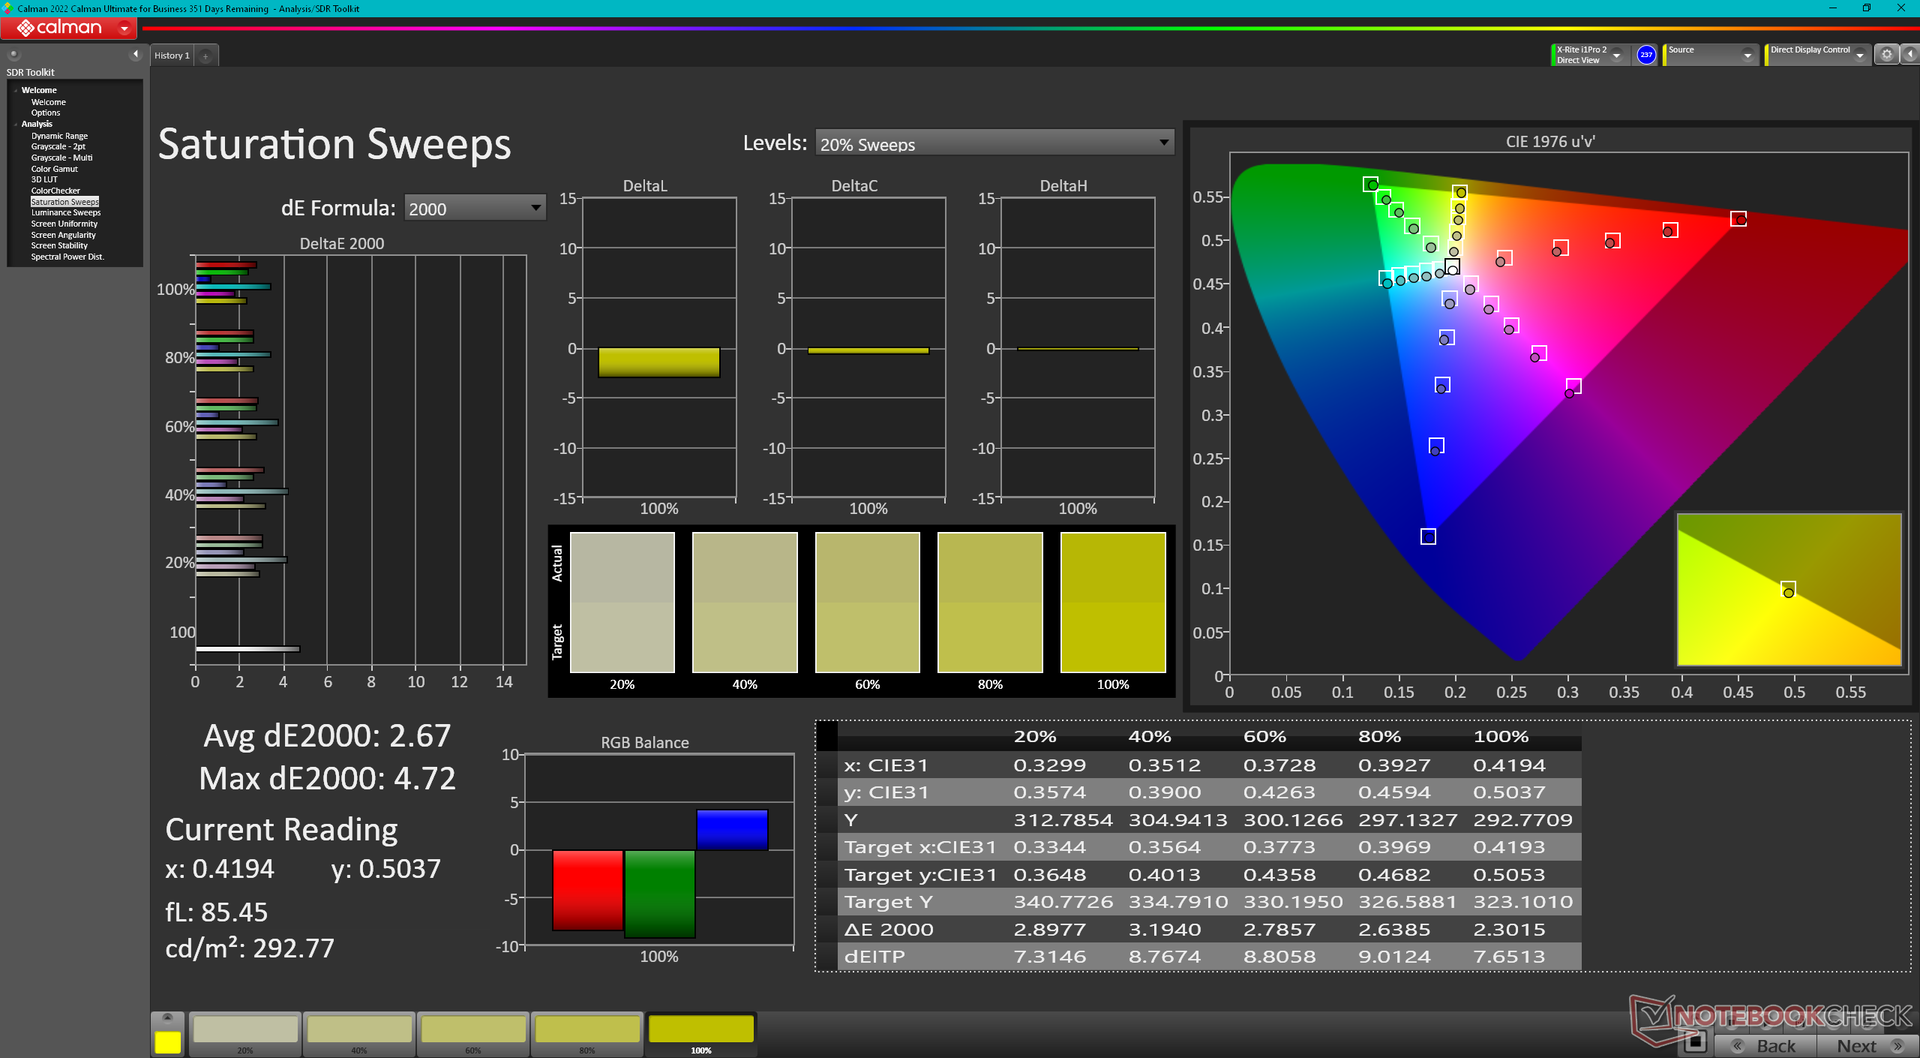
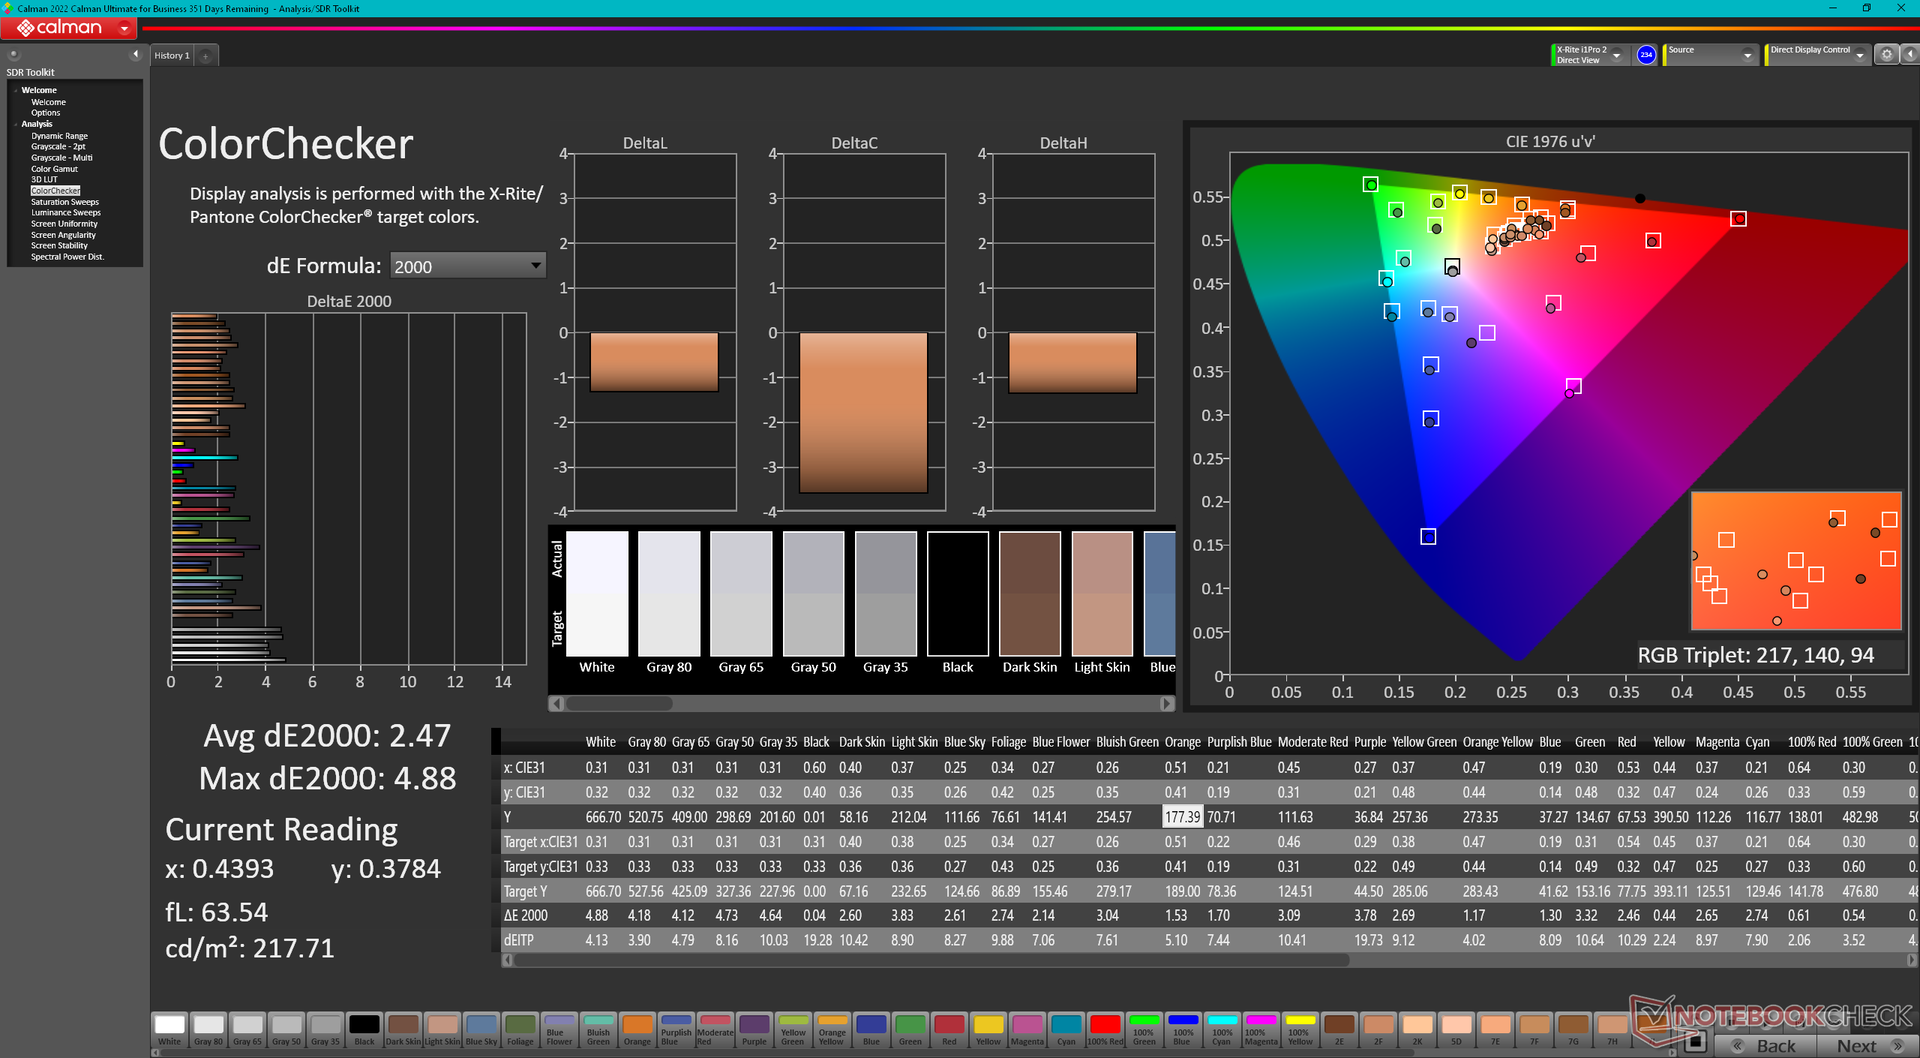
Aside from the very high brightness levels, the panel also features G-Sync, full DCI-P3 colors, fast 165 Hz refresh rate and fast response times to be fit for both content creation and gaming purposes alike.
| |||||||||||||||||||||||||
Brightness Distribution: 96 %
Center on Battery: 674.9 cd/m²
Contrast: 16873:1 (Black: 0.04 cd/m²)
ΔE Color 2.56 | 0.5-29.43 Ø5.1, calibrated: 2.47
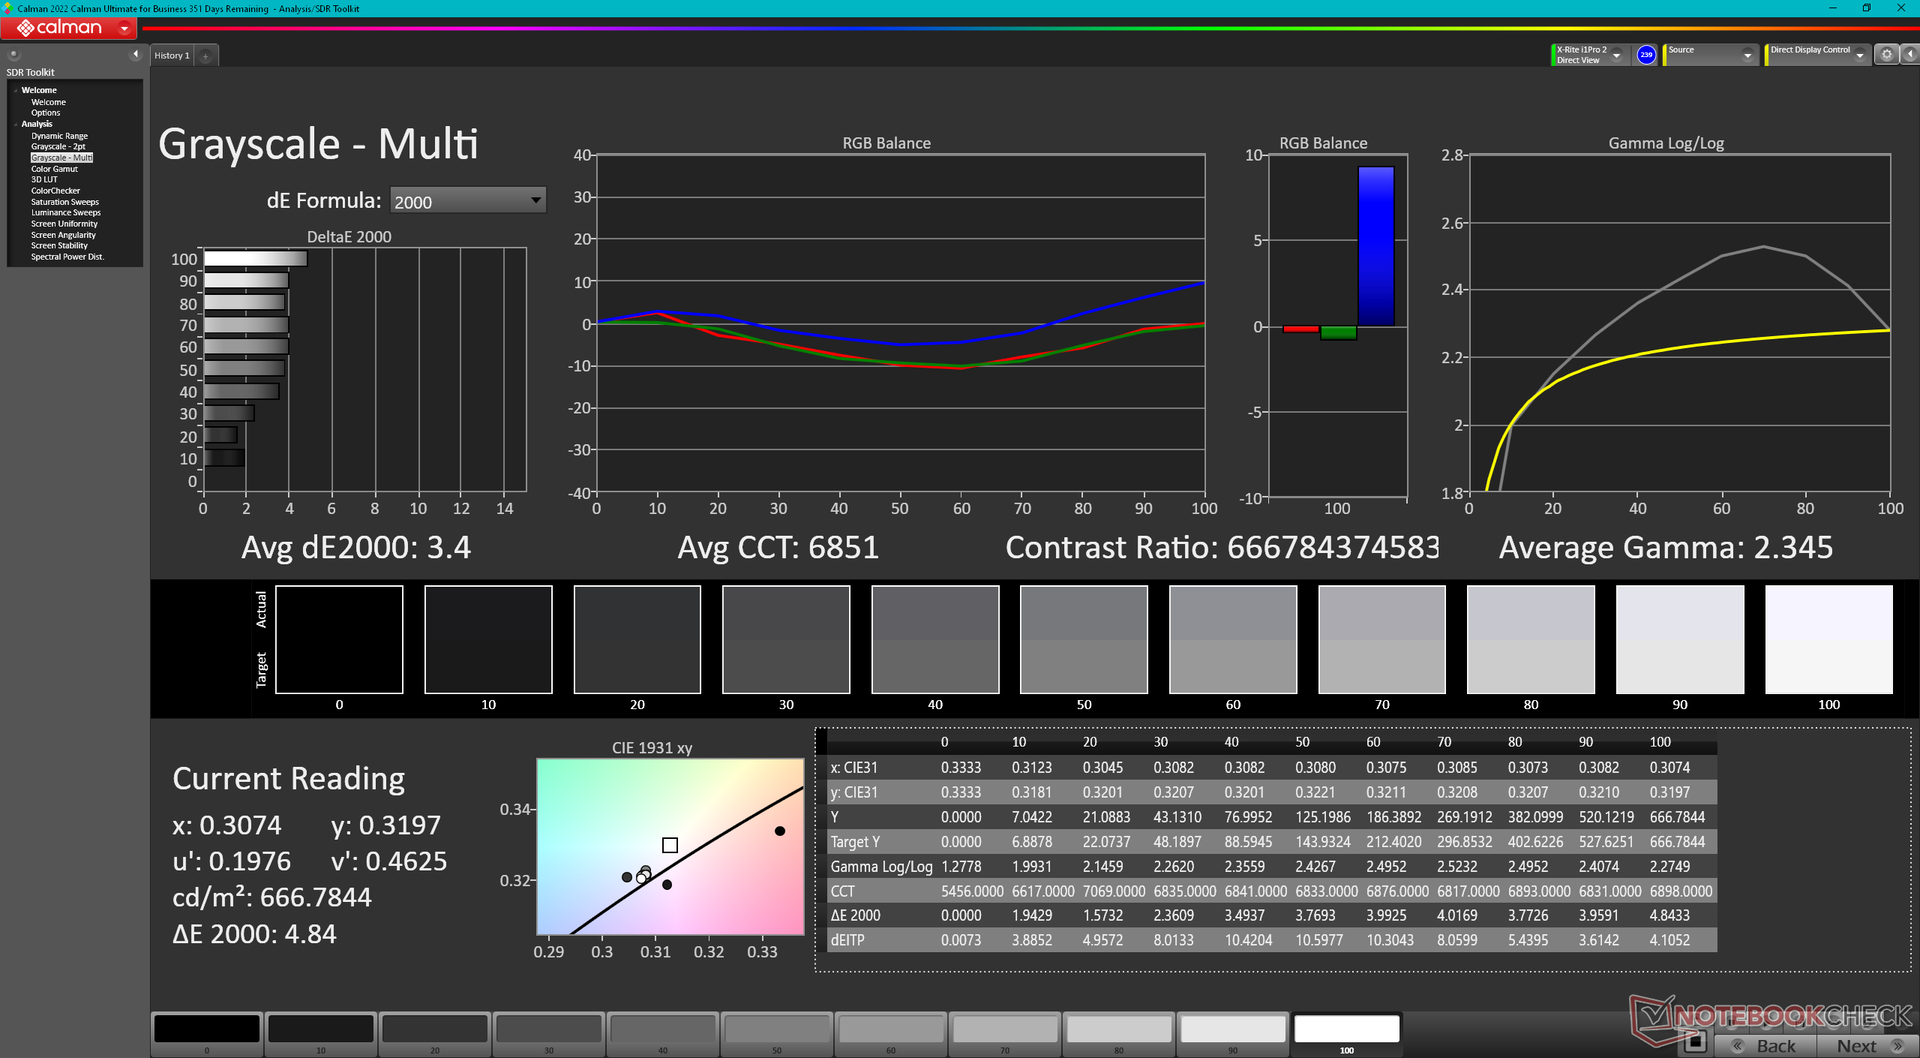
ΔE Greyscale 3 | 0.57-98 Ø5.3
87% AdobeRGB 1998 (Argyll 2.2.0 3D)
99.9% sRGB (Argyll 2.2.0 3D)
97.2% Display P3 (Argyll 2.2.0 3D)
Gamma: 2.38
| Lenovo Legion 9 16IRX8 CSOT T3 MNG007ZA2-2, Mini-LED, 3200x2000, 16.00 | Lenovo Legion Slim 5 16APH8 BOE NJ NE160QDM-NYC, IPS, 2560x1600, 16.00 | Razer Blade 16 Early 2023 RTX 4090 AUO B160ZAN01.U, mini-LED, 3840x2400, 16.00 | Asus ROG Strix G16 G614JZ TL160ADMP03-0, IPS, 2560x1600, 16.00 | HP Omen Transcend 16 AUOA3A6, Mini-LED, 2560x1600, 16.00 | Alienware x16 R1 BOE NE16NZ4, IPS, 2560x1600, 16.00 | |
|---|---|---|---|---|---|---|
| Display | -16% | 2% | -1% | 1% | 1% | |
| Display P3 Coverage | 97.2 | 69.3 -29% | 99.9 3% | 97 0% | 99.2 2% | 99.2 2% |
| sRGB Coverage | 99.9 | 100 0% | 100 0% | 99.9 0% | 100 0% | 100 0% |
| AdobeRGB 1998 Coverage | 87 | 70 -20% | 90.9 4% | 84.9 -2% | 87.6 1% | 88.6 2% |
| Response Times | 27% | -154% | 53% | -89% | 37% | |
| Response Time Grey 50% / Grey 80% * | 13.3 ? | 10.7 ? 20% | 10.2 ? 23% | 5.1 ? 62% | 26.4 ? -98% | 5.1 ? 62% |
| Response Time Black / White * | 11.6 ? | 7.8 ? 33% | 62.04 ? -435% | 6.6 ? 43% | 28.2 ? -143% | 10.3 ? 11% |
| PWM Frequency | 4742 | 2420 ? -49% | 3506 ? -26% | |||
| Screen | -109% | 62% | -111% | -26% | -73% | |
| Brightness middle | 674.9 | 371.6 -45% | 730 8% | 470 -30% | 791.1 17% | 302.2 -55% |
| Brightness | 682 | 343 -50% | 729 7% | 459 -33% | 800 17% | 285 -58% |
| Brightness Distribution | 96 | 84 -12% | 94 -2% | 93 -3% | 95 -1% | 89 -7% |
| Black Level * | 0.04 | 0.44 -1000% | 0.0045 89% | 0.42 -950% | 0.04 -0% | 0.26 -550% |
| Contrast | 16873 | 845 -95% | 162222 861% | 1119 -93% | 19778 17% | 1162 -93% |
| Colorchecker dE 2000 * | 2.56 | 1.52 41% | 5.65 -121% | 1.86 27% | 4.37 -71% | 1.63 36% |
| Colorchecker dE 2000 max. * | 4.16 | 2.68 36% | 10.11 -143% | 3.87 7% | 10.39 -150% | 4.13 1% |
| Colorchecker dE 2000 calibrated * | 2.47 | 0.33 87% | 1.85 25% | 0.93 62% | 1.04 58% | 1.17 53% |
| Greyscale dE 2000 * | 3 | 1.2 60% | 8.1 -170% | 2.7 10% | 6.5 -117% | 2.5 17% |
| Gamma | 2.38 92% | 2.1 105% | 1.98 111% | 2.246 98% | 2.28 96% | 2.23 99% |
| CCT | 6799 96% | 6503 100% | 5874 111% | 6711 97% | 6000 108% | 6590 99% |
| Total Average (Program / Settings) | -33% /
-70% | -30% /
7% | -20% /
-64% | -38% /
-33% | -12% /
-41% |
* ... smaller is better
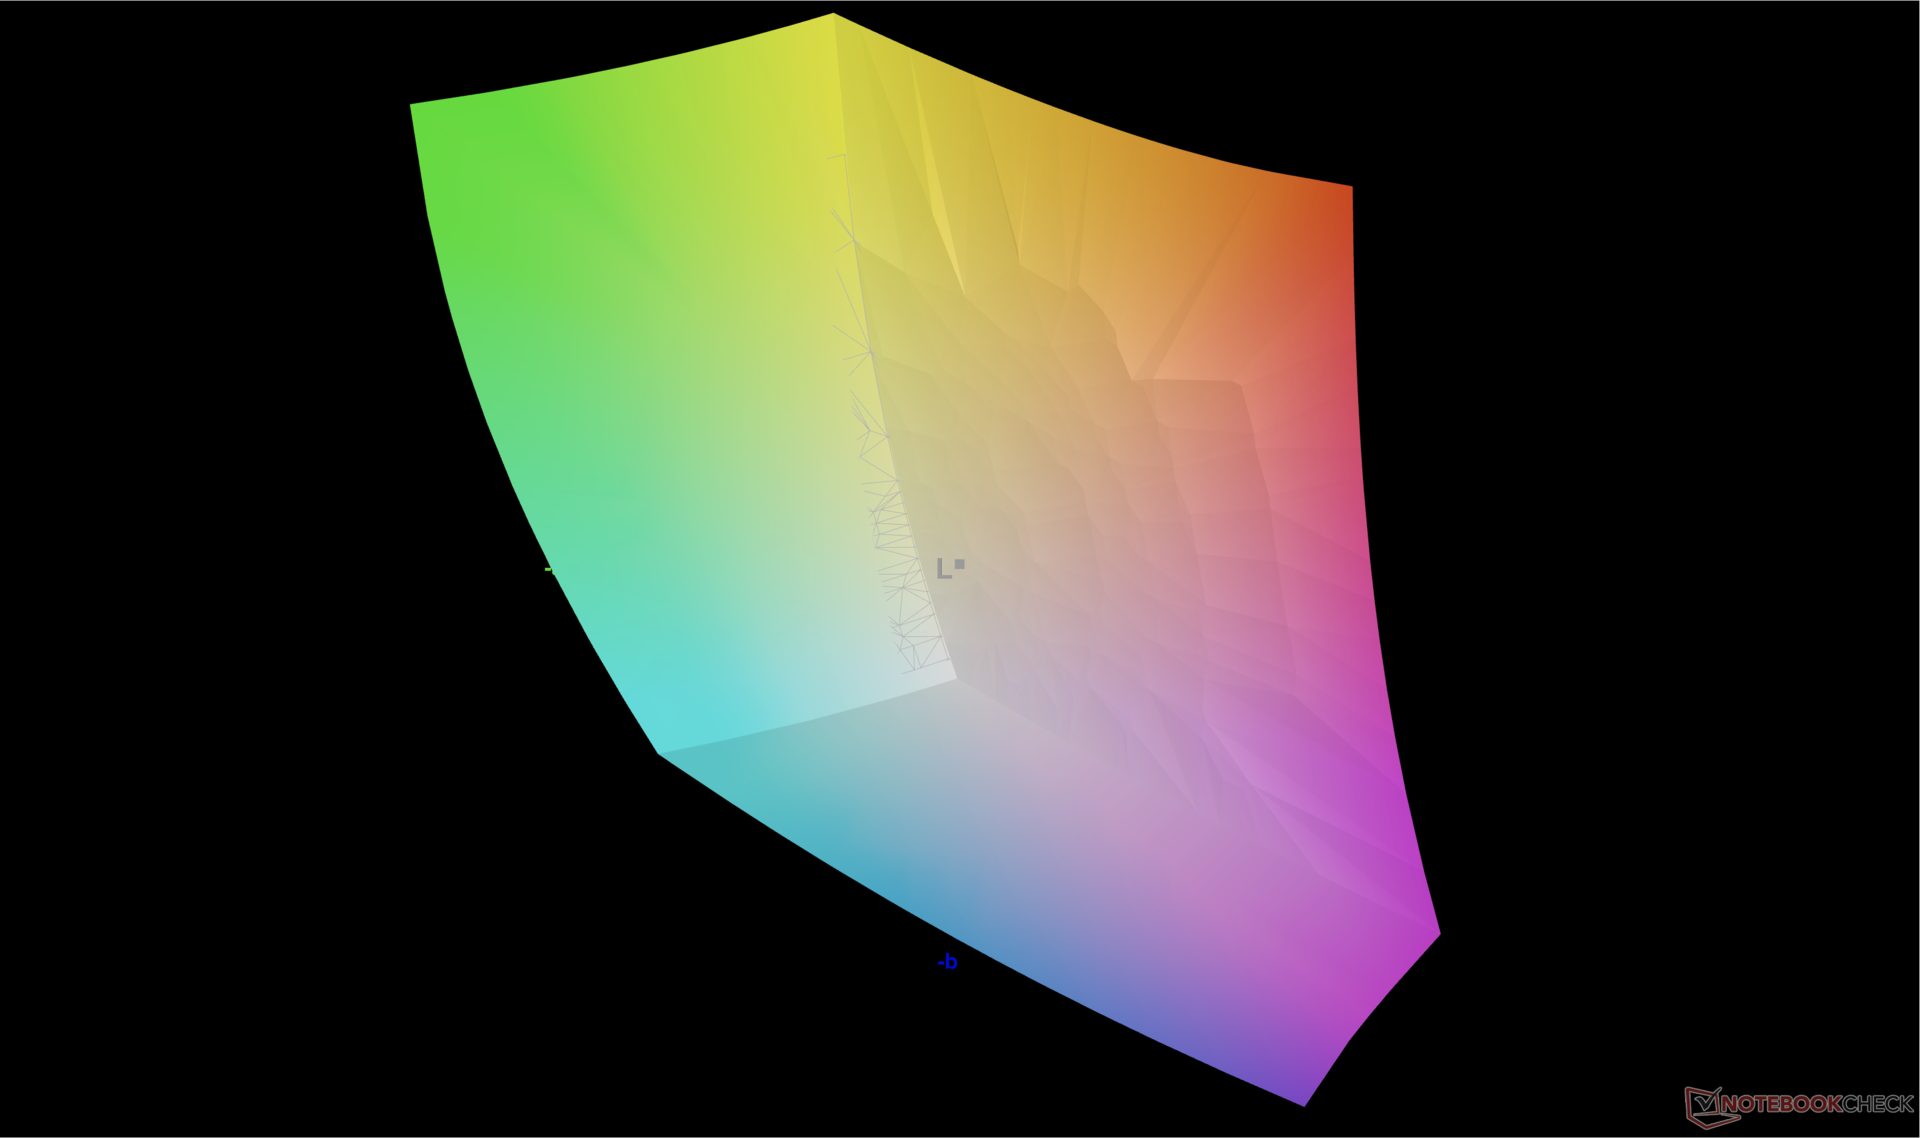
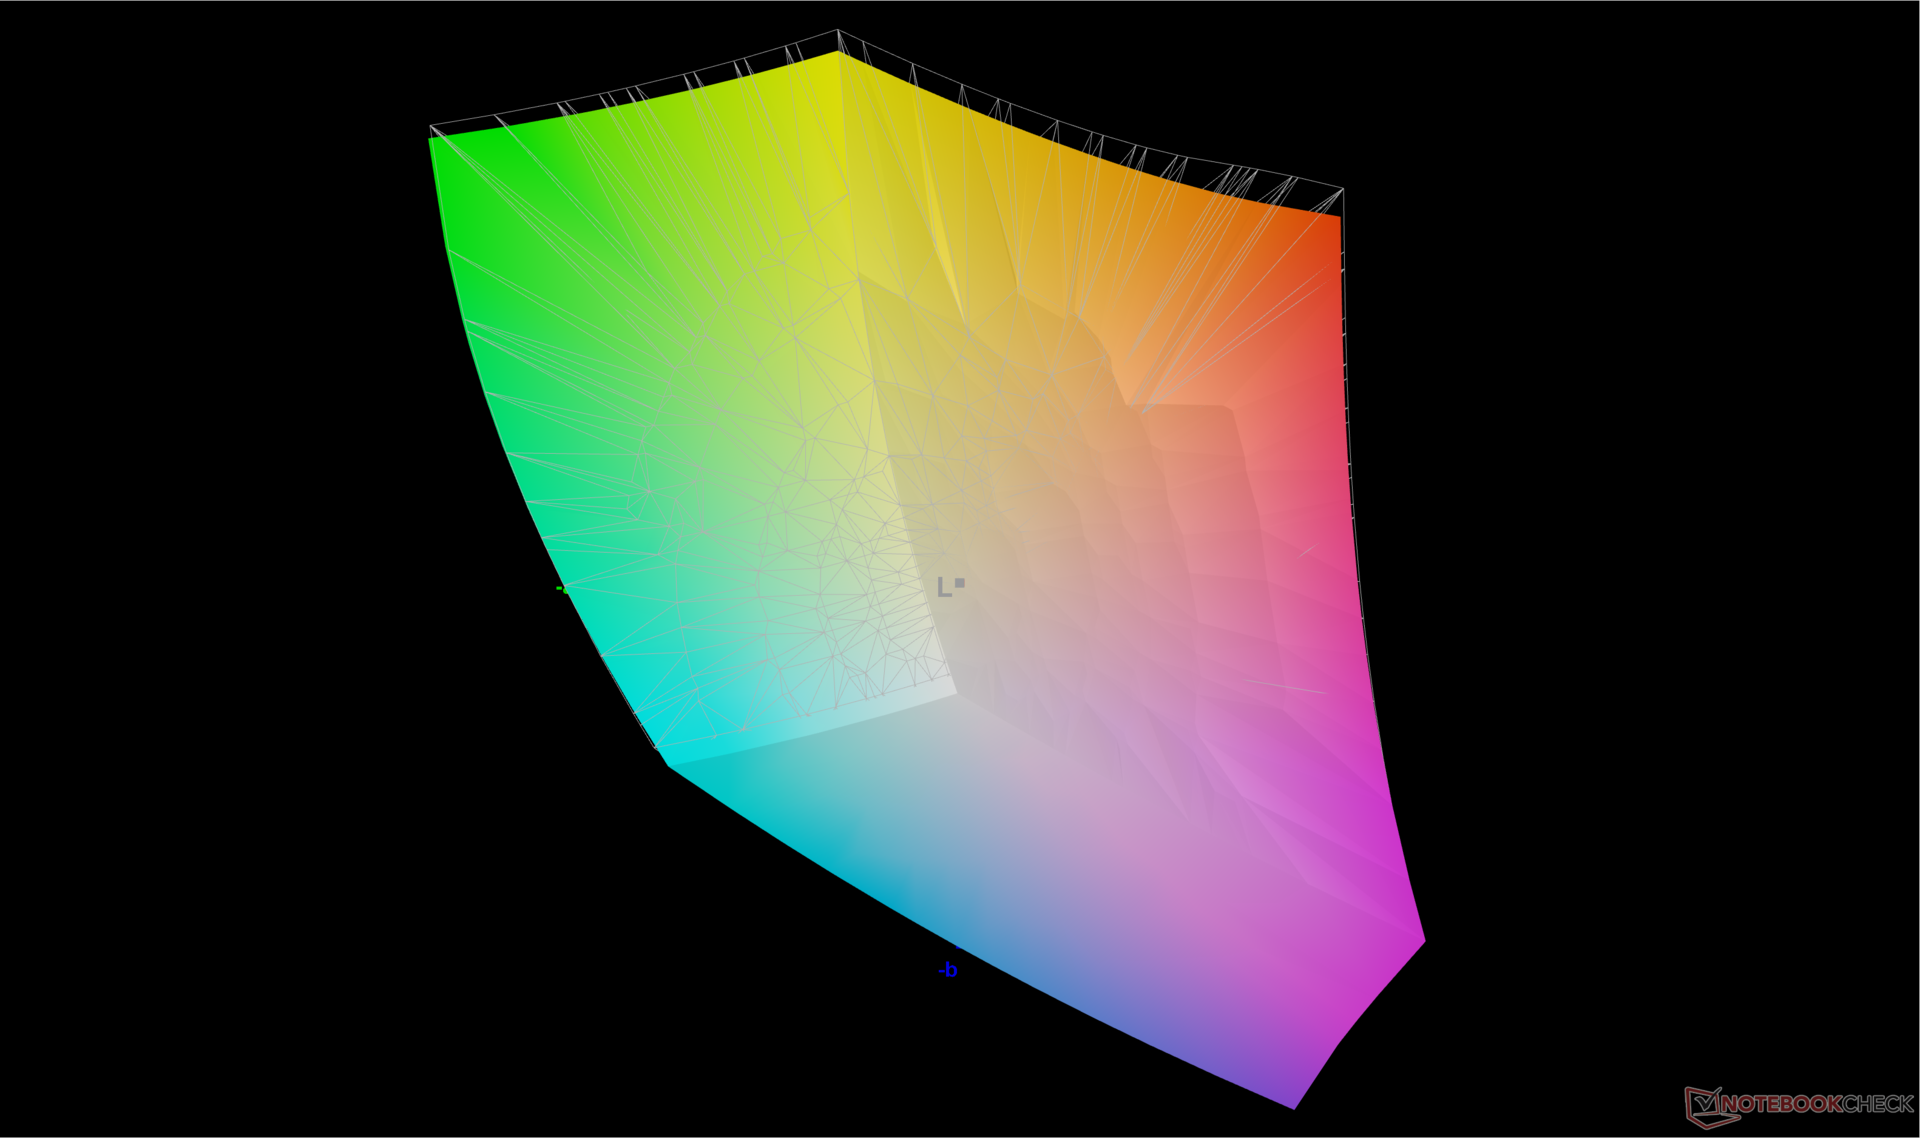
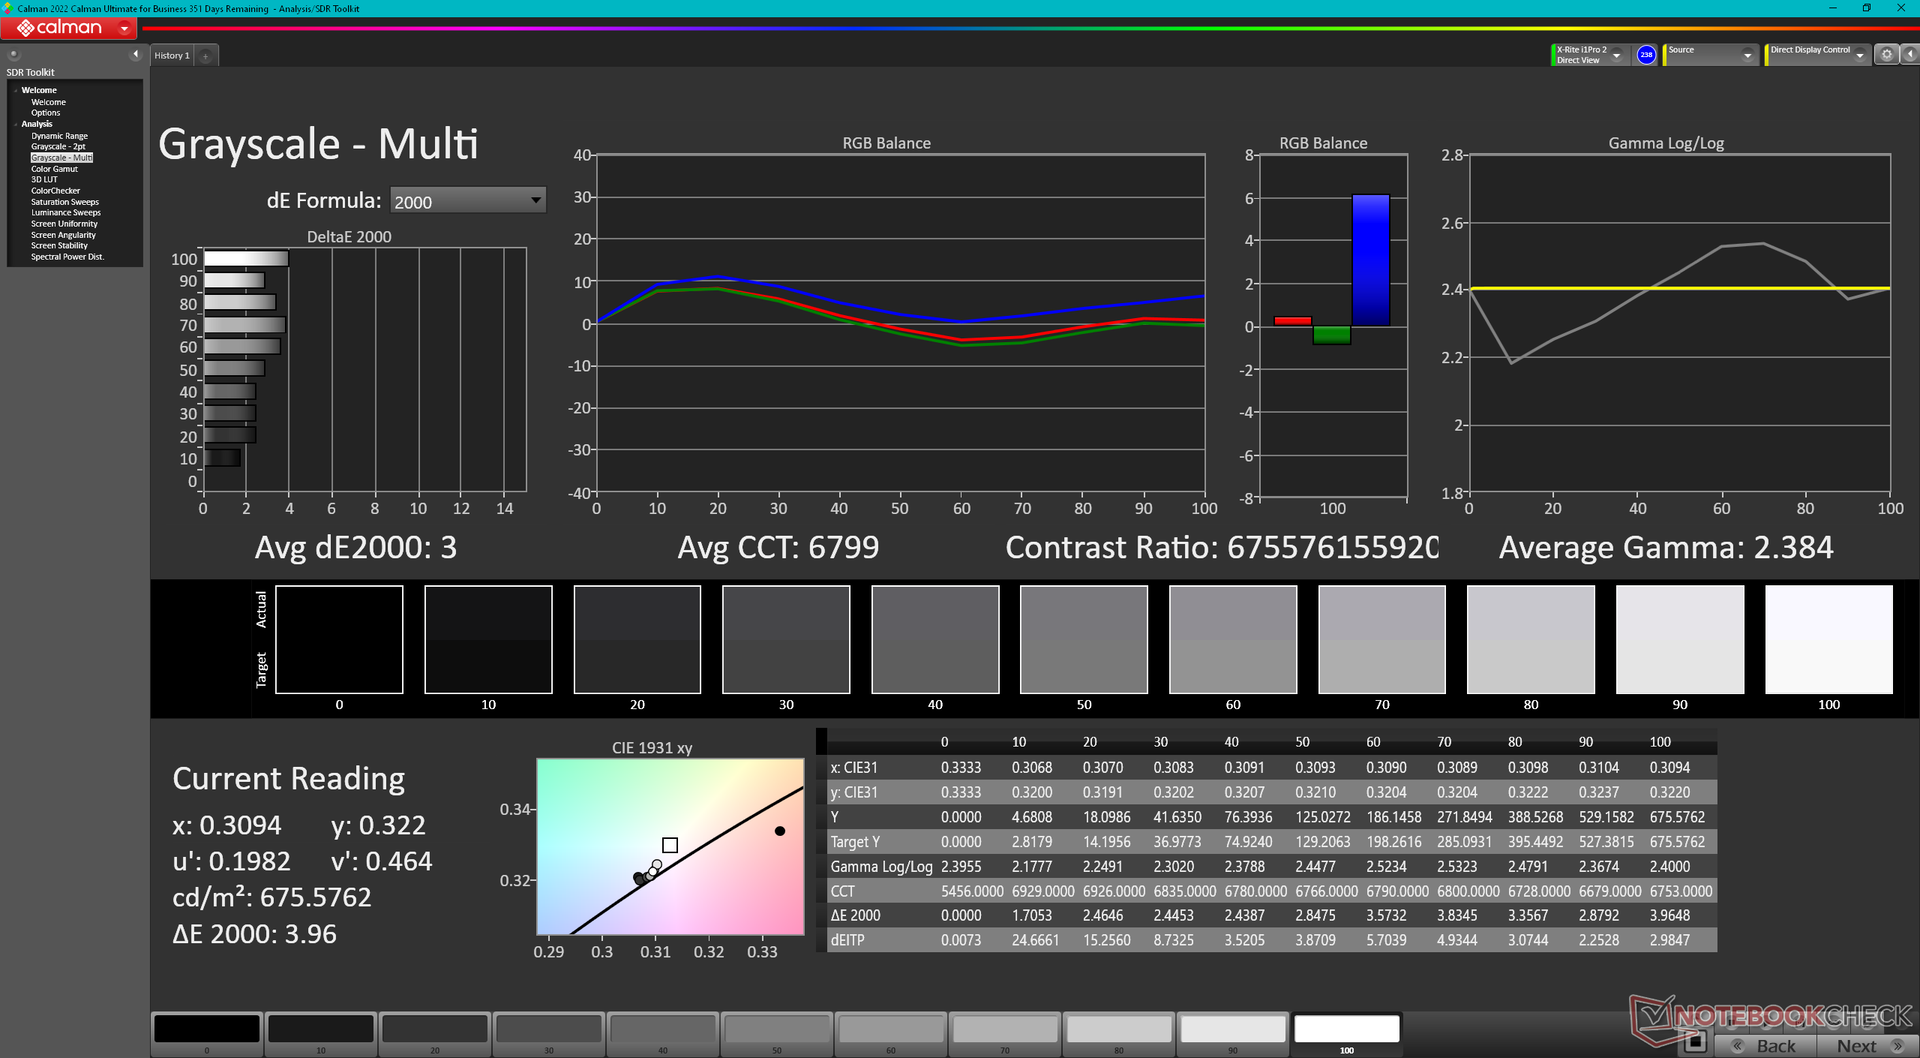
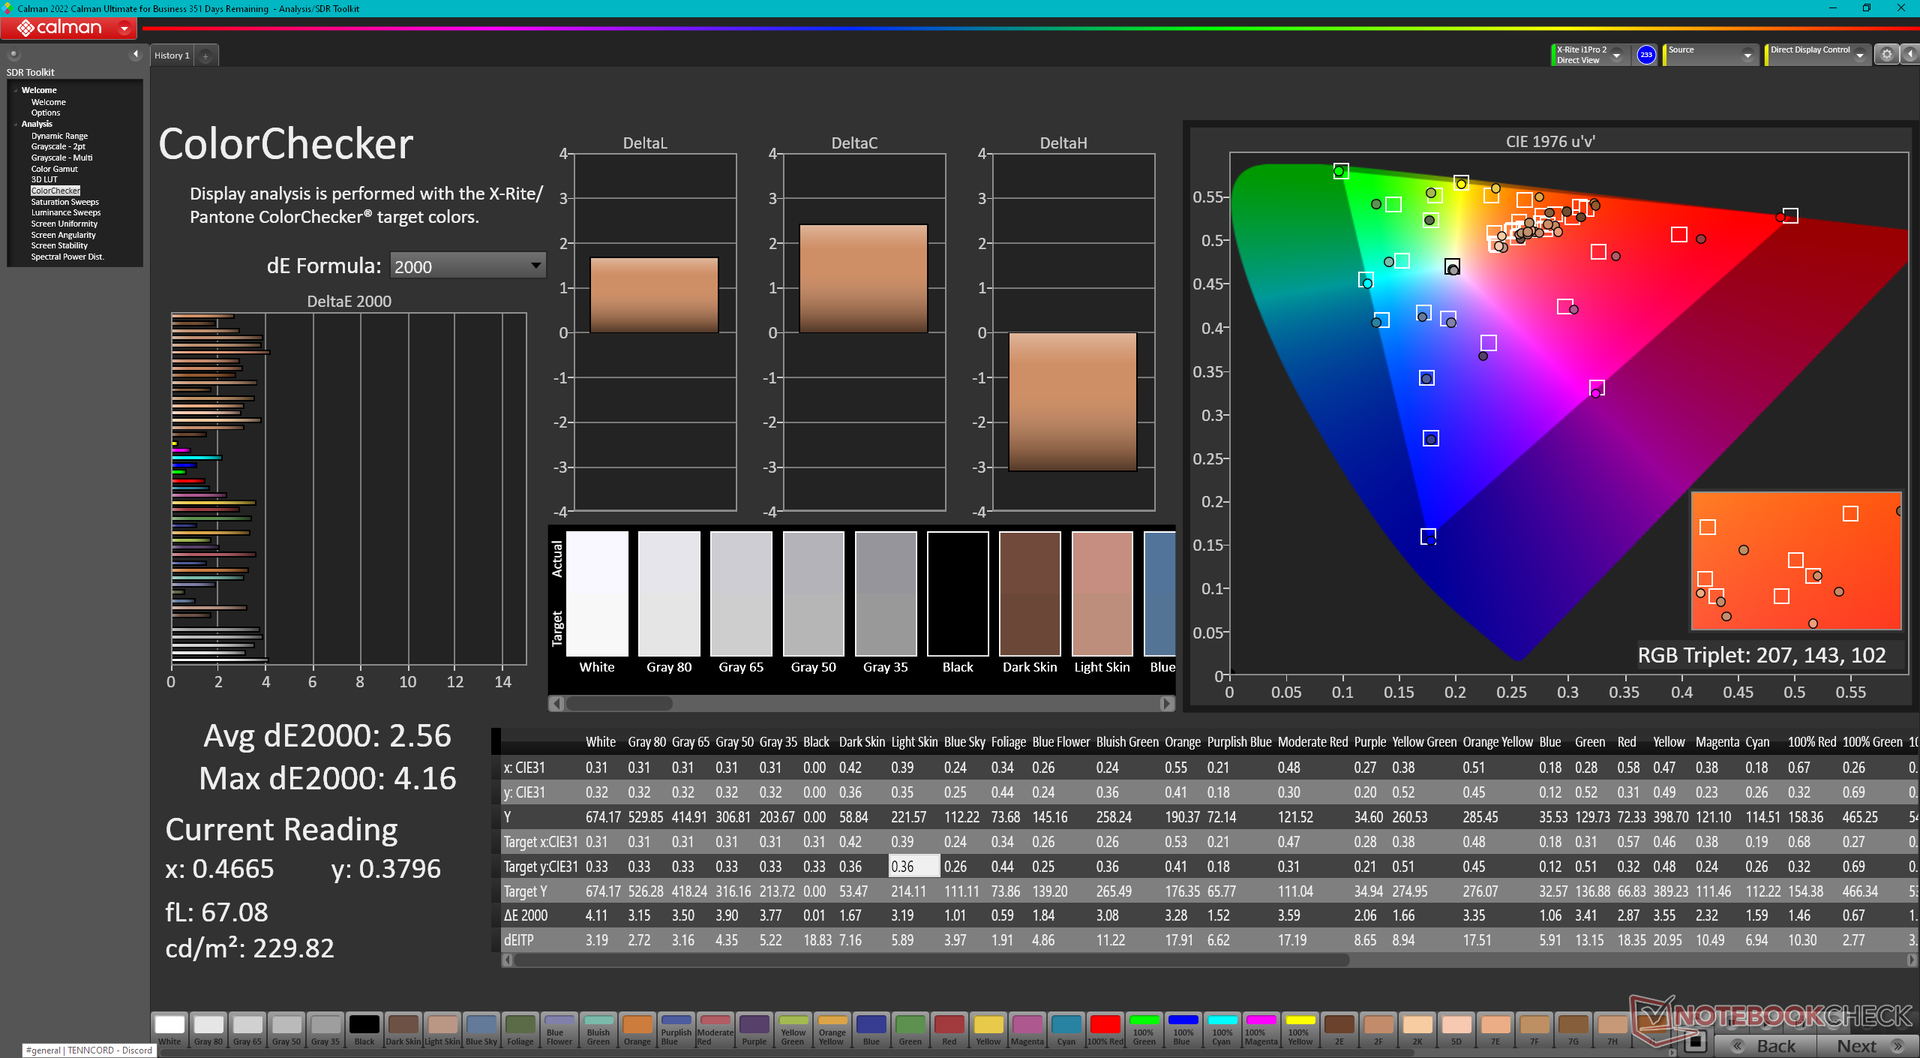
The display comes well-calibrated out of the box against the P3 standard with average grayscale and color DeltaE values of just 3 and 2.56, respectively.
Display Response Times
| ↔ Response Time Black to White | ||
|---|---|---|
| 11.6 ms ... rise ↗ and fall ↘ combined | ↗ 5.1 ms rise | 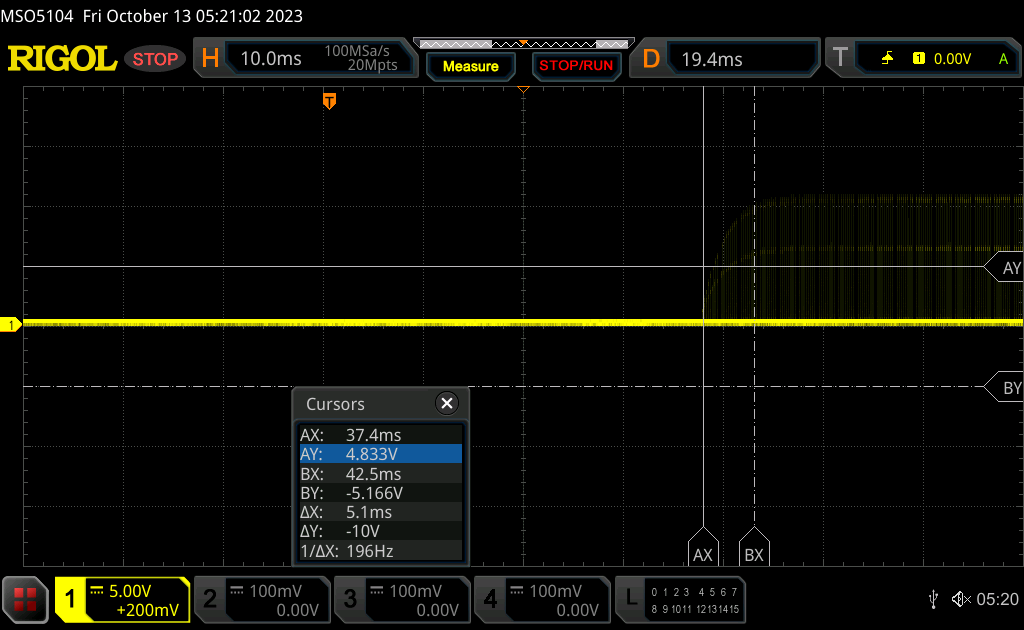 |
| ↘ 6.5 ms fall | ||
| The screen shows good response rates in our tests, but may be too slow for competitive gamers. In comparison, all tested devices range from 0.1 (minimum) to 240 (maximum) ms. » 25 % of all devices are better. This means that the measured response time is better than the average of all tested devices (21.8 ms). | ||
| ↔ Response Time 50% Grey to 80% Grey | ||
| 13.3 ms ... rise ↗ and fall ↘ combined | ↗ 5.7 ms rise | 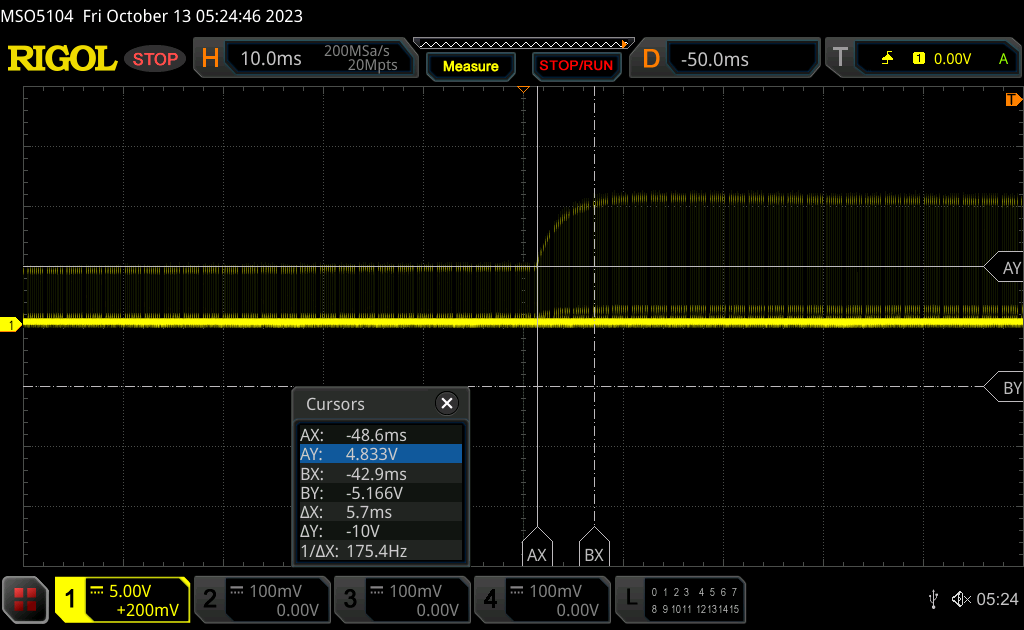 |
| ↘ 7.6 ms fall | ||
| The screen shows good response rates in our tests, but may be too slow for competitive gamers. In comparison, all tested devices range from 0.2 (minimum) to 636 (maximum) ms. » 20 % of all devices are better. This means that the measured response time is better than the average of all tested devices (34.3 ms). | ||
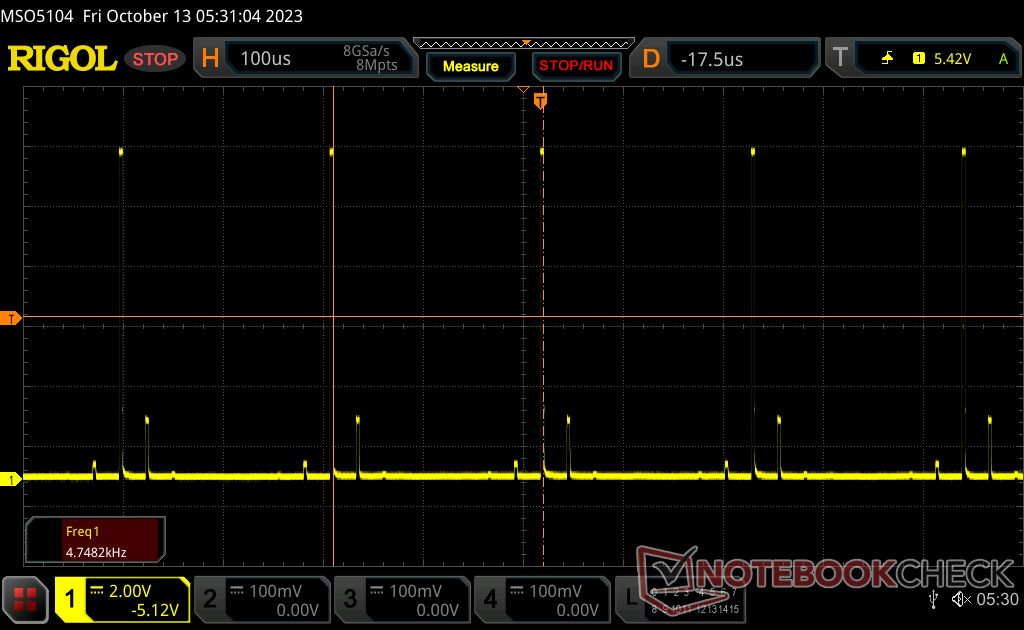
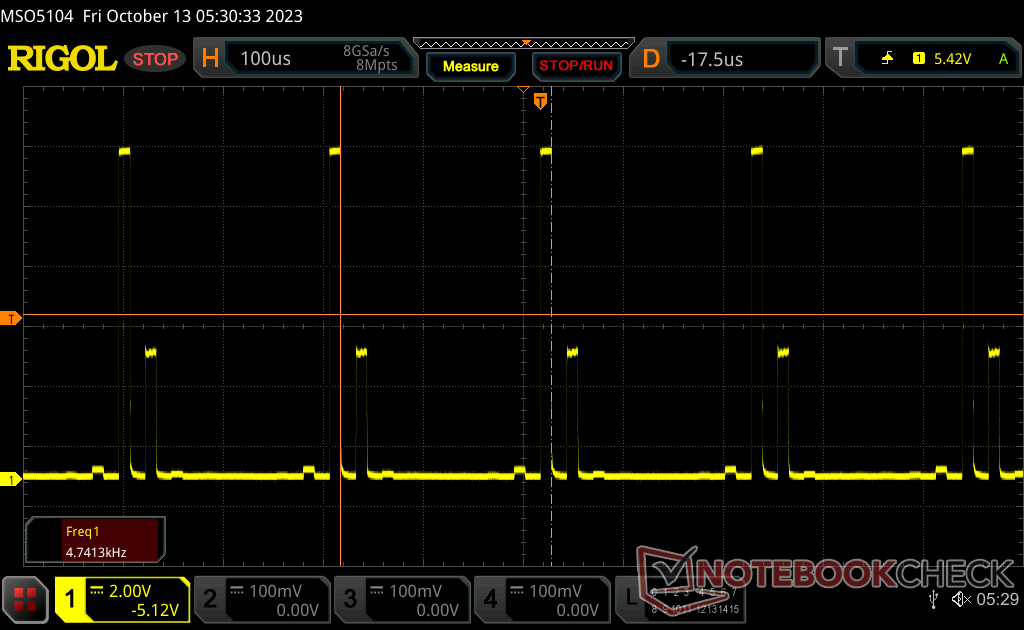
Screen Flickering / PWM (Pulse-Width Modulation)
| Screen flickering / PWM detected | 4742 Hz | 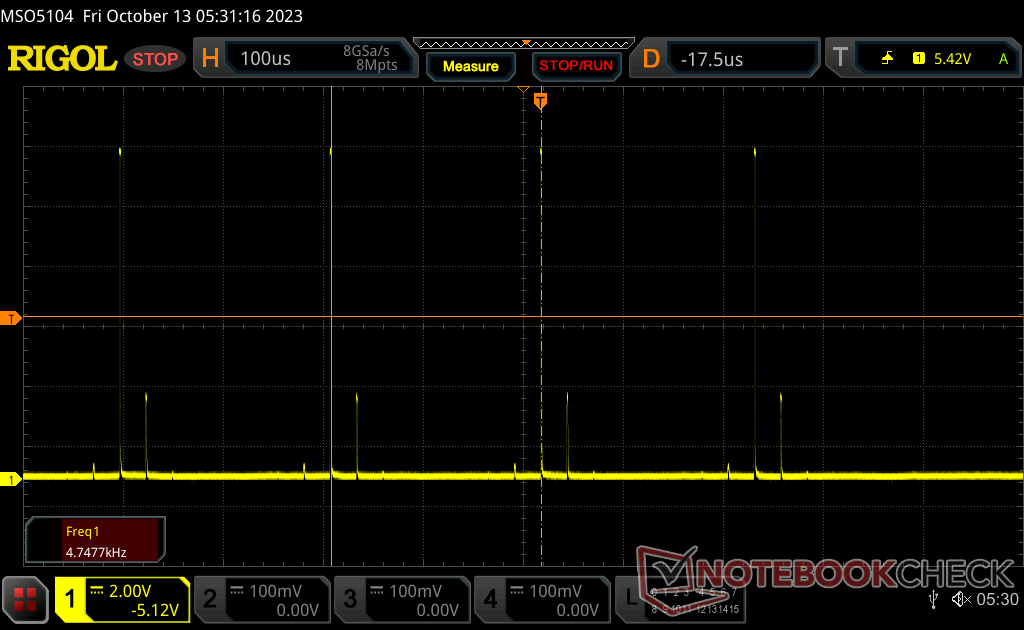 | |
The display backlight flickers at 4742 Hz (Likely utilizing PWM) . The frequency of 4742 Hz is quite high, so most users sensitive to PWM should not notice any flickering. In comparison: 53 % of all tested devices do not use PWM to dim the display. If PWM was detected, an average of 18732 (minimum: 5 - maximum: 3846000) Hz was measured. | |||
Flickering is present on all brightness levels at a steady frequency of 4752 Hz.


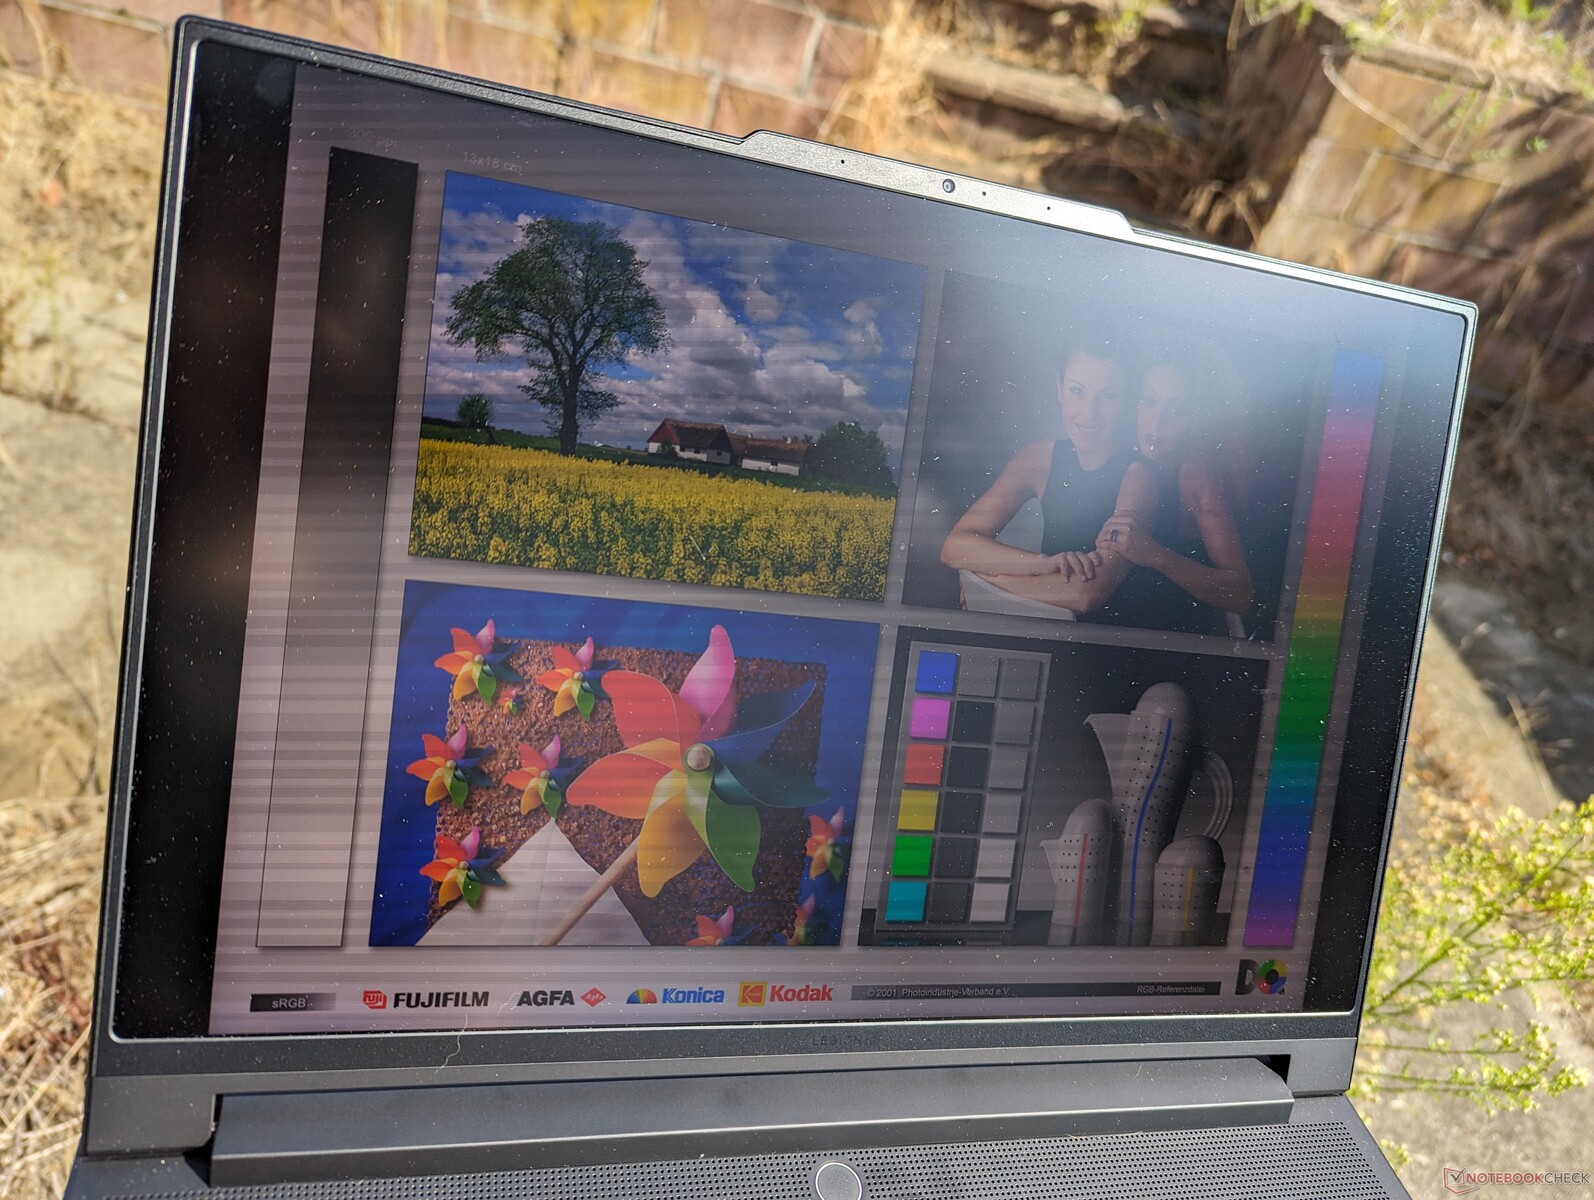
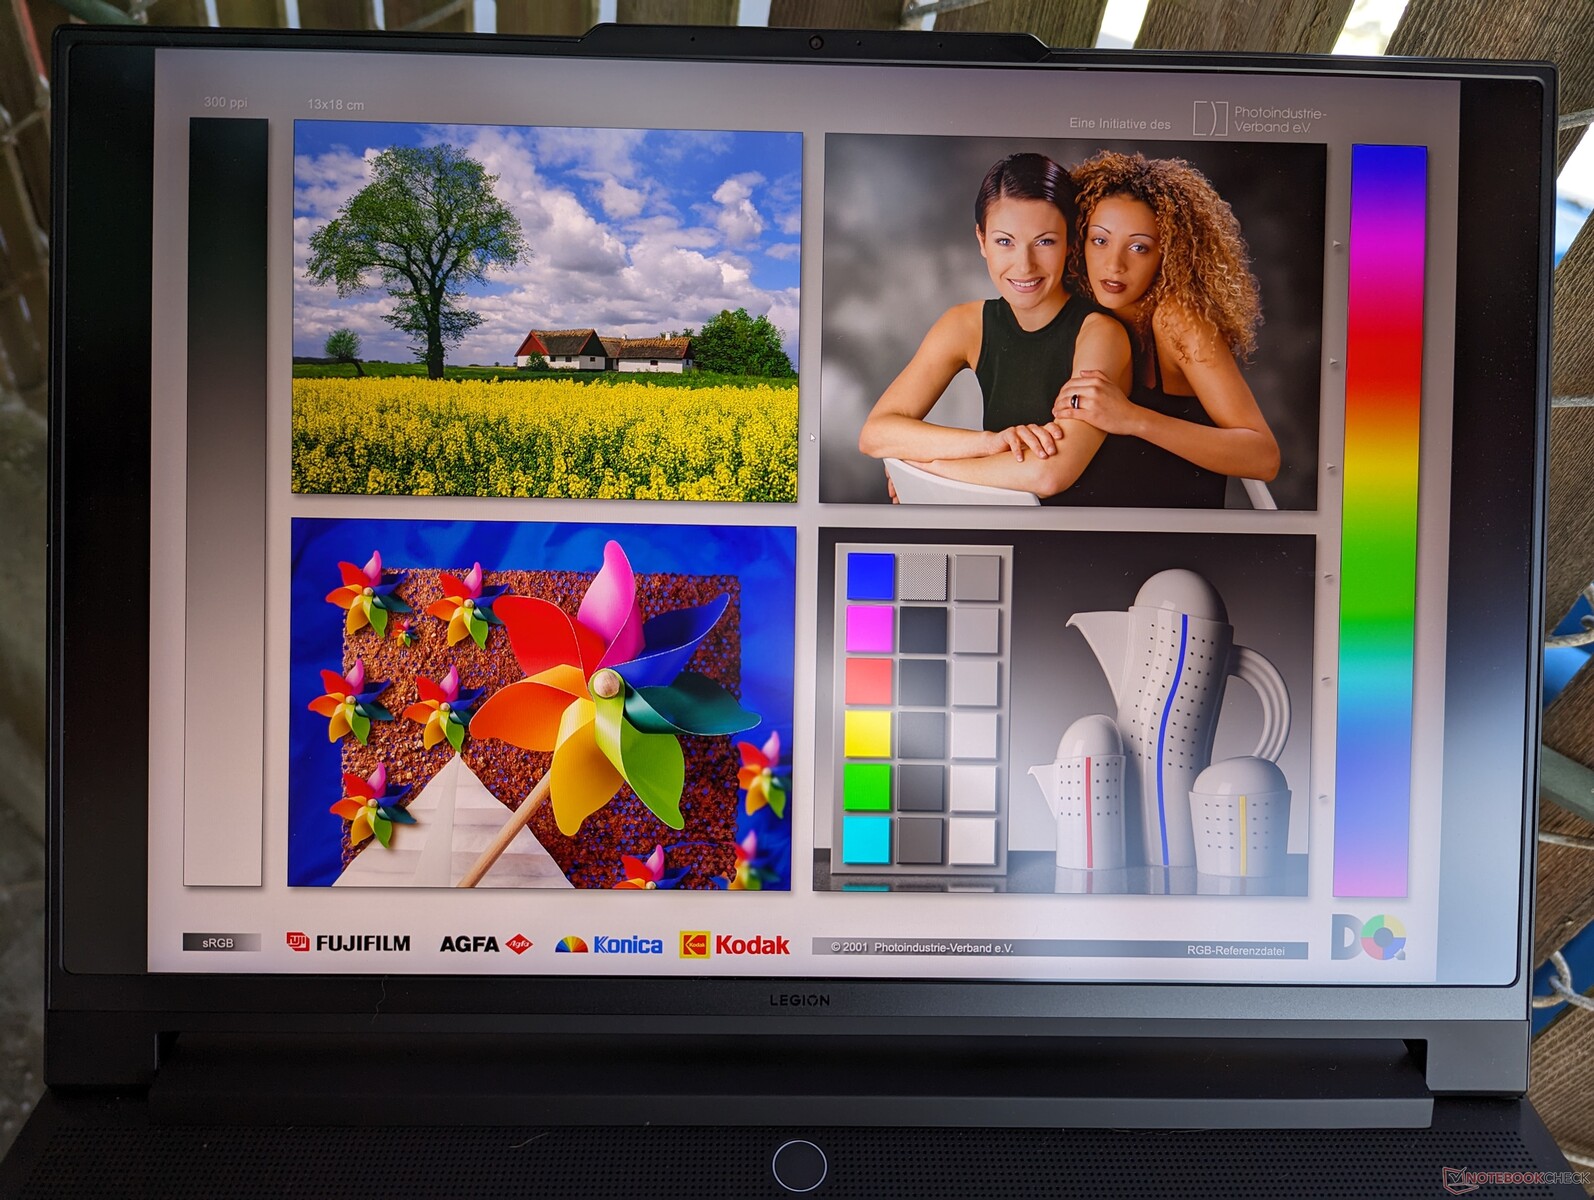
Outdoor visibility is excellent for a gaming laptop due to the aforementioned high maximum brightness of mini-LED. Nonetheless, the heavy weight and short battery life of the system still limit the laptop to mostly indoor scenarios.
Performance — No Core i7 Allowed
Testing Conditions
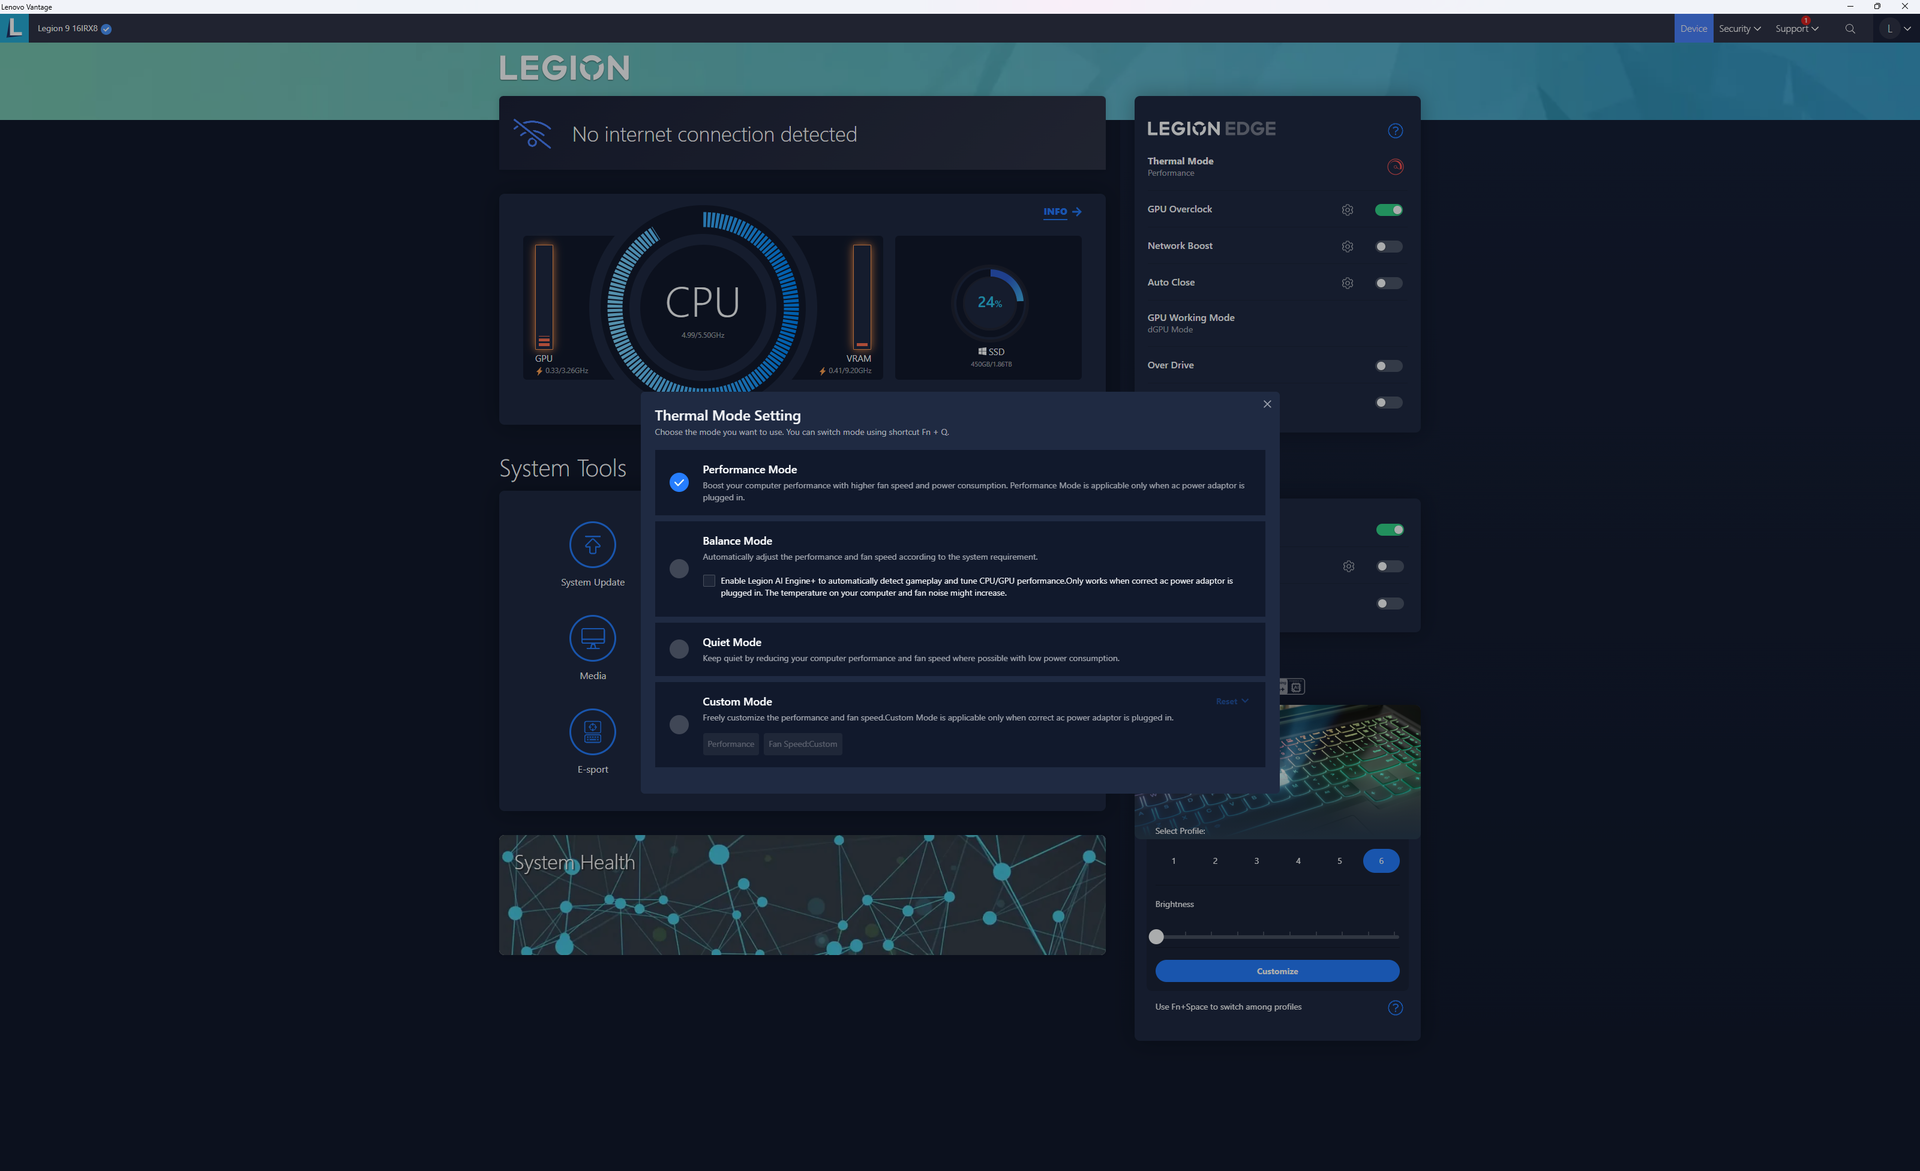
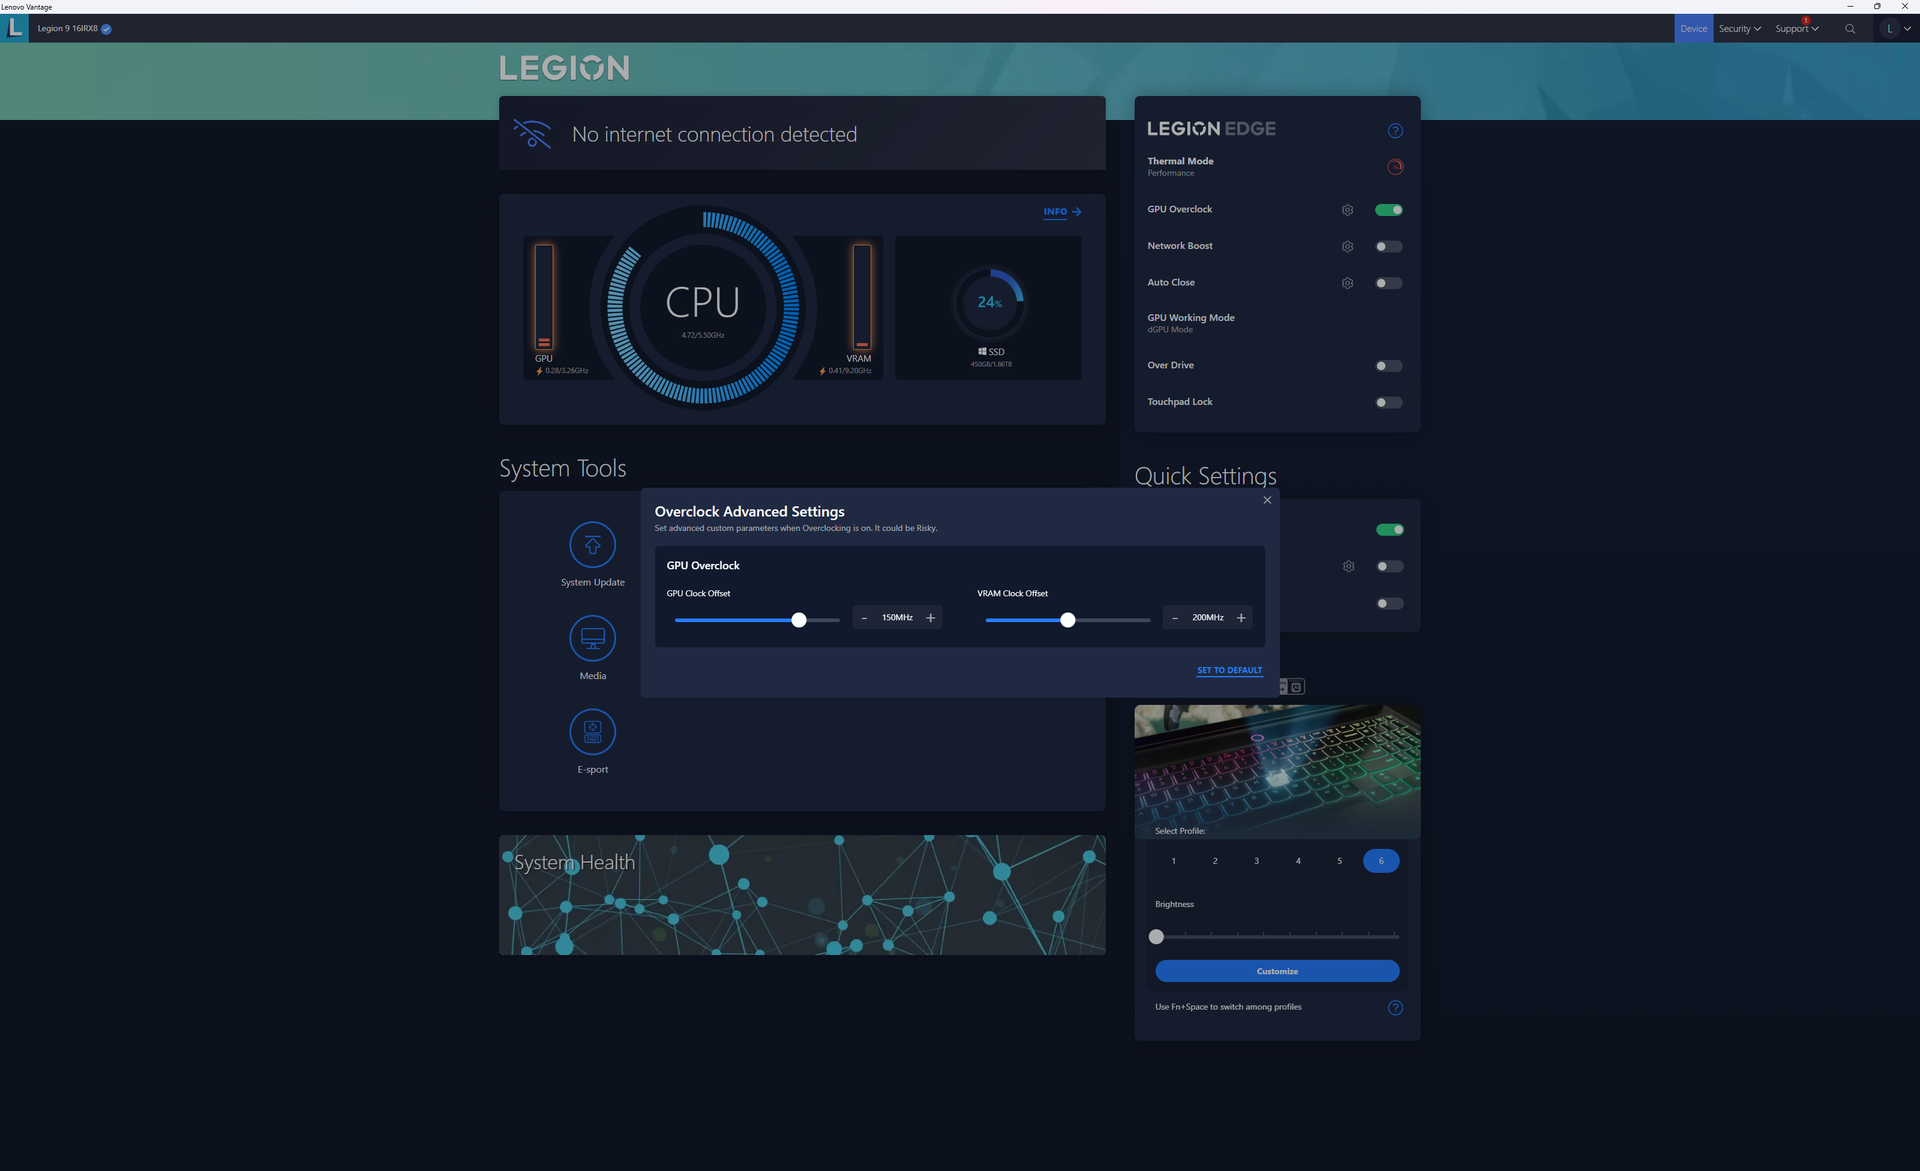
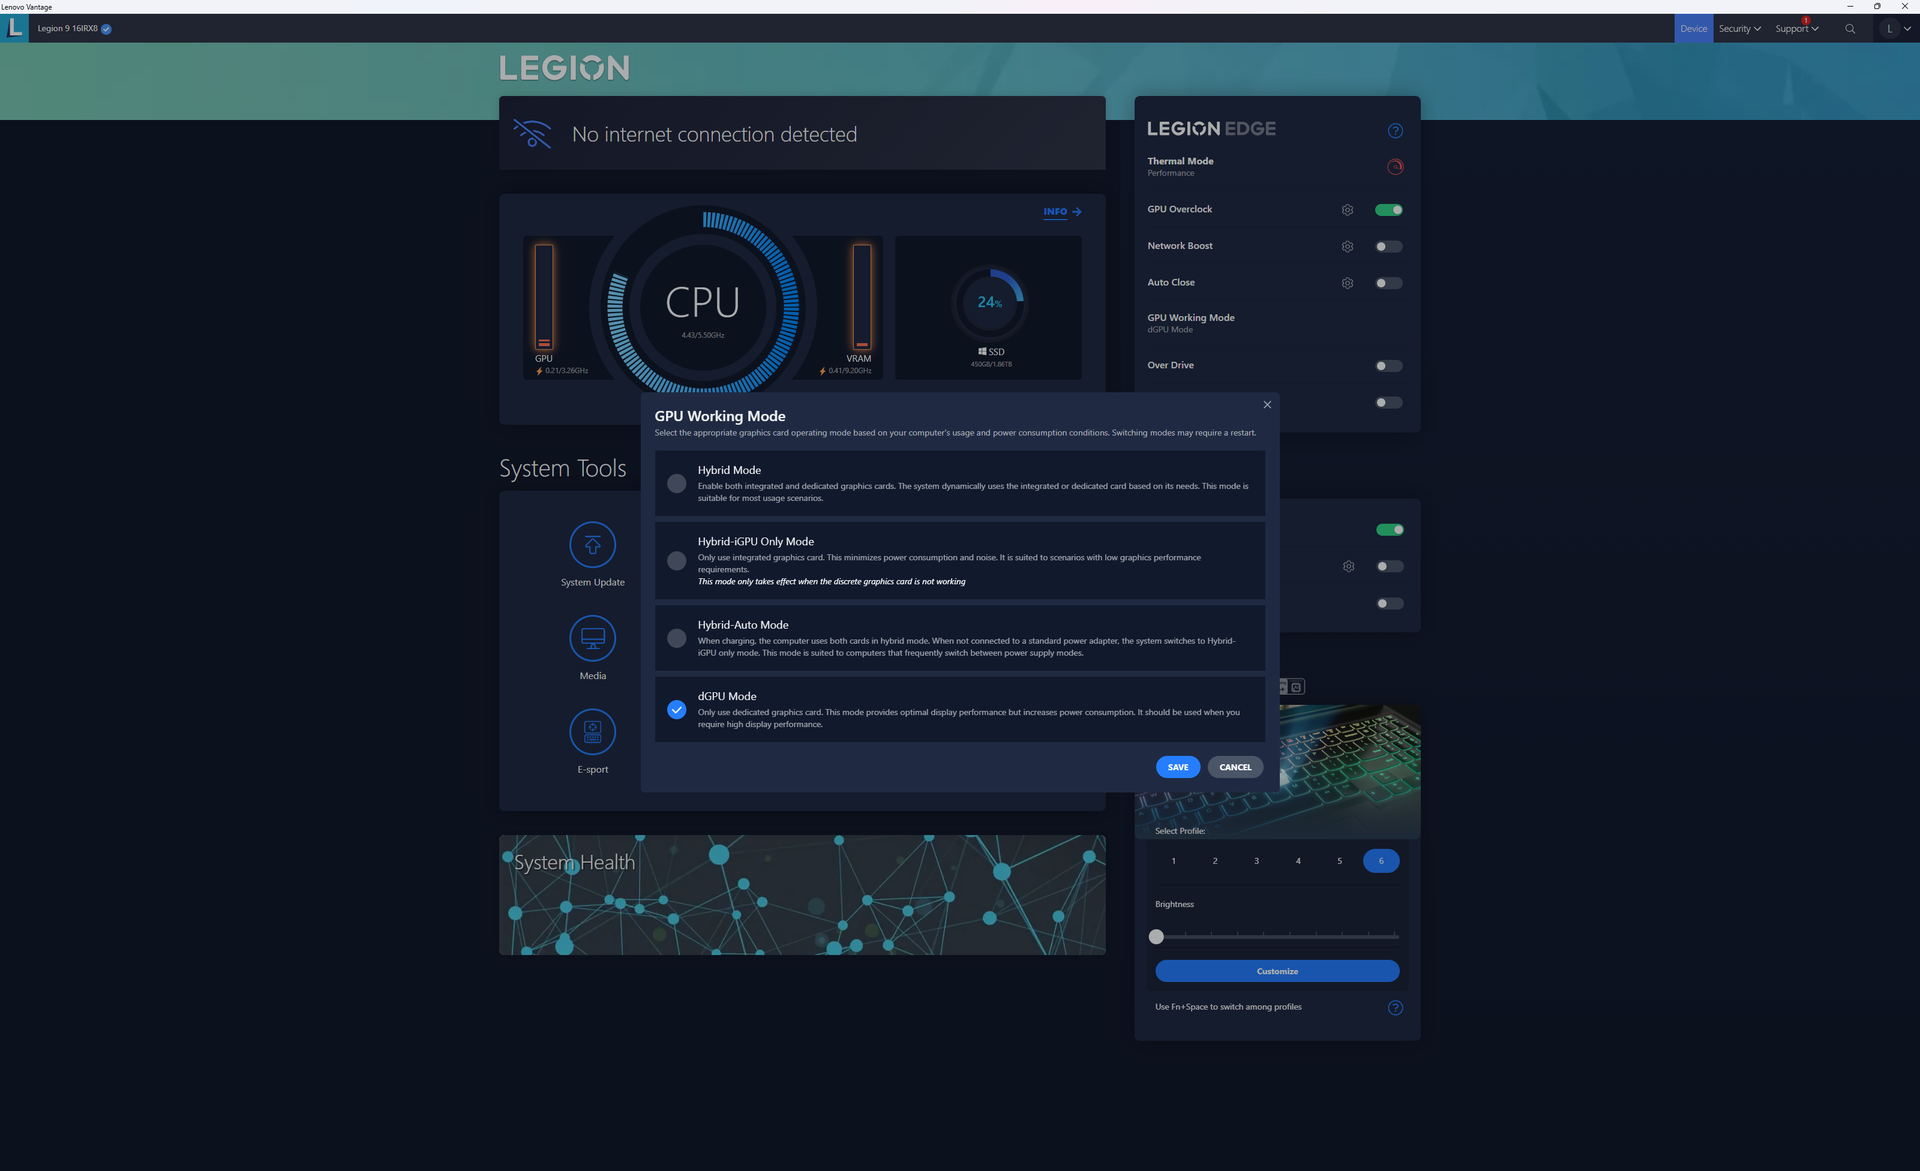
We set our unit to Performance mode and dGPU mode via Lenovo Vantage prior to running the benchmarks below. GPU Overclock is also enabled by default at +150 MHz GPU and +200 MHz VRAM much like on other high-end Legion models. It's recommended that owners become familiar with Vantage to adjust power profiles and other auxiliary settings.
Advanced Optimus, MUX and G-Sync are all supported unlike on the recent Legion Slim 5 14.
Processor
CPU performance is excellent with results that are about 80 to 90 percent faster in multi-threaded workloads than the common Core i7-13700H. The Core i9-13980HX is one of Intel's fastest mobile CPUs at the moment, but it still falls behind the competing Ryzen 9 7945HX in most multi-threaded benchmarks by about 10 percent.
Performance is only 5 percent faster than the Core i9-13950HX based on our time with the 2023 Razer Blade 16. Unfortunately, Lenovo does not offer any other CPUs options other than the Core i9-13980HX for those who might have wanted to save a few hundred dollars.
Cinebench R15 Multi Loop
Cinebench R23: Multi Core | Single Core
Cinebench R20: CPU (Multi Core) | CPU (Single Core)
Cinebench R15: CPU Multi 64Bit | CPU Single 64Bit
Blender: v2.79 BMW27 CPU
7-Zip 18.03: 7z b 4 | 7z b 4 -mmt1
Geekbench 5.5: Multi-Core | Single-Core
HWBOT x265 Benchmark v2.2: 4k Preset
LibreOffice : 20 Documents To PDF
R Benchmark 2.5: Overall mean
* ... smaller is better
AIDA64: FP32 Ray-Trace | FPU Julia | CPU SHA3 | CPU Queen | FPU SinJulia | FPU Mandel | CPU AES | CPU ZLib | FP64 Ray-Trace | CPU PhotoWorxx
| Performance Rating | |
| Lenovo Legion 9 16IRX8 | |
| Average Intel Core i9-13980HX | |
| Asus ROG Strix G16 G614JZ | |
| HP Omen Transcend 16 | |
| Razer Blade 16 Early 2023 RTX 4090 | |
| Lenovo Legion Slim 5 16APH8 | |
| Alienware x16 R1 | |
| AIDA64 / FP32 Ray-Trace | |
| Lenovo Legion Slim 5 16APH8 | |
| Asus ROG Strix G16 G614JZ | |
| Lenovo Legion 9 16IRX8 | |
| Average Intel Core i9-13980HX (21332 - 29553, n=9) | |
| HP Omen Transcend 16 | |
| Alienware x16 R1 | |
| Razer Blade 16 Early 2023 RTX 4090 | |
| AIDA64 / FP64 Ray-Trace | |
| Lenovo Legion Slim 5 16APH8 | |
| Lenovo Legion 9 16IRX8 | |
| Asus ROG Strix G16 G614JZ | |
| Average Intel Core i9-13980HX (11431 - 16325, n=9) | |
| HP Omen Transcend 16 | |
| Alienware x16 R1 | |
| Razer Blade 16 Early 2023 RTX 4090 | |
| AIDA64 / CPU PhotoWorxx | |
| Razer Blade 16 Early 2023 RTX 4090 | |
| Lenovo Legion 9 16IRX8 | |
| HP Omen Transcend 16 | |
| Alienware x16 R1 | |
| Average Intel Core i9-13980HX (37069 - 52949, n=9) | |
| Asus ROG Strix G16 G614JZ | |
| Lenovo Legion Slim 5 16APH8 | |
System Performance
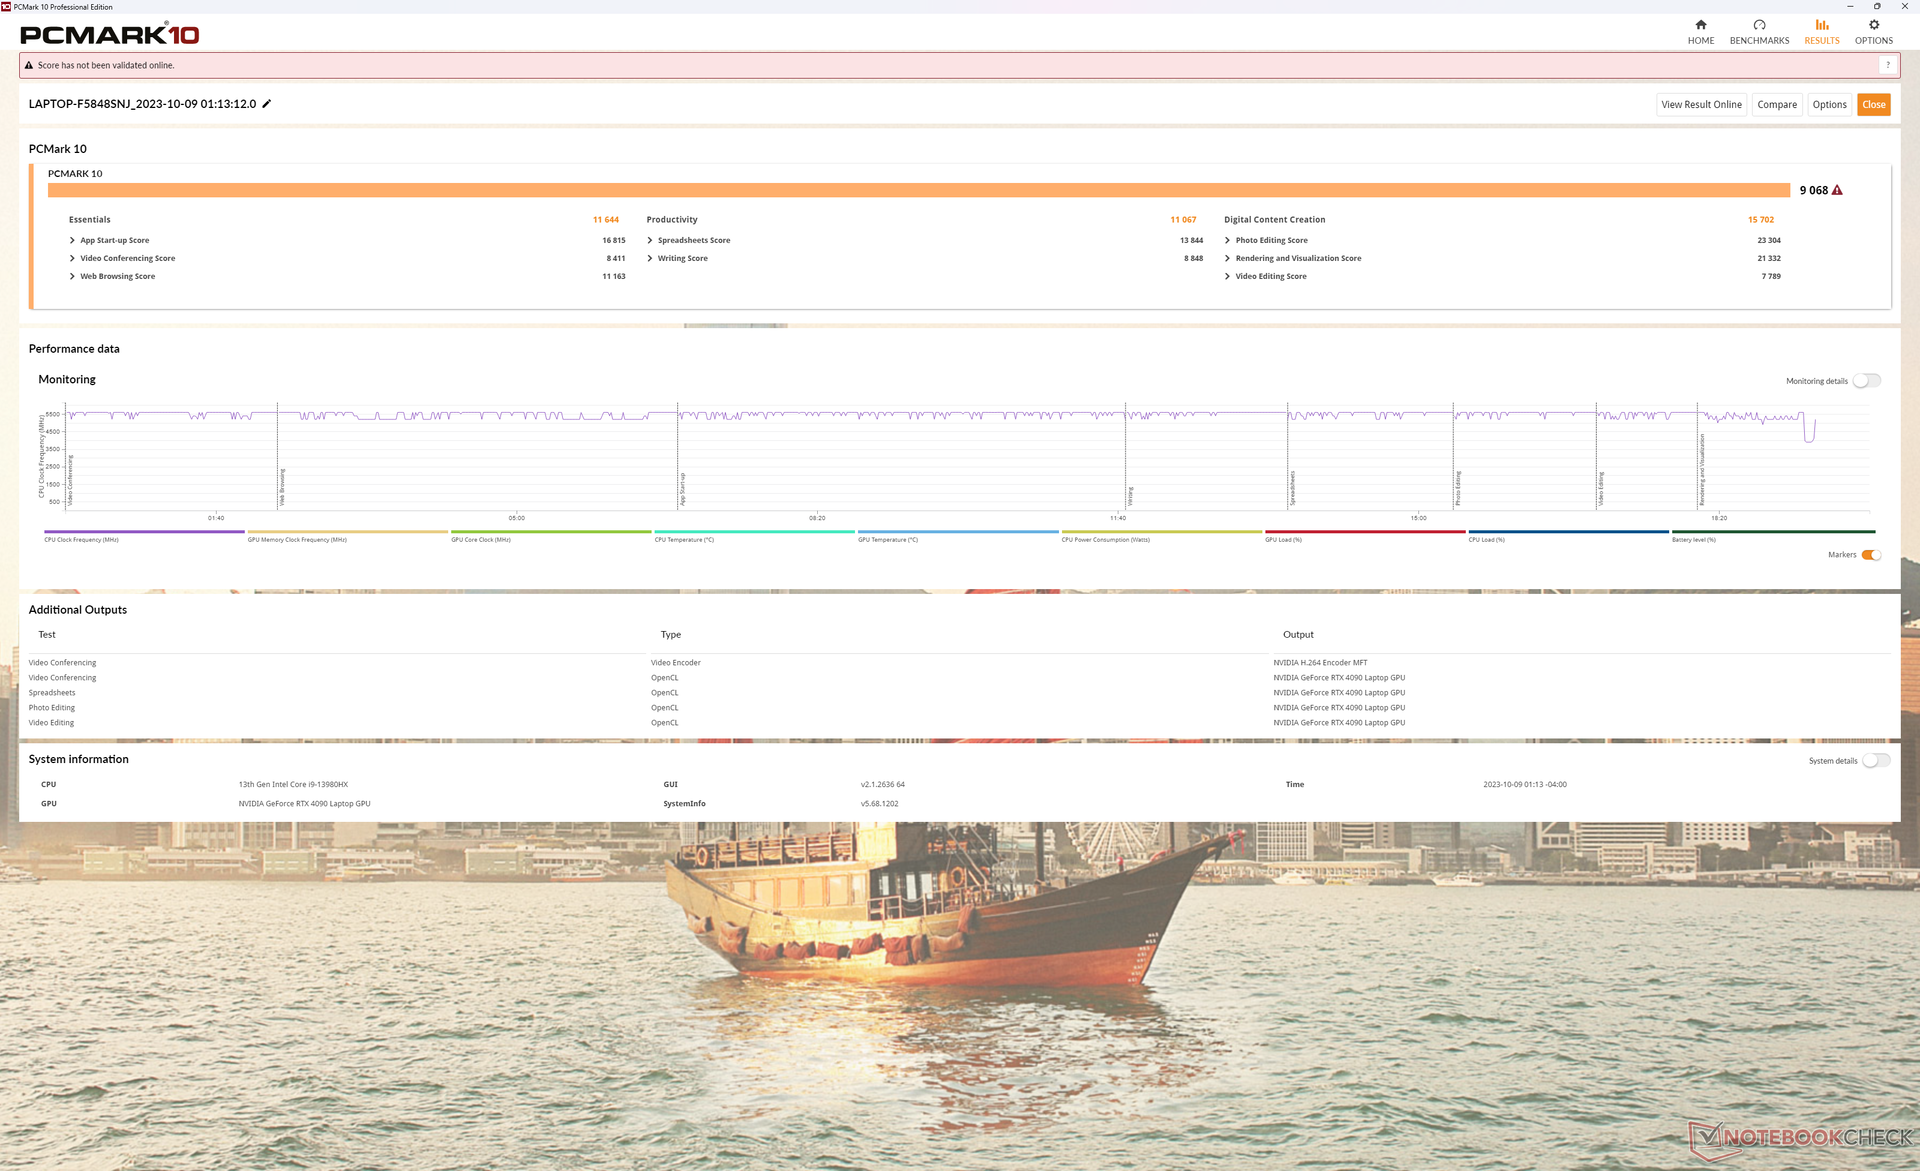
PCMark scores are some of the highest of any gaming laptop regardless of size due in no small part to our 13th gen Core HX CPU, RTX 4090 GPU, and especially the RAID 0 PCIe4 x4 configuration. Nonetheless, we still experienced wake-from-sleep issues where the screen would sometimes remain blank and "frozen" for unusually long periods of time. We suspect this could be due to how the model juggles between the many different GPU modes.
CrossMark: Overall | Productivity | Creativity | Responsiveness
| PCMark 10 / Digital Content Creation | |
| Lenovo Legion 9 16IRX8 | |
| Average Intel Core i9-13980HX, NVIDIA GeForce RTX 4090 Laptop GPU (15052 - 16012, n=3) | |
| Alienware x16 R1 | |
| HP Omen Transcend 16 | |
| Razer Blade 16 Early 2023 RTX 4090 | |
| Lenovo Legion Slim 5 16APH8 | |
| Asus ROG Strix G16 G614JZ | |
| PCMark 10 Score | 9068 points | |
Help | ||
* ... smaller is better
DPC Latency
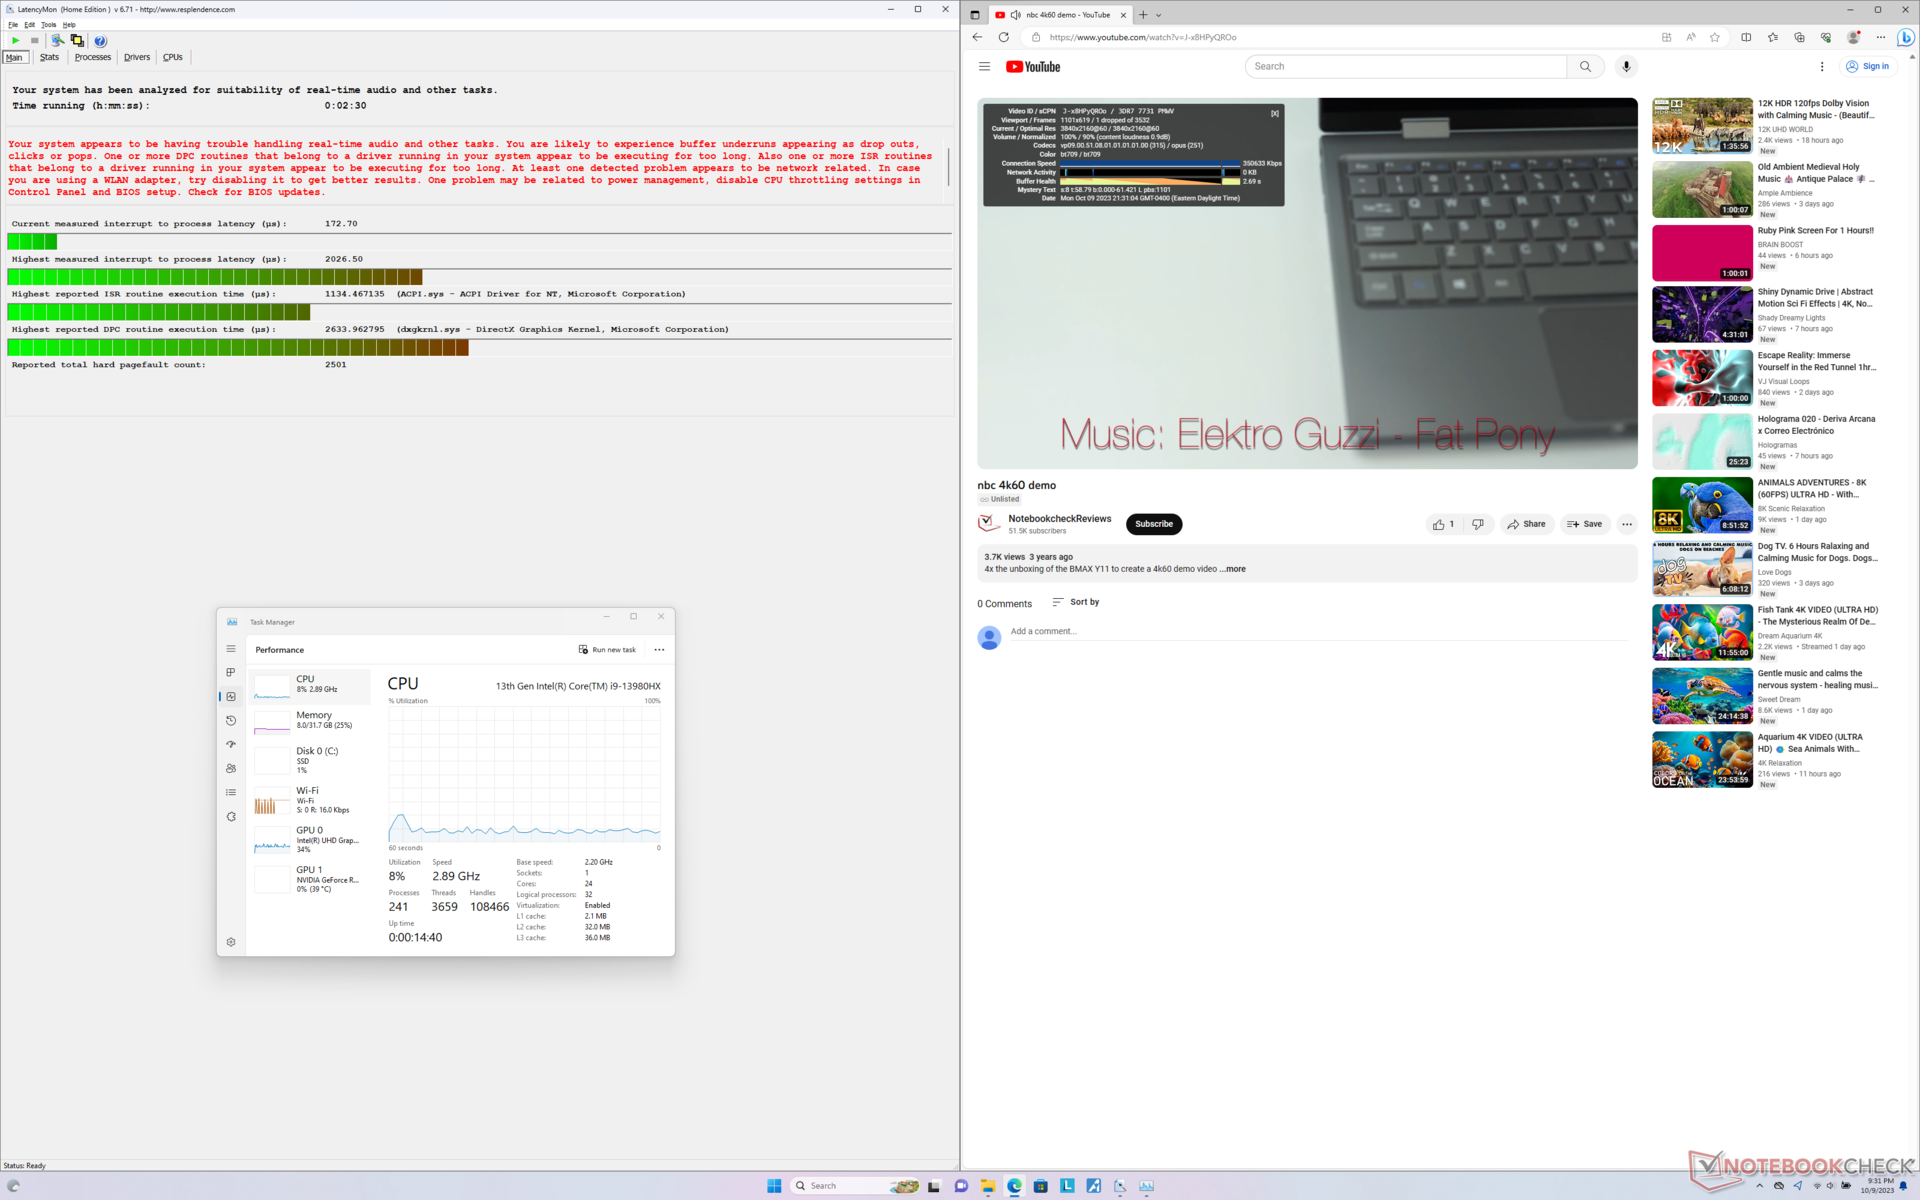
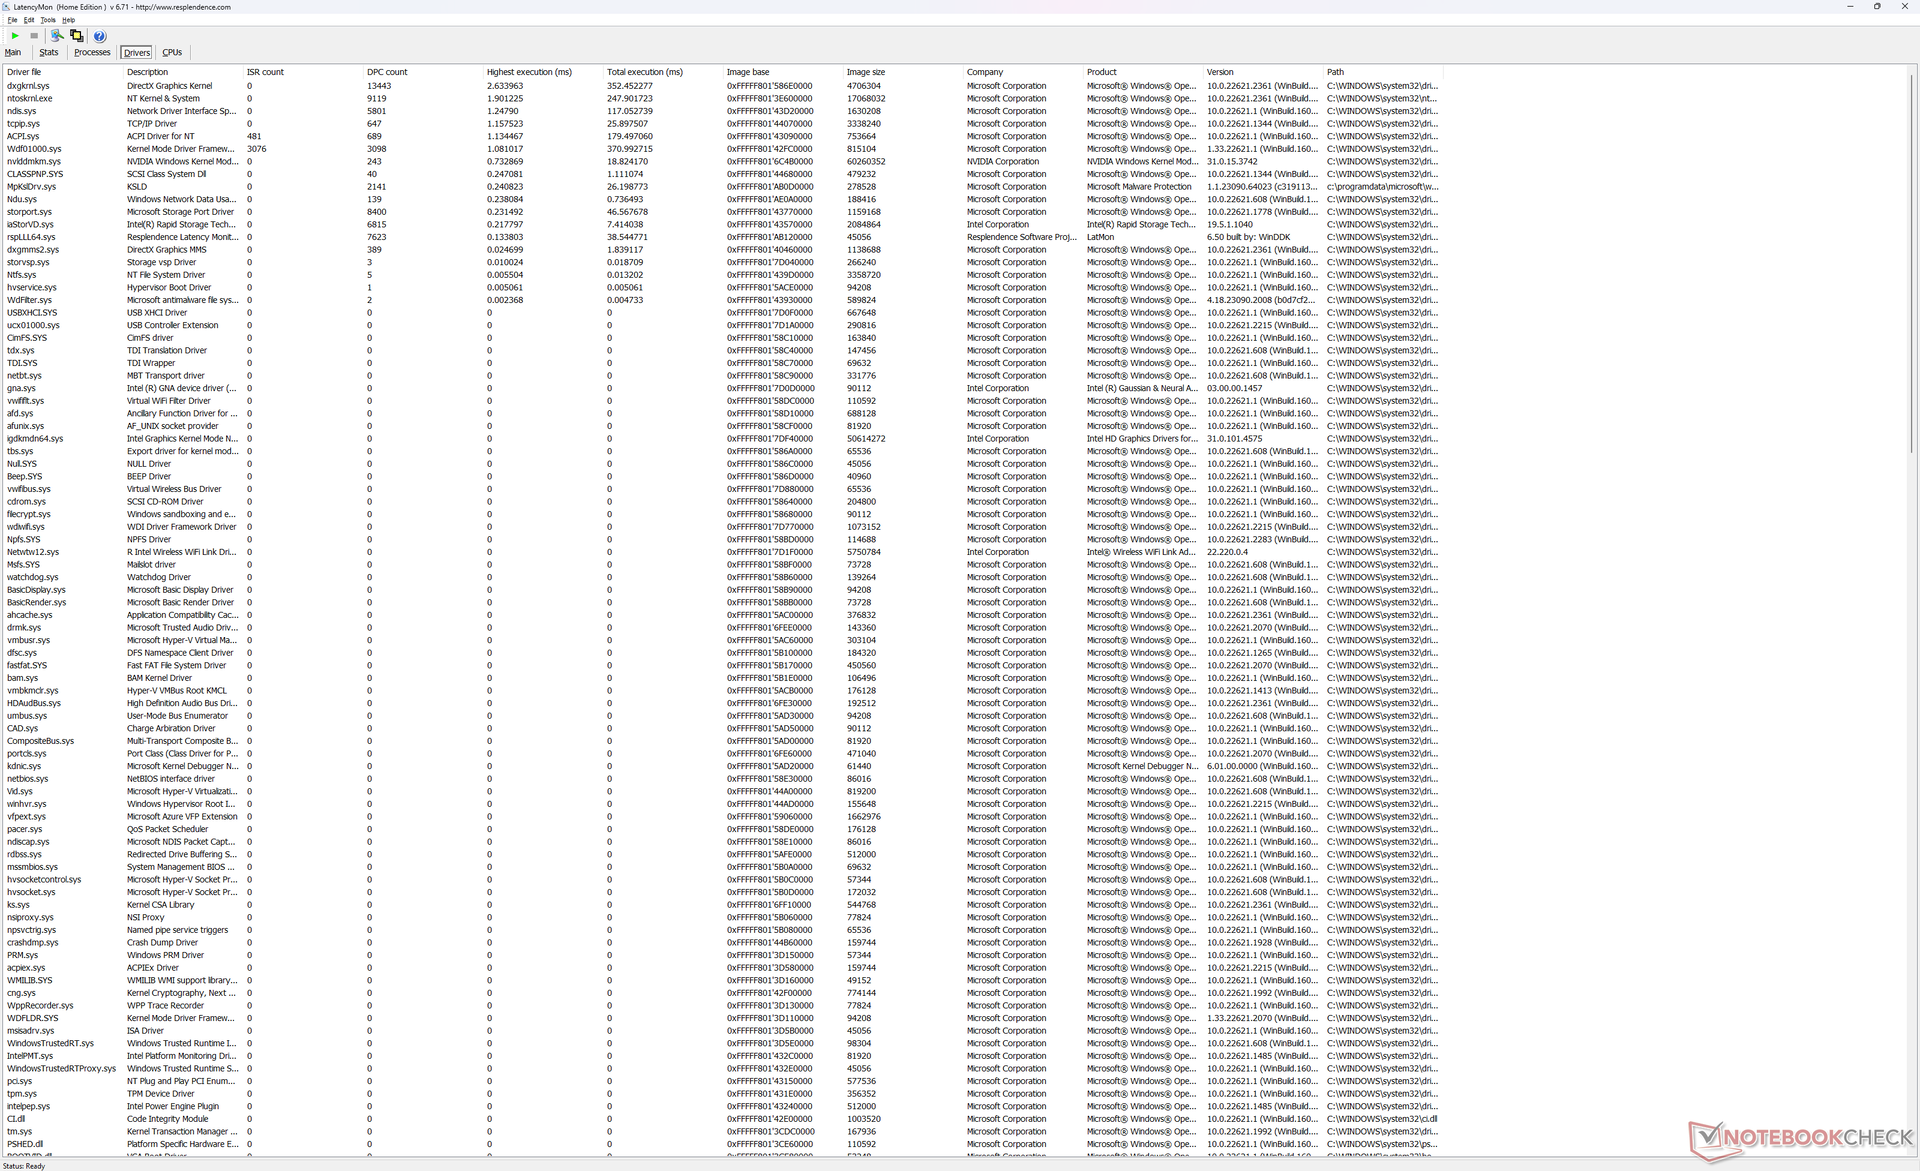
LatencyMon reveals DPC issues when opening multiple browser tabs of our homepage. 4K video playback at 60 FPS is almost perfect with just one dropped frame recorded during a one-minute interval.
| DPC Latencies / LatencyMon - interrupt to process latency (max), Web, Youtube, Prime95 | |
| Razer Blade 16 Early 2023 RTX 4090 | |
| Razer Blade 16 Early 2023 RTX 4090 | |
| Asus ROG Strix G16 G614JZ | |
| Lenovo Legion 9 16IRX8 | |
| HP Omen Transcend 16 | |
| Alienware x16 R1 | |
| Lenovo Legion Slim 5 16APH8 | |
* ... smaller is better
Storage Devices
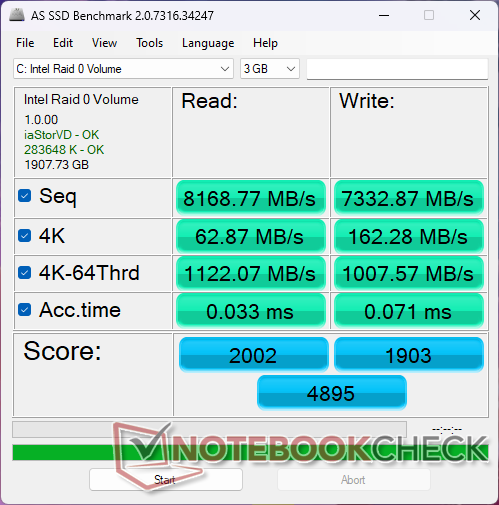
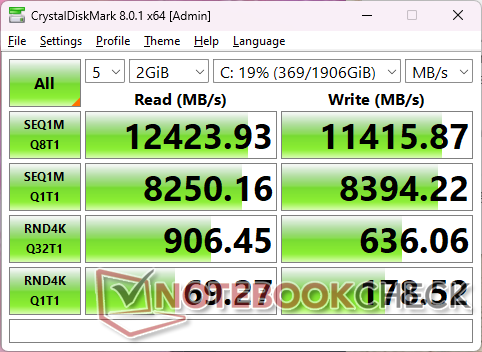
Our unit comes configured with two SK hynix HFS001TEJ9X115N PCIe4 x4 NVMe SSDs in RAID 0 configuration for insanely fast sequential read and write rates of up over 12000 MB/s an 11000 MB/s, respectively. Unfortunately, the drives are prone to throttling when running at such high speeds for extended periods. Our DiskSpd loop test results below show read rates for one of the drives falling to around 4600 MB/s after about 4 minutes.

| Drive Performance Rating - Percent | |
| Alienware x16 R1 | |
| Lenovo Legion 9 16IRX8 | |
| Razer Blade 16 Early 2023 RTX 4090 | |
| Asus ROG Strix G16 G614JZ | |
| HP Omen Transcend 16 | |
| Lenovo Legion Slim 5 16APH8 | |
* ... smaller is better
Disk Throttling: DiskSpd Read Loop, Queue Depth 8
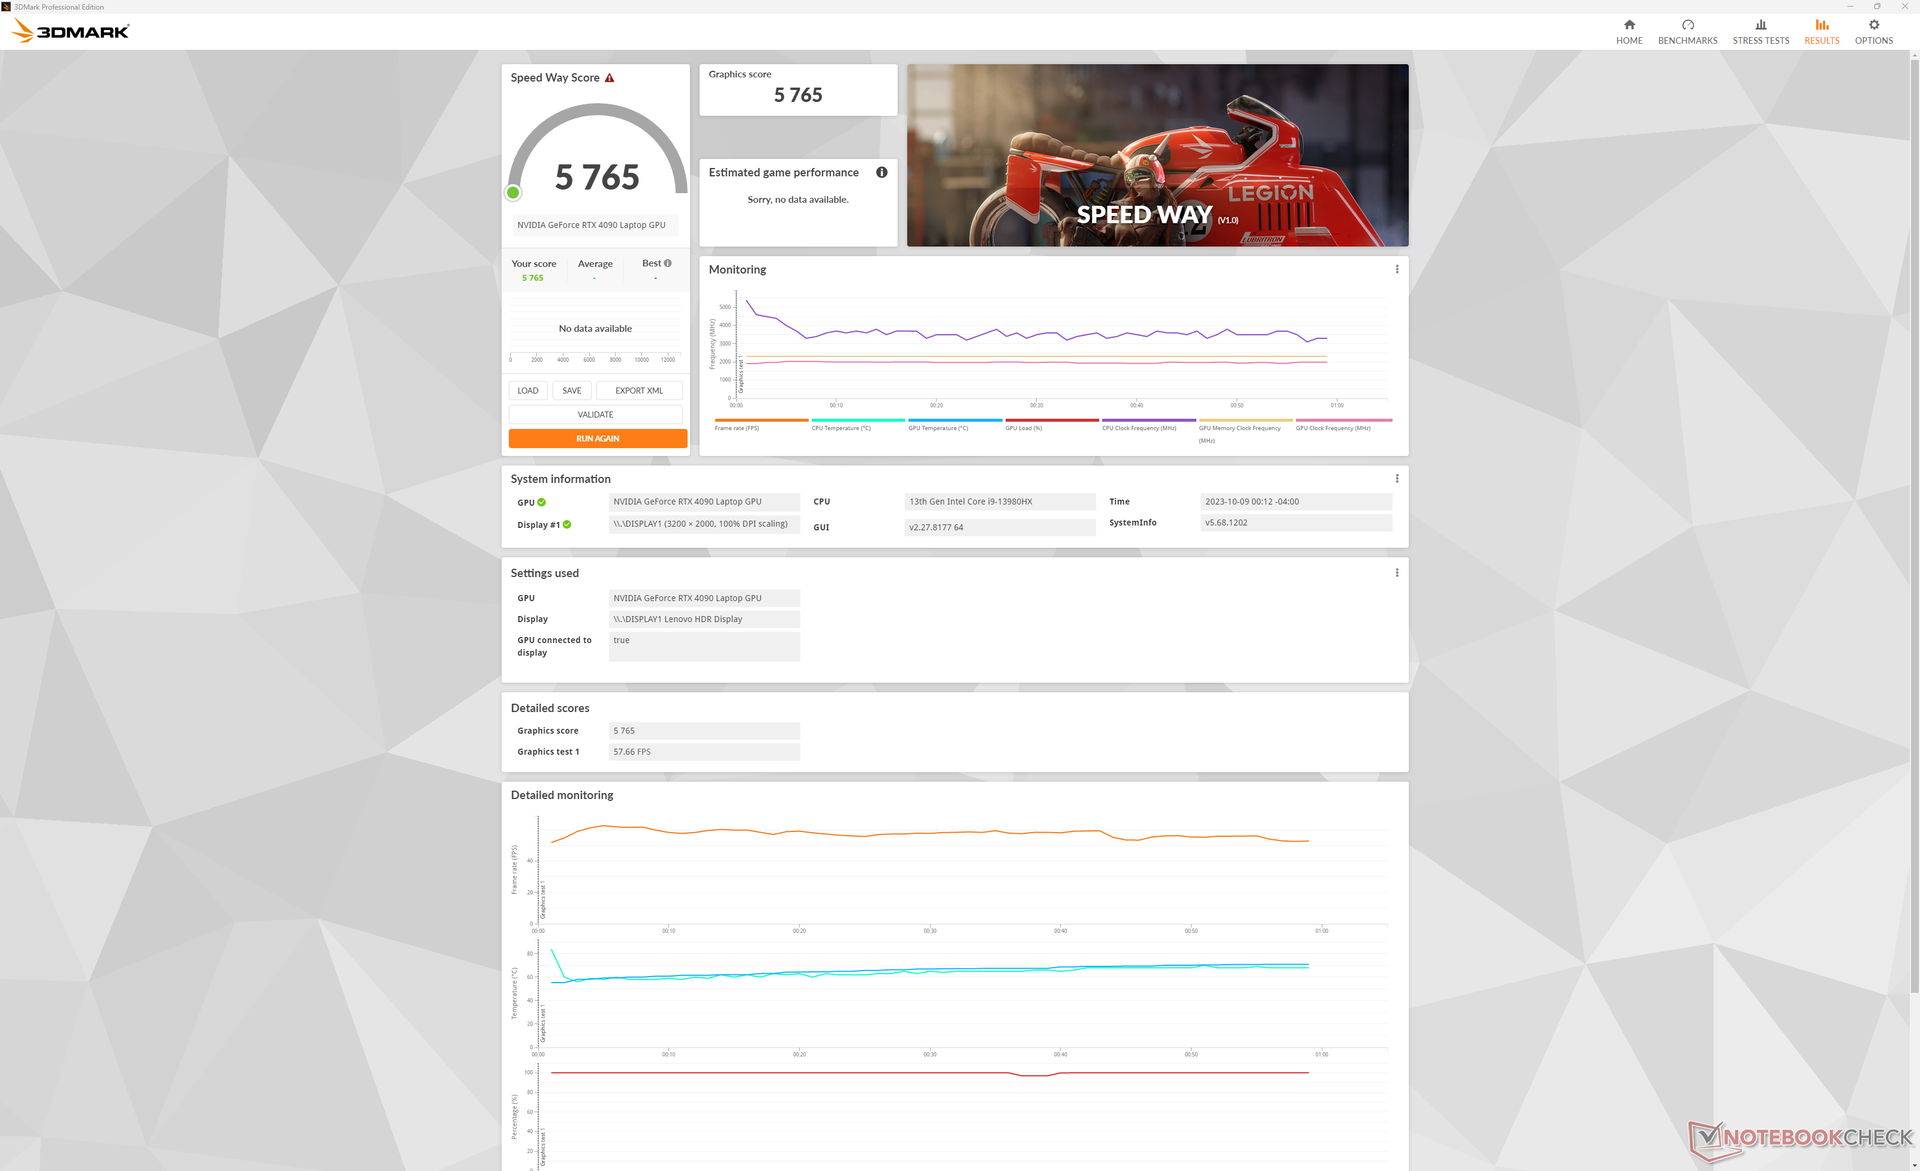
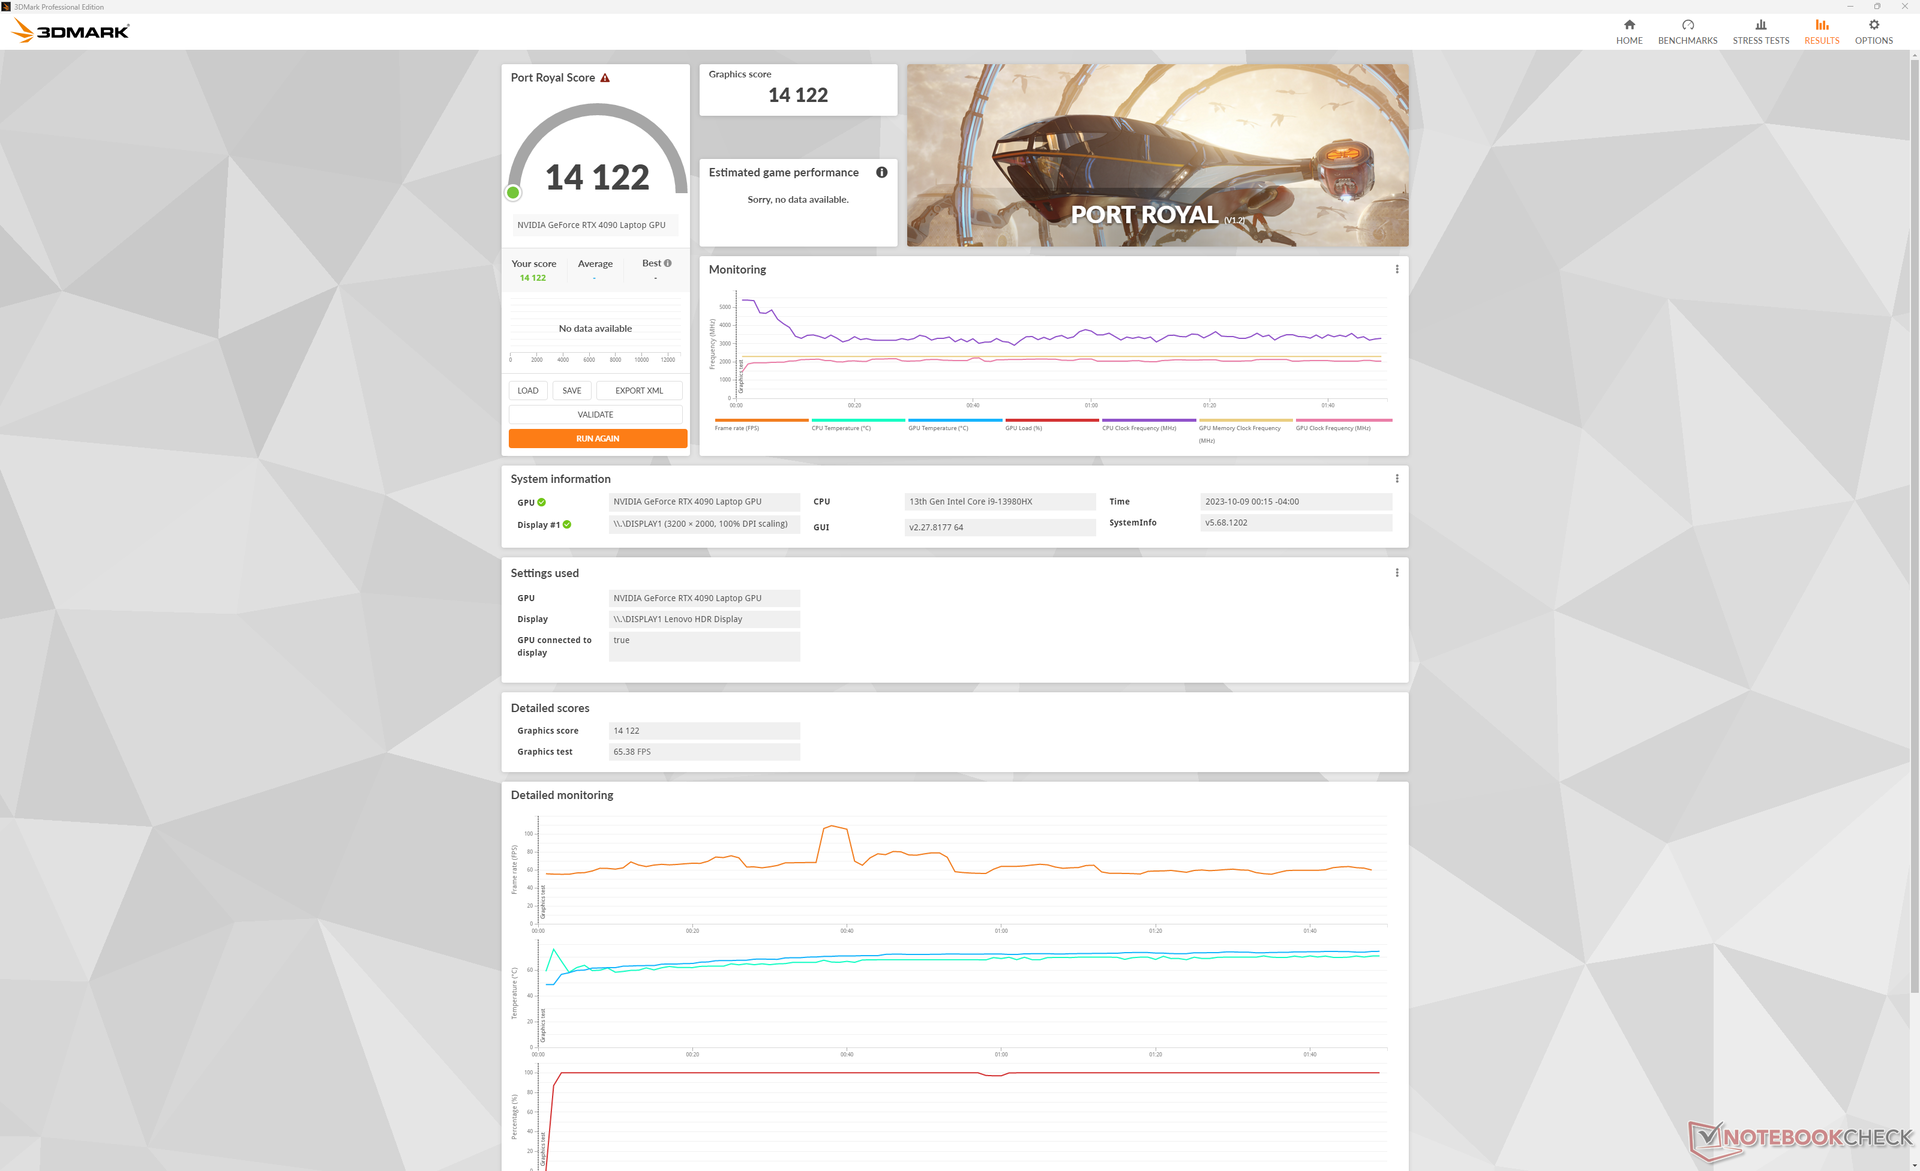
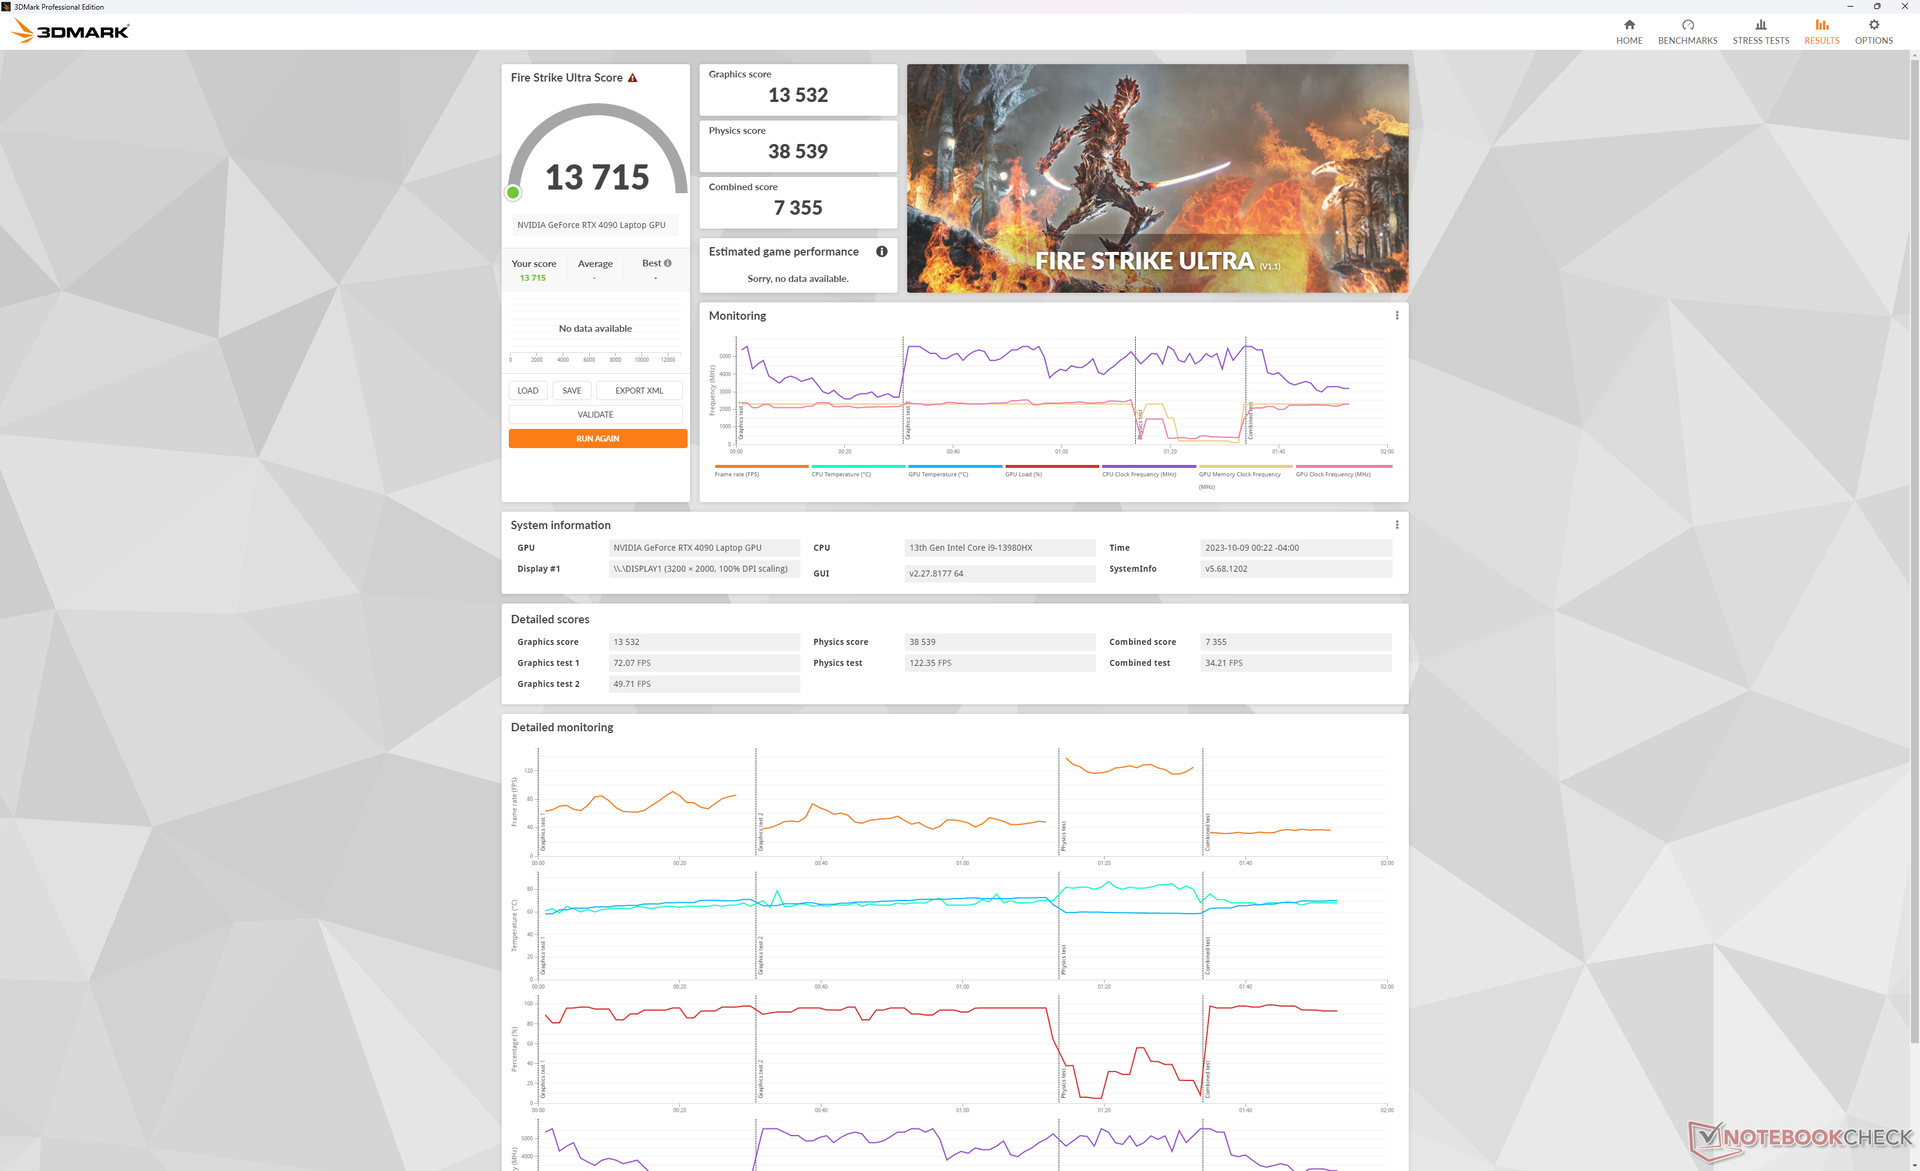
GPU Performance — 175 W TGP Graphics
Our 175 W mobile GeForce RTX 4090 performs within just 1 to 2 percentage points of the average laptop in our database with the same GPU. Results are impressive considering how large some RTX 4090 laptops can be such as the MSI Raider GE78 HX 13VI.
When looking at the bigger picture, the mobile RTX 4090 is about 40 percent slower than a "proper" desktop RTX 4090. In fact, it offers only modest benefits of just 5 to 10 percent over the mobile RTX 4080 configuration.
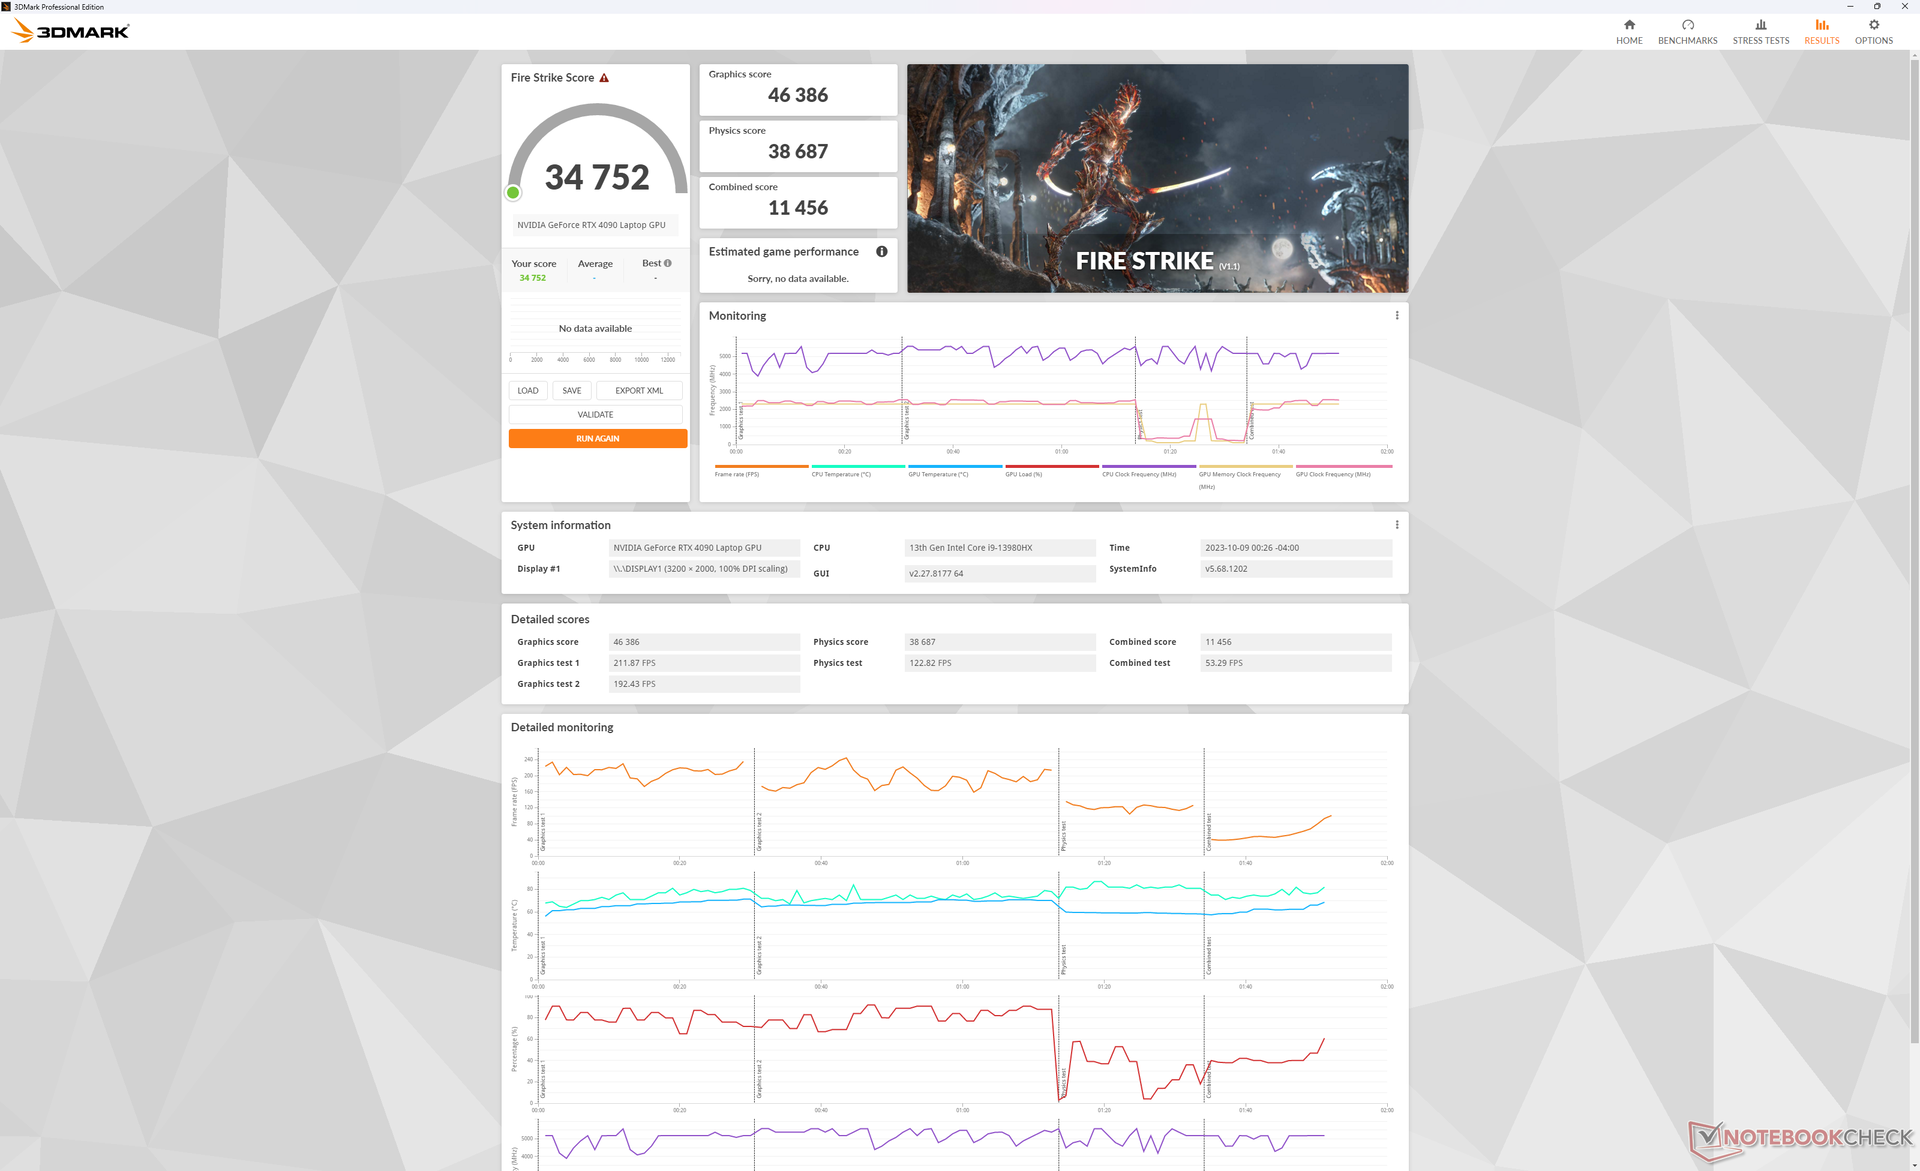
Running on the Balanced power profile with overclocking turned off would reduce graphics performance by about 17 percent according to our Fire Strike results table below.
| Power Profile | Graphics Score | Physics Score | Combined Score |
| Performance Mode | 46386 | 38687 | 11456 |
| Balanced Mode (w/ GPU Overclock off) | 38285 (-17%) | 39020 (-0%) | 12715 (-0%) |
| Battery Power | 22176 (-52%) | 21072 (-46%) | 6306 (-45%) |
| 3DMark Performance Rating - Percent | |
| AMD Ryzen 9 7950X3D | |
| NVIDIA GeForce RTX 4080 Founders Edition | |
| Lenovo Legion 9 16IRX8 | |
| Average NVIDIA GeForce RTX 4090 Laptop GPU | |
| Alienware m16 R1 AMD | |
| Lenovo Legion 7 16IAX7-82TD004SGE -2! | |
| HP Omen Transcend 16 | |
| MSI Raider GE68HX 13VF | |
| HP Omen 16-b1090ng -1! | |
| Acer Predator Helios Neo 16 NH.QLTEG.002 -2! | |
| Dell G16 7620 -1! | |
| 3DMark 11 - 1280x720 Performance GPU | |
| AMD Ryzen 9 7950X3D | |
| NVIDIA GeForce RTX 4080 Founders Edition | |
| Average NVIDIA GeForce RTX 4090 Laptop GPU (56764 - 73027, n=25) | |
| Lenovo Legion 9 16IRX8 | |
| Alienware m16 R1 AMD | |
| Lenovo Legion 7 16IAX7-82TD004SGE | |
| HP Omen Transcend 16 | |
| MSI Raider GE68HX 13VF | |
| HP Omen 16-b1090ng | |
| Acer Predator Helios Neo 16 NH.QLTEG.002 | |
| Dell G16 7620 | |
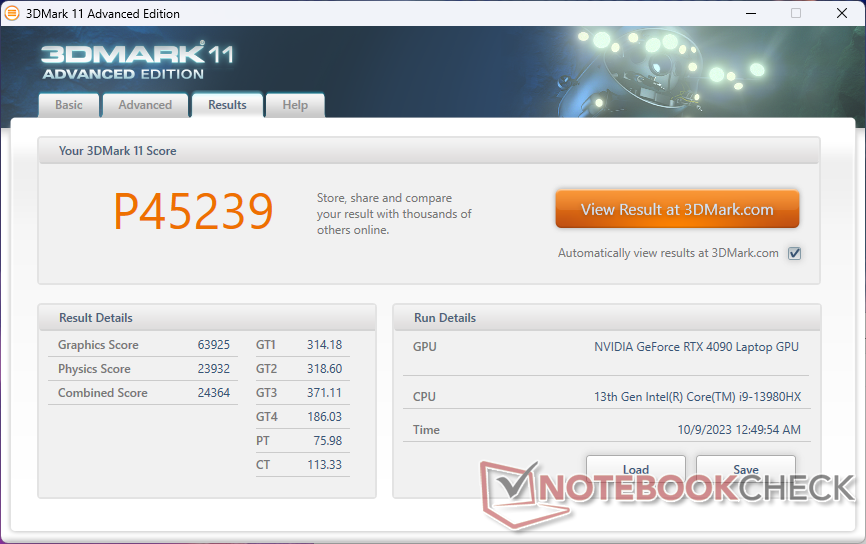
| 3DMark 11 Performance | 45239 points | |
| 3DMark Fire Strike Score | 34752 points | |
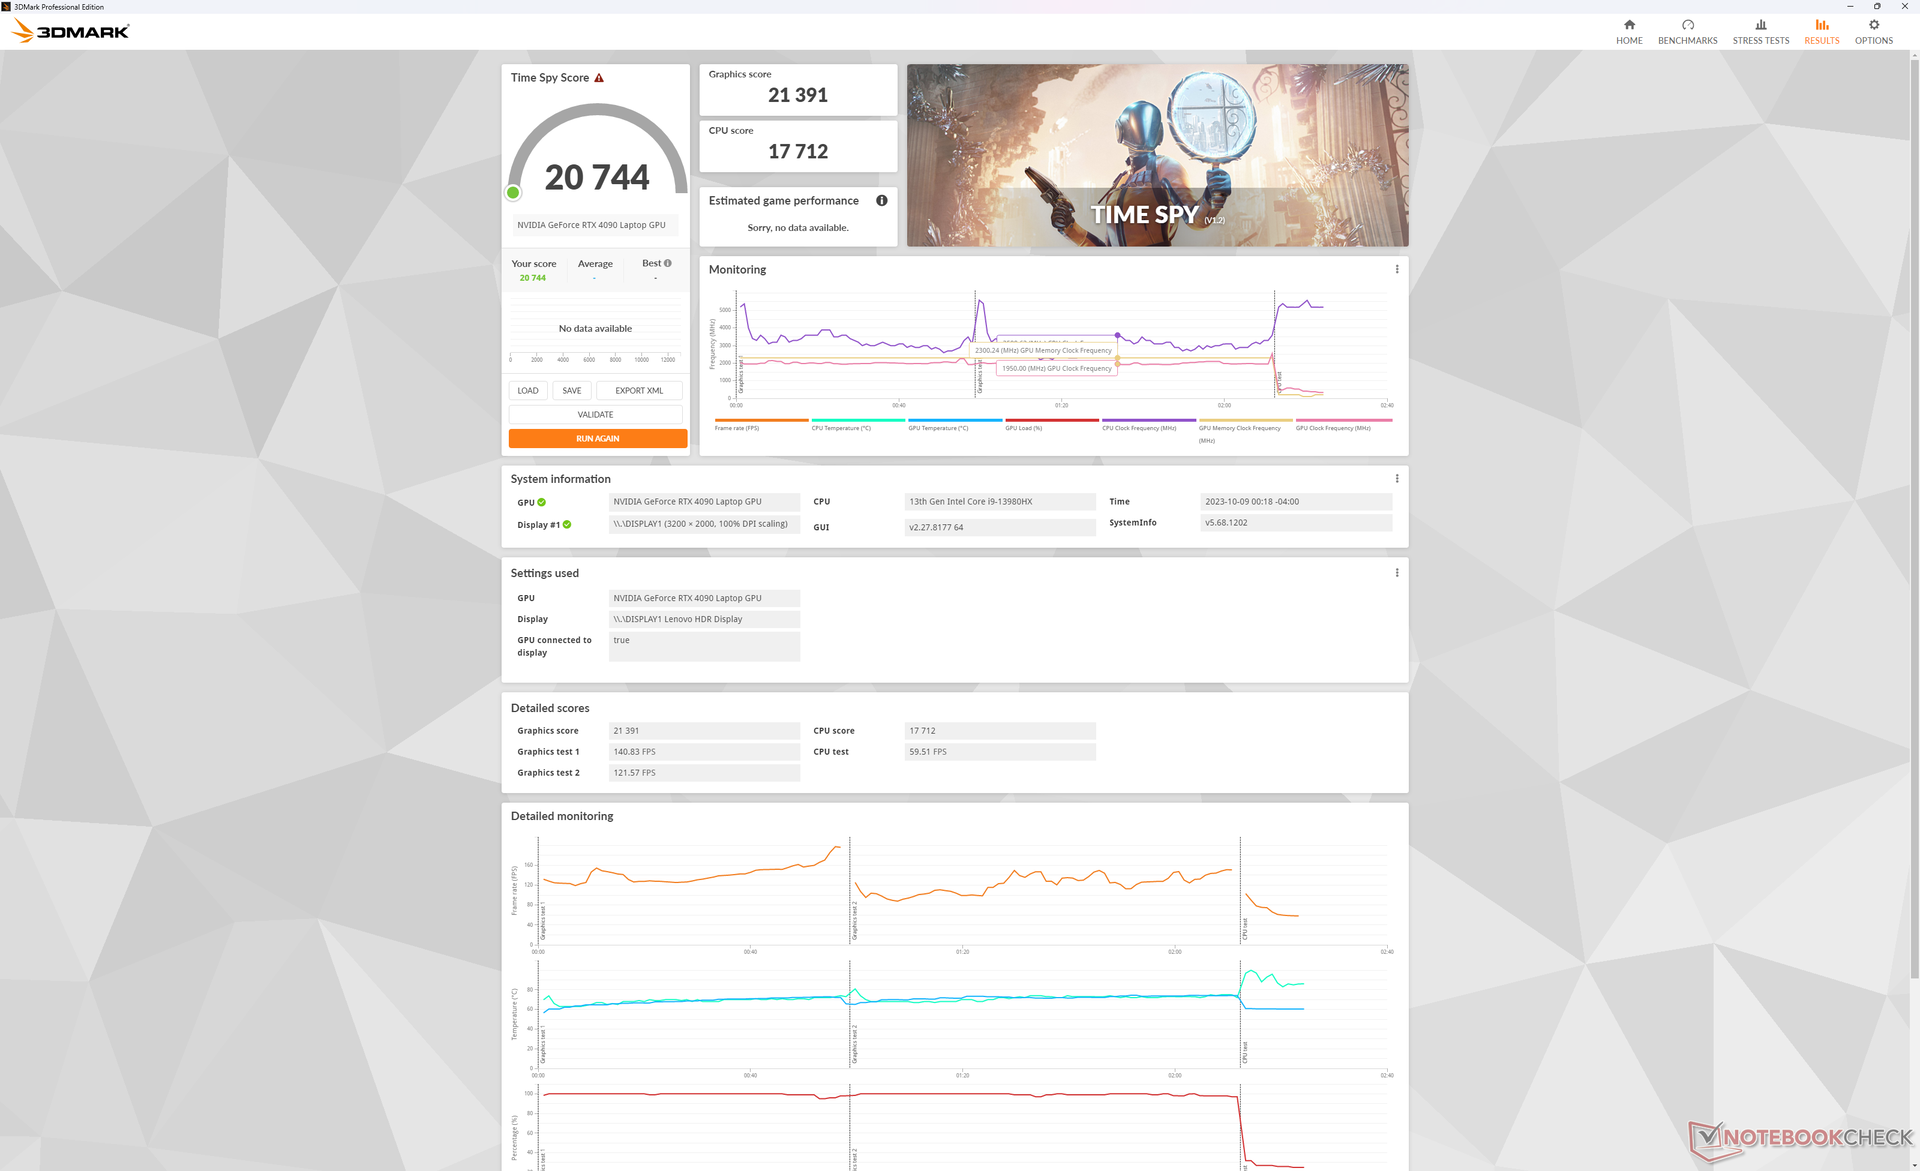
| 3DMark Time Spy Score | 20744 points | |
Help | ||
| Blender | |
| v3.3 Classroom OPTIX/RTX | |
| Dell G16 7620 | |
| Acer Predator Helios Neo 16 NH.QLTEG.002 | |
| Lenovo Legion 7 16IAX7-82TD004SGE | |
| MSI Raider GE68HX 13VF | |
| HP Omen Transcend 16 | |
| Alienware m16 R1 AMD | |
| Average NVIDIA GeForce RTX 4090 Laptop GPU (9 - 15, n=22) | |
| NVIDIA GeForce RTX 4080 Founders Edition | |
| Lenovo Legion 9 16IRX8 | |
| AMD Ryzen 9 7950X3D | |
| v3.3 Classroom CUDA | |
| Acer Predator Helios Neo 16 NH.QLTEG.002 | |
| Dell G16 7620 | |
| MSI Raider GE68HX 13VF | |
| Lenovo Legion 7 16IAX7-82TD004SGE | |
| HP Omen Transcend 16 | |
| Alienware m16 R1 AMD | |
| Average NVIDIA GeForce RTX 4090 Laptop GPU (16 - 23, n=23) | |
| Lenovo Legion 9 16IRX8 | |
| AMD Ryzen 9 7950X3D | |
| v3.3 Classroom CPU | |
| Acer Predator Helios Neo 16 NH.QLTEG.002 | |
| Dell G16 7620 | |
| Lenovo Legion 7 16IAX7-82TD004SGE | |
| HP Omen Transcend 16 | |
| Average NVIDIA GeForce RTX 4090 Laptop GPU (144 - 287, n=23) | |
| Lenovo Legion 9 16IRX8 | |
| MSI Raider GE68HX 13VF | |
| Alienware m16 R1 AMD | |
| NVIDIA GeForce RTX 4080 Founders Edition | |
| AMD Ryzen 9 7950X3D | |
* ... smaller is better
Gaming Performance
All games run very well on QHD or higher including demanding titles like Cyberpunk 2077 or Ratchet and Clank. Note that G-Sync can only be enabled if set to dGPU mode as it is otherwise disabled if on Hybrid or integrated graphics modes.
| Ratchet & Clank Rift Apart | |
| 1920x1080 Low Preset | |
| Lenovo Legion 9 16IRX8 | |
| Average NVIDIA GeForce RTX 4090 Laptop GPU | |
| MSI Raider GE68HX 13VF | |
| 1920x1080 Medium Preset AA:T | |
| Average NVIDIA GeForce RTX 4090 Laptop GPU (155.6 - 161.8, n=2) | |
| Lenovo Legion 9 16IRX8 | |
| MSI Raider GE68HX 13VF | |
| 1920x1080 High Preset AA:T | |
| Average NVIDIA GeForce RTX 4090 Laptop GPU (135.4 - 136.6, n=2) | |
| Lenovo Legion 9 16IRX8 | |
| MSI Raider GE68HX 13VF | |
| 1920x1080 Very High Preset AA:T | |
| Average NVIDIA GeForce RTX 4090 Laptop GPU (111.1 - 115.4, n=2) | |
| Lenovo Legion 9 16IRX8 | |
| MSI Raider GE68HX 13VF | |
| 2560x1440 Very High Preset AA:T | |
| Average NVIDIA GeForce RTX 4090 Laptop GPU (98.7 - 107.1, n=2) | |
| Lenovo Legion 9 16IRX8 | |
Witcher 3 FPS Chart
| low | med. | high | ultra | QHD | |
| GTA V (2015) | 187.1 | 186.3 | 184.8 | 150.7 | 145.3 |
| The Witcher 3 (2015) | 671.8 | 569 | 408.2 | 208.7 | 165 |
| Dota 2 Reborn (2015) | 244 | 217 | 208 | 193.1 | |
| Final Fantasy XV Benchmark (2018) | 231 | 207 | 181.3 | 158.4 | |
| X-Plane 11.11 (2018) | 214 | 185.9 | 140.1 | ||
| Far Cry 5 (2018) | 195 | 176 | 167 | 158 | 157 |
| Strange Brigade (2018) | 487 | 409 | 390 | 387 | 312 |
| Cyberpunk 2077 1.6 (2022) | 146.9 | 142.9 | 129.5 | 131.4 | 98.8 |
| Tiny Tina's Wonderlands (2022) | 377.6 | 290.4 | 226.2 | 186.4 | 137.8 |
| F1 22 (2022) | 336 | 333 | 286 | 130.8 | 90.9 |
| Ratchet & Clank Rift Apart (2023) | 163.4 | 155.6 | 135.4 | 111.1 | 98.7 |
Emissions
System Noise
The fans almost never idle and so some noise should always be expected. They tend to hover around 30.4 dB(A) against a silent background of 23.7 dB(A) when under most common loads like web browsing or video streaming even when set to Quiet mode. This range is typical of most other gaming laptops under similar conditions, but the Legion 9i 16 doesn't pulse as frequently provided that you're running on Balanced iGPU mode or lower.
Fan noise ramps up significantly up to 52.2 dB(A) when gaming on Performance mode which is the expected range for high-end gaming laptops. The noise would drop slightly to 49.5 dB(A) if gaming on Balanced mode instead, but keep in mind the 17 percent graphics deficit when compared to Performance mode as noted above. Headphones when gaming are recommended in either case.
Noise Level
| Idle |
| 24 / 24 / 30.4 dB(A) |
| Load |
| 30.4 / 54.9 dB(A) |
 | ||
30 dB silent 40 dB(A) audible 50 dB(A) loud |
||
min: | ||
| Lenovo Legion 9 16IRX8 NVIDIA GeForce RTX 4090 Laptop GPU, i9-13980HX, 2x SK Hynix HFS001TEJ9X115N (RAID 0) | Lenovo Legion Slim 5 16APH8 NVIDIA GeForce RTX 4060 Laptop GPU, R7 7840HS, SK hynix PC801 HFS512GEJ9X115N | Razer Blade 16 Early 2023 RTX 4090 NVIDIA GeForce RTX 4090 Laptop GPU, i9-13950HX, SSSTC CA6-8D1024 | Asus ROG Strix G16 G614JZ NVIDIA GeForce RTX 4080 Laptop GPU, i9-13980HX, WD PC SN560 SDDPNQE-1T00 | HP Omen Transcend 16 NVIDIA GeForce RTX 4070 Laptop GPU, i9-13900HX, SK hynix PC801 HFS002TEJ9X101N | Alienware x16 R1 NVIDIA GeForce RTX 4080 Laptop GPU, i9-13900HK, SK hynix PC801 HFS001TEJ9X101N | |
|---|---|---|---|---|---|---|
| Noise | 1% | 3% | -11% | -13% | -1% | |
| off / environment * | 23.7 | 22.9 3% | 20.84 12% | 25 -5% | 22.9 3% | 22.7 4% |
| Idle Minimum * | 24 | 23.1 4% | 23.65 1% | 26 -8% | 29.1 -21% | 23.1 4% |
| Idle Average * | 24 | 23.1 4% | 23.65 1% | 28 -17% | 29.1 -21% | 25.8 -8% |
| Idle Maximum * | 30.4 | 27.7 9% | 23.65 22% | 30 1% | 29.1 4% | 25.8 15% |
| Load Average * | 30.4 | 33.3 -10% | 43.35 -43% | 48 -58% | 45.7 -50% | 39.3 -29% |
| Witcher 3 ultra * | 52.2 | 54 -3% | 46.7 11% | 49 6% | 54.3 -4% | 49.9 4% |
| Load Maximum * | 54.9 | 54 2% | 46.72 15% | 52 5% | 54.3 1% | 54.8 -0% |
* ... smaller is better
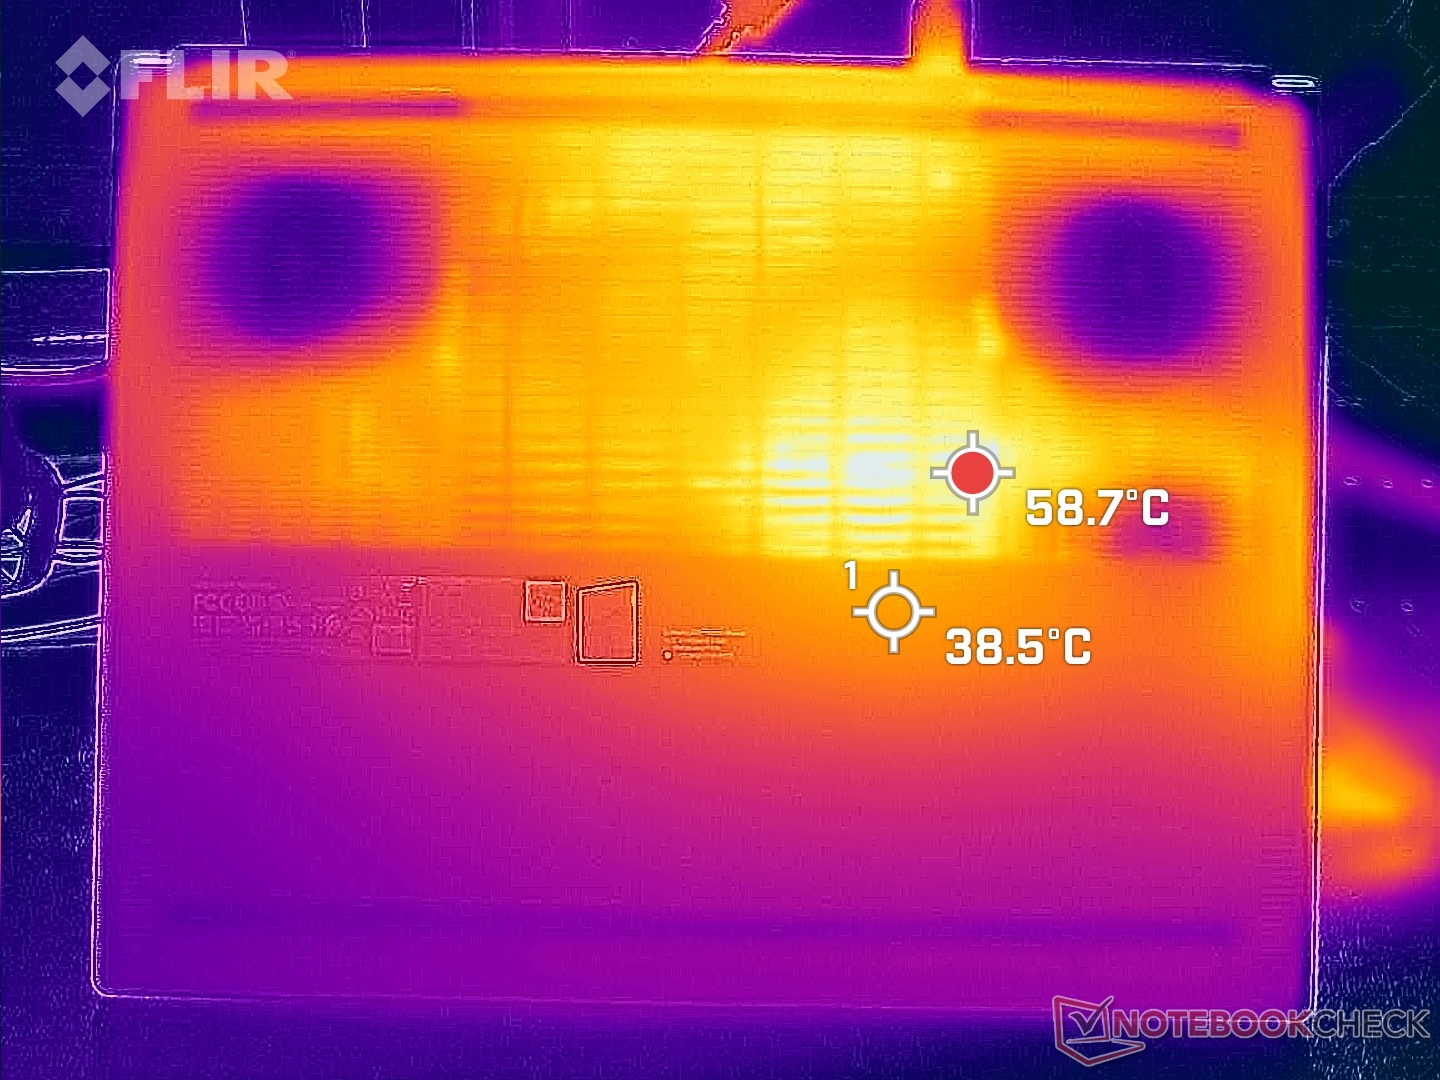
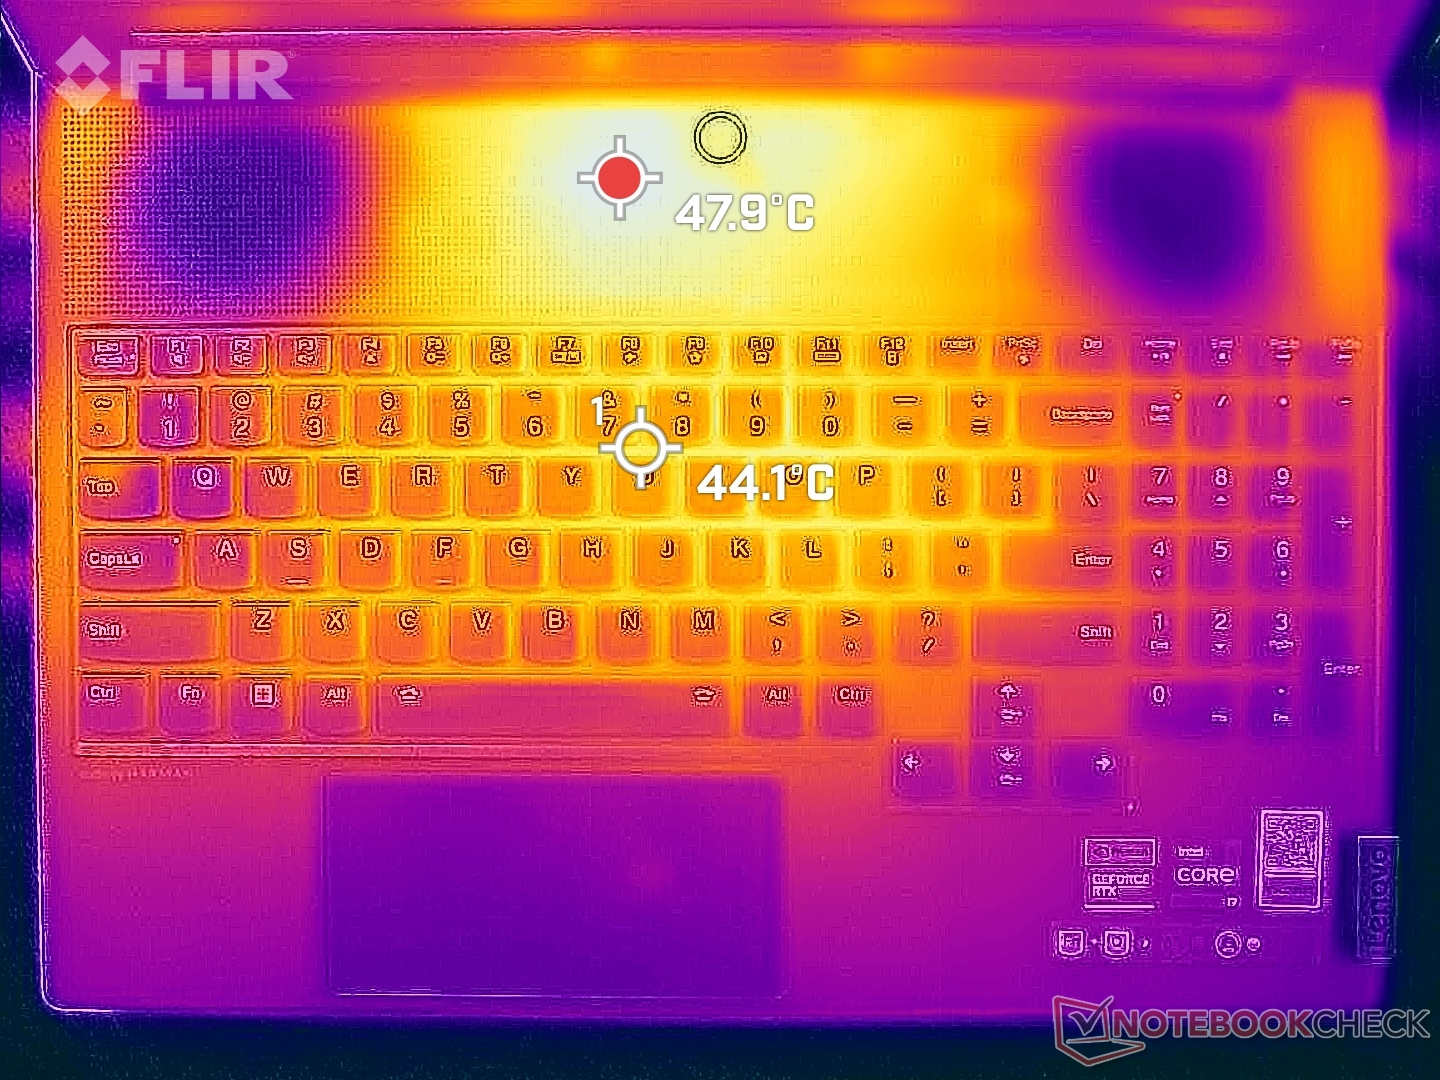
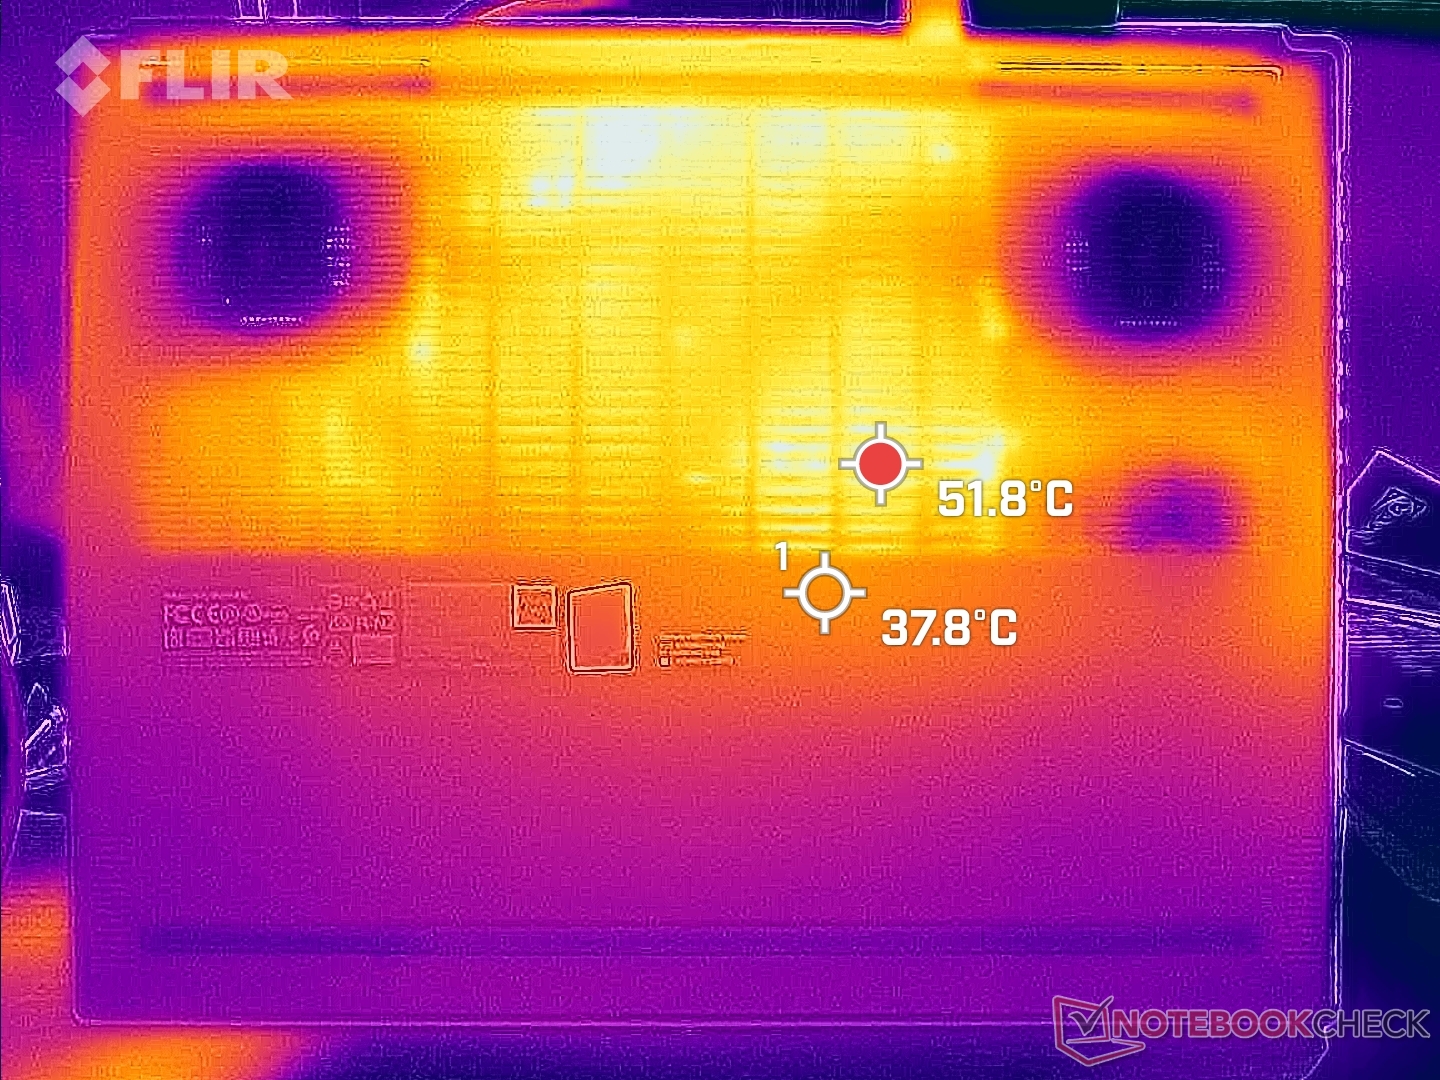
Temperature
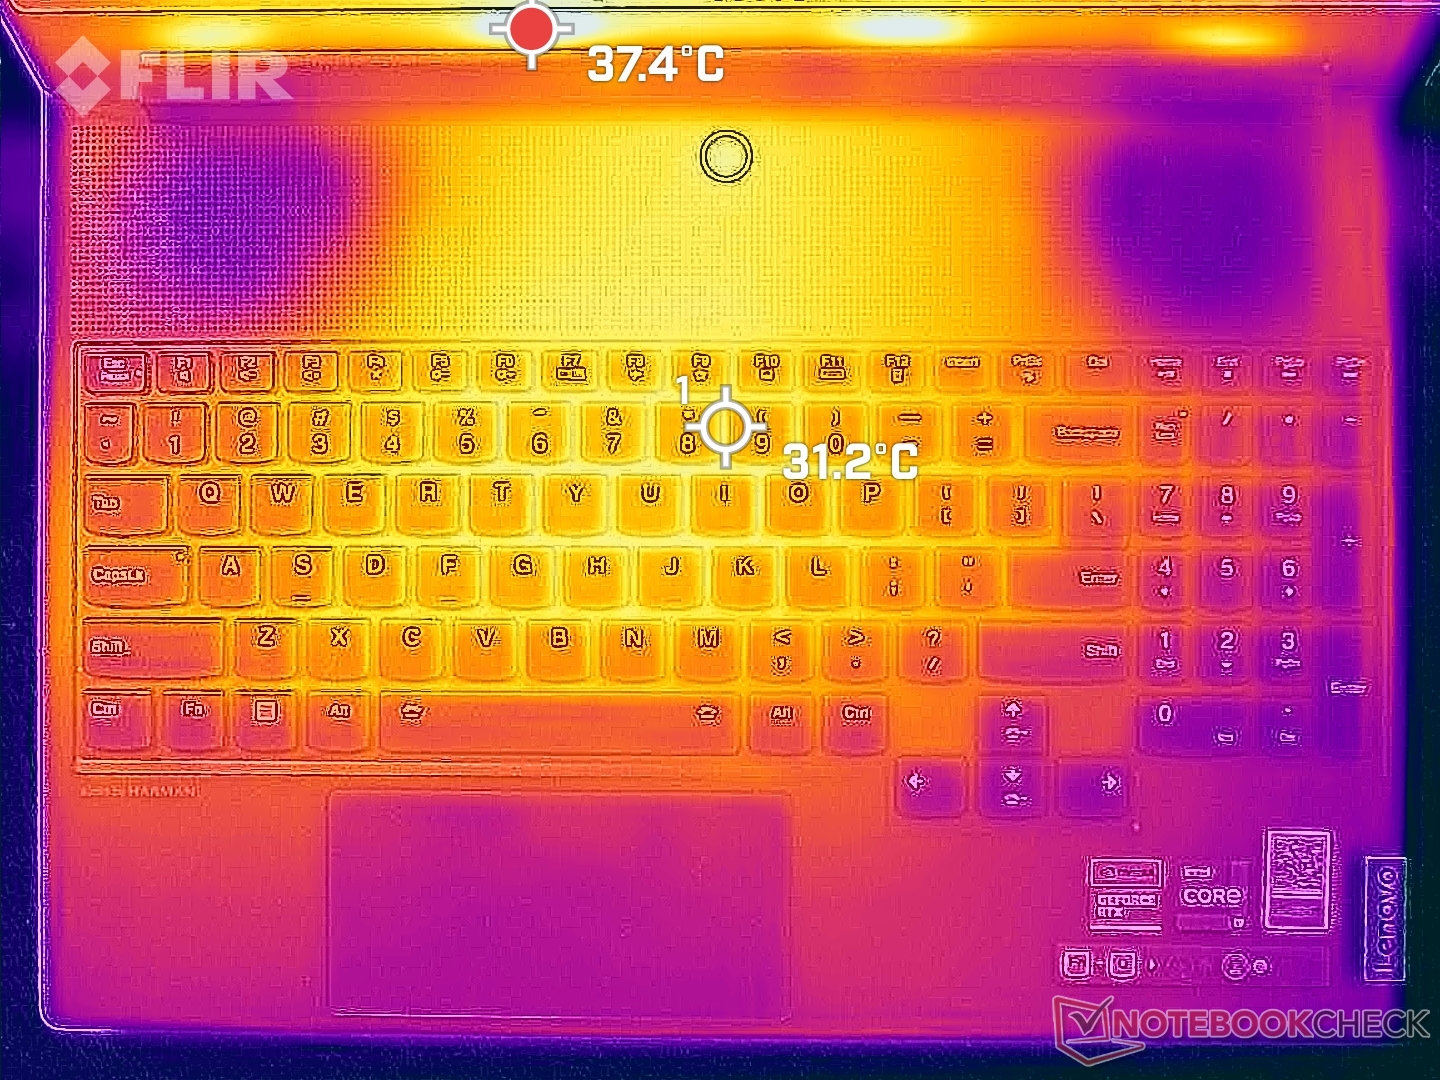
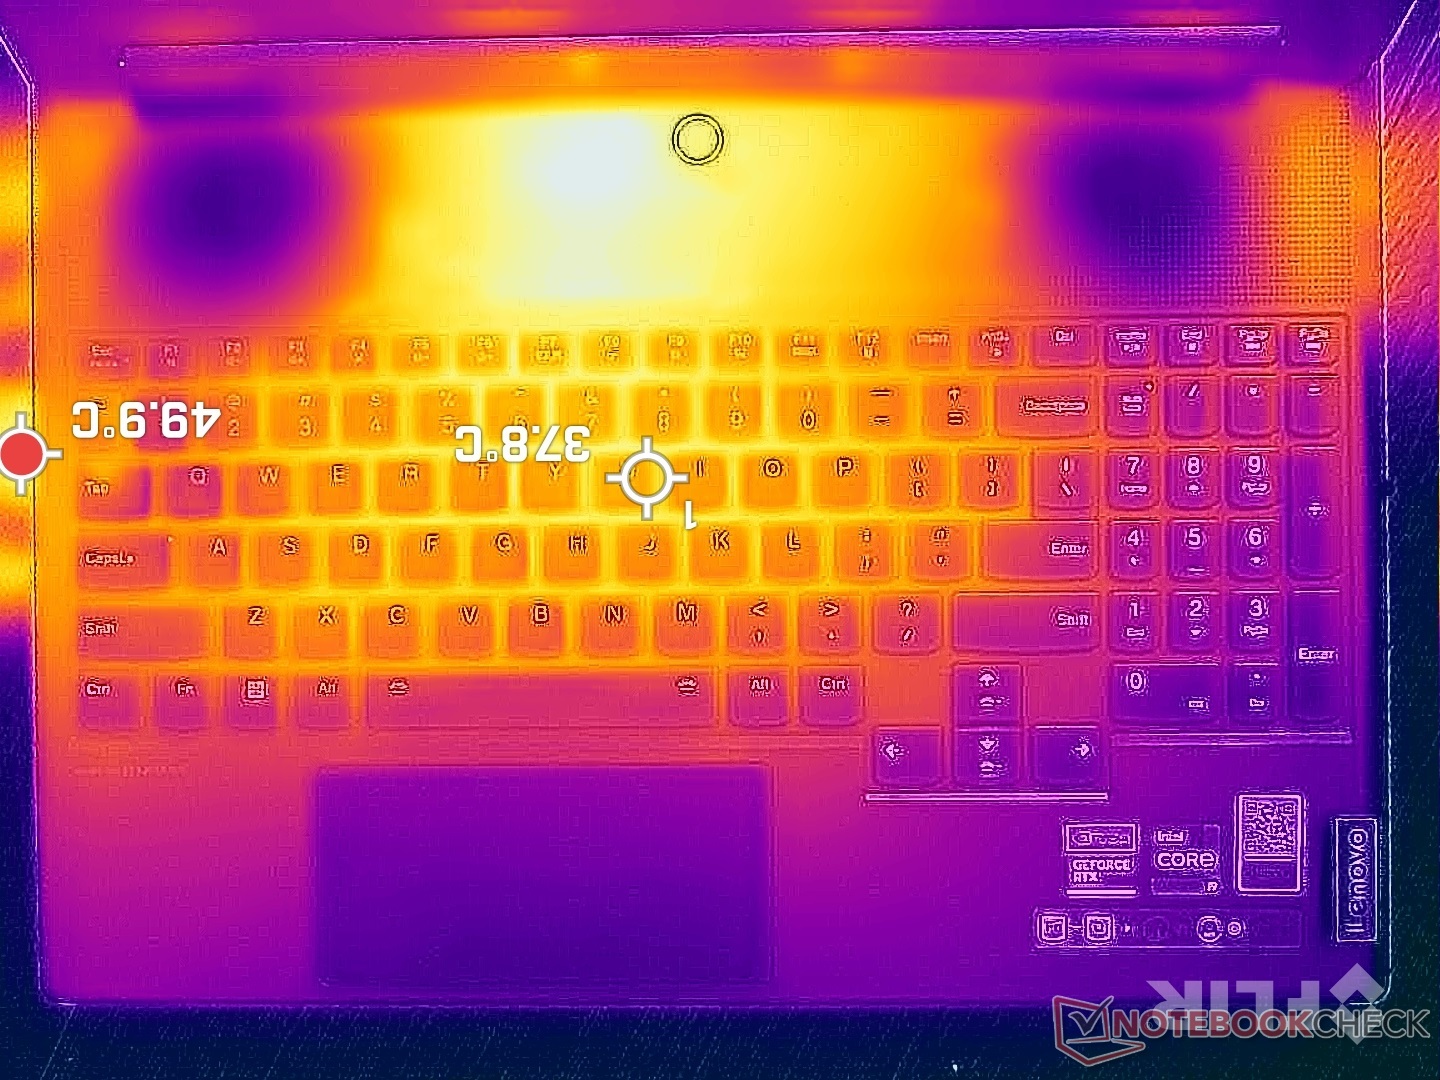
Surface temperatures are quite warm despite the advanced thermals. When gaming, the WASD keys and keyboard center can be as warm as 42 C and 46 C, respectively, which is slightly warmer than what we observed on the Alienware x16 R1. Many other gaming laptops like the Razer Blade 16 pull in fresh air from the WASD keys to keep that portion of the keyboard cool for more comfortable gaming, but this is not the case for our Legion 9 16 design as shown by the temperature maps below.
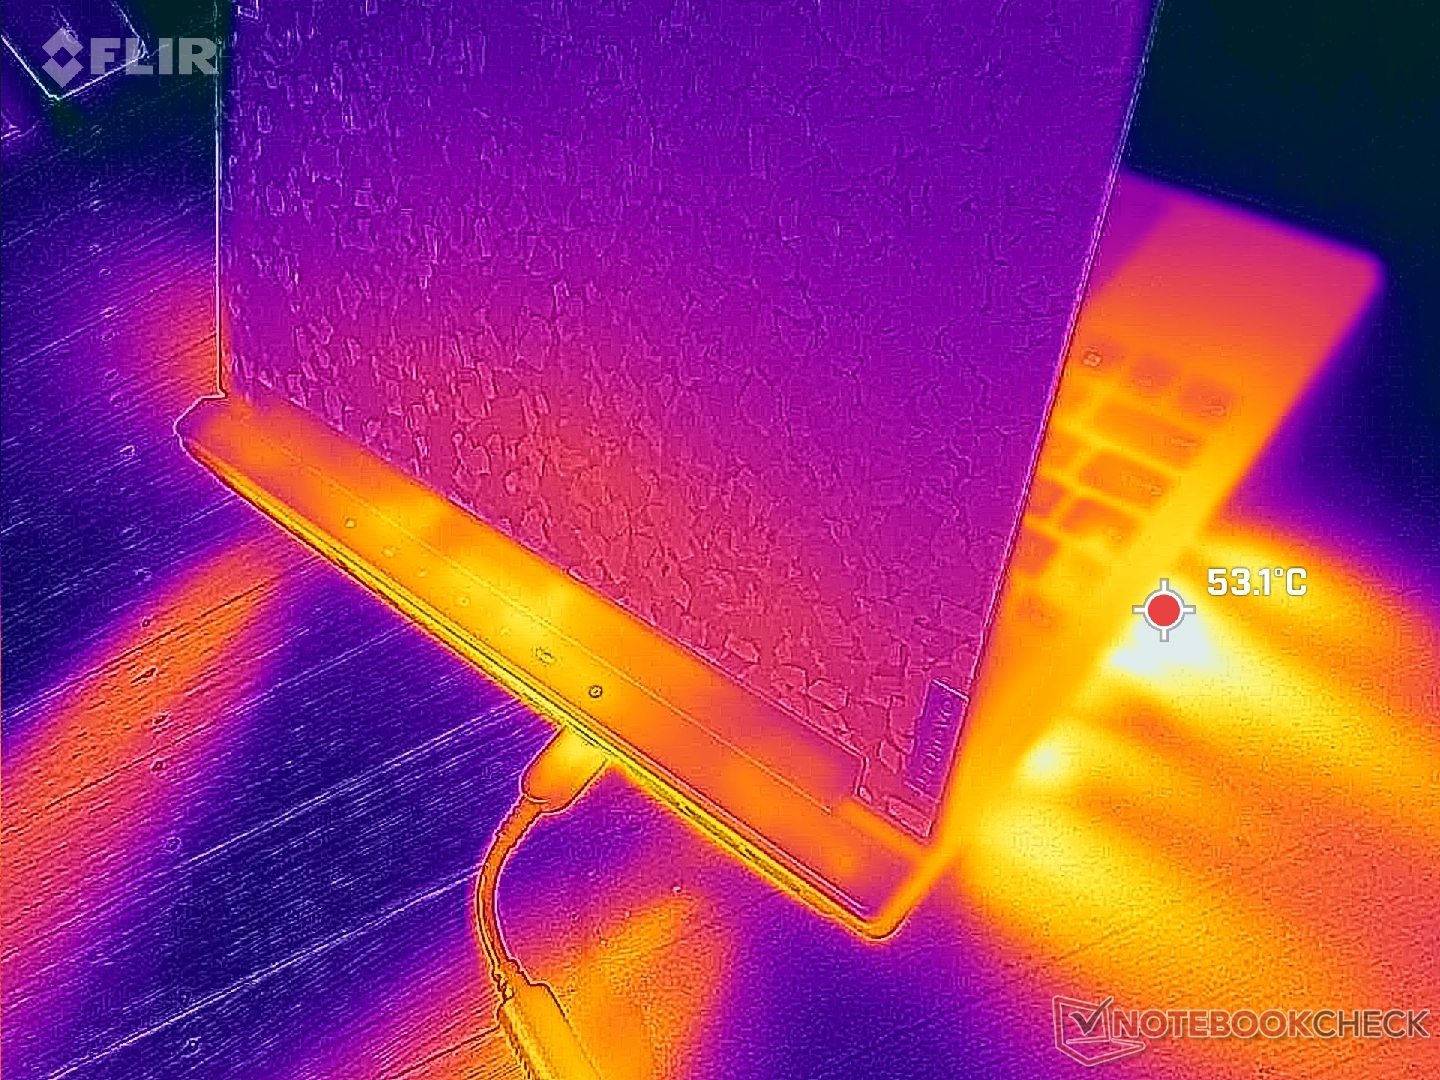
(-) The maximum temperature on the upper side is 49.6 °C / 121 F, compared to the average of 40.4 °C / 105 F, ranging from 21.2 to 68.8 °C for the class Gaming.
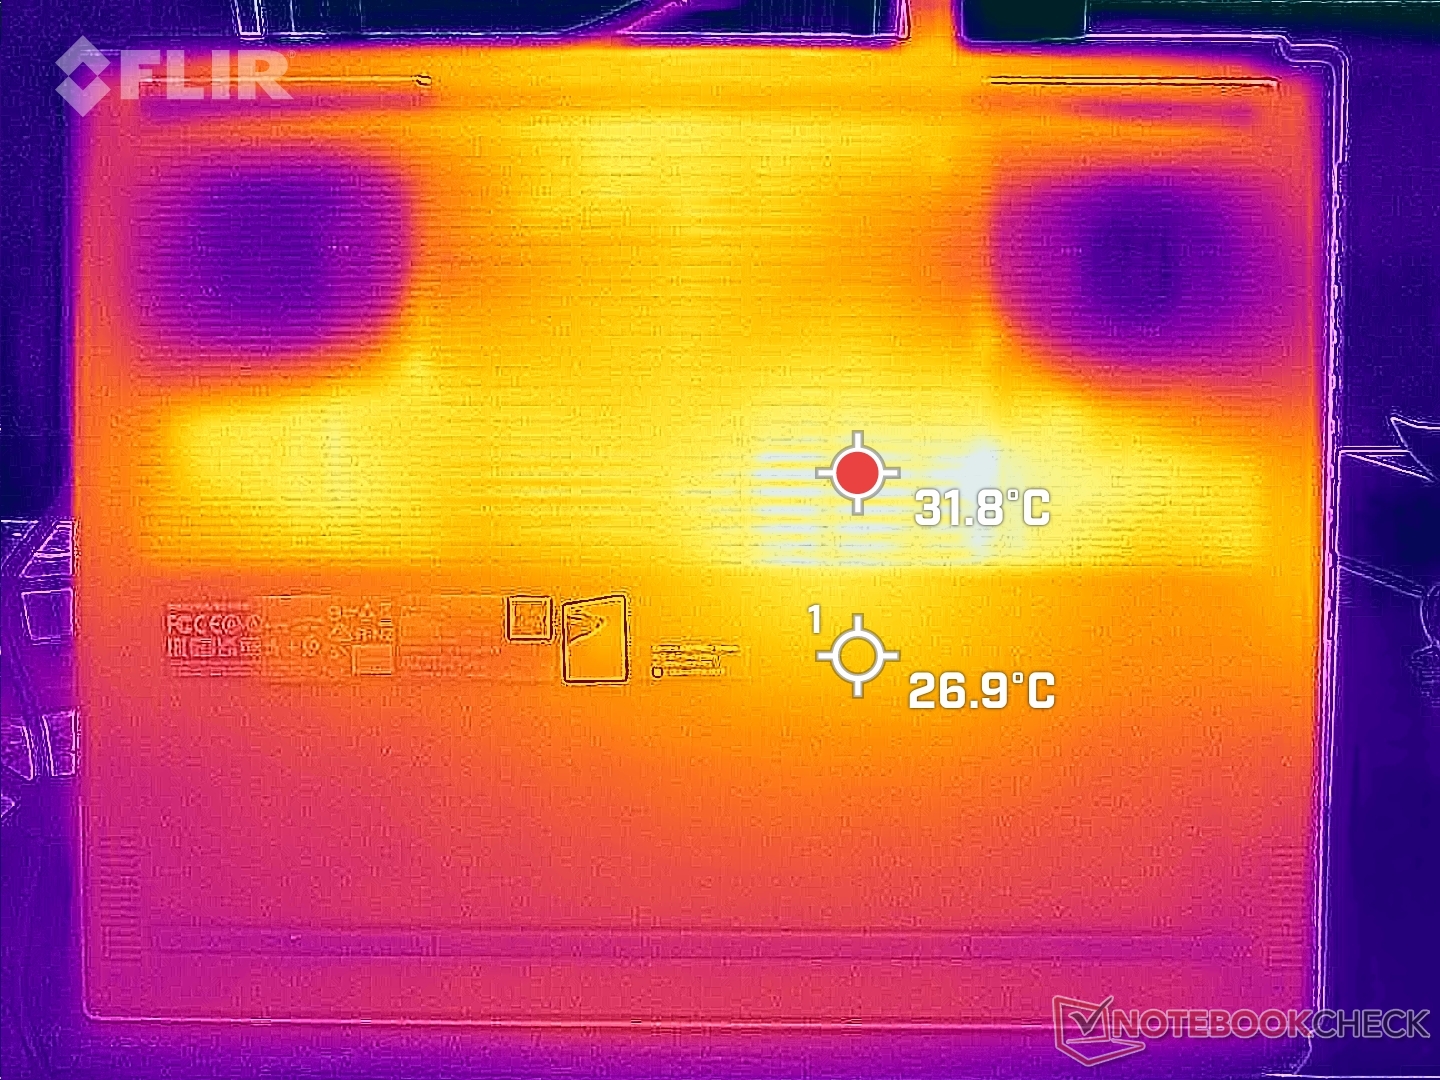
(-) The bottom heats up to a maximum of 48.6 °C / 119 F, compared to the average of 43.3 °C / 110 F
(+) In idle usage, the average temperature for the upper side is 30 °C / 86 F, compared to the device average of 33.9 °C / 93 F.
(-) Playing The Witcher 3, the average temperature for the upper side is 38.1 °C / 101 F, compared to the device average of 33.9 °C / 93 F.
(+) The palmrests and touchpad are reaching skin temperature as a maximum (33.6 °C / 92.5 F) and are therefore not hot.
(-) The average temperature of the palmrest area of similar devices was 29 °C / 84.2 F (-4.6 °C / -8.3 F).
| Lenovo Legion 9 16IRX8 Intel Core i9-13980HX, NVIDIA GeForce RTX 4090 Laptop GPU | Lenovo Legion Slim 5 16APH8 AMD Ryzen 7 7840HS, NVIDIA GeForce RTX 4060 Laptop GPU | Razer Blade 16 Early 2023 RTX 4090 Intel Core i9-13950HX, NVIDIA GeForce RTX 4090 Laptop GPU | Asus ROG Strix G16 G614JZ Intel Core i9-13980HX, NVIDIA GeForce RTX 4080 Laptop GPU | HP Omen Transcend 16 Intel Core i9-13900HX, NVIDIA GeForce RTX 4070 Laptop GPU | Alienware x16 R1 Intel Core i9-13900HK, NVIDIA GeForce RTX 4080 Laptop GPU | |
|---|---|---|---|---|---|---|
| Heat | 18% | 2% | -1% | 5% | -2% | |
| Maximum Upper Side * | 49.6 | 40.6 18% | 52 -5% | 54 -9% | 47.4 4% | 47.2 5% |
| Maximum Bottom * | 48.6 | 42 14% | 47.6 2% | 55 -13% | 54.4 -12% | 47.8 2% |
| Idle Upper Side * | 33.2 | 27.8 16% | 33 1% | 29 13% | 28.4 14% | 36.8 -11% |
| Idle Bottom * | 34.2 | 26.6 22% | 30.6 11% | 33 4% | 29.2 15% | 35.8 -5% |
* ... smaller is better
Stress Test
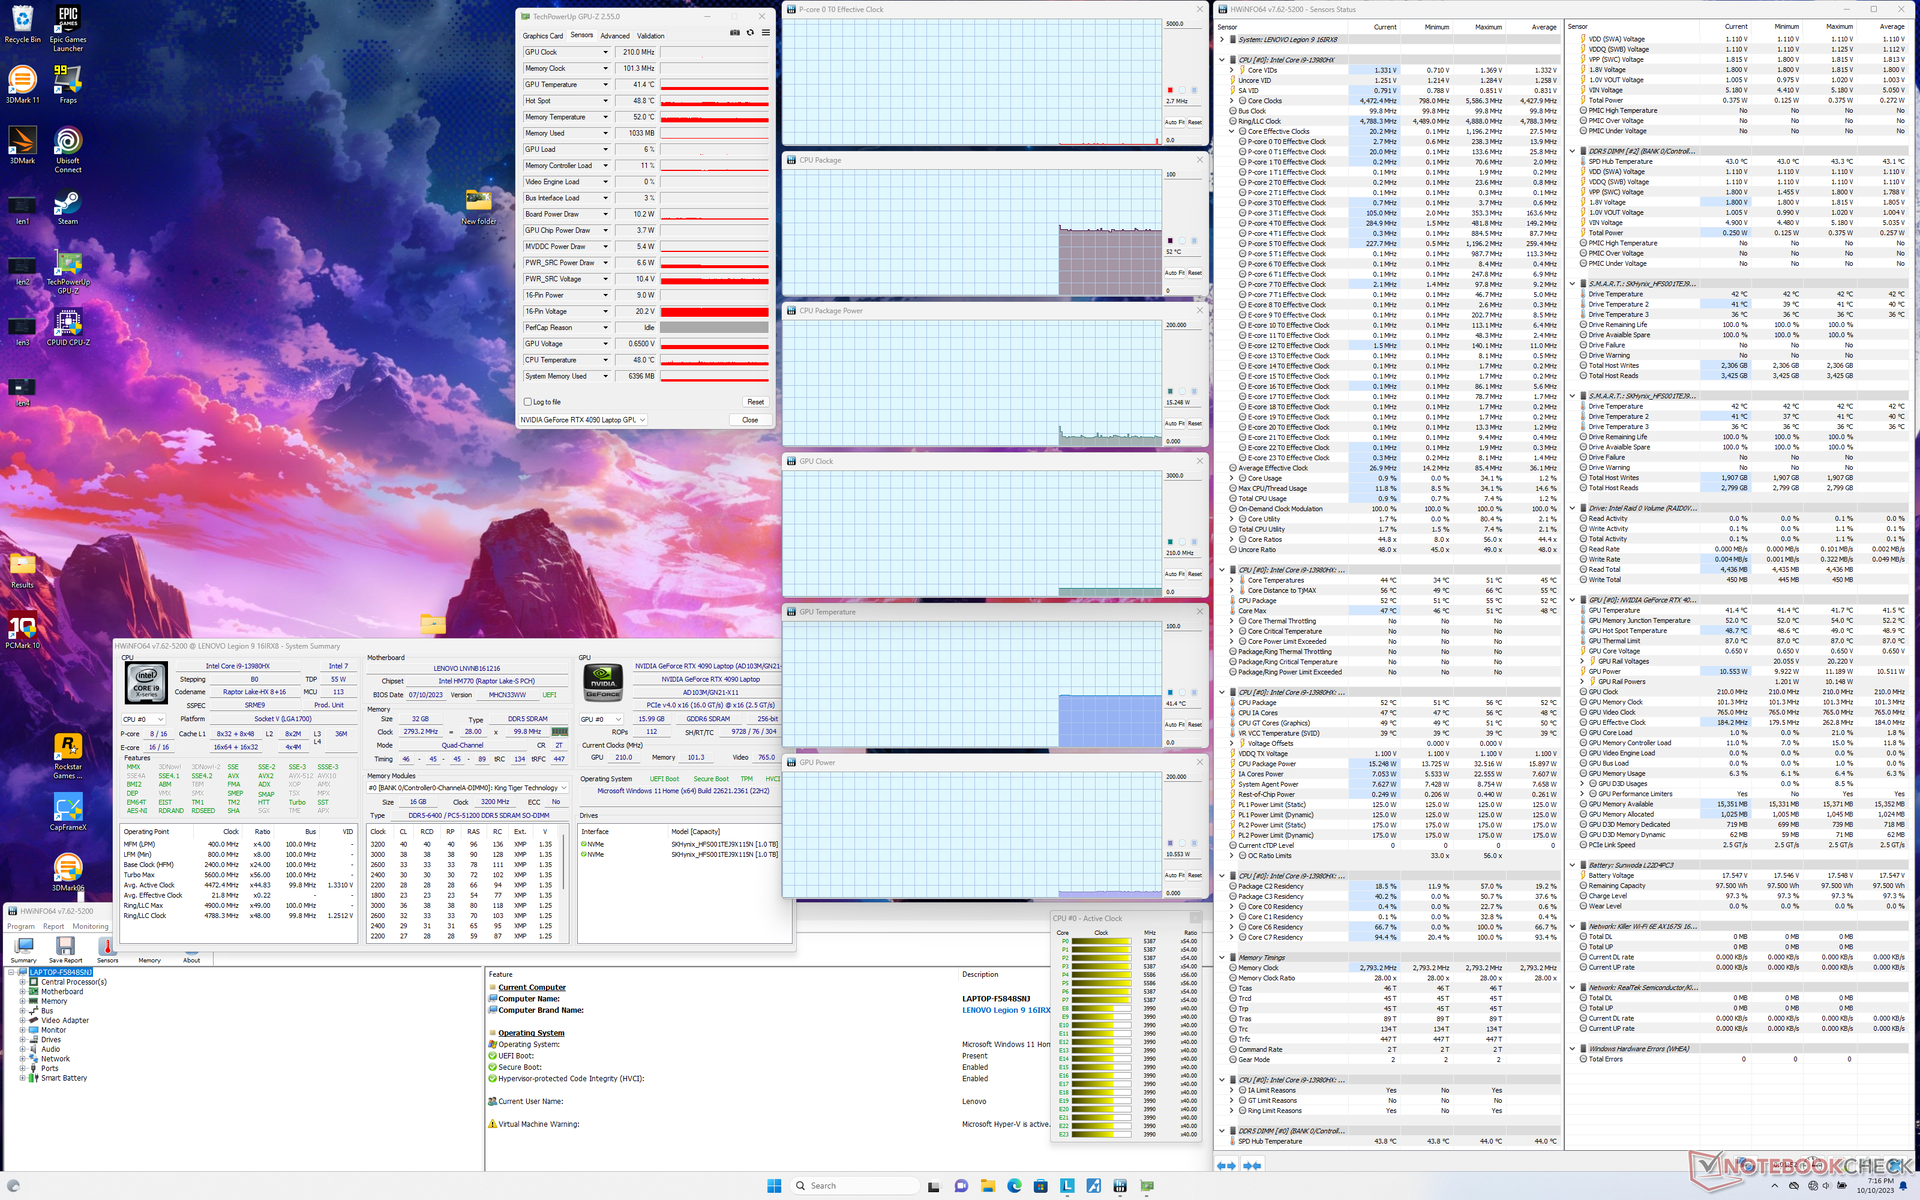
CPU clock rates and board power draw when initiating Prime95 stress would spike to 3.6 GHz and 138 W, respectively, before dropping and stabilizing at 3.0 GHz and 125 W after about a minute into the test. Core temperature would stabilize at 83 C compared to 100 C on the larger Alienware m18 R1 equipped with the exact same Core i9-13980HX.
GPU performance depends heavily on the power profile selected as mentioned above in the GPU Performance section. When running Witcher 3 on Performance mode, for example, the Nvidia GPU would stabilize at 2265 MHz and 160 W compared to just 1650 MHz and 104 W when on Balanced mode with GPU Overclock off. GPU temperature would stabilize at 78 C compared to 71 C on the Blade 16 with the same RTX 4090 GPU.
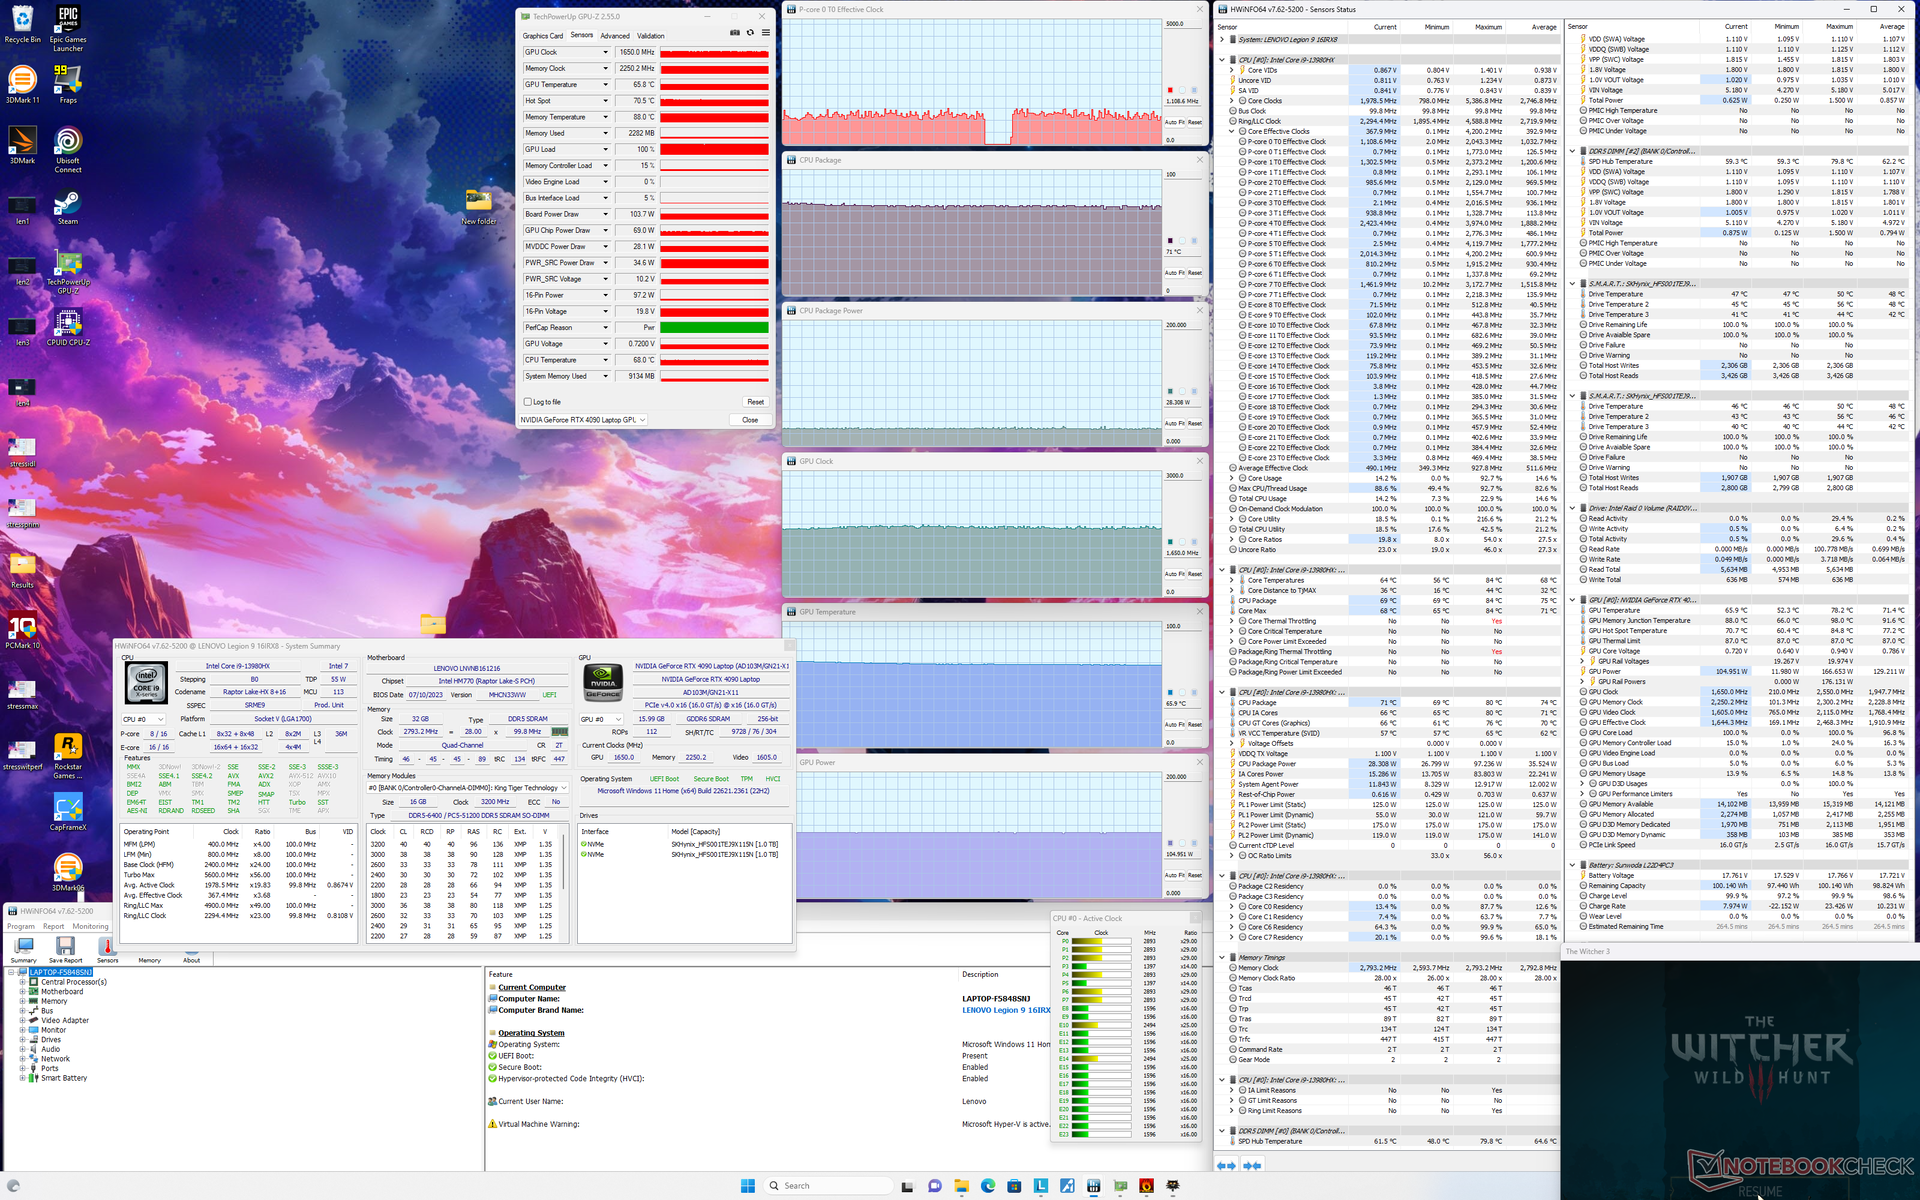
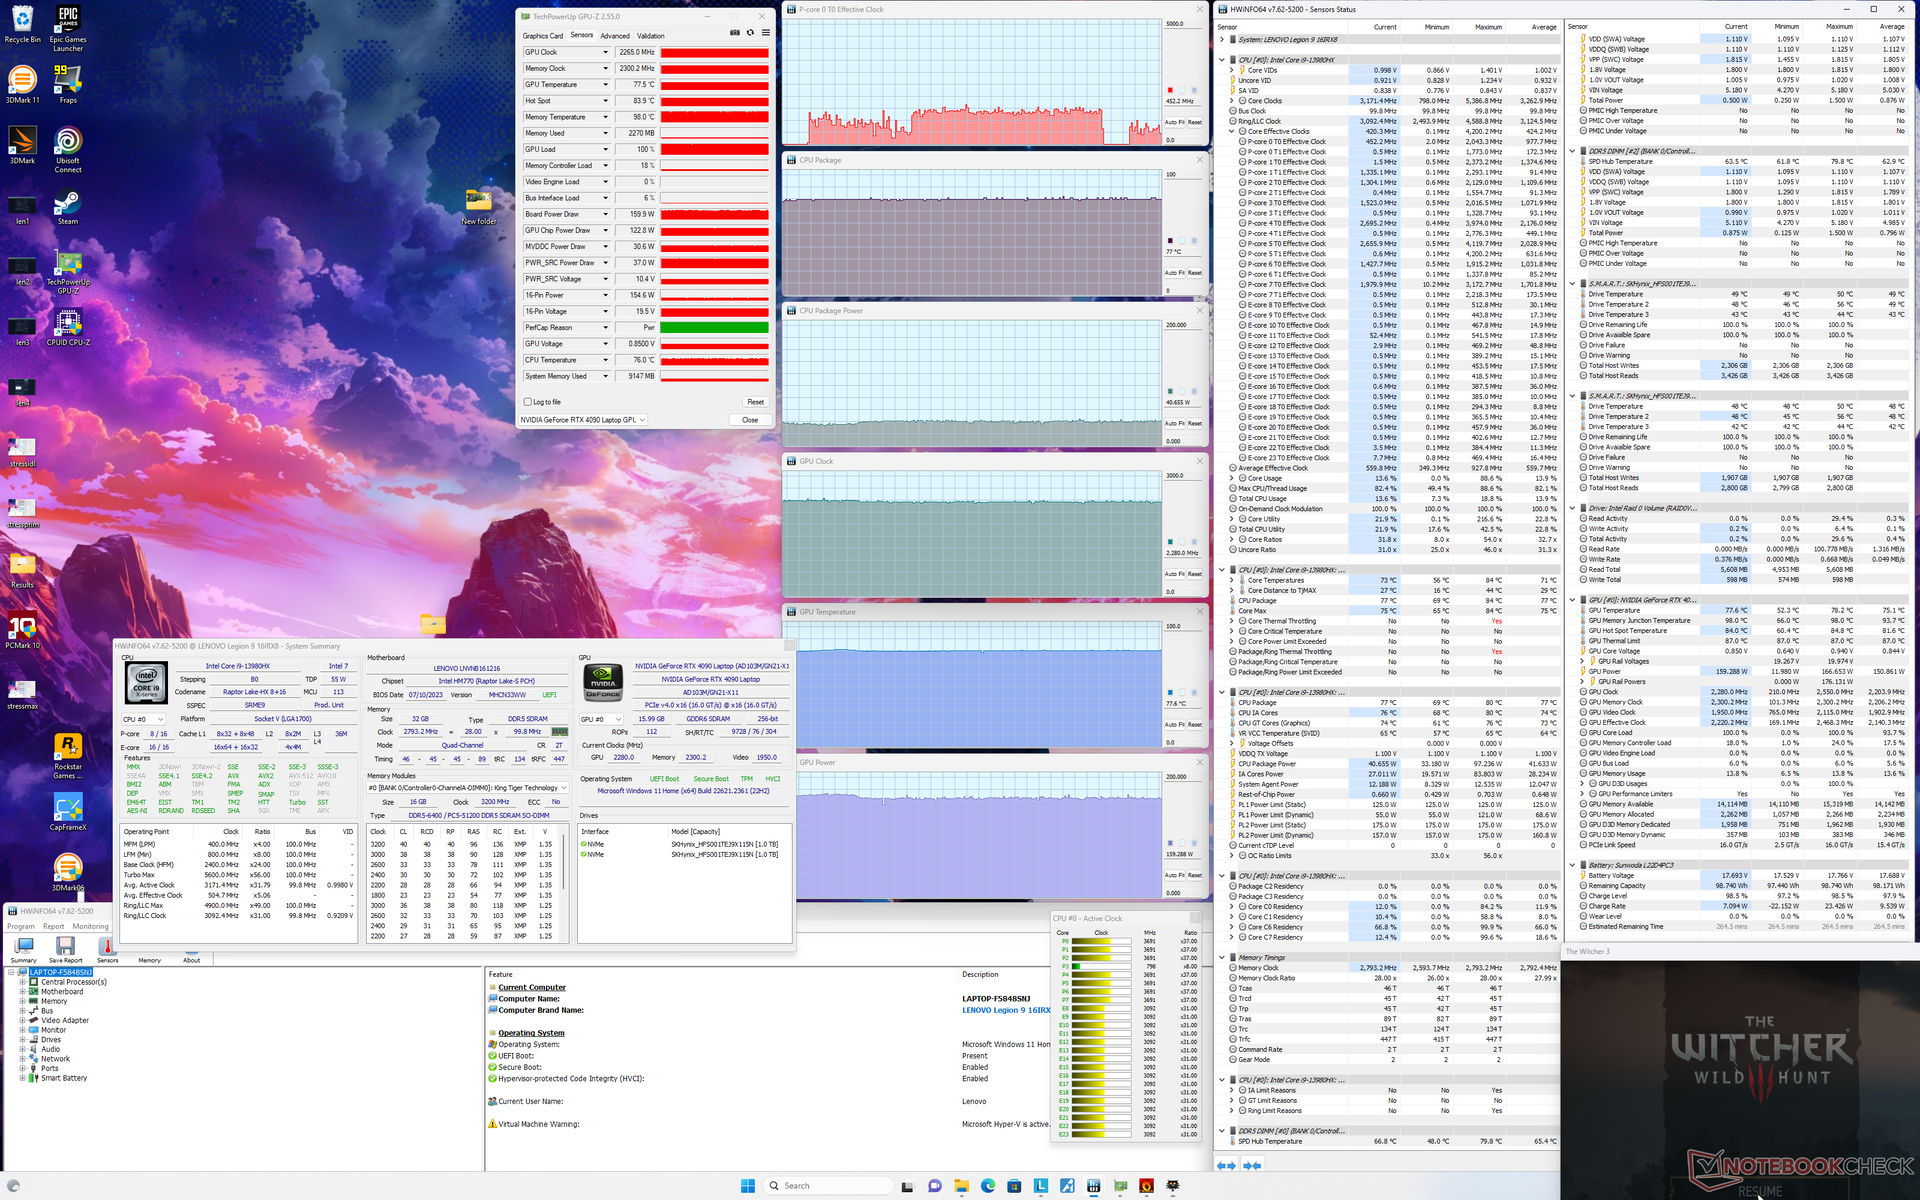
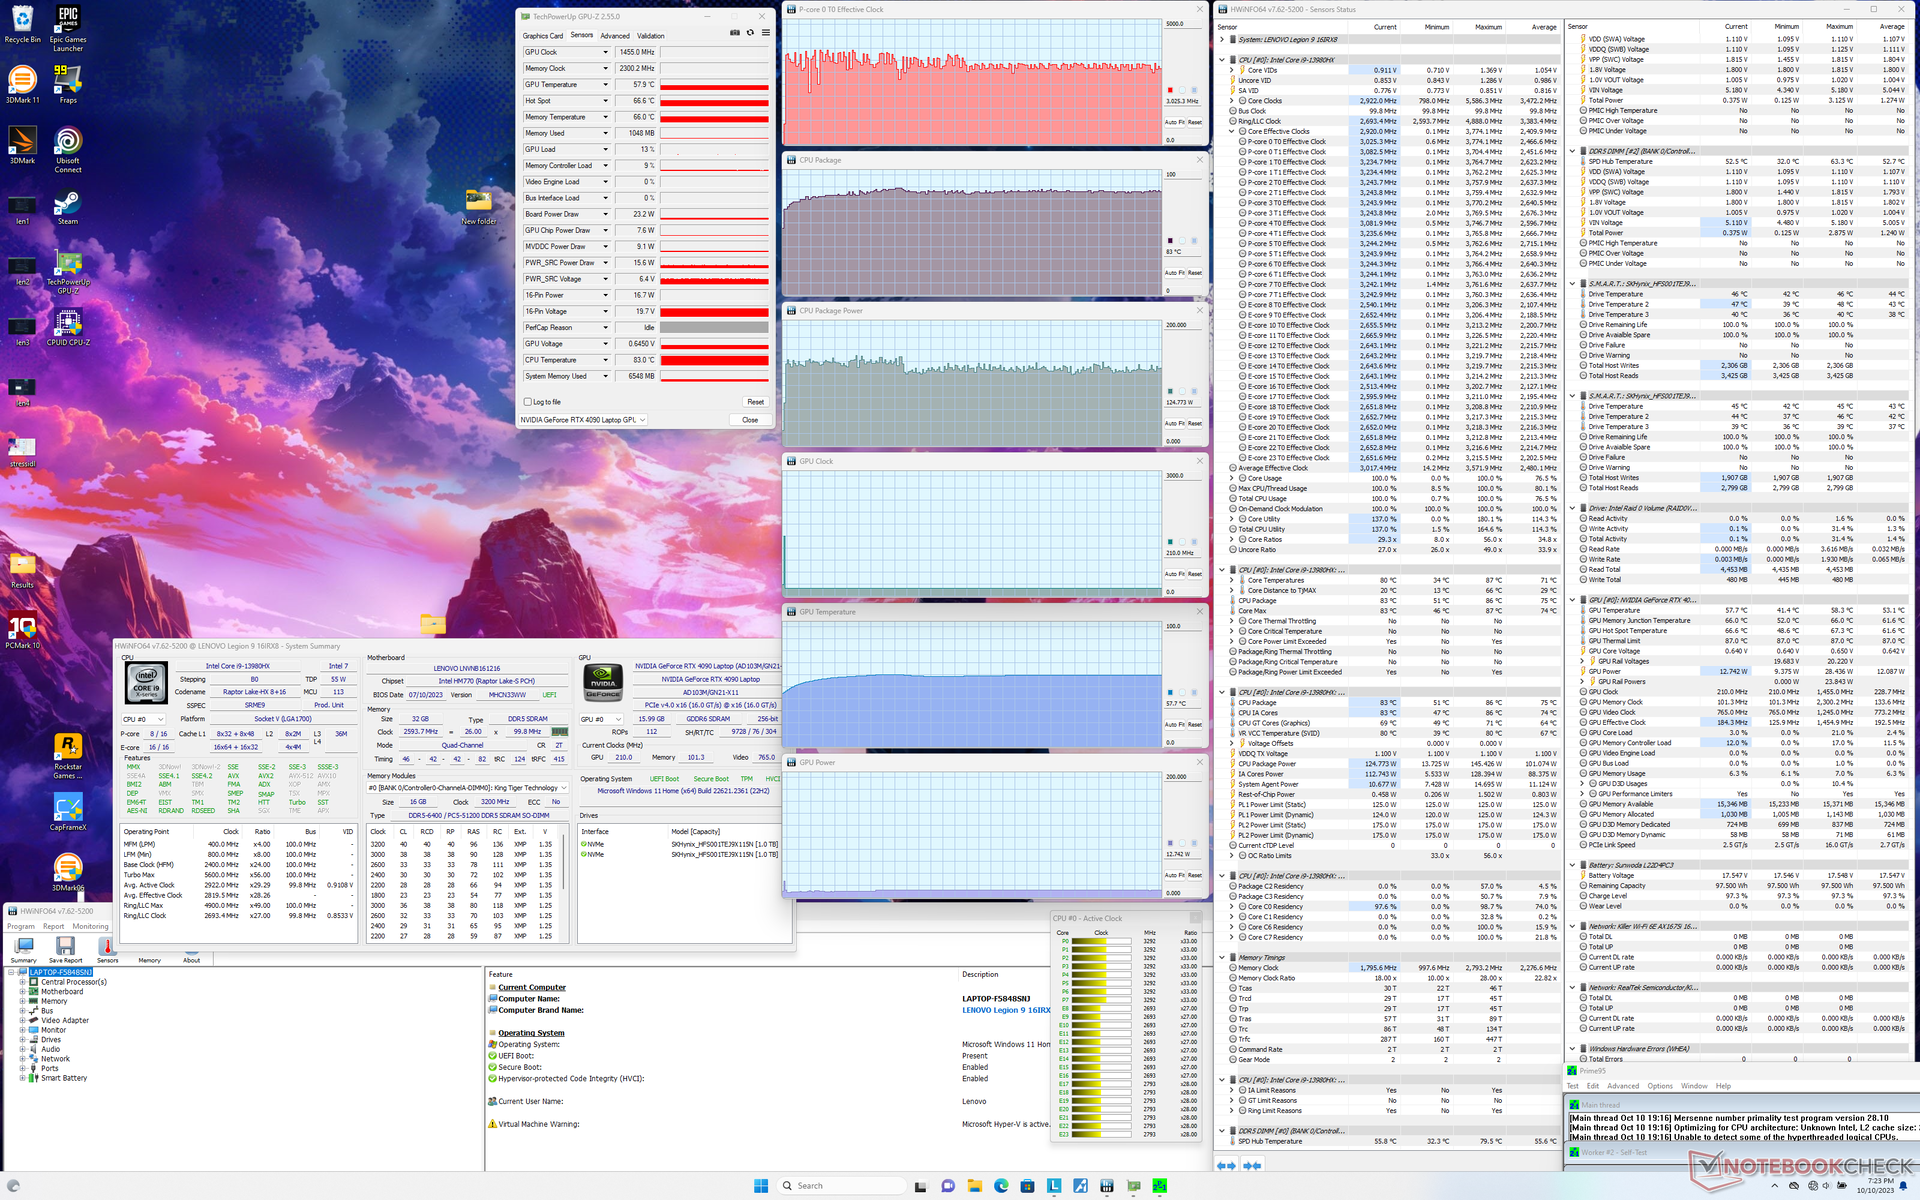
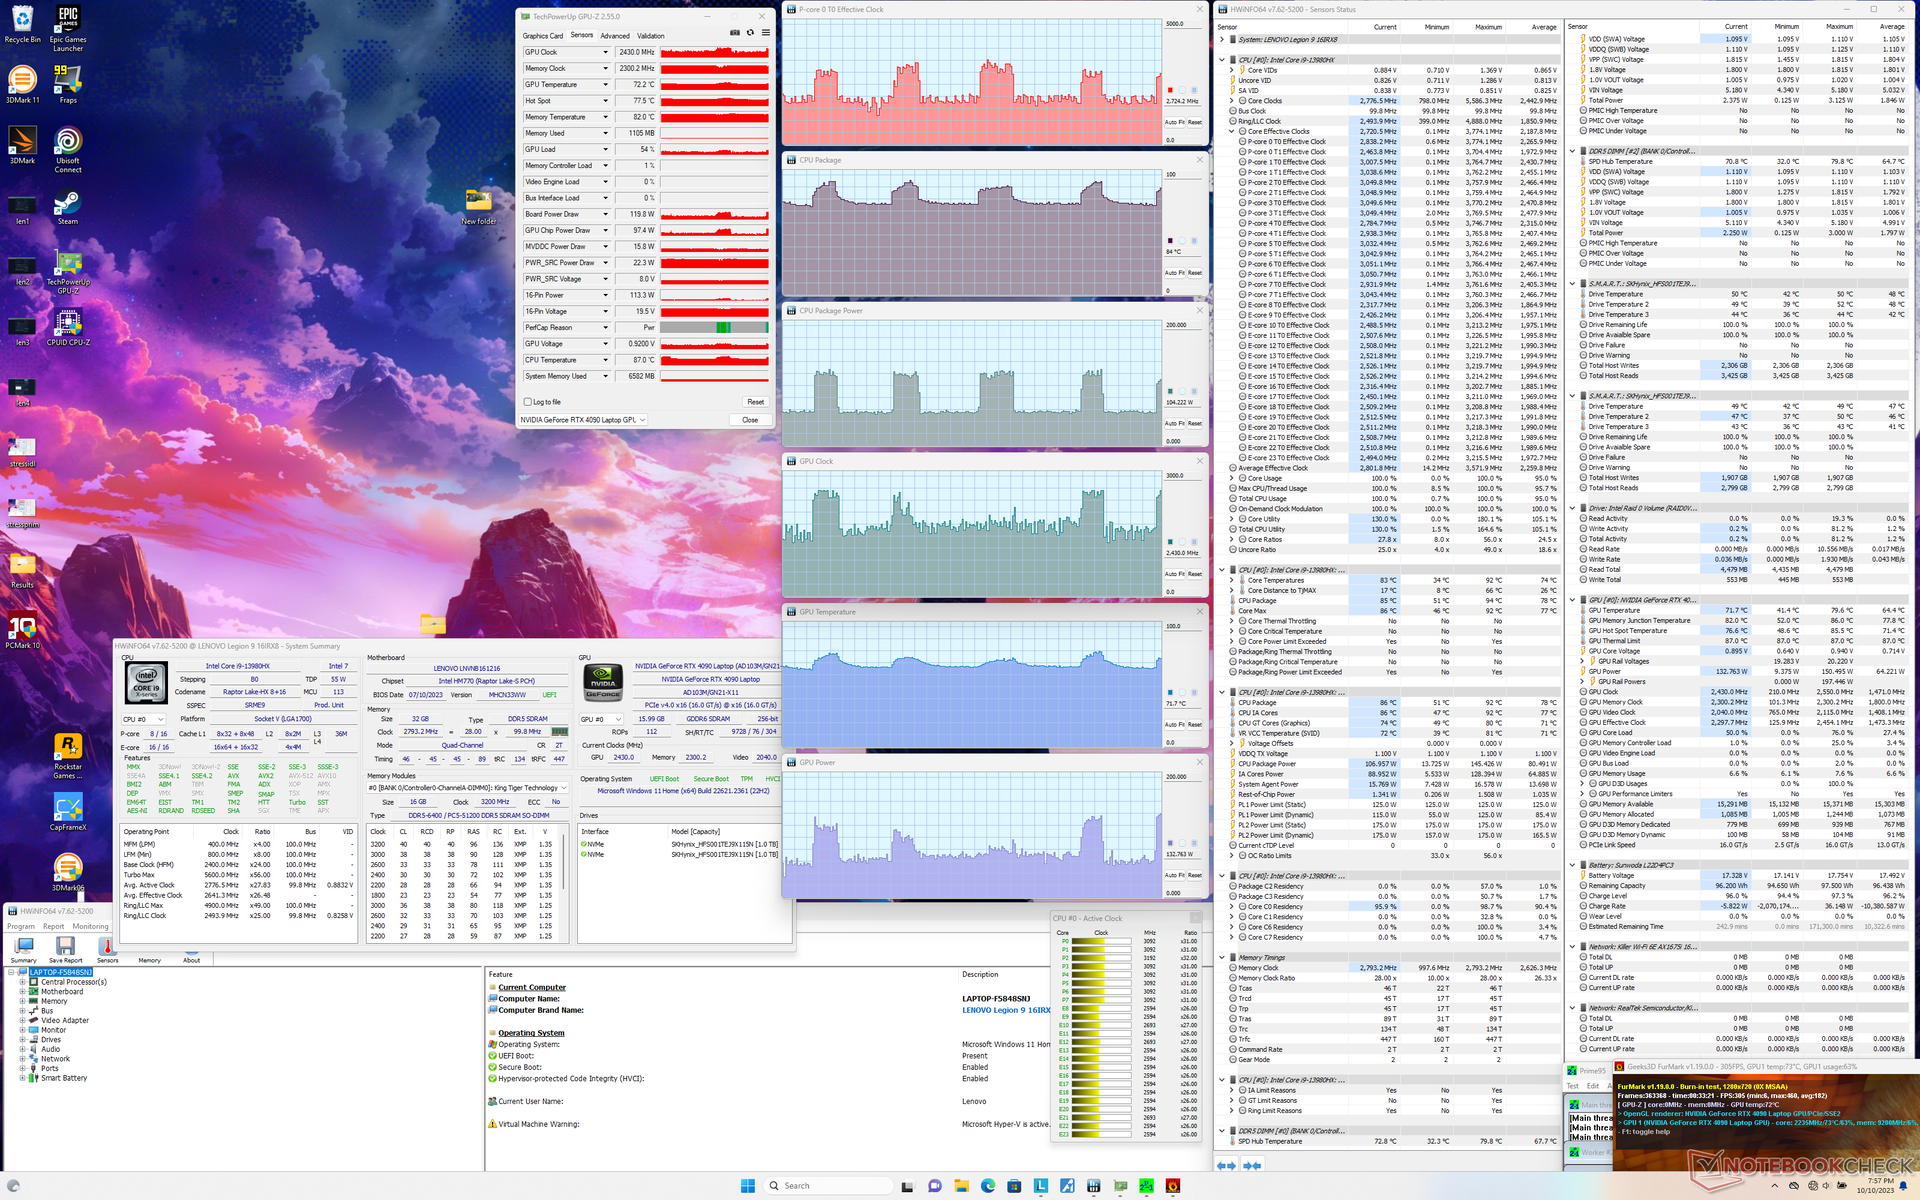
| CPU Clock (GHz) | GPU Clock (MHz) | Average CPU Temperature (°C) | Average GPU Temperature (°C) | |
| System Idle | -- | -- | 52 | 41 |
| Prime95 Stress | 3.0 | -- | 83 | 58 |
| Prime95 + FurMark Stress | 1.6 - 3.4 | 1365 - 2535 | 74 - 86 | 72 - 78 |
| Witcher 3 Stress (Balanced mode with GPU Overclock off) | ~1.1 | 1650 | 71 | 66 |
| Witcher 3 Stress (Performance mode) | ~1.1 | 2265 | 77 | 78 |
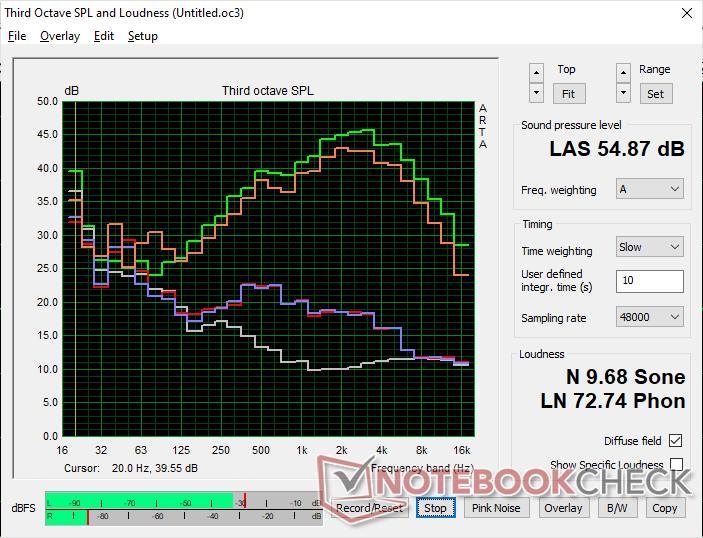
Speakers
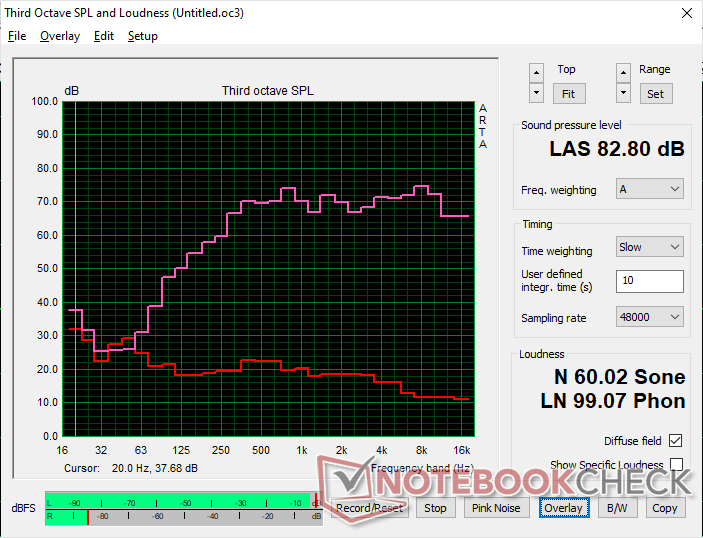
Lenovo Legion 9 16IRX8 audio analysis
(+) | speakers can play relatively loud (82.8 dB)
Bass 100 - 315 Hz
(±) | reduced bass - on average 13.5% lower than median
(±) | linearity of bass is average (9% delta to prev. frequency)
Mids 400 - 2000 Hz
(+) | balanced mids - only 1.5% away from median
(+) | mids are linear (5.7% delta to prev. frequency)
Highs 2 - 16 kHz
(+) | balanced highs - only 2.4% away from median
(+) | highs are linear (3.7% delta to prev. frequency)
Overall 100 - 16.000 Hz
(+) | overall sound is linear (11% difference to median)
Compared to same class
» 6% of all tested devices in this class were better, 3% similar, 91% worse
» The best had a delta of 7%, average was 19%, worst was 132%
Compared to all devices tested
» 4% of all tested devices were better, 1% similar, 95% worse
» The best had a delta of 4%, average was 26%, worst was 134%
Apple MacBook Pro 16 2021 M1 Pro audio analysis
(+) | speakers can play relatively loud (84.7 dB)
Bass 100 - 315 Hz
(+) | good bass - only 3.8% away from median
(+) | bass is linear (5.2% delta to prev. frequency)
Mids 400 - 2000 Hz
(+) | balanced mids - only 1.3% away from median
(+) | mids are linear (2.1% delta to prev. frequency)
Highs 2 - 16 kHz
(+) | balanced highs - only 1.9% away from median
(+) | highs are linear (2.7% delta to prev. frequency)
Overall 100 - 16.000 Hz
(+) | overall sound is linear (4.6% difference to median)
Compared to same class
» 0% of all tested devices in this class were better, 0% similar, 100% worse
» The best had a delta of 5%, average was 18%, worst was 45%
Compared to all devices tested
» 0% of all tested devices were better, 0% similar, 100% worse
» The best had a delta of 4%, average was 26%, worst was 134%
Energy Management
Power Consumption
Power consumption is very high no matter the power setting. Idling on desktop on Power Saver iGPU mode and on the minimum brightness setting would still demand 32 W compared to just 9 W to 10 W on the Legion Slim 5 16 or Asus ROG Strix G16 each with IPS panels. Consumption also depends not just on brightness but also on color much like with an OLED panel. An all-white screen on our Legion 9i 16, for example, would demand about 13 W more than an all-black screen even when on the maximum brightness setting for both colors. IPS panels would demand just a few watts at most no matter the color in comparison.
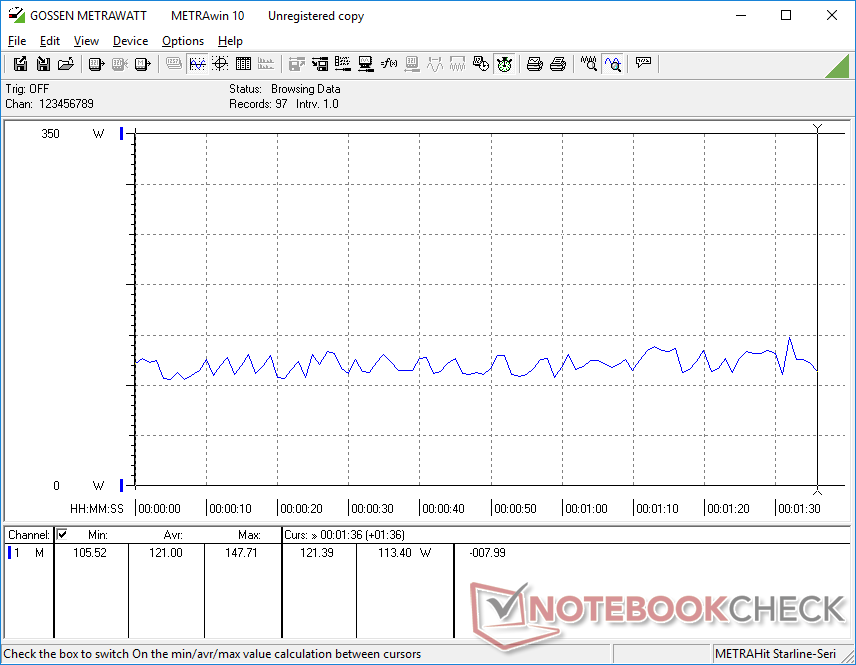
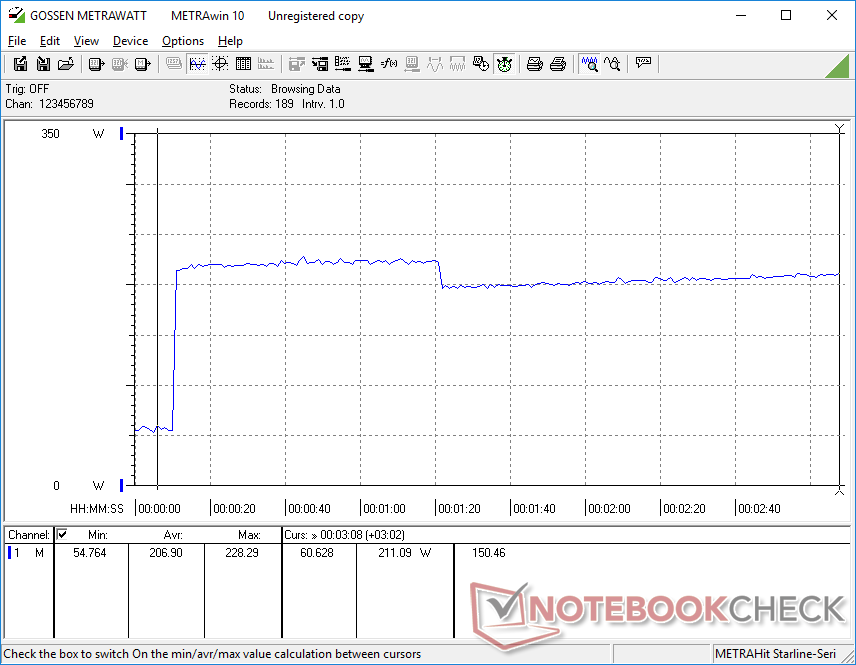
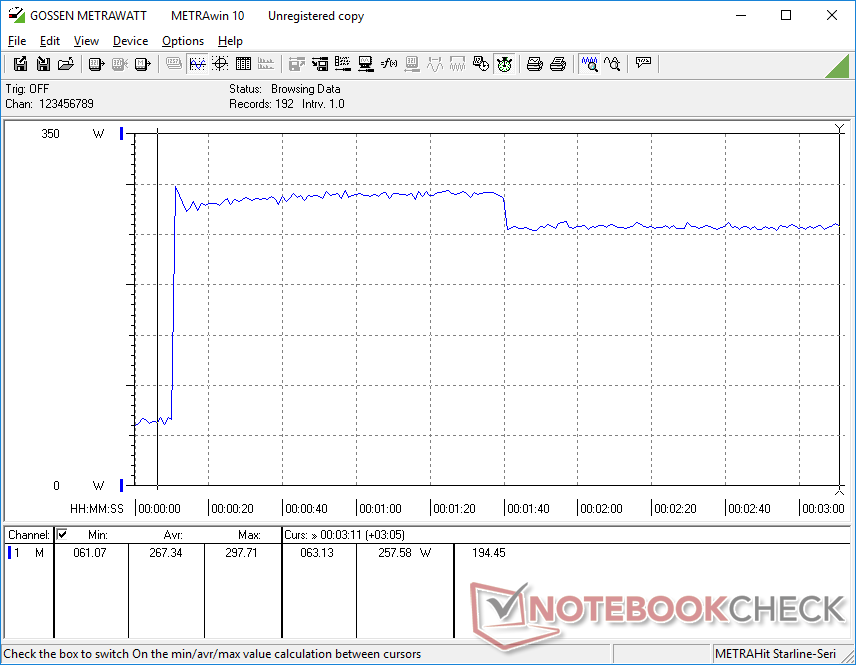
Running Prime95 on an external monitor shows very similar consumption levels between our Lenovo unit and the Asus ROG Strix Scar 17 powered by the competing Ryzen 9 7945HX as shown by the comparison graphs below. Performance-per-watt is nonetheless still in AMD's favor since the Ryzen 9 7945HX edges out our Core i9-13980HX in multi-threaded workloads despite their similar power demands.
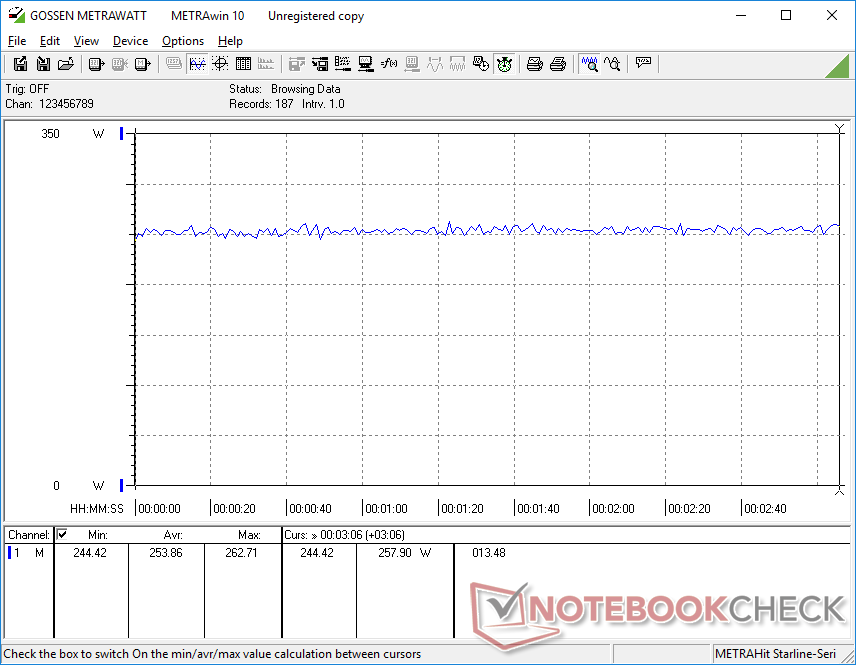
Consumption when gaming is slightly higher by about 10 percent when compared to the Asus ROG Strix Scar 17 SE with the older RTX 3080 Ti. However, the 40 to 75 percent increase in graphics performance with our RTX 4090 more than makes up for the smaller increase in consumption. The very high performance-per-watt of the mobile Ada Lovelace series is impressive and second-to-none at the moment.
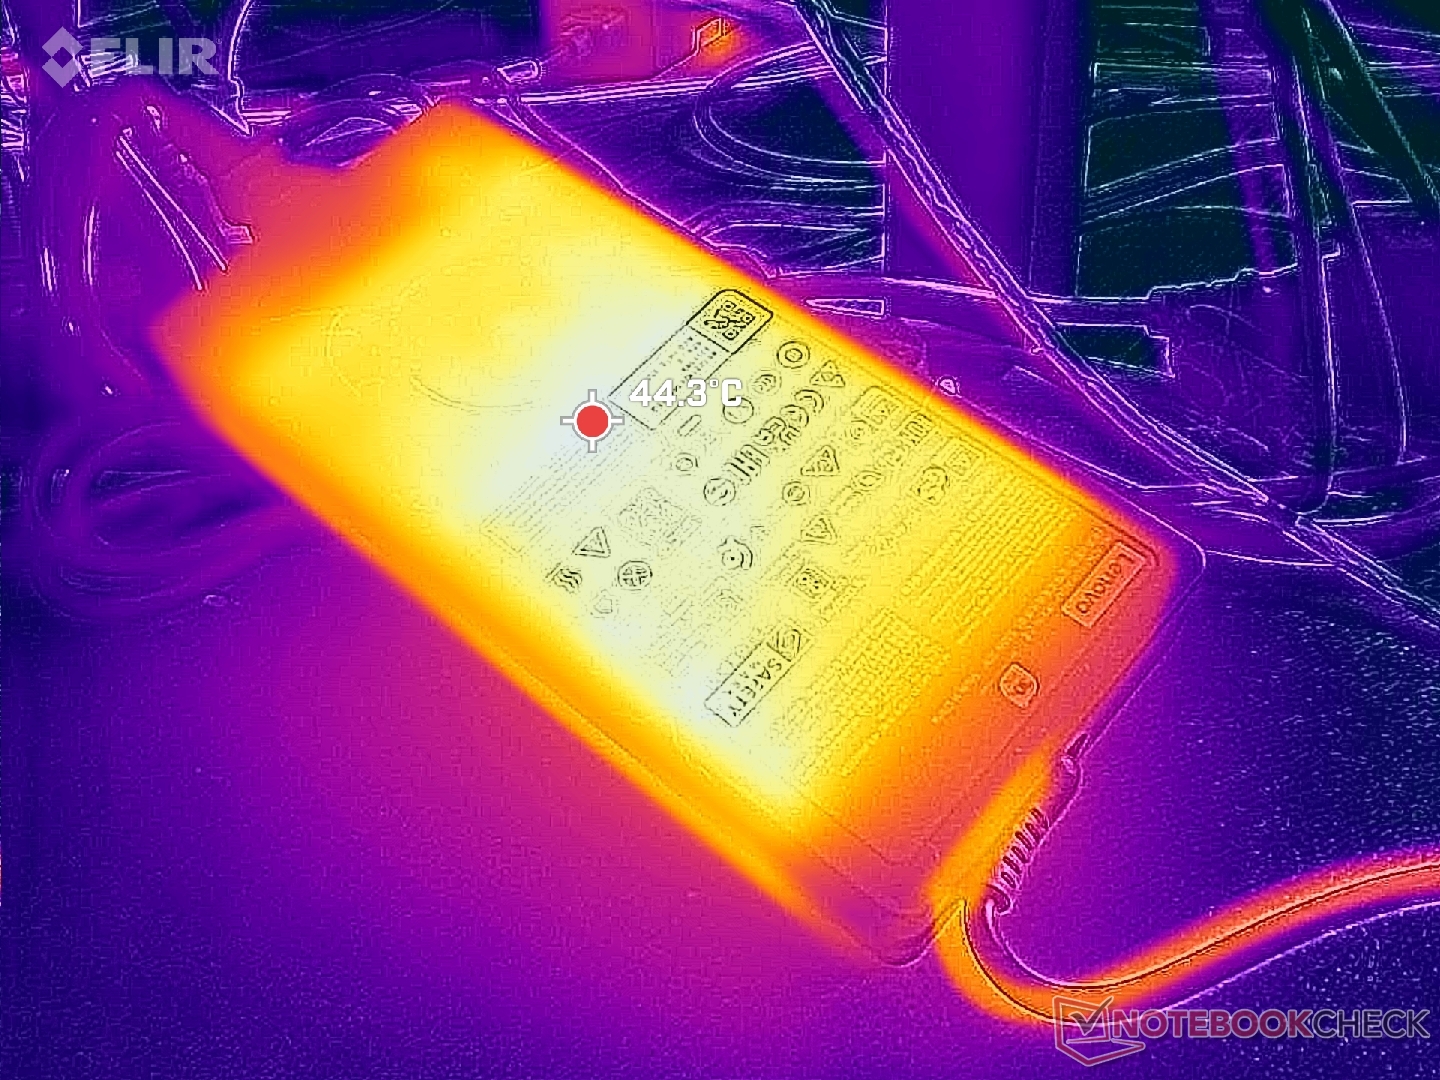
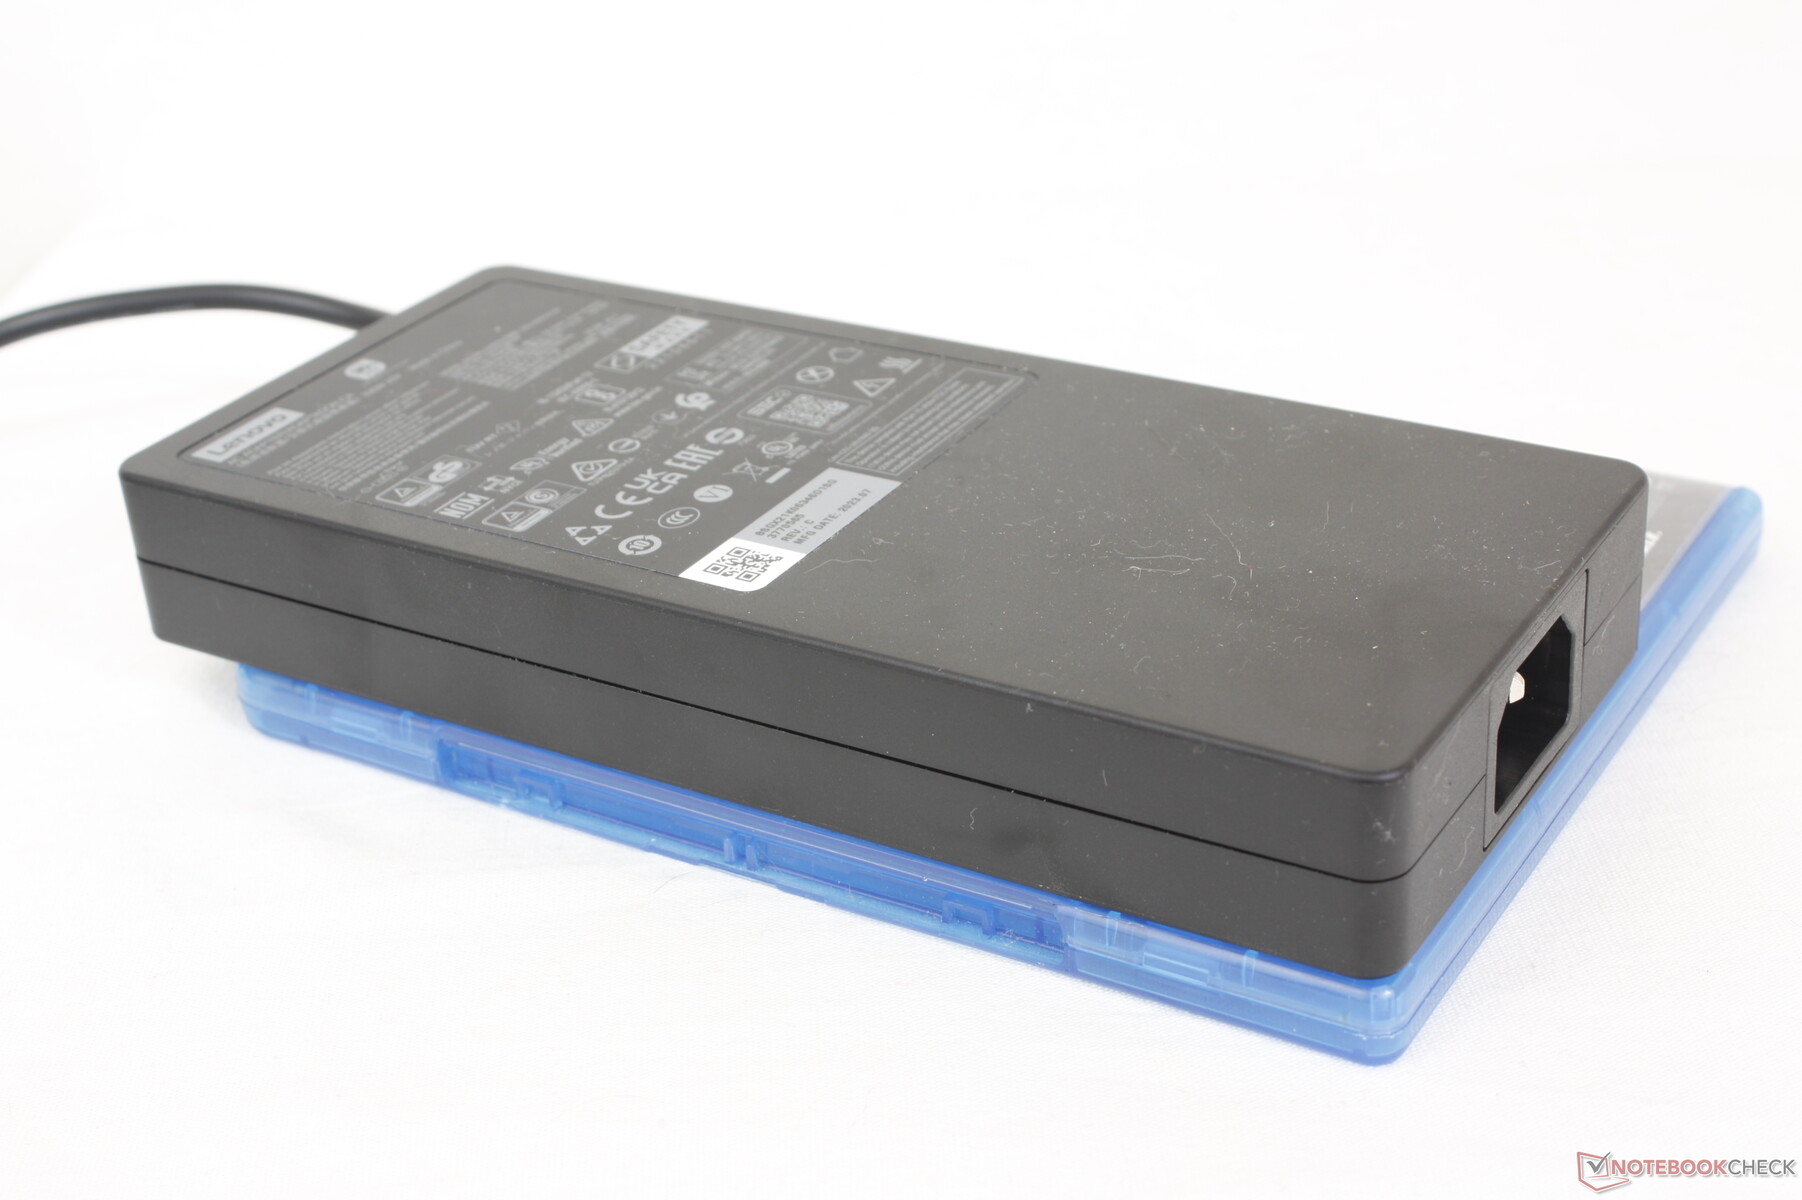
We're able to measure a maximum draw of 298 W from the medium-large (18.5 x 2.6 x8.3 cm) 330 W AC adapter when both the CPU and GPU are each at 100 percent utilization. This rate is only temporary due to thermal limitations.
| Off / Standby | |
| Idle | |
| Load |
|
| Lenovo Legion 9 16IRX8 i9-13980HX, NVIDIA GeForce RTX 4090 Laptop GPU, 2x SK Hynix HFS001TEJ9X115N (RAID 0), Mini-LED, 3200x2000, 16.00 | Lenovo Legion Slim 5 16APH8 R7 7840HS, NVIDIA GeForce RTX 4060 Laptop GPU, SK hynix PC801 HFS512GEJ9X115N, IPS, 2560x1600, 16.00 | Razer Blade 16 Early 2023 RTX 4090 i9-13950HX, NVIDIA GeForce RTX 4090 Laptop GPU, SSSTC CA6-8D1024, mini-LED, 3840x2400, 16.00 | Asus ROG Strix G16 G614JZ i9-13980HX, NVIDIA GeForce RTX 4080 Laptop GPU, WD PC SN560 SDDPNQE-1T00, IPS, 2560x1600, 16.00 | HP Omen Transcend 16 i9-13900HX, NVIDIA GeForce RTX 4070 Laptop GPU, SK hynix PC801 HFS002TEJ9X101N, Mini-LED, 2560x1600, 16.00 | Alienware x16 R1 i9-13900HK, NVIDIA GeForce RTX 4080 Laptop GPU, SK hynix PC801 HFS001TEJ9X101N, IPS, 2560x1600, 16.00 | |
|---|---|---|---|---|---|---|
| Power Consumption | 53% | 9% | 28% | 18% | 12% | |
| Idle Minimum * | 32.3 | 9.4 71% | 27.5 15% | 10 69% | 19.2 41% | 25.2 22% |
| Idle Average * | 42.6 | 15.5 64% | 34.4 19% | 16 62% | 22.7 47% | 29.9 30% |
| Idle Maximum * | 57.9 | 24.4 58% | 35.4 39% | 27 53% | 55.4 4% | 49.8 14% |
| Load Average * | 121 | 74.1 39% | 147.8 -22% | 129 -7% | 128.4 -6% | 105.4 13% |
| Witcher 3 ultra * | 254 | 112.9 56% | 256 -1% | 247 3% | 206 19% | 263 -4% |
| Load Maximum * | 297.7 | 206.5 31% | 286.7 4% | 342 -15% | 292 2% | 313.8 -5% |
* ... smaller is better
Power Consumption Witcher 3 / Stresstest
Power Consumption external Monitor
Battery Life
Runtimes are poor which correlate with our high power consumption numbers above. We're only to browse the web for just 160 minutes even when set to Balanced iGPU mode. Other mini-LED laptops, like the HP Omen Transcend 16, would also exhibit very short runtimes despite their large 90+ Wh battery packs.
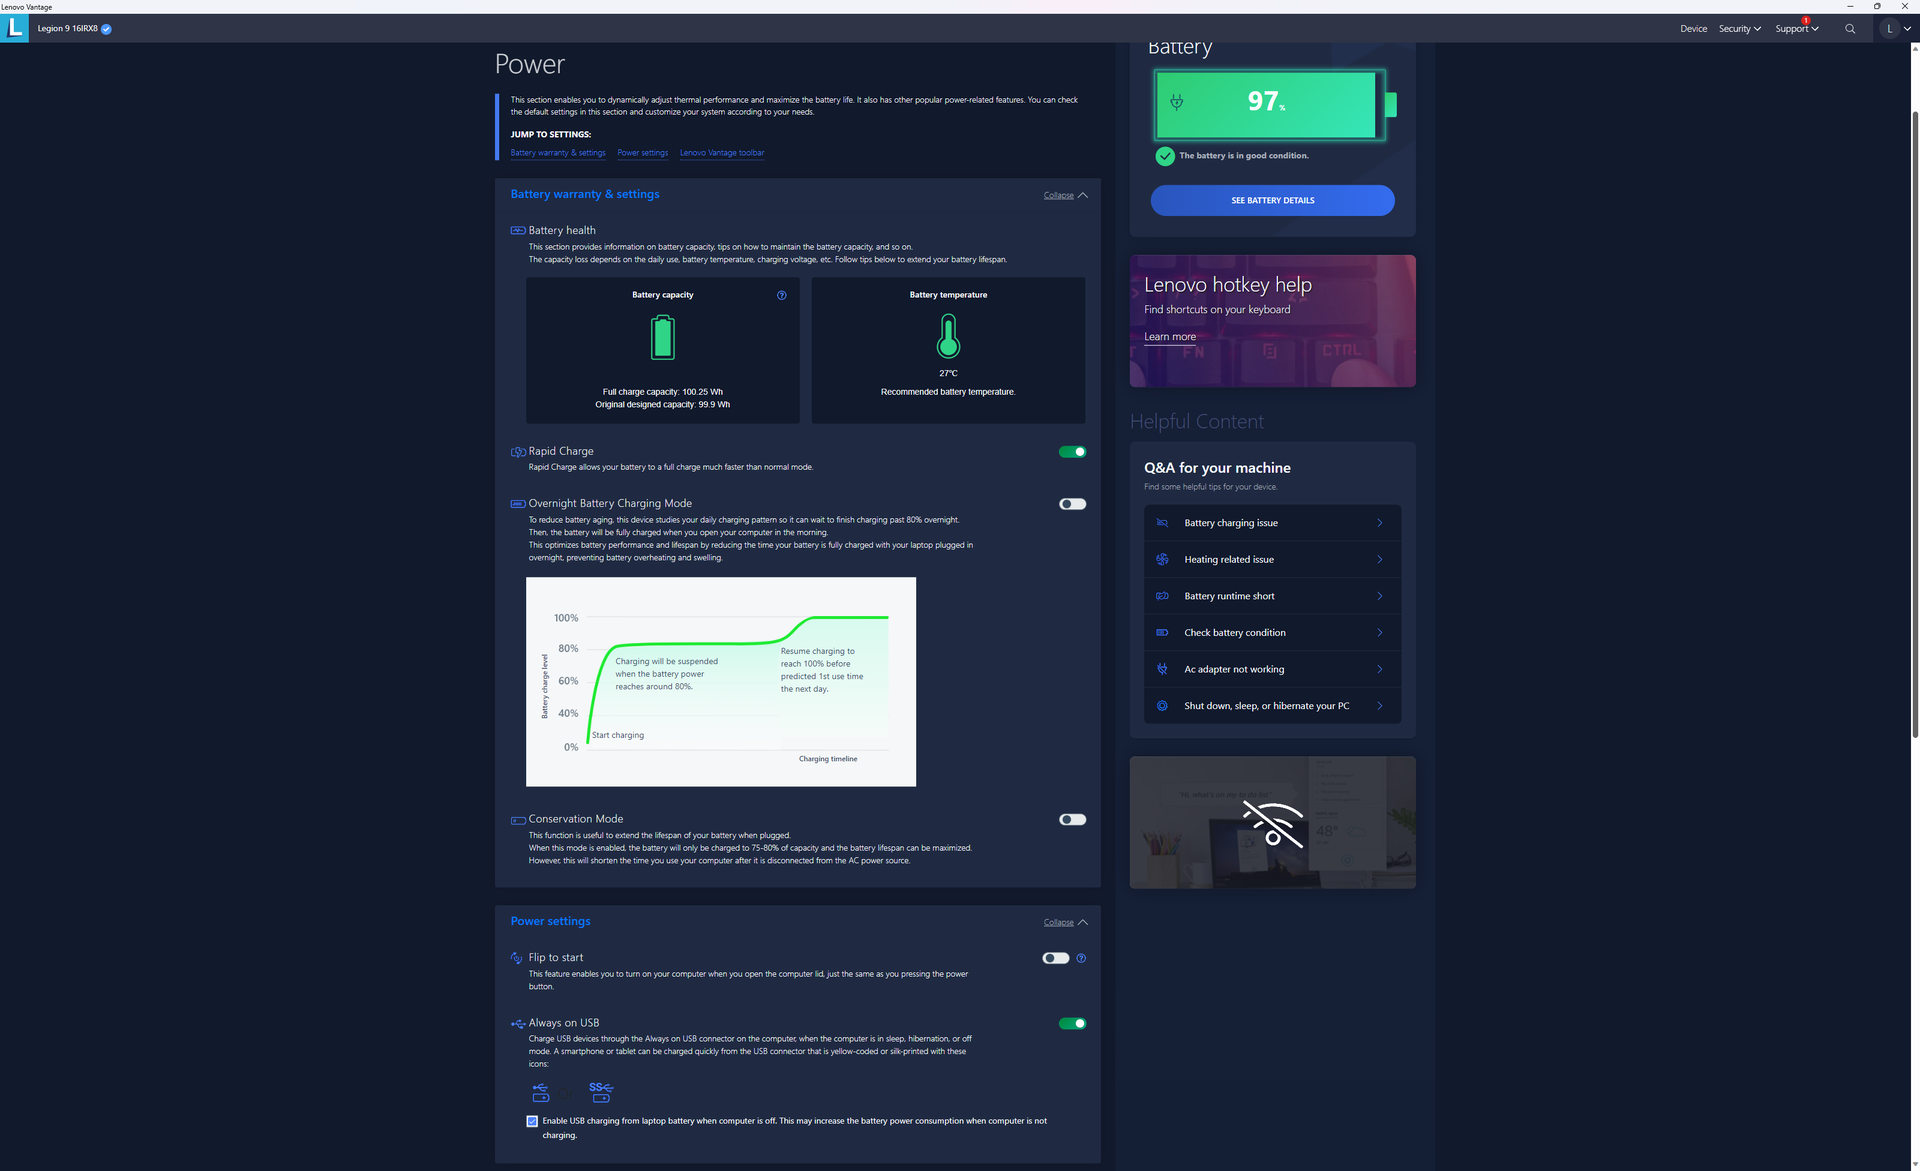
Charging is at least very fast at roughly one hour when Lenovo Rapid Charge is enabled compared to 90 minutes or longer on most other gaming laptops. Third-party USB-C adapters can also charge the system albeit at a slower rate and with unguaranteed compatibility.
| Lenovo Legion 9 16IRX8 i9-13980HX, NVIDIA GeForce RTX 4090 Laptop GPU, 99.9 Wh | Lenovo Legion Slim 5 16APH8 R7 7840HS, NVIDIA GeForce RTX 4060 Laptop GPU, 80 Wh | Razer Blade 16 Early 2023 RTX 4090 i9-13950HX, NVIDIA GeForce RTX 4090 Laptop GPU, 95.2 Wh | Asus ROG Strix G16 G614JZ i9-13980HX, NVIDIA GeForce RTX 4080 Laptop GPU, 90 Wh | HP Omen Transcend 16 i9-13900HX, NVIDIA GeForce RTX 4070 Laptop GPU, 97 Wh | Alienware x16 R1 i9-13900HK, NVIDIA GeForce RTX 4080 Laptop GPU, 90 Wh | |
|---|---|---|---|---|---|---|
| Battery Runtime | 87% | 79% | 140% | 25% | -7% | |
| Reader / Idle | 404 | 699 73% | 375 -7% | 436 8% | ||
| WiFi v1.3 | 159 | 425 167% | 345.5 117% | 583 267% | 250 57% | 149 -6% |
| Load | 58 | 70 21% | 81 40% | 65 12% | 73 26% | 44 -24% |
| H.264 | 503 | |||||
| Witcher 3 ultra | 95 |
Pros
Cons
Verdict — The Best Legion Money Can Buy
If you're in the market for a Core i9 CPU, RTX 4090 GPU, and mini-LED display, then the Legion 9i 16 is absolutely worth considering. When compared to other mini-LED gaming laptops like the HP Omen Transcend 16, Razer Blade 16, or the Asus Zephyrus M16, the Lenovo offers faster graphics than the HP, lower prices than the Razer, and a higher native resolution than the Asus. It nails both the specifications and physical design to be a healthy step up from the already excellent Legion Pro 7 series.
All the upgrades have naturally led to a bigger and heavier chassis. If you want the CPU and display features of the Lenovo but in a more portable form factor, then the pricier Blade 16 might be worthwhile. The integrated liquid cooling sounds interesting on paper, but it doesn't seem to have made for a lighter, quieter, or even cooler design. Expect the Lenovo to run just as loudly as most other gaming laptops in the same size category.
The Legion 9i 16 has all the fancy specs and a new look that enthusiasts can appreciate so long as you can overlook the short battery life and relatively large chassis.
You'll have to really want mini-LED if you want the Legion 9 16 as it offers no other display options for better or worse. Mini-LED is at its best when HDR is enabled to exploit its 1000-nit maximum brightness. Otherwise, the panel is very demanding on the battery with no other major benefits over less expensive panels like IPS or OLED.
Price and Availability
Lenovo is now shipping its Legion 9i Gen 8 model starting at $3420 USD if configured with the GeForce RTX 4080 up to $4000 USD if fully configured with the RTX 4090 and additional storage.
Lenovo Legion 9 16IRX8
-
10/15/2023 v7
Allen Ngo


Transparency
The present review sample was made available to the author as a loan by the manufacturer or a shop for the purposes of review. The lender had no influence on this review, nor did the manufacturer receive a copy of this review before publication. There was no obligation to publish this review.
Pricecompare
