 Deutsch
 English
 Español
 Français
 Italiano
 Nederlands
 Polski
 Português
 Русский
 Türkçe
 Svenska
 Chinese
 Magyar
Lenovo Legion Slim 7 16 gaming laptop in review: Convincing even with AMD Ryzen

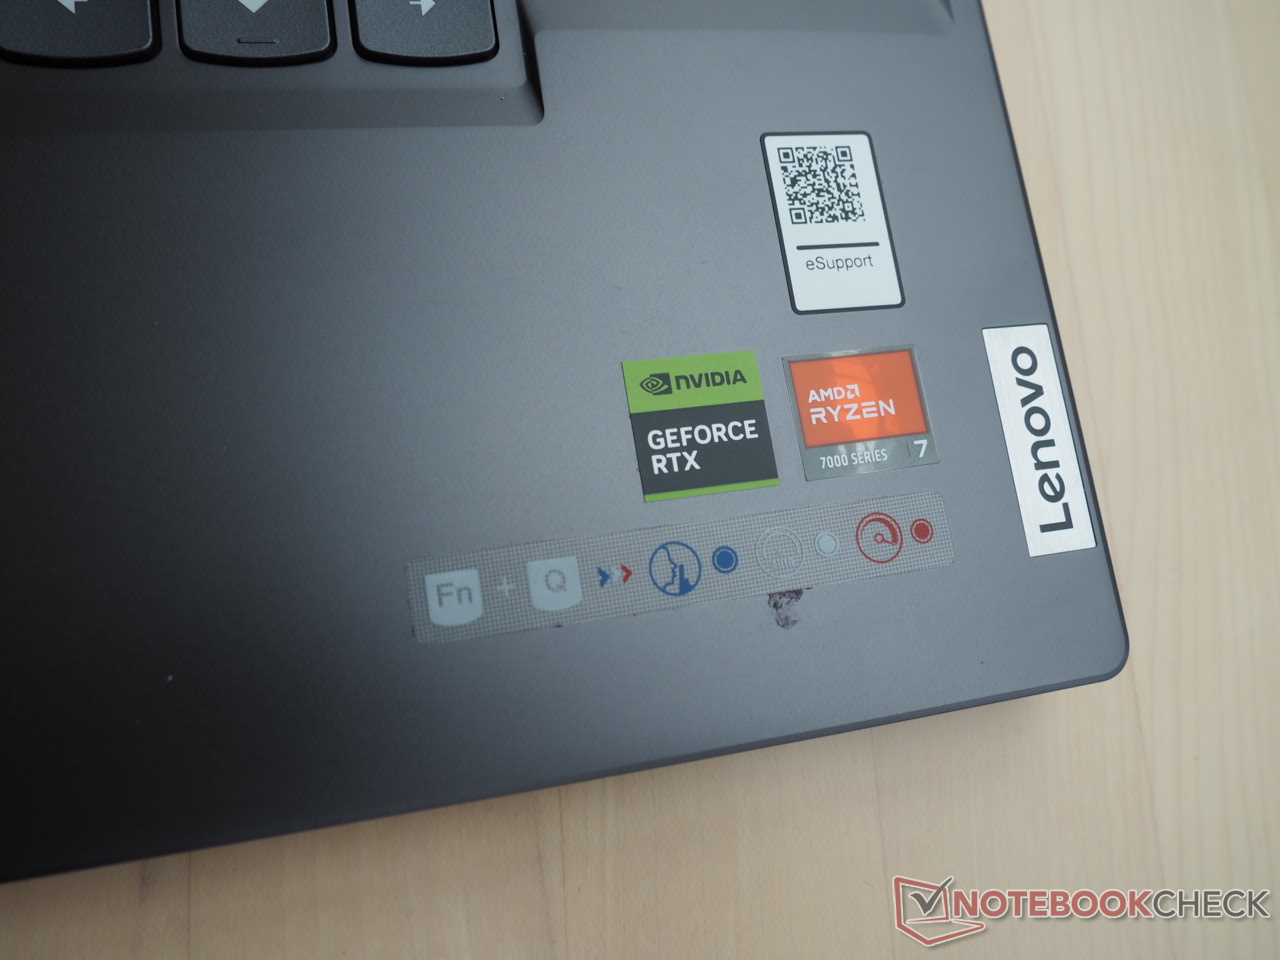
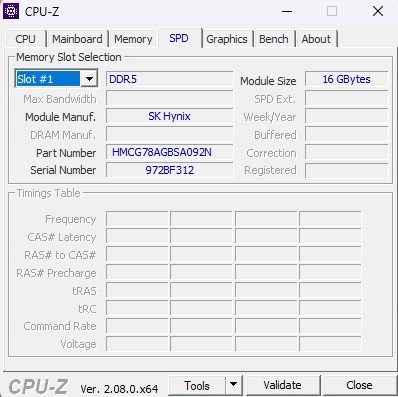
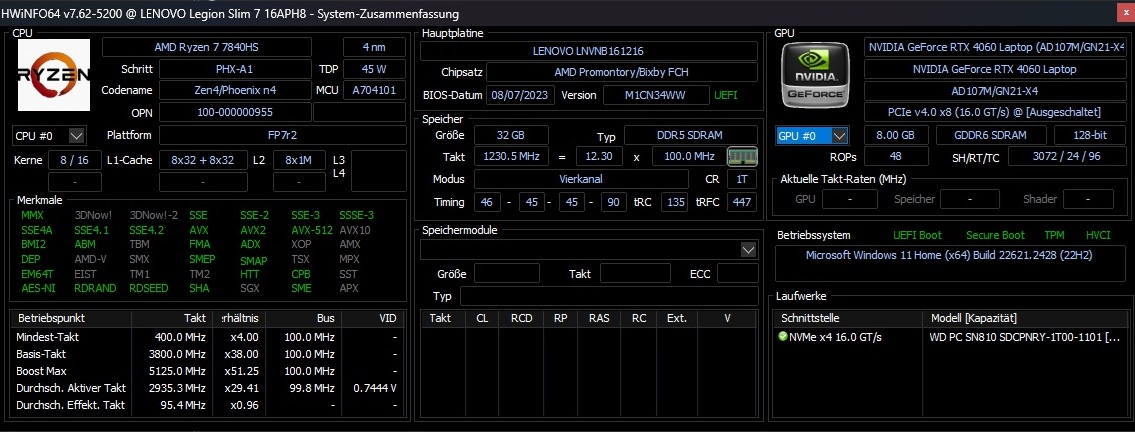
In addition to Intel processors, Lenovo offers AMD CPUs for the Legion Slim 7 series. The model we tested, 16APH8, features a Ryzen 7 7840HS processor paired with a GeForce RTX 4060 GPU, 32 GB DDR5-5600-RAM, and a spacious 1 TB M.2 SSD. The laptop boasts a vibrant WQXGA display with 2,560 x 1,600 pixels resolution, a high refresh rate of 240 Hz, factory calibration, and HDR support, Windows 11 Home completes the product. Despite its impressive specifications, the 16APH8 is priced at around $1750 USD, making it relatively expensive for a laptop equipped with an RTX 4060 graphics card.
The Slim 7 faces competition from other 16-inch gaming notebooks featuring the RTX 4060, including models like the Asus ROG Flow X16 GV601V, Alienware m16 R1, Acer Predator Helios 16 PH16-71-731Q, as well as Lenovo's own Legion Pro 5 16IRX8 and Lenovo LOQ 16IRH8 notebooks.
Potential Competitors in Comparison
Rating | Date | Model | Weight | Height | Size | Resolution | Best Price |
|---|---|---|---|---|---|---|---|
| 90.4 % | 11/2023 | Lenovo Legion Slim 7 16APH8 R7 7840HS, NVIDIA GeForce RTX 4060 Laptop GPU | 2.1 kg | 20 mm | 16.00" | 2560x1600 | |
| 89.7 % | 06/2023 | Asus ROG Flow X16 GV601V i9-13900H, NVIDIA GeForce RTX 4060 Laptop GPU | 2.1 kg | 19.4 mm | 16.00" | 2560x1600 | |
| 88.3 % | 09/2023 | Alienware m16 R1 Intel i7-13700HX, NVIDIA GeForce RTX 4060 Laptop GPU | 3 kg | 25.4 mm | 16.00" | 2560x1600 | |
| 89.5 % | 07/2023 | Acer Predator Helios 16 PH16-71-731Q i7-13700HX, NVIDIA GeForce RTX 4060 Laptop GPU | 2.6 kg | 26.9 mm | 16.00" | 2560x1600 | |
| 87.9 % | 05/2023 | Lenovo Legion Pro 5 16IRX8 i7-13700HX, NVIDIA GeForce RTX 4060 Laptop GPU | 2.5 kg | 26.8 mm | 16.00" | 2560x1600 | |
| 87.3 % | 09/2023 | Lenovo LOQ 16IRH8 i7-13620H, NVIDIA GeForce RTX 4060 Laptop GPU | 2.7 kg | 25.9 mm | 16.00" | 2560x1600 |
With the exception of a few minor differences, the case is the same as the Intel version with the Core i9-13900H and GeForce RTX 4070 that we have already examined. Therefore, we will just go over the casing, features, and input devices briefly in this article.
Case
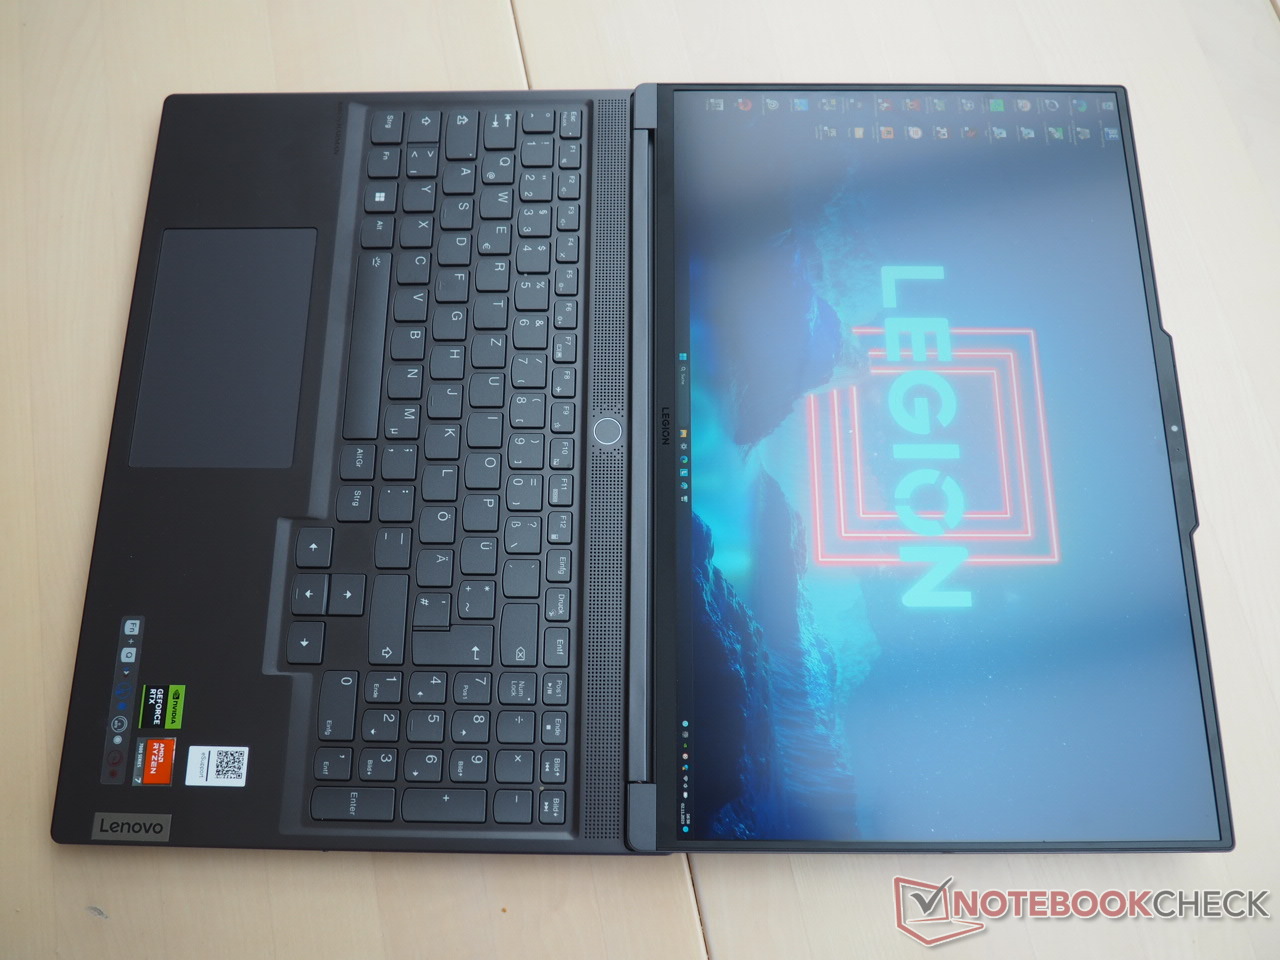
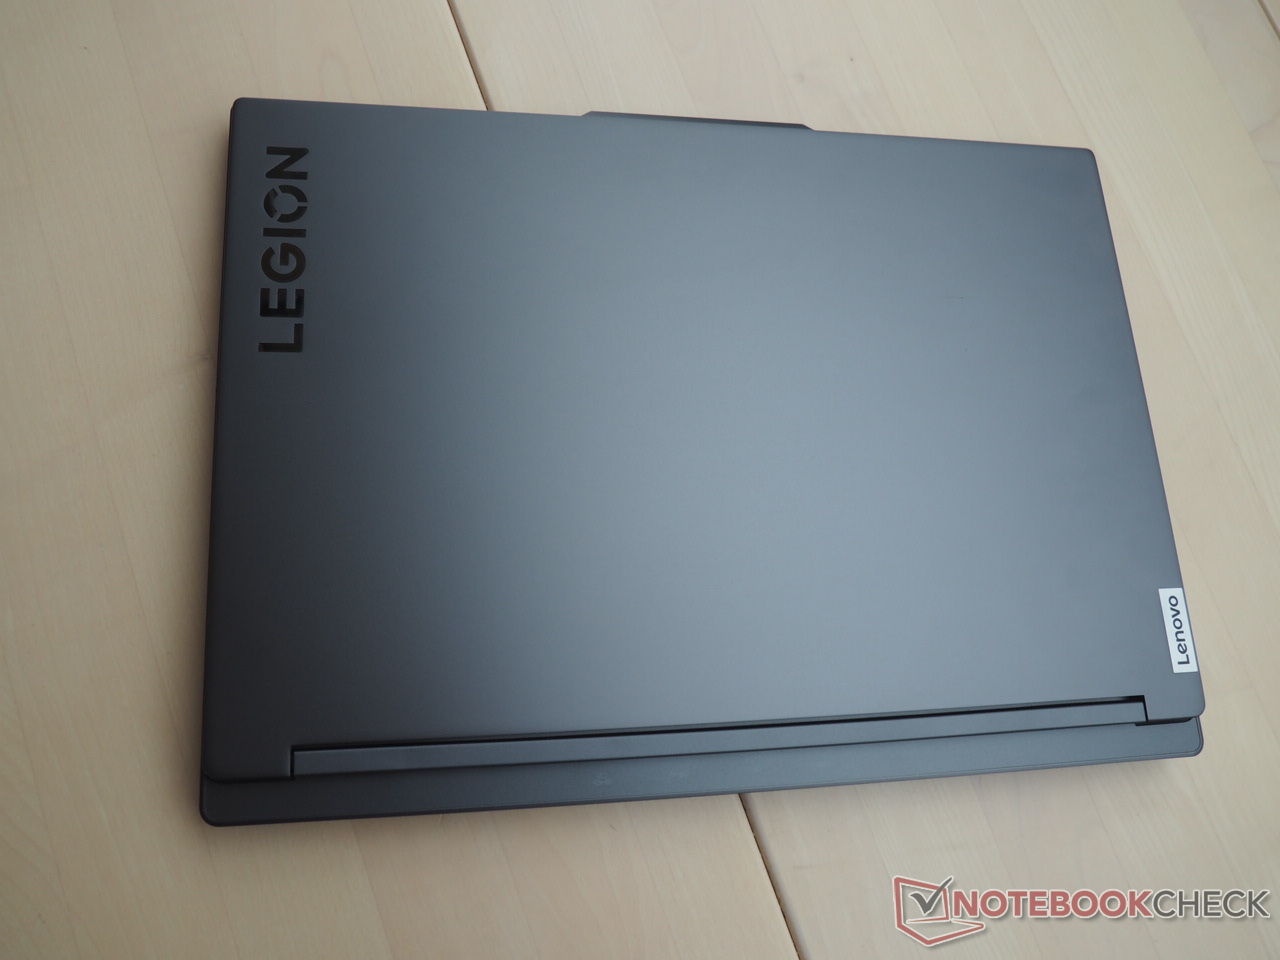
One of the standout features is the stylish body. The 16-inch device features a sleek design, premium materials, and excellent stability. Weighing just 4.6 lbs, it falls on the lighter end of the scale compared to its competitors.
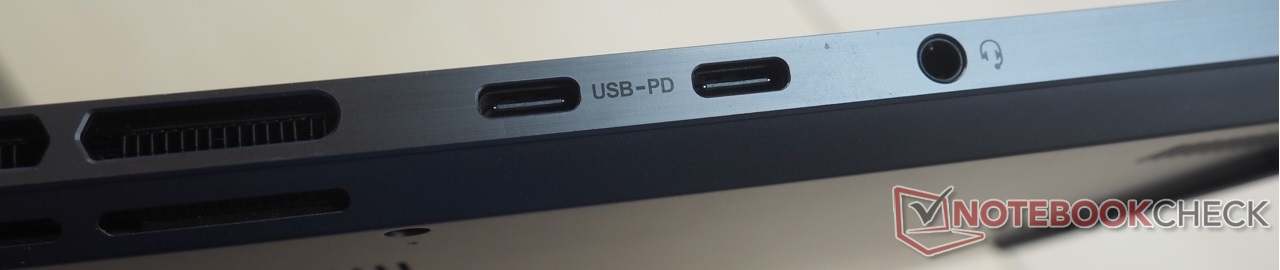
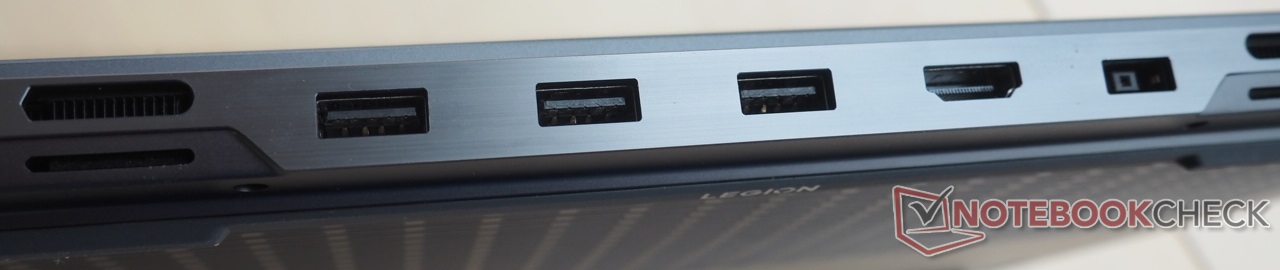
Connectivity
Despite the absence of an RJ45 port, the Slim 7 offers a generous array of connections. On the right-hand side, you'll find a medium-speed card reader and a privacy shutter for a decent webcam. The left-hand side features an audio socket and two USB ports (1x USB 4, 1x USB 3.2 Gen2), both of which support DisplayPort 1.4 and 140-watt power delivery. Additionally, there's an HDMI 2.1 port, allowing for the connection of up to three external monitors. At the rear, there are three USB 3.2 Gen2 ports and the connection for the included 230-watt power supply unit.
For wireless connectivity, the laptop uses a Wi-Fi 6E chip (MediaTek RZ616), which performs slightly below average during transmission but above average during reception.

SD Card Reader
| SD Card Reader | |
| average JPG Copy Test (av. of 3 runs) | |
| Alienware m16 R1 Intel (AV PRO microSD 128 GB V60) | |
| Asus ROG Flow X16 GV601V | |
| Average of class Gaming (19 - 202, n=99, last 2 years) | |
| Lenovo Legion Slim 7 16APH8 (AV PRO microSD 128 GB V60) | |
| Acer Predator Helios 16 PH16-71-731Q | |
| maximum AS SSD Seq Read Test (1GB) | |
| Asus ROG Flow X16 GV601V | |
| Alienware m16 R1 Intel (AV PRO microSD 128 GB V60) | |
| Average of class Gaming (26 - 269, n=90, last 2 years) | |
| Acer Predator Helios 16 PH16-71-731Q | |
| Lenovo Legion Slim 7 16APH8 (AV PRO microSD 128 GB V60) | |
Communication
| Networking | |
| iperf3 transmit AXE11000 | |
| Acer Predator Helios 16 PH16-71-731Q | |
| Average of class Gaming (648 - 1780, n=126, last 2 years) | |
| Alienware m16 R1 Intel | |
| Average MediaTek RZ616 (593 - 1793, n=11) | |
| Asus ROG Flow X16 GV601V | |
| Lenovo Legion Pro 5 16IRX8 | |
| Lenovo LOQ 16IRH8 | |
| Lenovo Legion Slim 7 16APH8 | |
| iperf3 receive AXE11000 | |
| Lenovo Legion Slim 7 16APH8 | |
| Alienware m16 R1 Intel | |
| Average MediaTek RZ616 (750 - 1752, n=11) | |
| Acer Predator Helios 16 PH16-71-731Q | |
| Average of class Gaming (685 - 1890, n=133, last 2 years) | |
| Lenovo Legion Pro 5 16IRX8 | |
| Asus ROG Flow X16 GV601V | |
| Lenovo LOQ 16IRH8 | |
Webcam


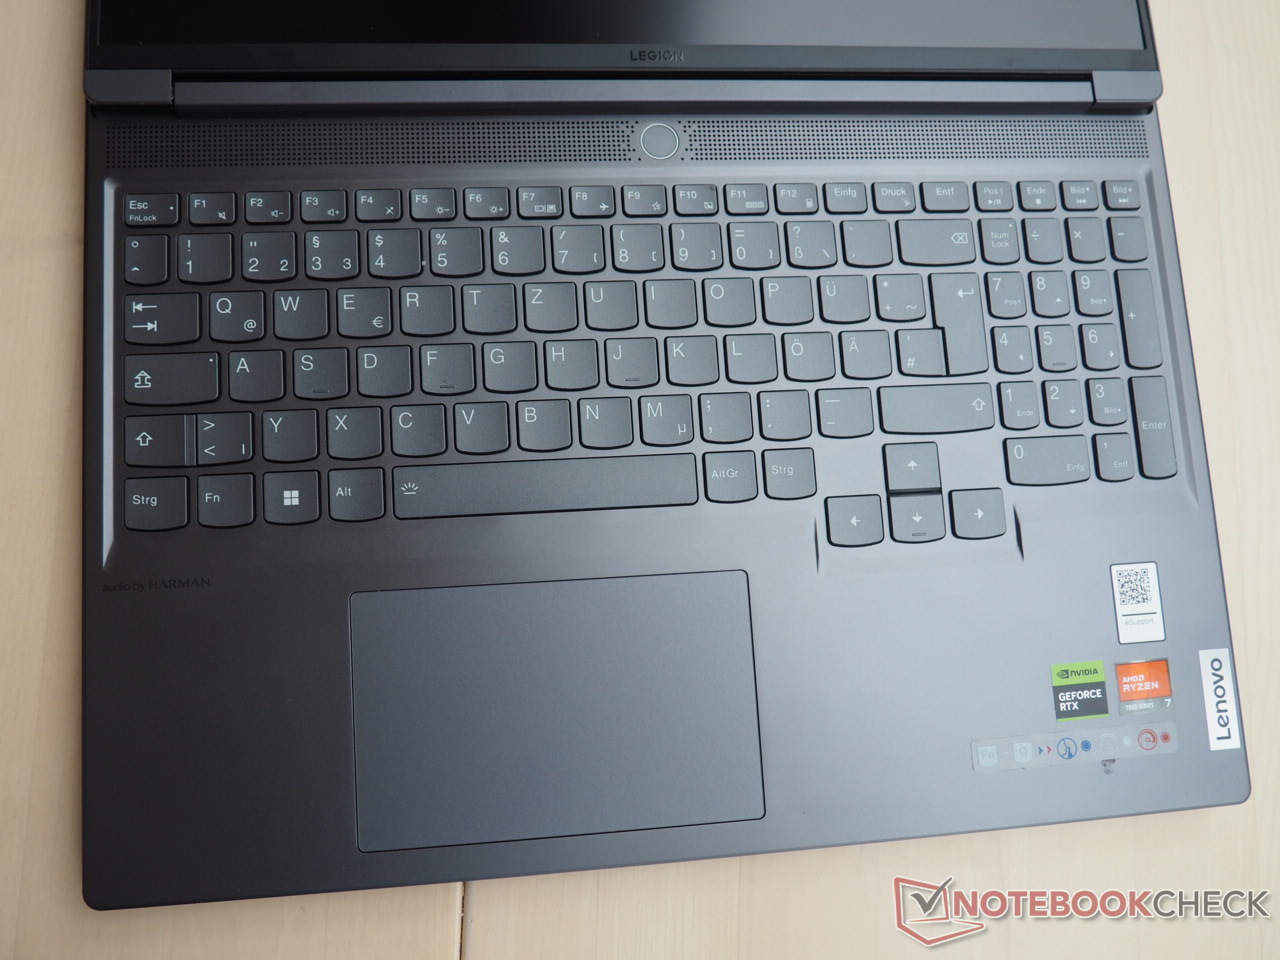
Input Devices
The keyboard not only offers well-sized keys, but also a nice layout, a pleasant key shape, and a dedicated numeric keypad. It also has a solid typing feel. A click pad measuring approximately 4.72 x 2.95 inches replaces the mouse and makes a nice impact as well.
Display
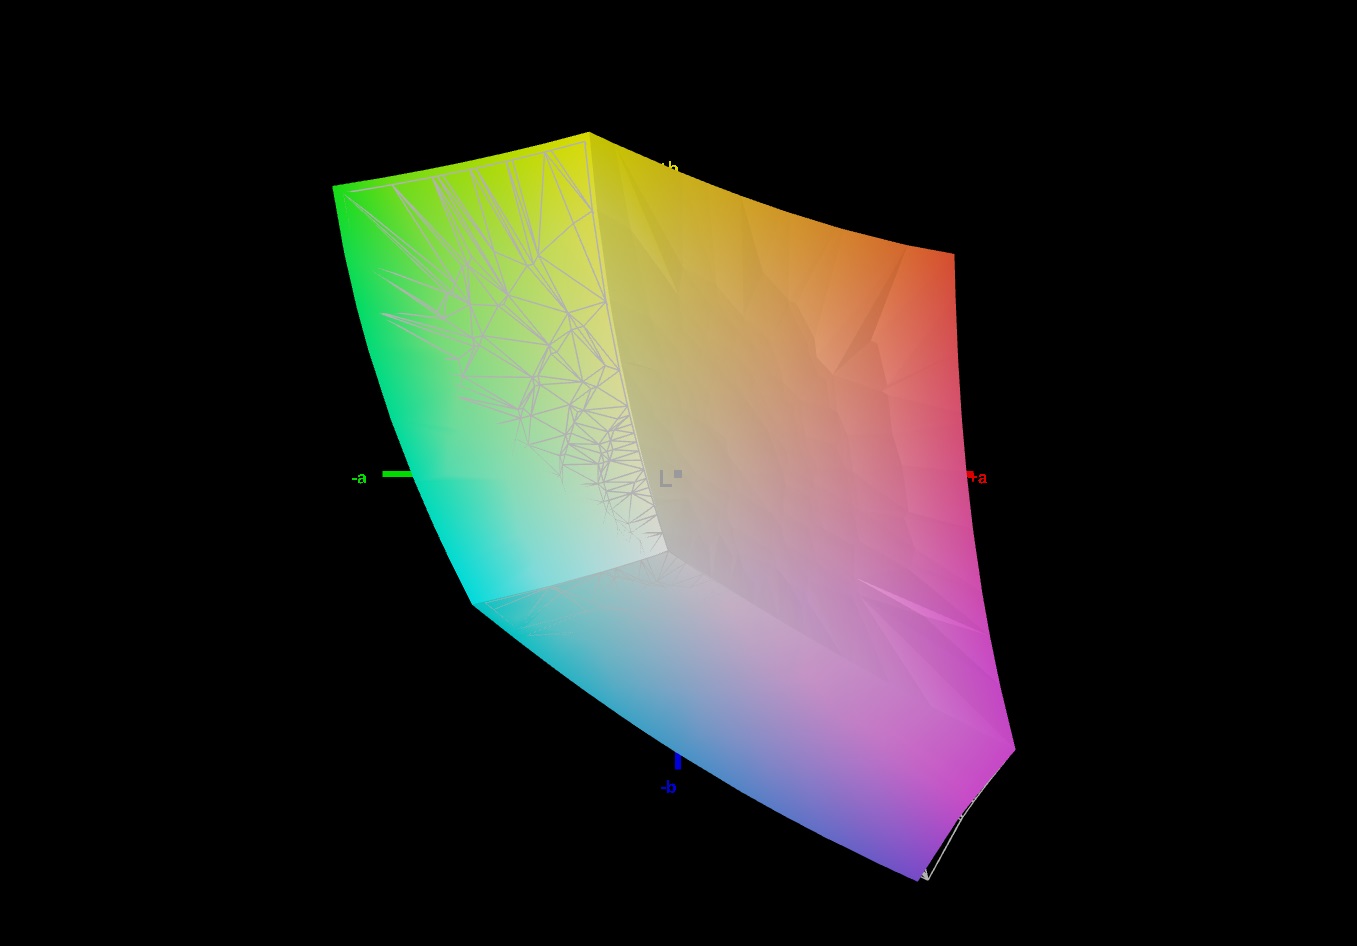
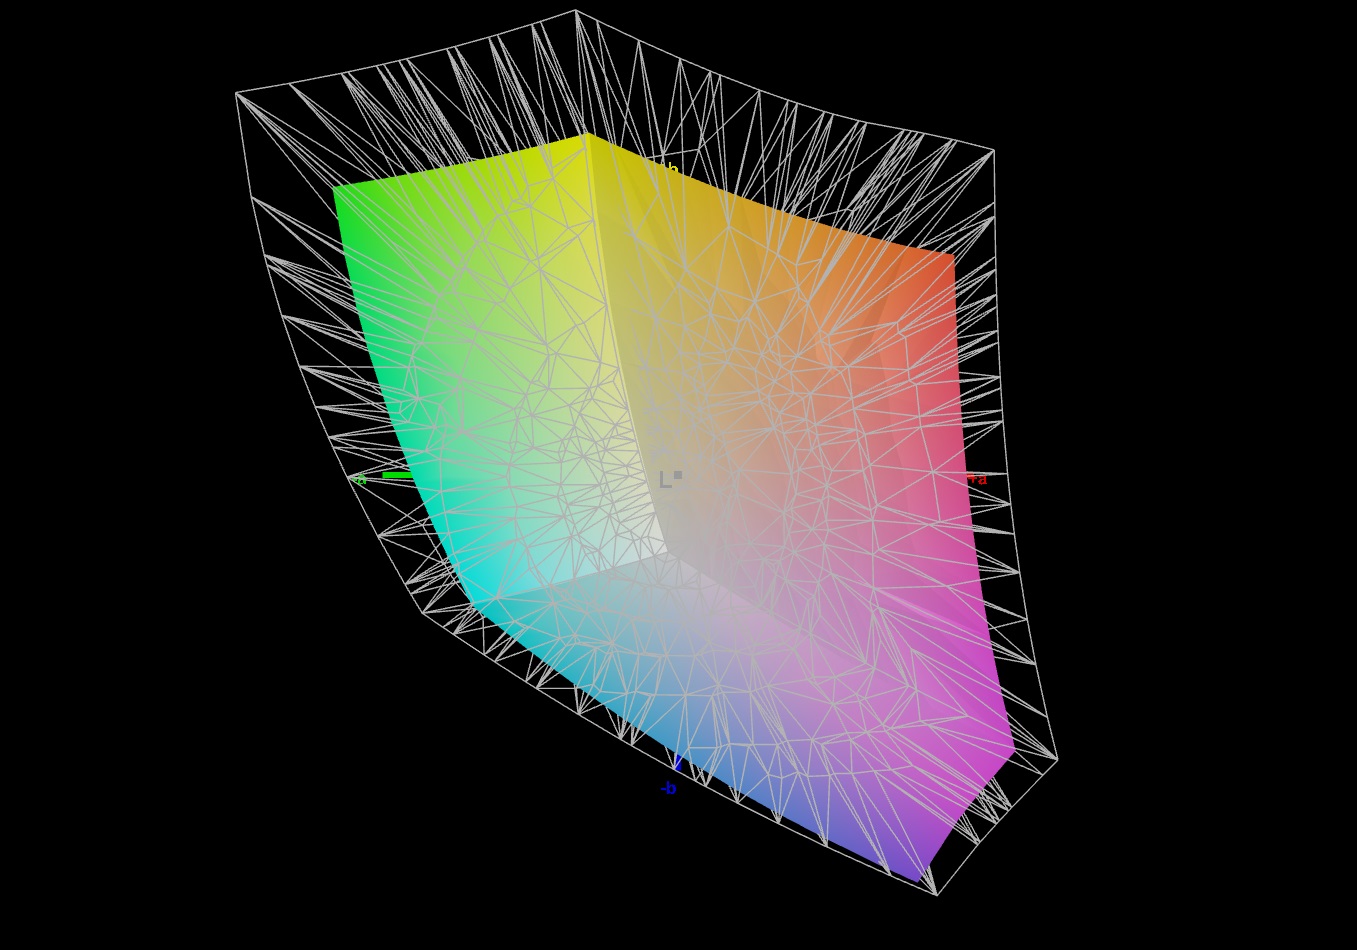
Although the Intel model and our test device's display share comparable fundamental features, they are not the same. Our model featured a BOE panel labeled NE160QDM-NZ3.
| |||||||||||||||||||||||||
Brightness Distribution: 82 %
Center on Battery: 545 cd/m²
Contrast: 1135:1 (Black: 0.48 cd/m²)
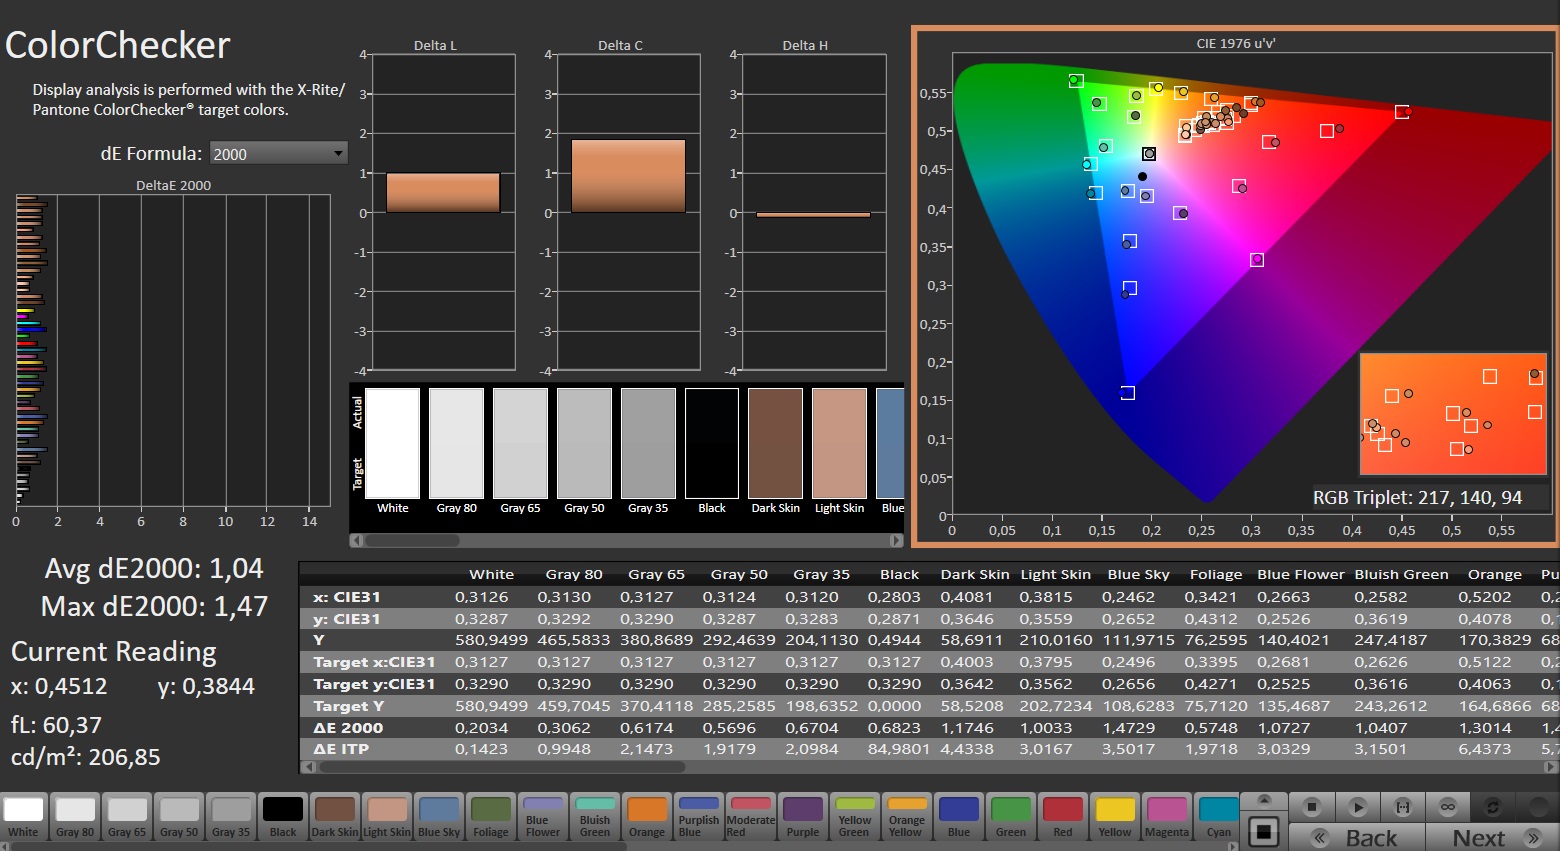
ΔE Color 1.36 | 0.5-29.43 Ø5.1, calibrated: 1.04
ΔE Greyscale 1.4 | 0.57-98 Ø5.3
72.4% AdobeRGB 1998 (Argyll 2.2.0 3D)
99.6% sRGB (Argyll 2.2.0 3D)
70.3% Display P3 (Argyll 2.2.0 3D)
Gamma: 2.253
| Lenovo Legion Slim 7 16APH8 BOE NE160QDM-NZ3, IPS, 2560x1600, 16.00 | Asus ROG Flow X16 GV601V TMX1603 (TL160ADMP03-0), IPS, 2560x1600, 16.00 | Alienware m16 R1 Intel BOE NE16NYB, IPS, 2560x1600, 16.00 | Acer Predator Helios 16 PH16-71-731Q BOE NE160QDM-NZ2, IPS-LED, 2560x1600, 16.00 | Lenovo Legion Pro 5 16IRX8 AU Optronics B160QAN03.1, IPS, 2560x1600, 16.00 | Lenovo LOQ 16IRH8 AUOC1A5 (B160QAN03.L), IPS, 2560x1600, 16.00 | |
|---|---|---|---|---|---|---|
| Display | 18% | -3% | 18% | 0% | -0% | |
| Display P3 Coverage | 70.3 | 96.61 37% | 67.7 -4% | 97.1 38% | 71.2 1% | 70.5 0% |
| sRGB Coverage | 99.6 | 99.92 0% | 97.2 -2% | 100 0% | 98.8 -1% | 98.9 -1% |
| AdobeRGB 1998 Coverage | 72.4 | 84.63 17% | 70 -3% | 84.7 17% | 73.3 1% | 72.6 0% |
| Response Times | 21% | 22% | -8% | -46% | 9% | |
| Response Time Grey 50% / Grey 80% * | 12.6 ? | 3.8 ? 70% | 4 ? 68% | 13.6 ? -8% | 14.5 ? -15% | 7.2 ? 43% |
| Response Time Black / White * | 5.9 ? | 7.6 ? -29% | 7.3 ? -24% | 6.4 ? -8% | 10.4 ? -76% | 7.4 ? -25% |
| PWM Frequency | ||||||
| Screen | -25% | -32% | -17% | -3% | -7% | |
| Brightness middle | 545 | 486 -11% | 306 -44% | 511 -6% | 405.7 -26% | 407 -25% |
| Brightness | 502 | 469 -7% | 302 -40% | 498 -1% | 368 -27% | 369 -26% |
| Brightness Distribution | 82 | 91 11% | 89 9% | 94 15% | 87 6% | 85 4% |
| Black Level * | 0.48 | 0.39 19% | 0.3 37% | 0.36 25% | 0.38 21% | 0.45 6% |
| Contrast | 1135 | 1246 10% | 1020 -10% | 1419 25% | 1068 -6% | 904 -20% |
| Colorchecker dE 2000 * | 1.36 | 2.27 -67% | 2.57 -89% | 1.76 -29% | 1.65 -21% | 1.43 -5% |
| Colorchecker dE 2000 max. * | 3.11 | 5.73 -84% | 4.26 -37% | 3.7 -19% | 4.2 -35% | 3.58 -15% |
| Colorchecker dE 2000 calibrated * | 1.04 | 0.6 42% | 0.85 18% | 1.56 -50% | 0.53 49% | 1.07 -3% |
| Greyscale dE 2000 * | 1.4 | 3.36 -140% | 3.3 -136% | 3 -114% | 1.2 14% | 1.13 19% |
| Gamma | 2.253 98% | 2.46 89% | 1.997 110% | 2.33 94% | 2.3 96% | 2.5 88% |
| CCT | 6631 98% | 6625 98% | 6895 94% | 6341 103% | 6453 101% | 6526 100% |
| Total Average (Program / Settings) | 5% /
-9% | -4% /
-18% | -2% /
-8% | -16% /
-8% | 1% /
-3% |
* ... smaller is better
Apart from the color space, which could be slightly greater considering the 70% DCI-P3 and 72% AdobeRGB coverage (in comparison to the Alienware m16 and the Acer Predator Helios 16), the WQXGA screen works exceedingly well in almost every aspect. Thanks to the factory calibration, the color accuracy is exceptional right from the start. Additionally, the response times of the 240 Hz panel are decent, measuring just under 6 ms for black-to-white transitions and 12 ms for grey-to-grey transitions.
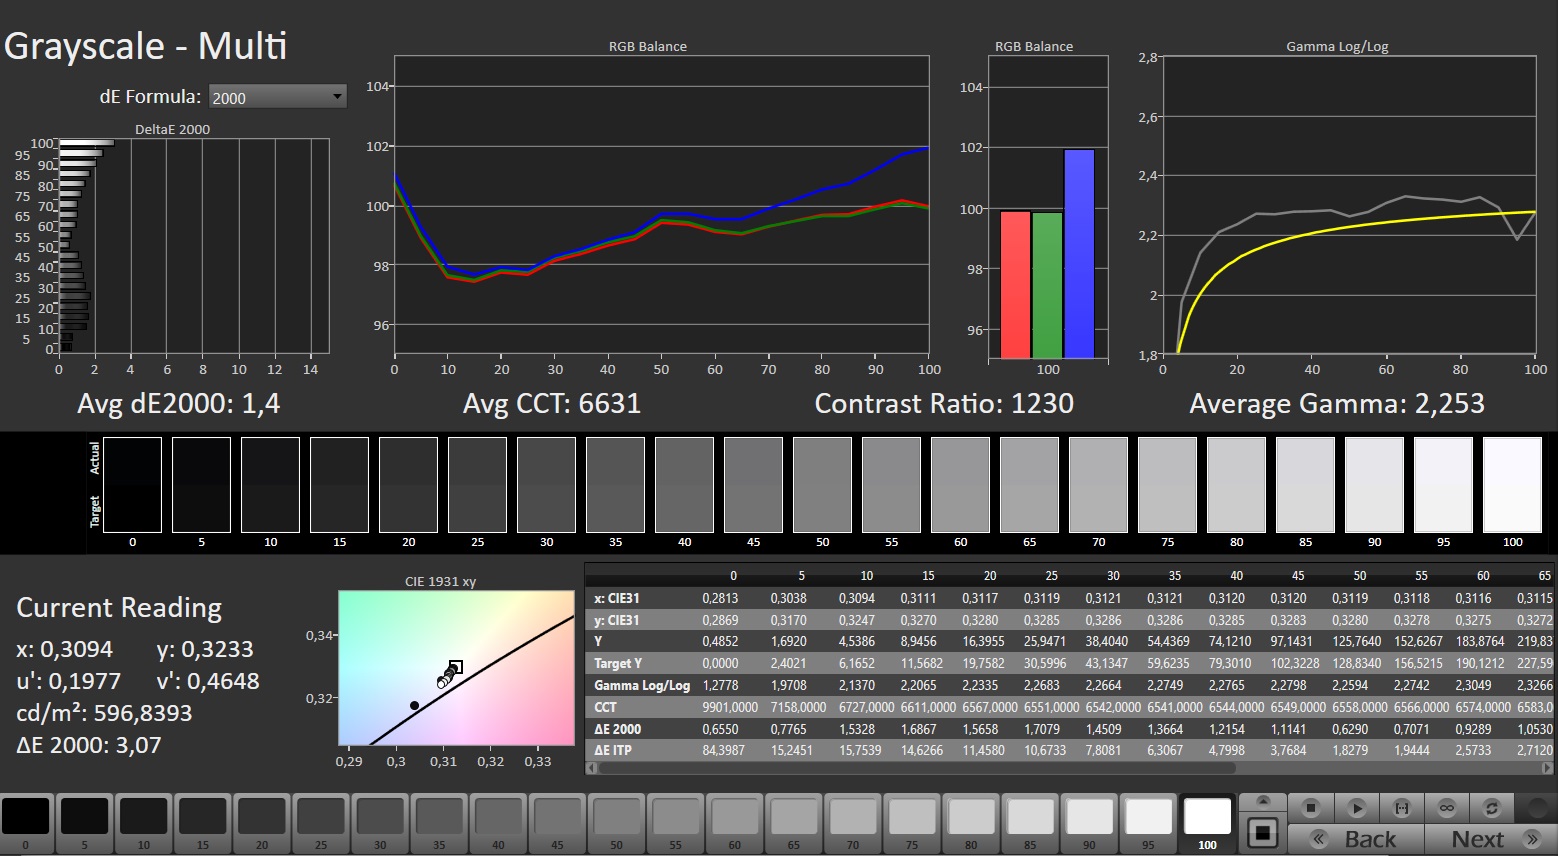
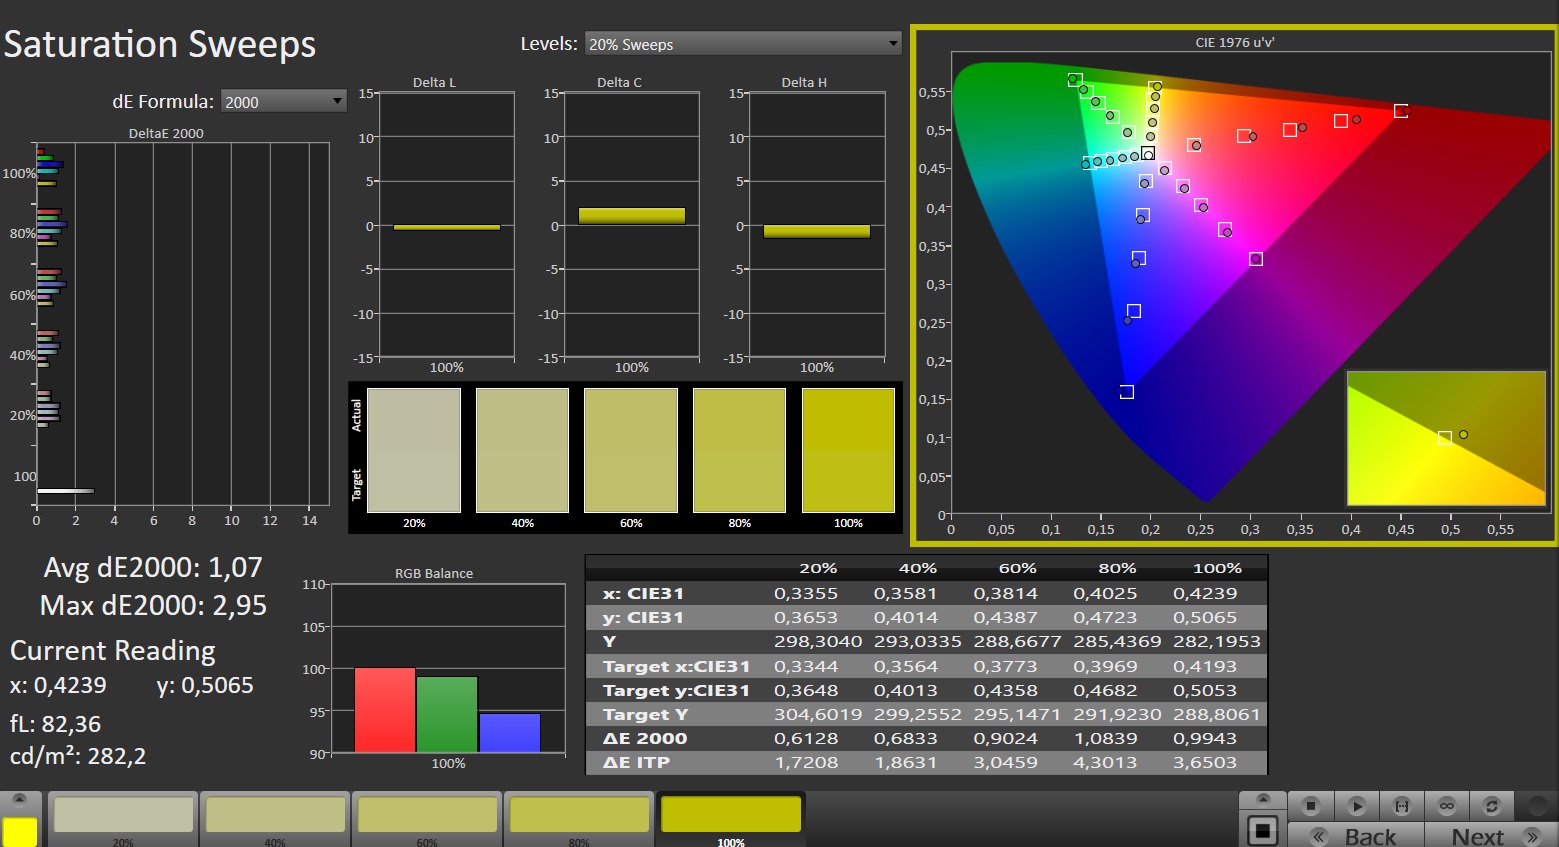
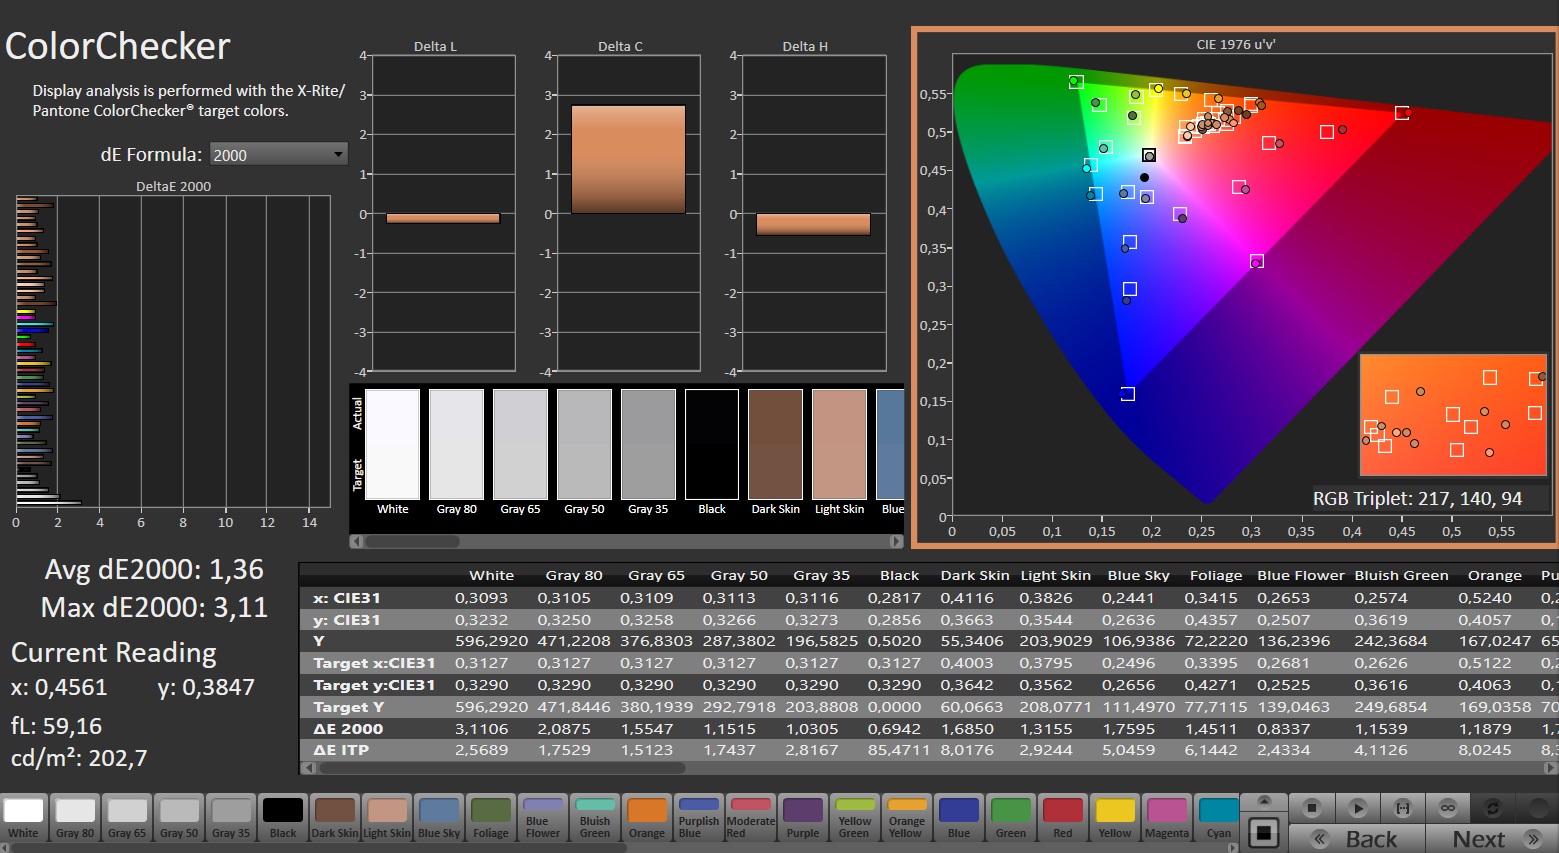
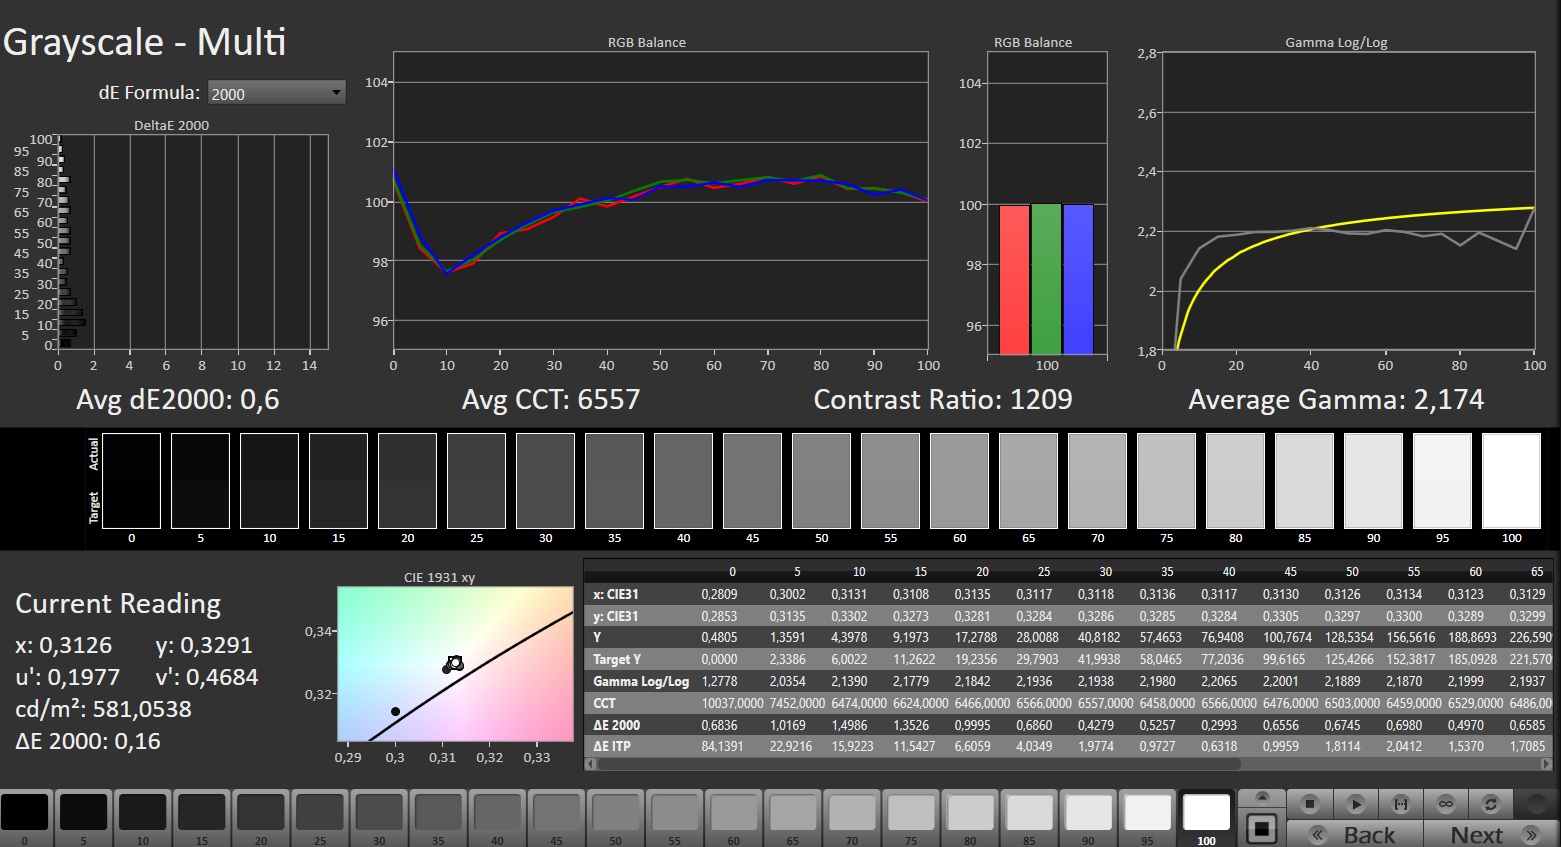

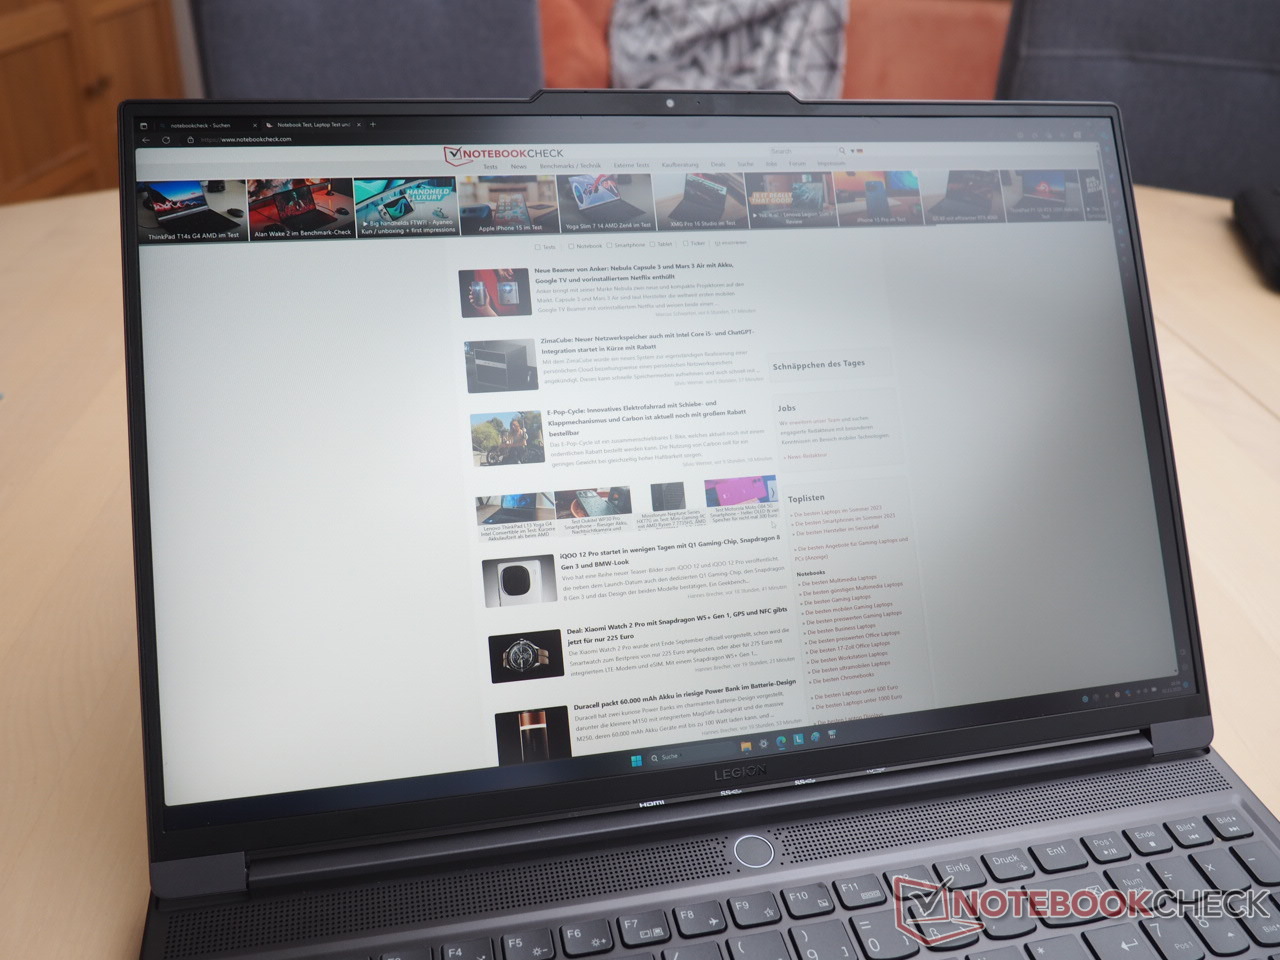
The brightness is particularly noteworthy: an average value of 502 cd/m2 is pretty high for an IPS screen and even exceeds the company's standards for SDR room brightness (400 cd/m2). Gamers will appreciate the FreeSync and GSync support. Despite having the maximum brightness in the test field, the contrast does not stand out among the competitors. This is due to the unsatisfactory black value of 0.48 cd/m².

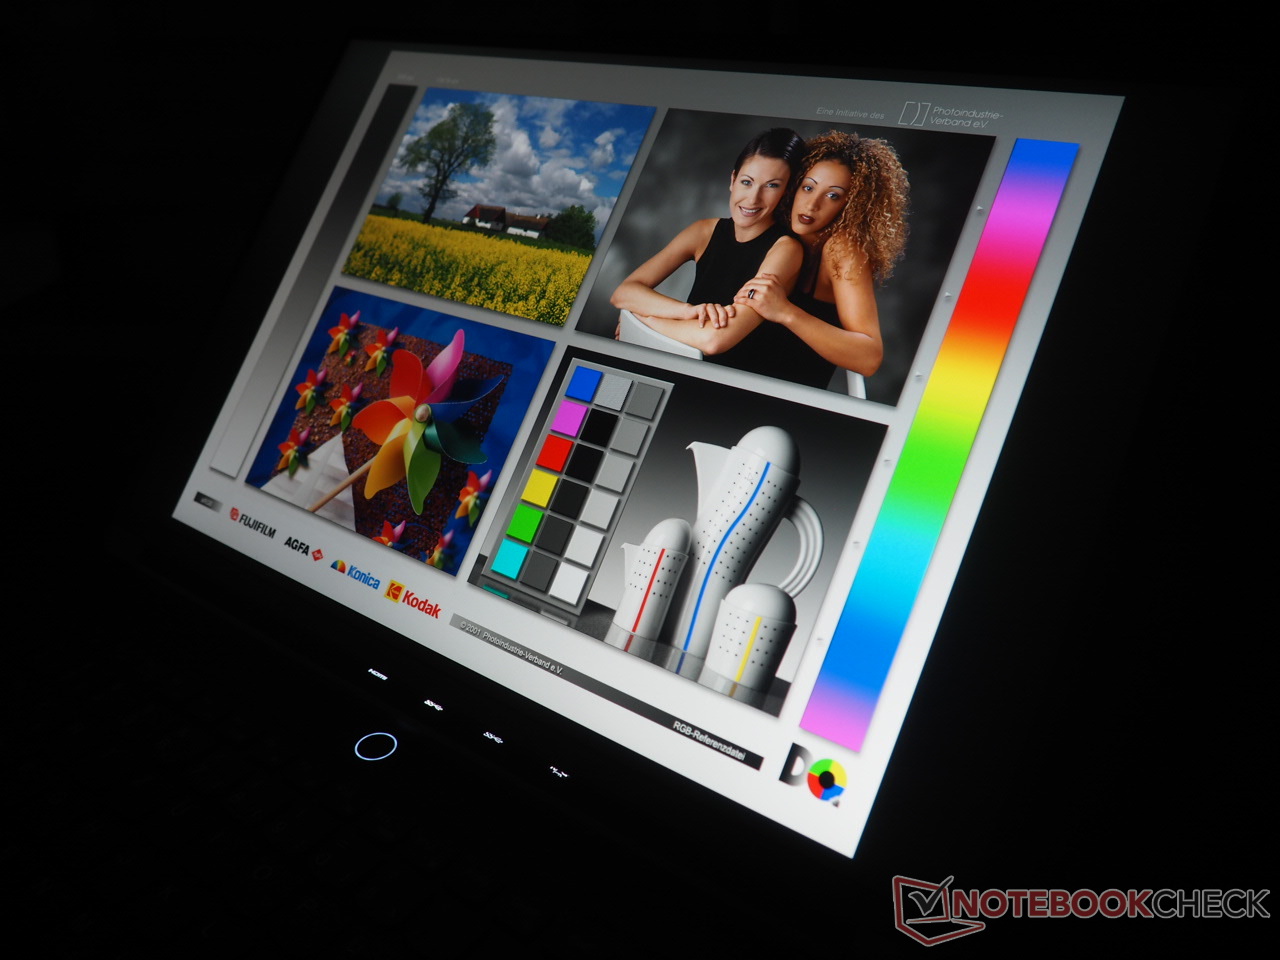
The viewing angles adhere to the typical IPS standard, as evident from our photo. There were no noticeable screen flickering issues.
Display Response Times
| ↔ Response Time Black to White | ||
|---|---|---|
| 5.9 ms ... rise ↗ and fall ↘ combined | ↗ 1.9 ms rise | 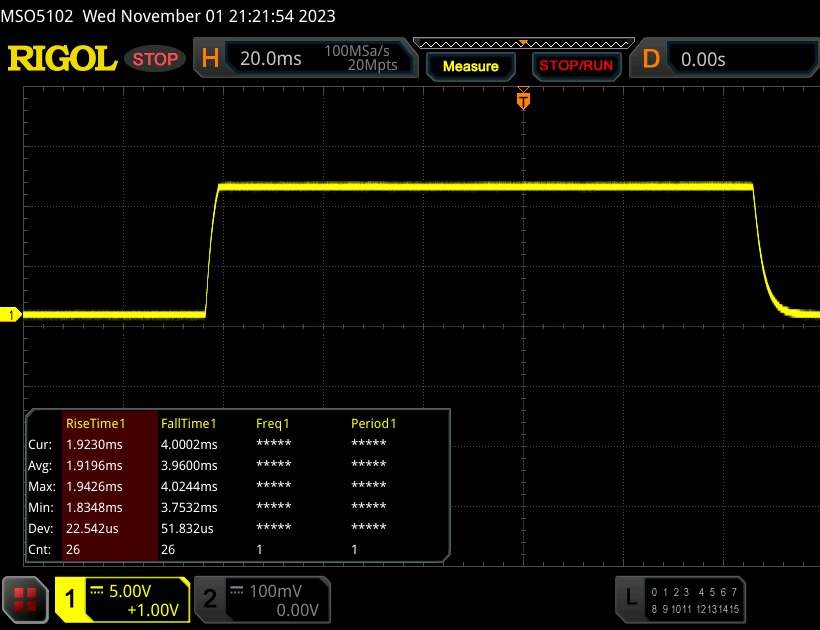 |
| ↘ 4 ms fall | ||
| The screen shows very fast response rates in our tests and should be very well suited for fast-paced gaming. In comparison, all tested devices range from 0.1 (minimum) to 240 (maximum) ms. » 12 % of all devices are better. This means that the measured response time is better than the average of all tested devices (21.8 ms). | ||
| ↔ Response Time 50% Grey to 80% Grey | ||
| 12.6 ms ... rise ↗ and fall ↘ combined | ↗ 6.1 ms rise | 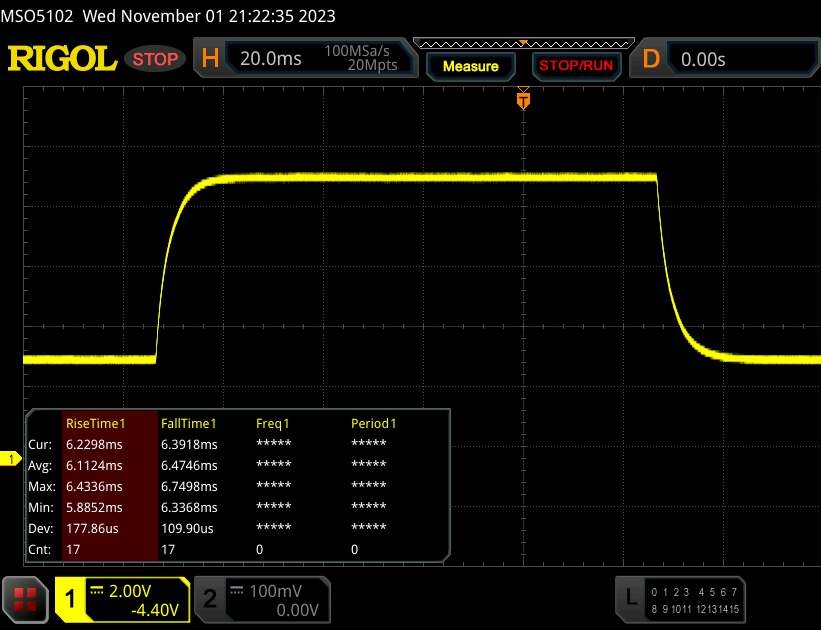 |
| ↘ 6.5 ms fall | ||
| The screen shows good response rates in our tests, but may be too slow for competitive gamers. In comparison, all tested devices range from 0.2 (minimum) to 636 (maximum) ms. » 19 % of all devices are better. This means that the measured response time is better than the average of all tested devices (34.3 ms). | ||
Screen Flickering / PWM (Pulse-Width Modulation)
| Screen flickering / PWM not detected | 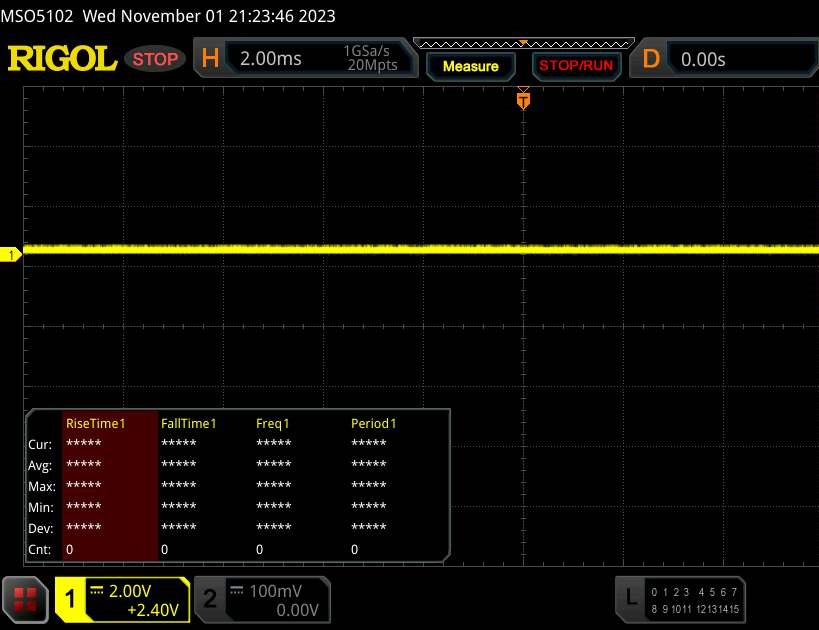 | ||
In comparison: 53 % of all tested devices do not use PWM to dim the display. If PWM was detected, an average of 18716 (minimum: 5 - maximum: 3846000) Hz was measured. | |||
Performance
The GeForce RTX 4060 positions the Legion in the mid-range category of gaming notebooks. With 32 GB of RAM and a 1 TB SSD, it should be enough for the majority of buyers for the time being. Those seeking higher performance can opt for the RTX 4070 version. But Lenovo does not currently offer an RTX 4080 or RTX 4090 for the Slim 7.


Testing Conditions
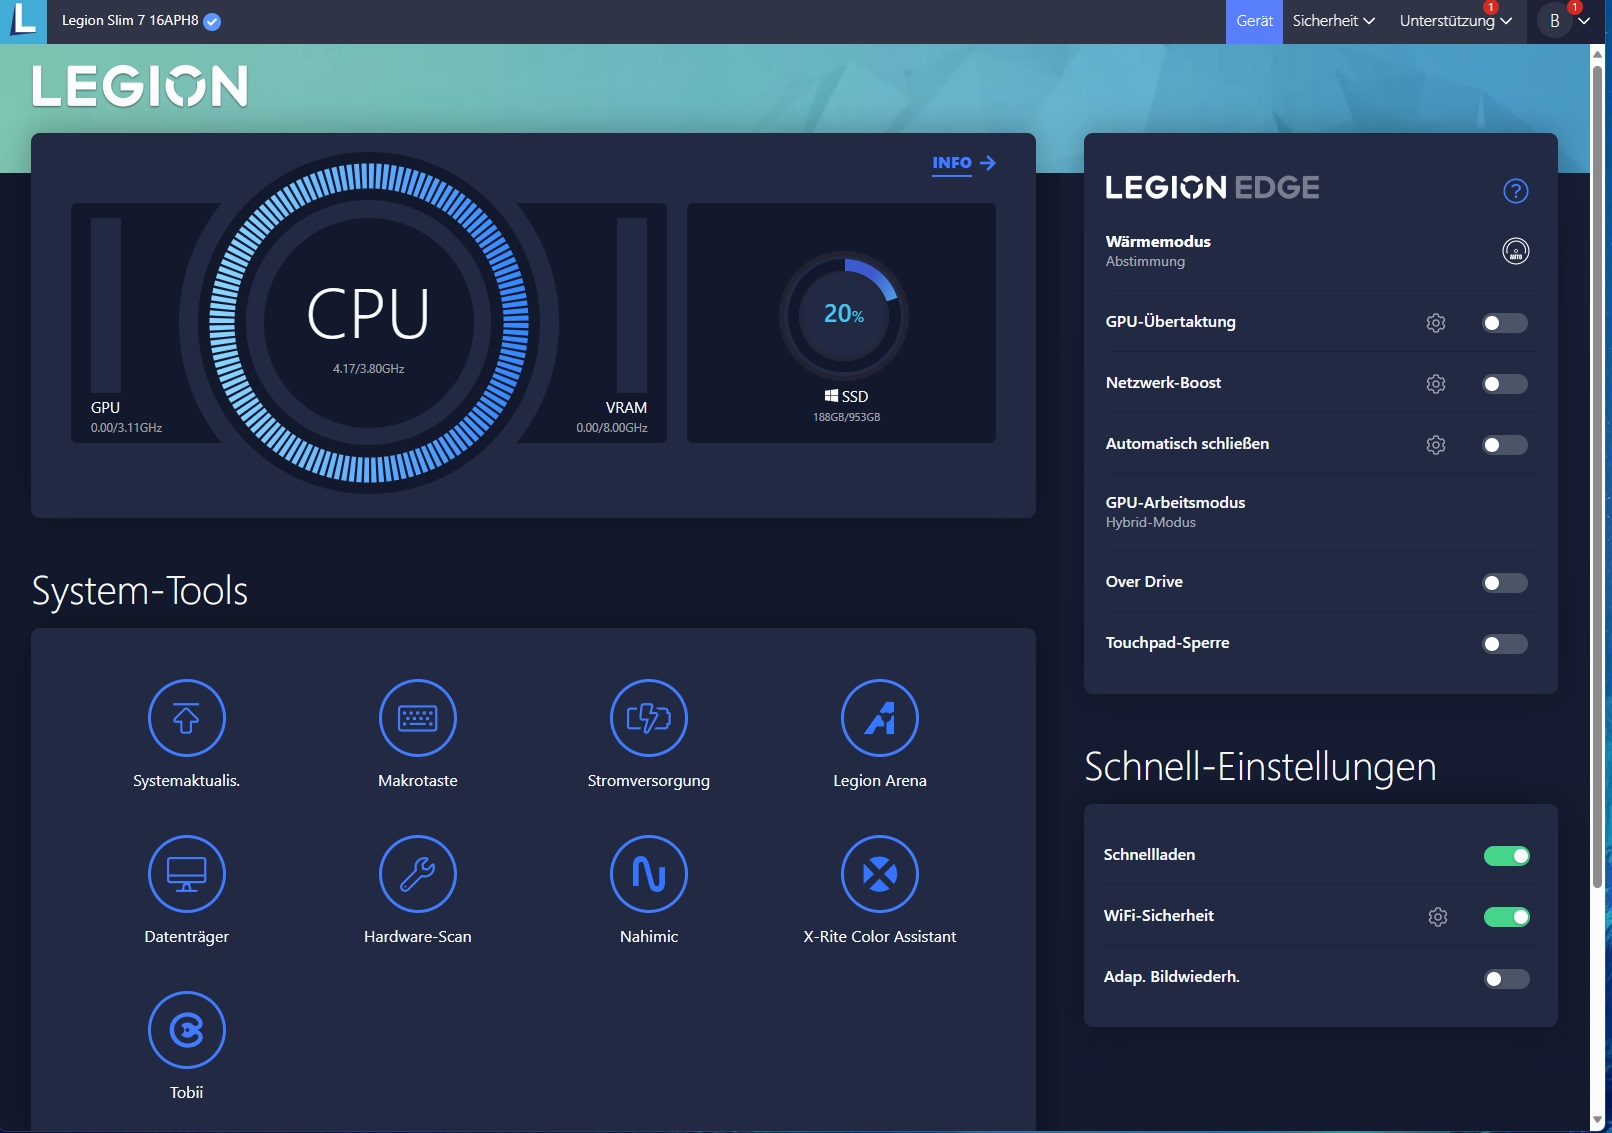
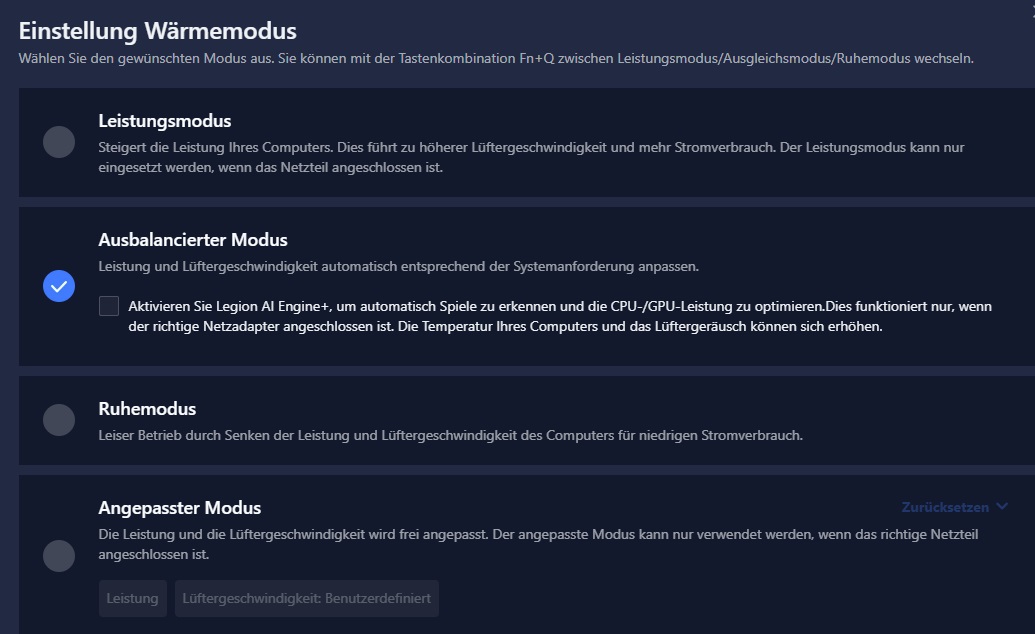
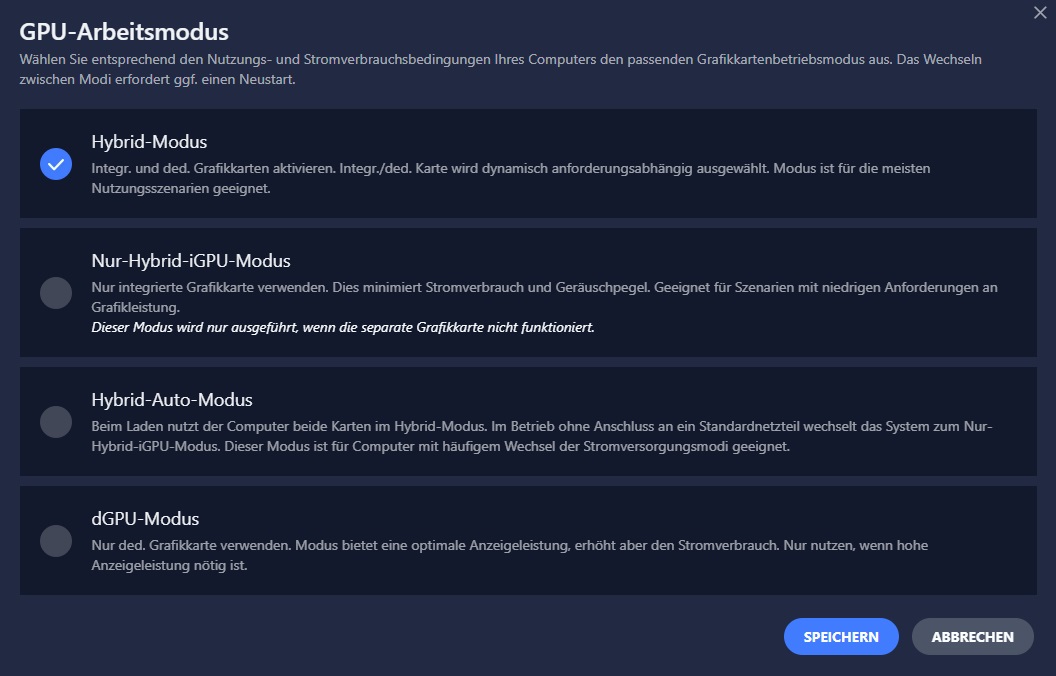
The pre-installed Lenovo Vantage software is notable for its extensive customization capabilities. Alongside the thermal mode, users can also choose the GPU work mode. As the FPS increase in the Performance profile is not proportional to the higher volume (as shown in the table), we conducted all measurements in the Balanced profile. The default graphics switching (hybrid mode) was always on.
| Quiet | Balanced | Performance | |
|---|---|---|---|
| Noise (Witcher 3, FHD/Ultra) | 36 dB(A) | 47 dB(A) | 52 dB(A) |
| Performance (Witcher 3, FHD/Ultra) | ~86 fps | ~98 fps | ~100 fps |
| Power Limit 1 (HWInfo) | 50 w | 54 w | 100 w |
| Power Limit 2 (HWInfo) | 60 w | 65 w | 125 w |
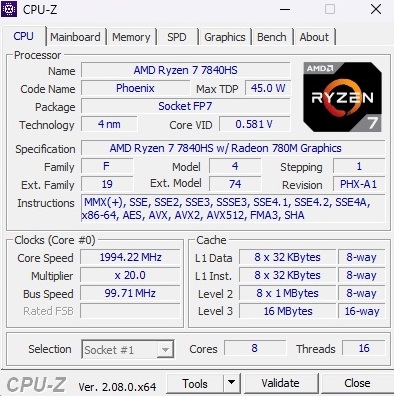
Processor
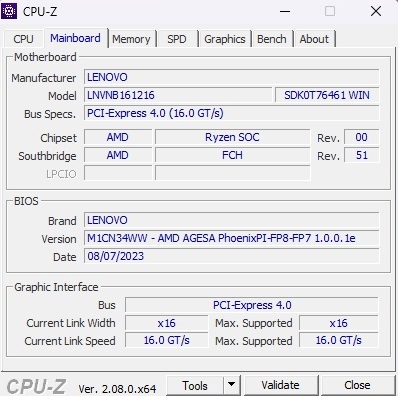
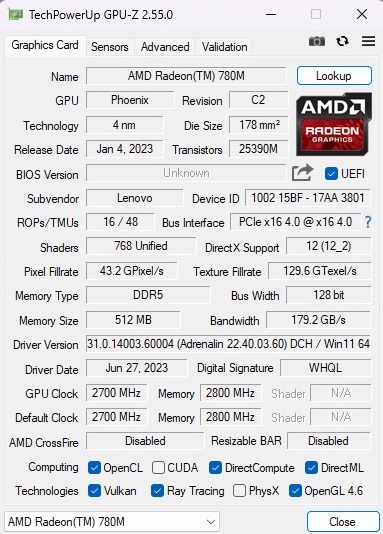
The Ryzen 7 7840HS is an eight-core processor equipped with 16 MB of L3 cache and the ability to handle up to 16 threads simultaneously, thanks to SMT. Additionally, the 4 nm chip features a relatively fast integrated GPU, the Radeon 780M, responsible for image calculations and display, for less demanding tasks like office work, video streaming, and web browsing. During benchmark tests, the CPU performance ranks between the Core i7-13620H and the Core i7-13700HX. One notable advantage of the AMD processor lies in its consistent performance improvement, a trait not fully applicable or only partially true for many Intel counterparts, as evident in benchmarks such as the Cinebench loop.
Cinebench R15 Multi Loop
| Cinebench R23 | |
| Multi Core | |
| Acer Predator Helios 16 PH16-71-731Q | |
| Alienware m16 R1 Intel | |
| Lenovo Legion Pro 5 16IRX8 | |
| Asus ROG Flow X16 GV601V | |
| Average of class Gaming (2435 - 34521, n=240, last 2 years) | |
| Average AMD Ryzen 7 7840HS (15821 - 17214, n=10) | |
| Lenovo Legion Slim 7 16APH8 | |
| Lenovo LOQ 16IRH8 | |
| Single Core | |
| Asus ROG Flow X16 GV601V | |
| Alienware m16 R1 Intel | |
| Acer Predator Helios 16 PH16-71-731Q | |
| Lenovo LOQ 16IRH8 | |
| Average AMD Ryzen 7 7840HS (1754 - 1812, n=10) | |
| Lenovo Legion Slim 7 16APH8 | |
| Average of class Gaming (527 - 2169, n=238, last 2 years) | |
| Lenovo Legion Pro 5 16IRX8 | |
| Cinebench R20 | |
| CPU (Multi Core) | |
| Acer Predator Helios 16 PH16-71-731Q | |
| Alienware m16 R1 Intel | |
| Asus ROG Flow X16 GV601V | |
| Lenovo Legion Pro 5 16IRX8 | |
| Average of class Gaming (930 - 13769, n=238, last 2 years) | |
| Average AMD Ryzen 7 7840HS (6200 - 6744, n=10) | |
| Lenovo Legion Slim 7 16APH8 | |
| Lenovo LOQ 16IRH8 | |
| CPU (Single Core) | |
| Asus ROG Flow X16 GV601V | |
| Alienware m16 R1 Intel | |
| Acer Predator Helios 16 PH16-71-731Q | |
| Lenovo LOQ 16IRH8 | |
| Average AMD Ryzen 7 7840HS (668 - 705, n=10) | |
| Average of class Gaming (169 - 825, n=238, last 2 years) | |
| Lenovo Legion Slim 7 16APH8 | |
| Lenovo Legion Pro 5 16IRX8 | |
| Cinebench R15 | |
| CPU Multi 64Bit | |
| Acer Predator Helios 16 PH16-71-731Q | |
| Acer Predator Helios 16 PH16-71-731Q | |
| Lenovo Legion Pro 5 16IRX8 | |
| Alienware m16 R1 Intel | |
| Asus ROG Flow X16 GV601V | |
| Average of class Gaming (400 - 5663, n=244, last 2 years) | |
| Average AMD Ryzen 7 7840HS (2473 - 2729, n=10) | |
| Lenovo Legion Slim 7 16APH8 | |
| Lenovo LOQ 16IRH8 | |
| CPU Single 64Bit | |
| Asus ROG Flow X16 GV601V | |
| Average AMD Ryzen 7 7840HS (270 - 286, n=10) | |
| Alienware m16 R1 Intel | |
| Lenovo Legion Slim 7 16APH8 | |
| Acer Predator Helios 16 PH16-71-731Q | |
| Lenovo Legion Pro 5 16IRX8 | |
| Lenovo LOQ 16IRH8 | |
| Average of class Gaming (79.2 - 312, n=243, last 2 years) | |
| Blender - v2.79 BMW27 CPU | |
| Lenovo LOQ 16IRH8 | |
| Average of class Gaming (91 - 1259, n=236, last 2 years) | |
| Average AMD Ryzen 7 7840HS (185 - 229, n=10) | |
| Lenovo Legion Slim 7 16APH8 | |
| Asus ROG Flow X16 GV601V | |
| Acer Predator Helios 16 PH16-71-731Q | |
| Alienware m16 R1 Intel | |
| Lenovo Legion Pro 5 16IRX8 | |
| 7-Zip 18.03 | |
| 7z b 4 | |
| Alienware m16 R1 Intel | |
| Acer Predator Helios 16 PH16-71-731Q | |
| Lenovo Legion Pro 5 16IRX8 | |
| Asus ROG Flow X16 GV601V | |
| Average of class Gaming (11386 - 140932, n=235, last 2 years) | |
| Lenovo Legion Slim 7 16APH8 | |
| Average AMD Ryzen 7 7840HS (59538 - 73035, n=10) | |
| Lenovo LOQ 16IRH8 | |
| 7z b 4 -mmt1 | |
| Lenovo Legion Slim 7 16APH8 | |
| Average AMD Ryzen 7 7840HS (6157 - 6749, n=10) | |
| Alienware m16 R1 Intel | |
| Asus ROG Flow X16 GV601V | |
| Acer Predator Helios 16 PH16-71-731Q | |
| Average of class Gaming (2685 - 7581, n=236, last 2 years) | |
| Lenovo LOQ 16IRH8 | |
| Lenovo Legion Pro 5 16IRX8 | |
| Geekbench 5.5 | |
| Multi-Core | |
| Acer Predator Helios 16 PH16-71-731Q | |
| Alienware m16 R1 Intel | |
| Lenovo Legion Pro 5 16IRX8 | |
| Asus ROG Flow X16 GV601V | |
| Average of class Gaming (1946 - 22200, n=242, last 2 years) | |
| Lenovo LOQ 16IRH8 | |
| Lenovo Legion Slim 7 16APH8 | |
| Average AMD Ryzen 7 7840HS (8446 - 12077, n=10) | |
| Single-Core | |
| Asus ROG Flow X16 GV601V | |
| Average AMD Ryzen 7 7840HS (1837 - 2010, n=10) | |
| Lenovo Legion Slim 7 16APH8 | |
| Acer Predator Helios 16 PH16-71-731Q | |
| Alienware m16 R1 Intel | |
| Lenovo LOQ 16IRH8 | |
| Lenovo Legion Pro 5 16IRX8 | |
| Average of class Gaming (158 - 2139, n=242, last 2 years) | |
| HWBOT x265 Benchmark v2.2 - 4k Preset | |
| Lenovo Legion Pro 5 16IRX8 | |
| Acer Predator Helios 16 PH16-71-731Q | |
| Alienware m16 R1 Intel | |
| Asus ROG Flow X16 GV601V | |
| Lenovo Legion Slim 7 16APH8 | |
| Average of class Gaming (3 - 37.6, n=239, last 2 years) | |
| Average AMD Ryzen 7 7840HS (11.7 - 21.8, n=10) | |
| Lenovo LOQ 16IRH8 | |
| LibreOffice - 20 Documents To PDF | |
| Lenovo Legion Slim 7 16APH8 | |
| Average AMD Ryzen 7 7840HS (38.3 - 68.3, n=10) | |
| Average of class Gaming (32.8 - 332, n=234, last 2 years) | |
| Lenovo LOQ 16IRH8 | |
| Alienware m16 R1 Intel | |
| Acer Predator Helios 16 PH16-71-731Q | |
| Asus ROG Flow X16 GV601V | |
| Lenovo Legion Pro 5 16IRX8 | |
| R Benchmark 2.5 - Overall mean | |
| Average of class Gaming (0.375 - 4.47, n=236, last 2 years) | |
| Lenovo Legion Pro 5 16IRX8 | |
| Lenovo LOQ 16IRH8 | |
| Lenovo Legion Slim 7 16APH8 | |
| Alienware m16 R1 Intel | |
| Average AMD Ryzen 7 7840HS (0.4184 - 0.454, n=10) | |
| Acer Predator Helios 16 PH16-71-731Q | |
| Asus ROG Flow X16 GV601V | |
* ... smaller is better
AIDA64: FP32 Ray-Trace | FPU Julia | CPU SHA3 | CPU Queen | FPU SinJulia | FPU Mandel | CPU AES | CPU ZLib | FP64 Ray-Trace | CPU PhotoWorxx
| AIDA64 / FP32 Ray-Trace | |
| Average AMD Ryzen 7 7840HS (25041 - 28921, n=10) | |
| Lenovo Legion Slim 7 16APH8 | |
| Lenovo Legion Pro 5 16IRX8 | |
| Alienware m16 R1 Intel | |
| Acer Predator Helios 16 PH16-71-731Q | |
| Average of class Gaming (2585 - 55084, n=232, last 2 years) | |
| Asus ROG Flow X16 GV601V | |
| Lenovo LOQ 16IRH8 | |
| AIDA64 / FPU Julia | |
| Average AMD Ryzen 7 7840HS (109633 - 123167, n=10) | |
| Lenovo Legion Slim 7 16APH8 | |
| Lenovo Legion Pro 5 16IRX8 | |
| Alienware m16 R1 Intel | |
| Acer Predator Helios 16 PH16-71-731Q | |
| Asus ROG Flow X16 GV601V | |
| Average of class Gaming (12439 - 234848, n=232, last 2 years) | |
| Lenovo LOQ 16IRH8 | |
| AIDA64 / CPU SHA3 | |
| Alienware m16 R1 Intel | |
| Average AMD Ryzen 7 7840HS (4293 - 5096, n=10) | |
| Lenovo Legion Slim 7 16APH8 | |
| Lenovo Legion Pro 5 16IRX8 | |
| Acer Predator Helios 16 PH16-71-731Q | |
| Asus ROG Flow X16 GV601V | |
| Average of class Gaming (629 - 9930, n=232, last 2 years) | |
| Lenovo LOQ 16IRH8 | |
| AIDA64 / CPU Queen | |
| Lenovo Legion Slim 7 16APH8 | |
| Average AMD Ryzen 7 7840HS (105028 - 122681, n=10) | |
| Alienware m16 R1 Intel | |
| Acer Predator Helios 16 PH16-71-731Q | |
| Lenovo Legion Pro 5 16IRX8 | |
| Asus ROG Flow X16 GV601V | |
| Average of class Gaming (15371 - 186519, n=232, last 2 years) | |
| Lenovo LOQ 16IRH8 | |
| AIDA64 / FPU SinJulia | |
| Lenovo Legion Slim 7 16APH8 | |
| Average AMD Ryzen 7 7840HS (14705 - 15525, n=10) | |
| Alienware m16 R1 Intel | |
| Lenovo Legion Pro 5 16IRX8 | |
| Acer Predator Helios 16 PH16-71-731Q | |
| Average of class Gaming (2137 - 30810, n=232, last 2 years) | |
| Asus ROG Flow X16 GV601V | |
| Lenovo LOQ 16IRH8 | |
| AIDA64 / FPU Mandel | |
| Average AMD Ryzen 7 7840HS (58441 - 65812, n=10) | |
| Lenovo Legion Slim 7 16APH8 | |
| Lenovo Legion Pro 5 16IRX8 | |
| Alienware m16 R1 Intel | |
| Acer Predator Helios 16 PH16-71-731Q | |
| Average of class Gaming (7135 - 124377, n=232, last 2 years) | |
| Asus ROG Flow X16 GV601V | |
| Lenovo LOQ 16IRH8 | |
| AIDA64 / CPU AES | |
| Alienware m16 R1 Intel | |
| Acer Predator Helios 16 PH16-71-731Q | |
| Average AMD Ryzen 7 7840HS (67389 - 177158, n=10) | |
| Average of class Gaming (18146 - 328679, n=232, last 2 years) | |
| Lenovo Legion Pro 5 16IRX8 | |
| Asus ROG Flow X16 GV601V | |
| Lenovo Legion Slim 7 16APH8 | |
| Lenovo LOQ 16IRH8 | |
| AIDA64 / CPU ZLib | |
| Acer Predator Helios 16 PH16-71-731Q | |
| Alienware m16 R1 Intel | |
| Lenovo Legion Pro 5 16IRX8 | |
| Asus ROG Flow X16 GV601V | |
| Average of class Gaming (150.9 - 2231, n=232, last 2 years) | |
| Lenovo Legion Slim 7 16APH8 | |
| Average AMD Ryzen 7 7840HS (949 - 1123, n=10) | |
| Lenovo LOQ 16IRH8 | |
| AIDA64 / FP64 Ray-Trace | |
| Average AMD Ryzen 7 7840HS (13441 - 15599, n=10) | |
| Lenovo Legion Slim 7 16APH8 | |
| Lenovo Legion Pro 5 16IRX8 | |
| Alienware m16 R1 Intel | |
| Acer Predator Helios 16 PH16-71-731Q | |
| Asus ROG Flow X16 GV601V | |
| Average of class Gaming (1437 - 29473, n=232, last 2 years) | |
| Lenovo LOQ 16IRH8 | |
| AIDA64 / CPU PhotoWorxx | |
| Lenovo Legion Slim 7 16APH8 | |
| Asus ROG Flow X16 GV601V | |
| Lenovo Legion Pro 5 16IRX8 | |
| Alienware m16 R1 Intel | |
| Acer Predator Helios 16 PH16-71-731Q | |
| Average AMD Ryzen 7 7840HS (17615 - 41088, n=10) | |
| Average of class Gaming (8341 - 60161, n=233, last 2 years) | |
| Lenovo LOQ 16IRH8 | |
System Performance
In terms of system performance, the Slim 7 easily competes with its rivals, scoring 7,502 points in PCMark 10. The DDR5 memory, known for its exceptional speed, outpaces the average. Moreover, the computer exhibits a pleasant and swift response in practical usage scenarios.
CrossMark: Overall | Productivity | Creativity | Responsiveness
| PCMark 10 / Score | |
| Asus ROG Flow X16 GV601V | |
| Average AMD Ryzen 7 7840HS, NVIDIA GeForce RTX 4060 Laptop GPU (7502 - 7946, n=4) | |
| Acer Predator Helios 16 PH16-71-731Q | |
| Lenovo Legion Pro 5 16IRX8 | |
| Lenovo Legion Slim 7 16APH8 | |
| Average of class Gaming (4477 - 9331, n=200, last 2 years) | |
| Alienware m16 R1 Intel | |
| Lenovo LOQ 16IRH8 | |
| PCMark 10 / Essentials | |
| Asus ROG Flow X16 GV601V | |
| Acer Predator Helios 16 PH16-71-731Q | |
| Lenovo Legion Pro 5 16IRX8 | |
| Average AMD Ryzen 7 7840HS, NVIDIA GeForce RTX 4060 Laptop GPU (10441 - 11169, n=4) | |
| Alienware m16 R1 Intel | |
| Average of class Gaming (7334 - 12176, n=199, last 2 years) | |
| Lenovo Legion Slim 7 16APH8 | |
| Lenovo LOQ 16IRH8 | |
| PCMark 10 / Productivity | |
| Acer Predator Helios 16 PH16-71-731Q | |
| Asus ROG Flow X16 GV601V | |
| Average AMD Ryzen 7 7840HS, NVIDIA GeForce RTX 4060 Laptop GPU (9575 - 10273, n=4) | |
| Average of class Gaming (6161 - 11833, n=199, last 2 years) | |
| Lenovo Legion Slim 7 16APH8 | |
| Alienware m16 R1 Intel | |
| Lenovo Legion Pro 5 16IRX8 | |
| Lenovo LOQ 16IRH8 | |
| PCMark 10 / Digital Content Creation | |
| Lenovo Legion Pro 5 16IRX8 | |
| Average AMD Ryzen 7 7840HS, NVIDIA GeForce RTX 4060 Laptop GPU (11464 - 12418, n=4) | |
| Lenovo Legion Slim 7 16APH8 | |
| Asus ROG Flow X16 GV601V | |
| Average of class Gaming (5288 - 16424, n=199, last 2 years) | |
| Acer Predator Helios 16 PH16-71-731Q | |
| Alienware m16 R1 Intel | |
| Lenovo LOQ 16IRH8 | |
| CrossMark / Overall | |
| Acer Predator Helios 16 PH16-71-731Q | |
| Alienware m16 R1 Intel | |
| Asus ROG Flow X16 GV601V | |
| Lenovo LOQ 16IRH8 | |
| Average of class Gaming (974 - 2295, n=158, last 2 years) | |
| Average AMD Ryzen 7 7840HS, NVIDIA GeForce RTX 4060 Laptop GPU (1800 - 1866, n=3) | |
| Lenovo Legion Pro 5 16IRX8 | |
| CrossMark / Productivity | |
| Acer Predator Helios 16 PH16-71-731Q | |
| Alienware m16 R1 Intel | |
| Lenovo LOQ 16IRH8 | |
| Asus ROG Flow X16 GV601V | |
| Average of class Gaming (907 - 2166, n=158, last 2 years) | |
| Average AMD Ryzen 7 7840HS, NVIDIA GeForce RTX 4060 Laptop GPU (1743 - 1821, n=3) | |
| Lenovo Legion Pro 5 16IRX8 | |
| CrossMark / Creativity | |
| Acer Predator Helios 16 PH16-71-731Q | |
| Alienware m16 R1 Intel | |
| Asus ROG Flow X16 GV601V | |
| Lenovo LOQ 16IRH8 | |
| Average of class Gaming (1027 - 2514, n=158, last 2 years) | |
| Average AMD Ryzen 7 7840HS, NVIDIA GeForce RTX 4060 Laptop GPU (1908 - 1966, n=3) | |
| Lenovo Legion Pro 5 16IRX8 | |
| CrossMark / Responsiveness | |
| Acer Predator Helios 16 PH16-71-731Q | |
| Alienware m16 R1 Intel | |
| Lenovo LOQ 16IRH8 | |
| Asus ROG Flow X16 GV601V | |
| Average of class Gaming (1029 - 2275, n=158, last 2 years) | |
| Lenovo Legion Pro 5 16IRX8 | |
| Average AMD Ryzen 7 7840HS, NVIDIA GeForce RTX 4060 Laptop GPU (1522 - 1776, n=3) | |
| PCMark 10 Score | 7502 points | |
Help | ||
| AIDA64 / Memory Copy | |
| Lenovo Legion Slim 7 16APH8 | |
| Average AMD Ryzen 7 7840HS (30937 - 72158, n=10) | |
| Asus ROG Flow X16 GV601V | |
| Lenovo Legion Pro 5 16IRX8 | |
| Alienware m16 R1 Intel | |
| Acer Predator Helios 16 PH16-71-731Q | |
| Average of class Gaming (18074 - 88014, n=232, last 2 years) | |
| Lenovo LOQ 16IRH8 | |
| AIDA64 / Memory Read | |
| Asus ROG Flow X16 GV601V | |
| Lenovo Legion Pro 5 16IRX8 | |
| Alienware m16 R1 Intel | |
| Acer Predator Helios 16 PH16-71-731Q | |
| Lenovo LOQ 16IRH8 | |
| Lenovo Legion Slim 7 16APH8 | |
| Average of class Gaming (20318 - 89096, n=232, last 2 years) | |
| Average AMD Ryzen 7 7840HS (30497 - 61911, n=10) | |
| AIDA64 / Memory Write | |
| Lenovo Legion Slim 7 16APH8 | |
| Acer Predator Helios 16 PH16-71-731Q | |
| Average AMD Ryzen 7 7840HS (34590 - 92731, n=10) | |
| Lenovo Legion Pro 5 16IRX8 | |
| Asus ROG Flow X16 GV601V | |
| Average of class Gaming (15975 - 103259, n=232, last 2 years) | |
| Alienware m16 R1 Intel | |
| Lenovo LOQ 16IRH8 | |
| AIDA64 / Memory Latency | |
| Lenovo LOQ 16IRH8 | |
| Asus ROG Flow X16 GV601V | |
| Average AMD Ryzen 7 7840HS (85.1 - 112, n=10) | |
| Lenovo Legion Slim 7 16APH8 | |
| Alienware m16 R1 Intel | |
| Acer Predator Helios 16 PH16-71-731Q | |
| Average of class Gaming (76.2 - 136.8, n=229, last 2 years) | |
| Lenovo Legion Pro 5 16IRX8 | |
* ... smaller is better
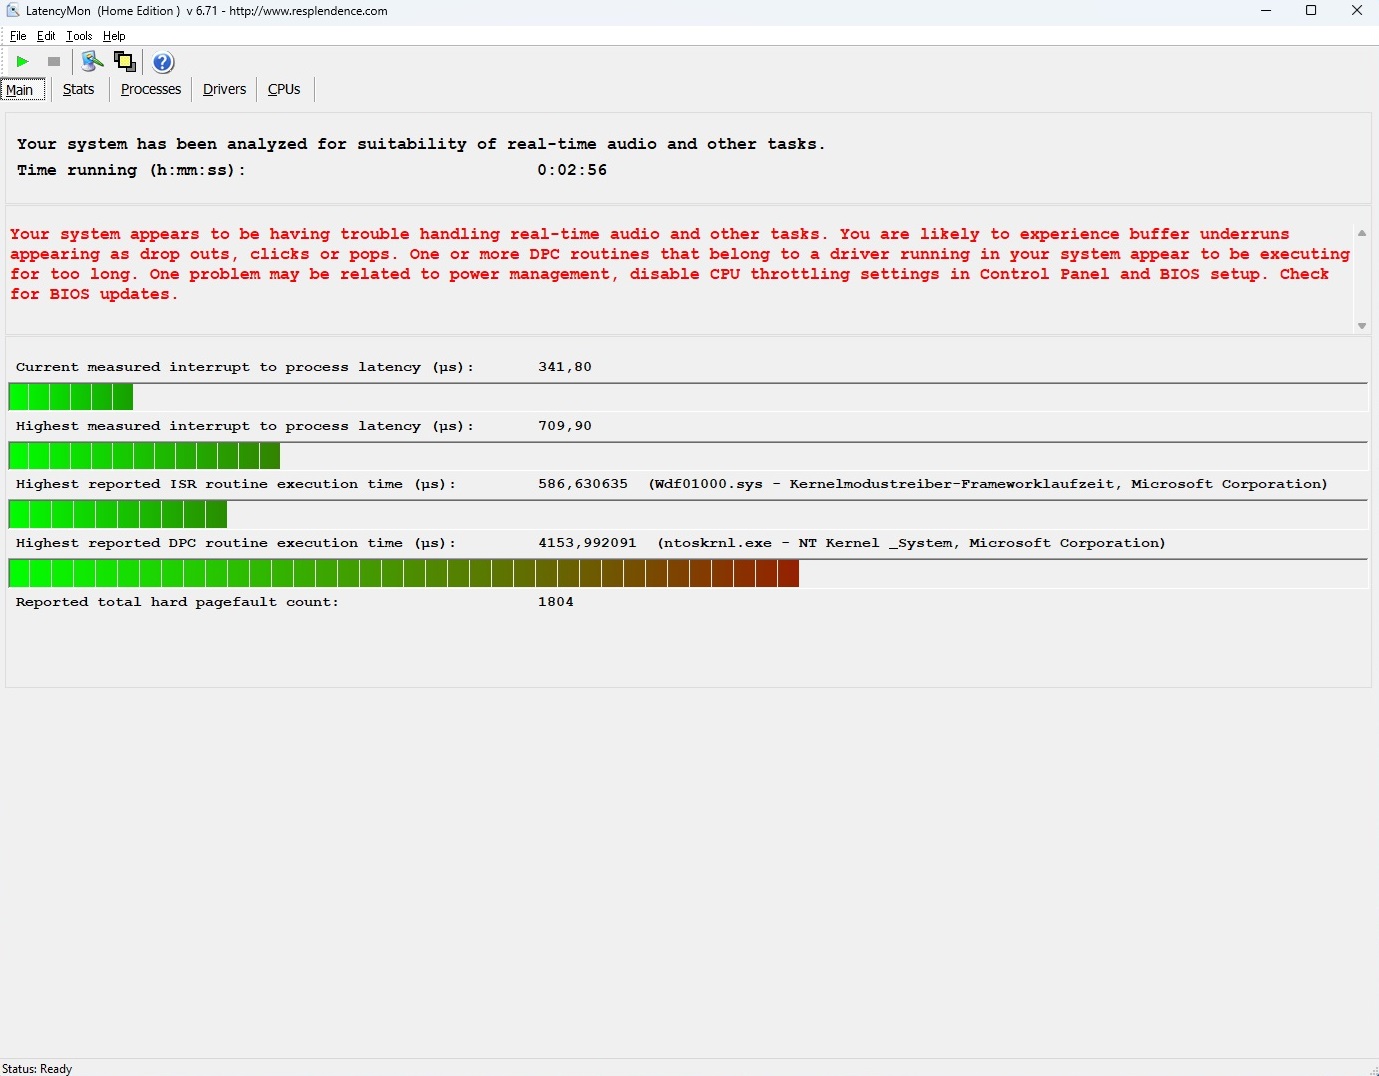
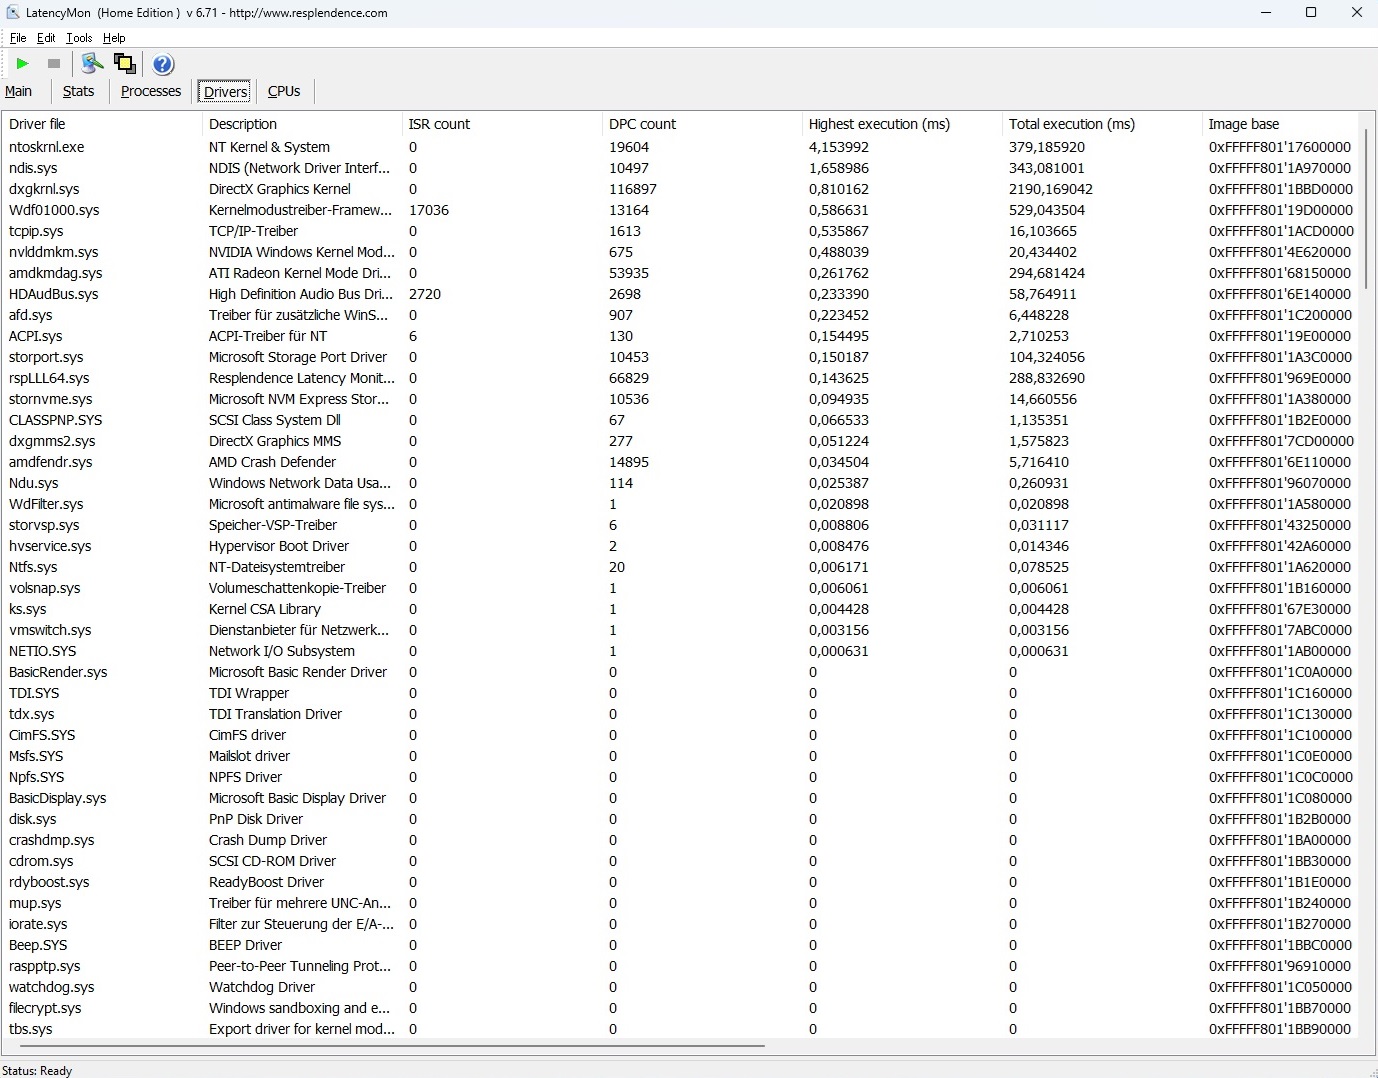
DPC Latency
Although it has the lowest latencies among 16-inch devices in the test, the LatencyMon tool shows possible concerns with real-time audio and video editing.
| DPC Latencies / LatencyMon - interrupt to process latency (max), Web, Youtube, Prime95 | |
| Alienware m16 R1 Intel | |
| Acer Predator Helios 16 PH16-71-731Q | |
| Lenovo LOQ 16IRH8 | |
| Asus ROG Flow X16 GV601V | |
| Lenovo Legion Pro 5 16IRX8 | |
| Lenovo Legion Slim 7 16APH8 | |
* ... smaller is better
Storage Devices
The integrated 1 TB SSD from WDC (model SN810) generally offers excellent speed, but occasionally faces throttling issues under prolonged load. However, these problems are not as severe as those observed in the Acer Predator Helios 16.

* ... smaller is better
Continuous power read: DiskSpd Read Loop, Queue Depth 8
Graphics card
The GeForce RTX 4060 is one of the most popular and successful laptop GPUs right now. While this mid-range model isn't suitable for UHD screens and may have limited future-proofing due to its low 8 GB GDDR6 VRAM architecture, its performance for Full HD (FHD) or Quad HD (QHD) resolutions is nevertheless remarkable.
In synthetic graphics benchmarks, the 3D performance in Balanced mode is comparable to the average RTX 4060 performance so far, although it falls slightly below that of the comparison devices. Notably, the Slim 7 doesn't even come close to reaching the maximum TGP of 140 watts, including Dynamic Boost.
| 3DMark 11 - 1280x720 Performance GPU | |
| Average of class Gaming (1029 - 72070, n=235, last 2 years) | |
| Lenovo Legion Pro 5 16IRX8 | |
| Alienware m16 R1 Intel | |
| Acer Predator Helios 16 PH16-71-731Q | |
| Lenovo Legion Slim 7 16APH8 | |
| Asus ROG Flow X16 GV601V | |
| Lenovo LOQ 16IRH8 | |
| Average NVIDIA GeForce RTX 4060 Laptop GPU (28136 - 37796, n=29) | |
| 3DMark | |
| 1920x1080 Fire Strike Graphics | |
| Average of class Gaming (781 - 53059, n=243, last 2 years) | |
| Alienware m16 R1 Intel | |
| Asus ROG Flow X16 GV601V | |
| Lenovo Legion Pro 5 16IRX8 | |
| Lenovo Legion Slim 7 16APH8 | |
| Lenovo LOQ 16IRH8 | |
| Average NVIDIA GeForce RTX 4060 Laptop GPU (20533 - 27752, n=27) | |
| Acer Predator Helios 16 PH16-71-731Q | |
| 2560x1440 Time Spy Graphics | |
| Average of class Gaming (224 - 22547, n=241, last 2 years) | |
| Lenovo Legion Pro 5 16IRX8 | |
| Alienware m16 R1 Intel | |
| Acer Predator Helios 16 PH16-71-731Q | |
| Asus ROG Flow X16 GV601V | |
| Lenovo LOQ 16IRH8 | |
| Lenovo Legion Slim 7 16APH8 | |
| Average NVIDIA GeForce RTX 4060 Laptop GPU (7484 - 10855, n=27) | |
| 2560x1440 Port Royal Graphics | |
| Average of class Gaming (280 - 14457, n=158, last 2 years) | |
| Lenovo Legion Pro 5 16IRX8 | |
| Alienware m16 R1 Intel | |
| Asus ROG Flow X16 GV601V | |
| Lenovo Legion Slim 7 16APH8 | |
| Average NVIDIA GeForce RTX 4060 Laptop GPU (4310 - 6154, n=17) | |
| 3DMark 11 Performance | 30859 points | |
| 3DMark Ice Storm Standard Score | 123335 points | |
| 3DMark Cloud Gate Standard Score | 60481 points | |
| 3DMark Fire Strike Score | 23735 points | |
| 3DMark Time Spy Score | 10032 points | |
Help | ||
| Blender | |
| v3.3 Classroom OPTIX/RTX | |
| Lenovo Legion Slim 7 16APH8 | |
| Average NVIDIA GeForce RTX 4060 Laptop GPU (19 - 28, n=25) | |
| Average of class Gaming (9 - 142, n=140, last 2 years) | |
| Alienware m16 R1 Intel | |
| Asus ROG Flow X16 GV601V | |
| Acer Predator Helios 16 PH16-71-731Q | |
| Lenovo LOQ 16IRH8 | |
| Lenovo Legion Pro 5 16IRX8 | |
| v3.3 Classroom CUDA | |
| Average NVIDIA GeForce RTX 4060 Laptop GPU (40 - 53, n=25) | |
| Lenovo Legion Slim 7 16APH8 | |
| Asus ROG Flow X16 GV601V | |
| Acer Predator Helios 16 PH16-71-731Q | |
| Lenovo LOQ 16IRH8 | |
| Average of class Gaming (16 - 175, n=145, last 2 years) | |
| Lenovo Legion Pro 5 16IRX8 | |
| Alienware m16 R1 Intel | |
| v3.3 Classroom CPU | |
| Lenovo LOQ 16IRH8 | |
| Asus ROG Flow X16 GV601V | |
| Average NVIDIA GeForce RTX 4060 Laptop GPU (189 - 452, n=25) | |
| Average of class Gaming (144 - 907, n=156, last 2 years) | |
| Lenovo Legion Slim 7 16APH8 | |
| Acer Predator Helios 16 PH16-71-731Q | |
| Lenovo Legion Pro 5 16IRX8 | |
| Alienware m16 R1 Intel | |
* ... smaller is better
Gaming Performance
The gaming benchmarks show a similar pattern. Apart from a few highly demanding games like Lords of the Fallen or Alan Wake 2, most of them can be played at native resolution with high to maximum settings without any issues, although reaching the 60 FPS mark isn't always guaranteed.
| The Witcher 3 - 1920x1080 Ultra Graphics & Postprocessing (HBAO+) | |
| Average of class Gaming (8.61 - 216, n=235, last 2 years) | |
| Lenovo Legion Pro 5 16IRX8 | |
| Asus ROG Flow X16 GV601V | |
| Alienware m16 R1 Intel | |
| Lenovo LOQ 16IRH8 | |
| Acer Predator Helios 16 PH16-71-731Q | |
| Average NVIDIA GeForce RTX 4060 Laptop GPU (77 - 159.7, n=28) | |
| Lenovo Legion Slim 7 16APH8 | |
| GTA V - 1920x1080 Highest Settings possible AA:4xMSAA + FX AF:16x | |
| Lenovo Legion Pro 5 16IRX8 | |
| Lenovo LOQ 16IRH8 | |
| Acer Predator Helios 16 PH16-71-731Q | |
| Asus ROG Flow X16 GV601V | |
| Average NVIDIA GeForce RTX 4060 Laptop GPU (76.9 - 119.6, n=21) | |
| Average of class Gaming (6.38 - 167.7, n=224, last 2 years) | |
| Lenovo Legion Slim 7 16APH8 | |
| Strange Brigade - 1920x1080 ultra AA:ultra AF:16 | |
| Average of class Gaming (14.6 - 421, n=232, last 2 years) | |
| Asus ROG Flow X16 GV601V | |
| Alienware m16 R1 Intel | |
| Lenovo LOQ 16IRH8 | |
| Acer Predator Helios 16 PH16-71-731Q | |
| Lenovo Legion Slim 7 16APH8 | |
| Average NVIDIA GeForce RTX 4060 Laptop GPU (135.3 - 197.9, n=24) | |
| Dota 2 Reborn - 1920x1080 ultra (3/3) best looking | |
| Lenovo Legion Pro 5 16IRX8 | |
| Alienware m16 R1 Intel | |
| Lenovo LOQ 16IRH8 | |
| Acer Predator Helios 16 PH16-71-731Q | |
| Asus ROG Flow X16 GV601V | |
| Average NVIDIA GeForce RTX 4060 Laptop GPU (123.2 - 182.2, n=25) | |
| Average of class Gaming (26.9 - 220, n=247, last 2 years) | |
| Lenovo Legion Slim 7 16APH8 | |
| Alan Wake 2 | |
| 1920x1080 High Preset | |
| Average of class Gaming (53.8 - 100.7, n=3, last 2 years) | |
| XMG Pro 15 E23 | |
| Average NVIDIA GeForce RTX 4060 Laptop GPU (53.8 - 57.4, n=2) | |
| Lenovo Legion Slim 7 16APH8 | |
| 2560x1440 High Preset | |
| Average of class Gaming (33.8 - 71, n=3, last 2 years) | |
| XMG Pro 15 E23 | |
| Average NVIDIA GeForce RTX 4060 Laptop GPU (33.8 - 36.7, n=2) | |
| Lenovo Legion Slim 7 16APH8 | |
| Lords of the Fallen | |
| 1920x1080 High Preset | |
| XMG Pro 15 E23 | |
| Average NVIDIA GeForce RTX 4060 Laptop GPU (46.7 - 53.9, n=3) | |
| Lenovo Legion Slim 7 16APH8 | |
| Average of class Gaming (18.6 - 63.4, n=4, last 2 years) | |
| 1920x1080 Ultra Preset | |
| XMG Pro 15 E23 | |
| Average NVIDIA GeForce RTX 4060 Laptop GPU (32.8 - 38.1, n=3) | |
| Lenovo Legion Slim 7 16APH8 | |
| Average of class Gaming (12.7 - 45.9, n=4, last 2 years) | |
| 2560x1440 Ultra Preset | |
| Average of class Gaming (24.2 - 29.1, n=2, last 2 years) | |
| XMG Pro 15 E23 | |
| Average NVIDIA GeForce RTX 4060 Laptop GPU (24.2 - 25.7, n=2) | |
| Lenovo Legion Slim 7 16APH8 | |
| Total War Pharaoh | |
| 1920x1080 High Preset | |
| XMG Pro 15 E23 | |
| Average NVIDIA GeForce RTX 4060 Laptop GPU (128 - 149, n=2) | |
| Lenovo Legion Slim 7 16APH8 | |
| Average of class Gaming (13.6 - 146.2, n=4, last 2 years) | |
| 1920x1080 Ultra Preset | |
| XMG Pro 15 E23 | |
| Average NVIDIA GeForce RTX 4060 Laptop GPU (104 - 116, n=2) | |
| Lenovo Legion Slim 7 16APH8 | |
| Average of class Gaming (11 - 113.3, n=5, last 2 years) | |
| 2560x1440 Ultra Preset | |
| XMG Pro 15 E23 | |
| Average NVIDIA GeForce RTX 4060 Laptop GPU (76 - 81.6, n=2) | |
| Average of class Gaming (69.3 - 87.2, n=3, last 2 years) | |
| Lenovo Legion Slim 7 16APH8 | |
| Assassin's Creed Mirage | |
| 1920x1080 High Preset (Adaptive Quality Off) | |
| XMG Pro 15 E23 | |
| Average NVIDIA GeForce RTX 4060 Laptop GPU (76 - 118, n=3) | |
| Average of class Gaming (33 - 125, n=4, last 2 years) | |
| Lenovo Legion Slim 7 16APH8 | |
| 1920x1080 Ultra High Preset (Adaptive Quality Off) | |
| XMG Pro 15 E23 | |
| Average of class Gaming (21 - 149, n=5, last 2 years) | |
| Average NVIDIA GeForce RTX 4060 Laptop GPU (65 - 92, n=3) | |
| Lenovo Legion Slim 7 16APH8 | |
| 2560x1440 Ultra High Preset (Adaptive Quality Off) | |
| Average of class Gaming (64 - 127, n=3, last 2 years) | |
| XMG Pro 15 E23 | |
| Average NVIDIA GeForce RTX 4060 Laptop GPU (64 - 69, n=2) | |
| Lenovo Legion Slim 7 16APH8 | |
| EA Sports FC 24 | |
| 1920x1080 High Preset | |
| Lenovo Legion Slim 7 16APH8 | |
| XMG Pro 15 E23 | |
| Average NVIDIA GeForce RTX 4060 Laptop GPU (142.9 - 155.2, n=3) | |
| Average of class Gaming (20.3 - 155.2, n=4, last 2 years) | |
| 1920x1080 Ultra Preset | |
| XMG Pro 15 E23 | |
| Average NVIDIA GeForce RTX 4060 Laptop GPU (136.9 - 138, n=3) | |
| Lenovo Legion Slim 7 16APH8 | |
| Average of class Gaming (62.3 - 138, n=4, last 2 years) | |
| 2560x1440 Ultra Preset | |
| XMG Pro 15 E23 | |
| Average NVIDIA GeForce RTX 4060 Laptop GPU (117.5 - 121, n=2) | |
| Lenovo Legion Slim 7 16APH8 | |
| Average of class Gaming (101 - 117.5, n=2, last 2 years) | |
During the 60-minute test with The Witcher 3, there were no anomalies observed. The frame rate remained relatively stable throughout the entire duration.
Witcher 3 FPS chart
| low | med. | high | ultra | QHD | |
| GTA V (2015) | 172.9 | 166 | 103.2 | ||
| The Witcher 3 (2015) | 98 | ||||
| Dota 2 Reborn (2015) | 161.6 | 159.2 | 140.6 | 134.7 | |
| X-Plane 11.11 (2018) | 116 | 103.5 | 81.6 | ||
| Strange Brigade (2018) | 258 | 208 | 180.8 | ||
| Atomic Heart (2023) | 122.1 | 82.7 | 64.9 | 50.7 | |
| Company of Heroes 3 (2023) | 156 | 122 | 120 | 92 | |
| Sons of the Forest (2023) | 83.8 | 80.2 | 78.8 | 64.2 | |
| Resident Evil 4 Remake (2023) | 98.4 | 92.1 | 64.4 | 55.1 | |
| Baldur's Gate 3 (2023) | 98.7 | 84.8 | 82.6 | 55.8 | |
| Armored Core 6 (2023) | 104.5 | 103.1 | 95.6 | 73.2 | |
| EA Sports FC 24 (2023) | 187.9 | 155.2 | 136.9 | 117.5 | |
| Assassin's Creed Mirage (2023) | 80 | 76 | 65 | 64 | |
| Total War Pharaoh (2023) | 193 | 128 | 104 | 76 | |
| Lords of the Fallen (2023) | 66.4 | 48.2 | 33.2 | 24.2 | |
| Alan Wake 2 (2023) | 58.5 | 53.8 | 33.8 |
Emissions
System Noise
It has the lowest noise levels in the test field, with noise levels ranging from 33 to 49 dB(A) in 3D mode. For noise-sensitive gamers, we recommend choosing the silent mode, which results in minimum performance loss while dramatically lowering working noise (refer to the table for specific test conditions). The fans are occasionally entirely quiet while idle, and even when active, the noise generated is kept to a minimum. It's worth mentioning that our test unit showed no signs of coil whining.
Noise Level
| Idle |
| 25 / 28 / 31 dB(A) |
| Load |
| 33 / 49 dB(A) |
 | ||
30 dB silent 40 dB(A) audible 50 dB(A) loud |
||
min: | ||
| Lenovo Legion Slim 7 16APH8 R7 7840HS, NVIDIA GeForce RTX 4060 Laptop GPU | Asus ROG Flow X16 GV601V i9-13900H, NVIDIA GeForce RTX 4060 Laptop GPU | Alienware m16 R1 Intel i7-13700HX, NVIDIA GeForce RTX 4060 Laptop GPU | Acer Predator Helios 16 PH16-71-731Q i7-13700HX, NVIDIA GeForce RTX 4060 Laptop GPU | Lenovo Legion Pro 5 16IRX8 i7-13700HX, NVIDIA GeForce RTX 4060 Laptop GPU | Lenovo LOQ 16IRH8 i7-13620H, NVIDIA GeForce RTX 4060 Laptop GPU | |
|---|---|---|---|---|---|---|
| Noise | 3% | -8% | -0% | 4% | -6% | |
| off / environment * | 24 | 24 -0% | 25 -4% | 24 -0% | 23 4% | 23 4% |
| Idle Minimum * | 25 | 24 4% | 25 -0% | 24 4% | 23.1 8% | 23 8% |
| Idle Average * | 28 | 24 14% | 26 7% | 24 14% | 23.1 17% | 23 18% |
| Idle Maximum * | 31 | 24 23% | 27 13% | 32.32 -4% | 26.6 14% | 27.66 11% |
| Load Average * | 33 | 36.71 -11% | 52 -58% | 36.66 -11% | 34.7 -5% | 53.62 -62% |
| Witcher 3 ultra * | 47 | 50.92 -8% | 51 -9% | 49.06 -4% | 47.6 -1% | 53.5 -14% |
| Load Maximum * | 49 | 50.92 -4% | 53 -8% | 49.49 -1% | 54.8 -12% | 53.5 -9% |
* ... smaller is better
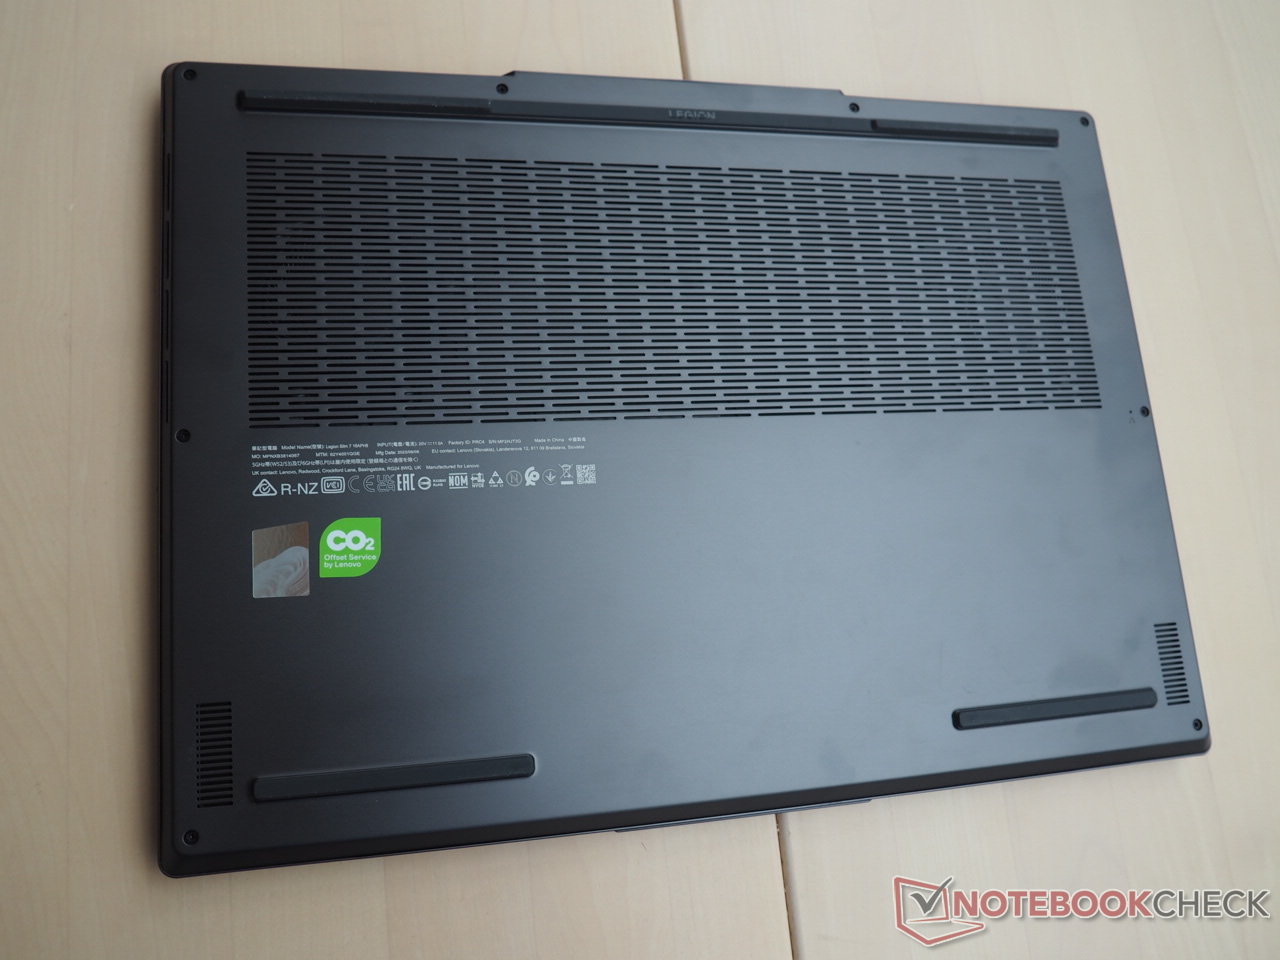
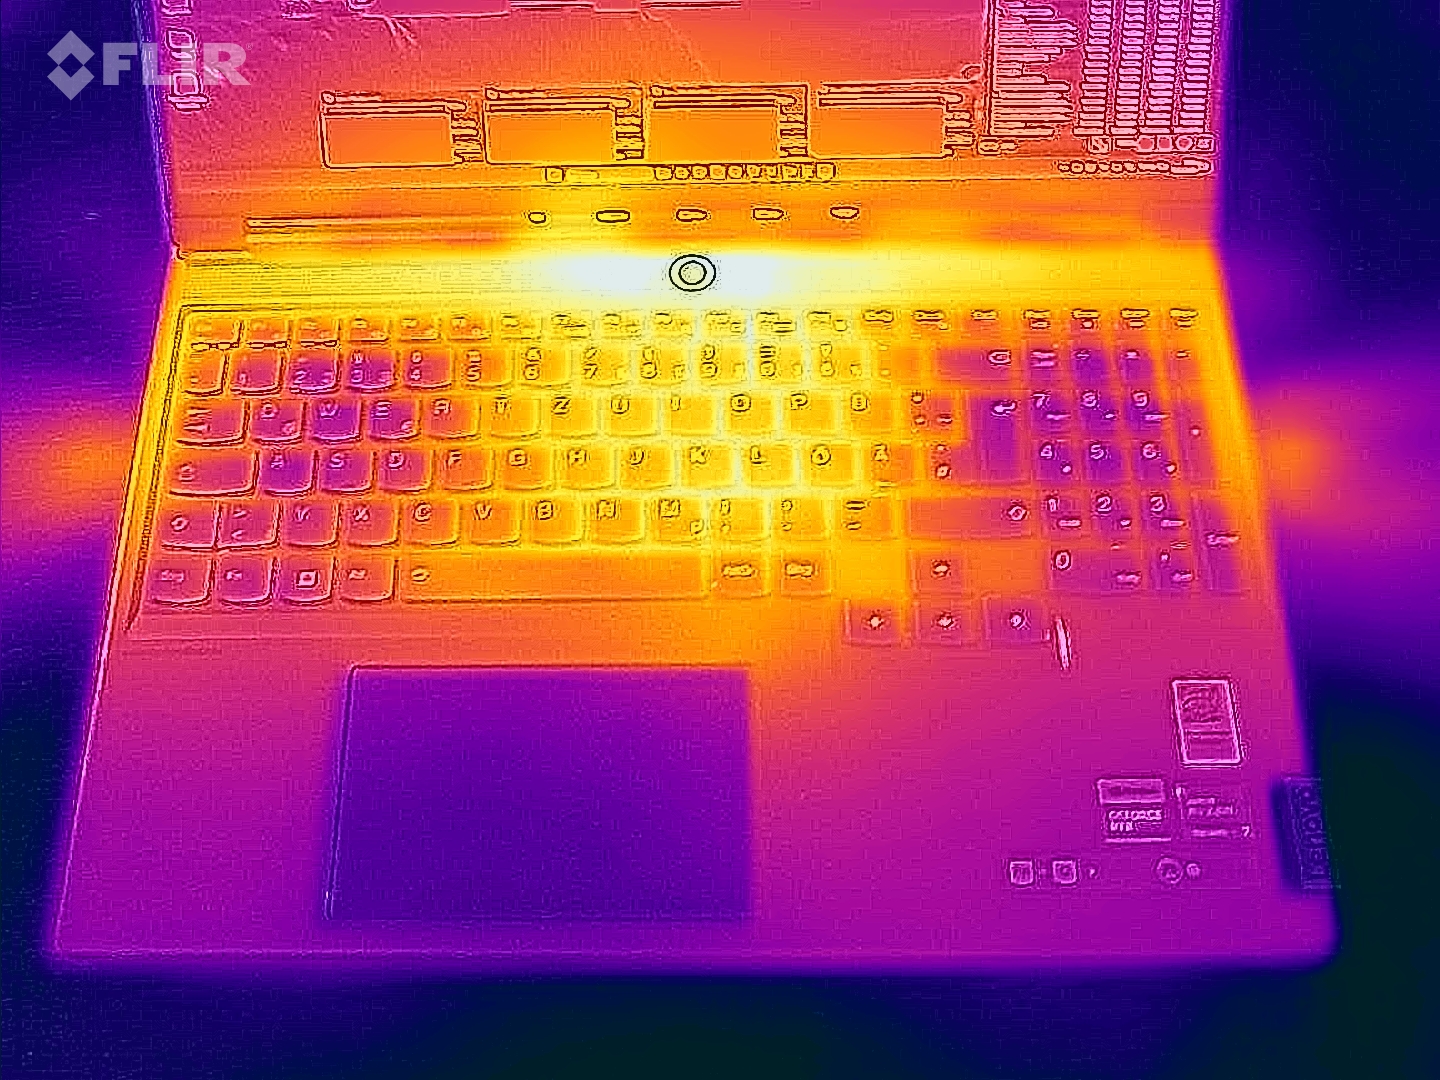
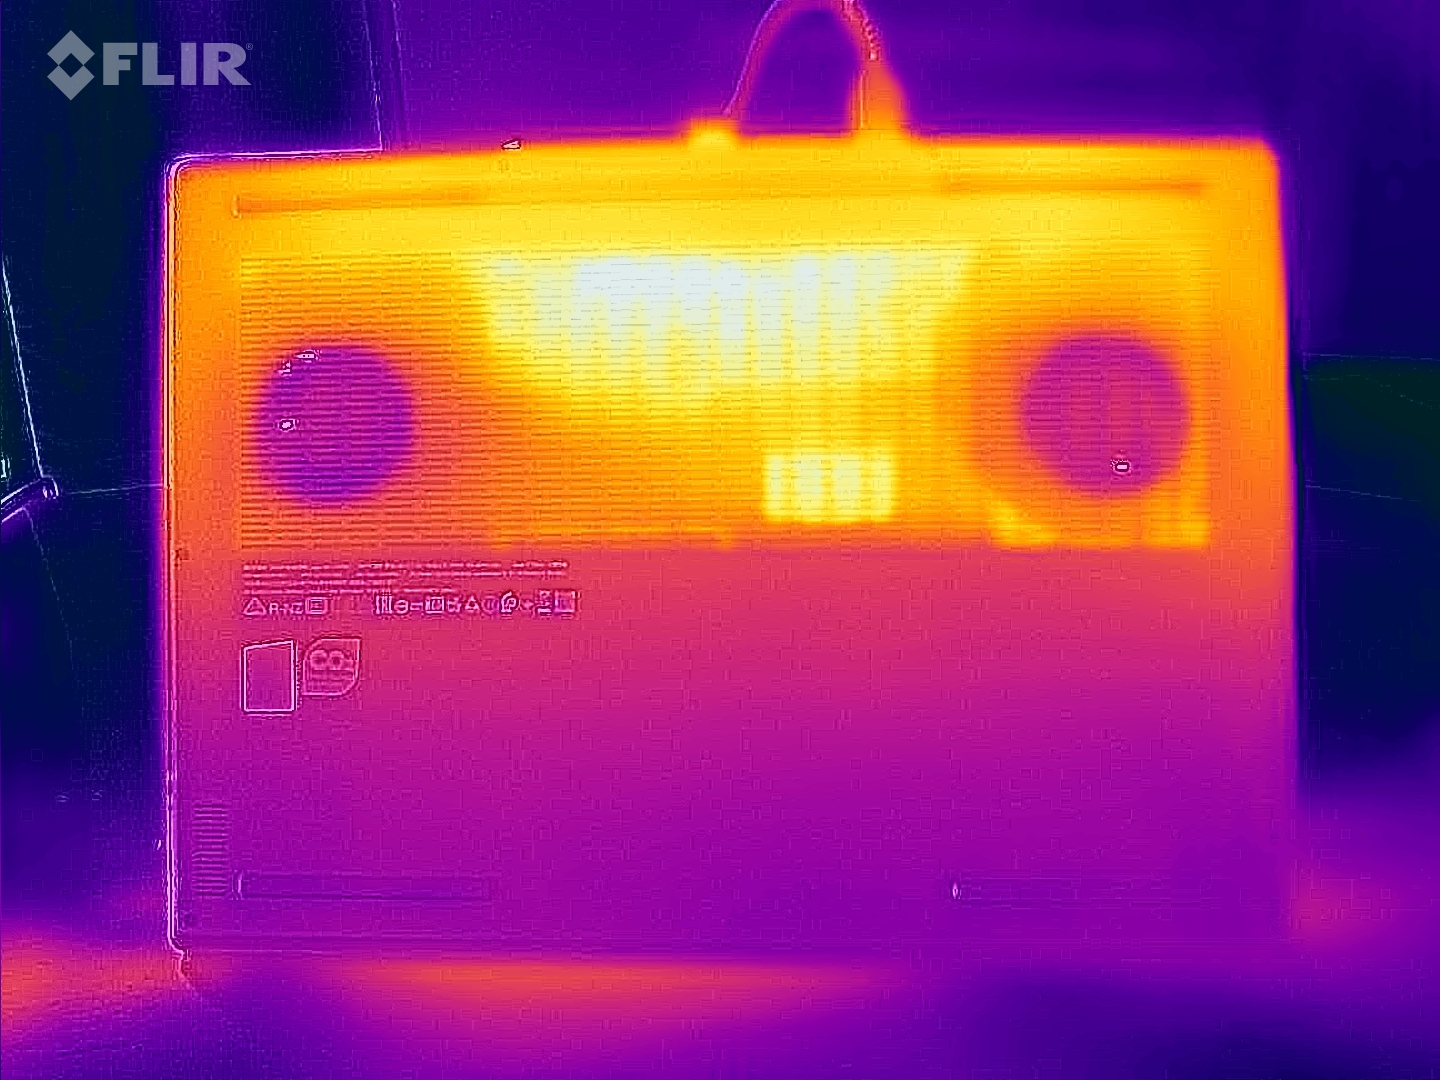
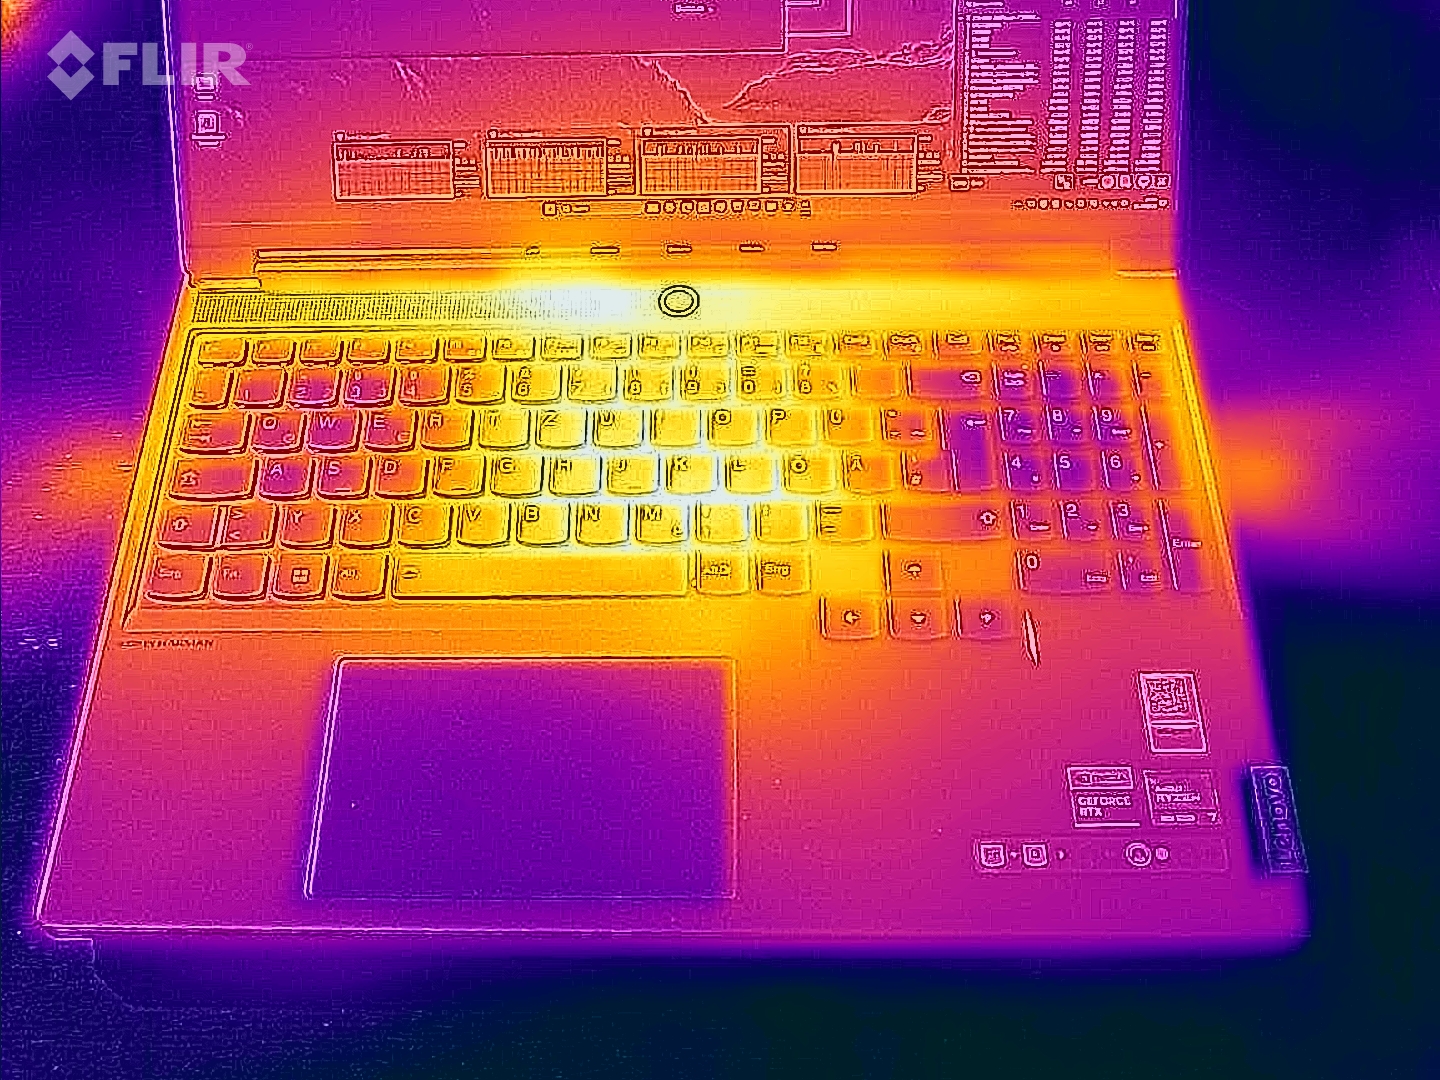
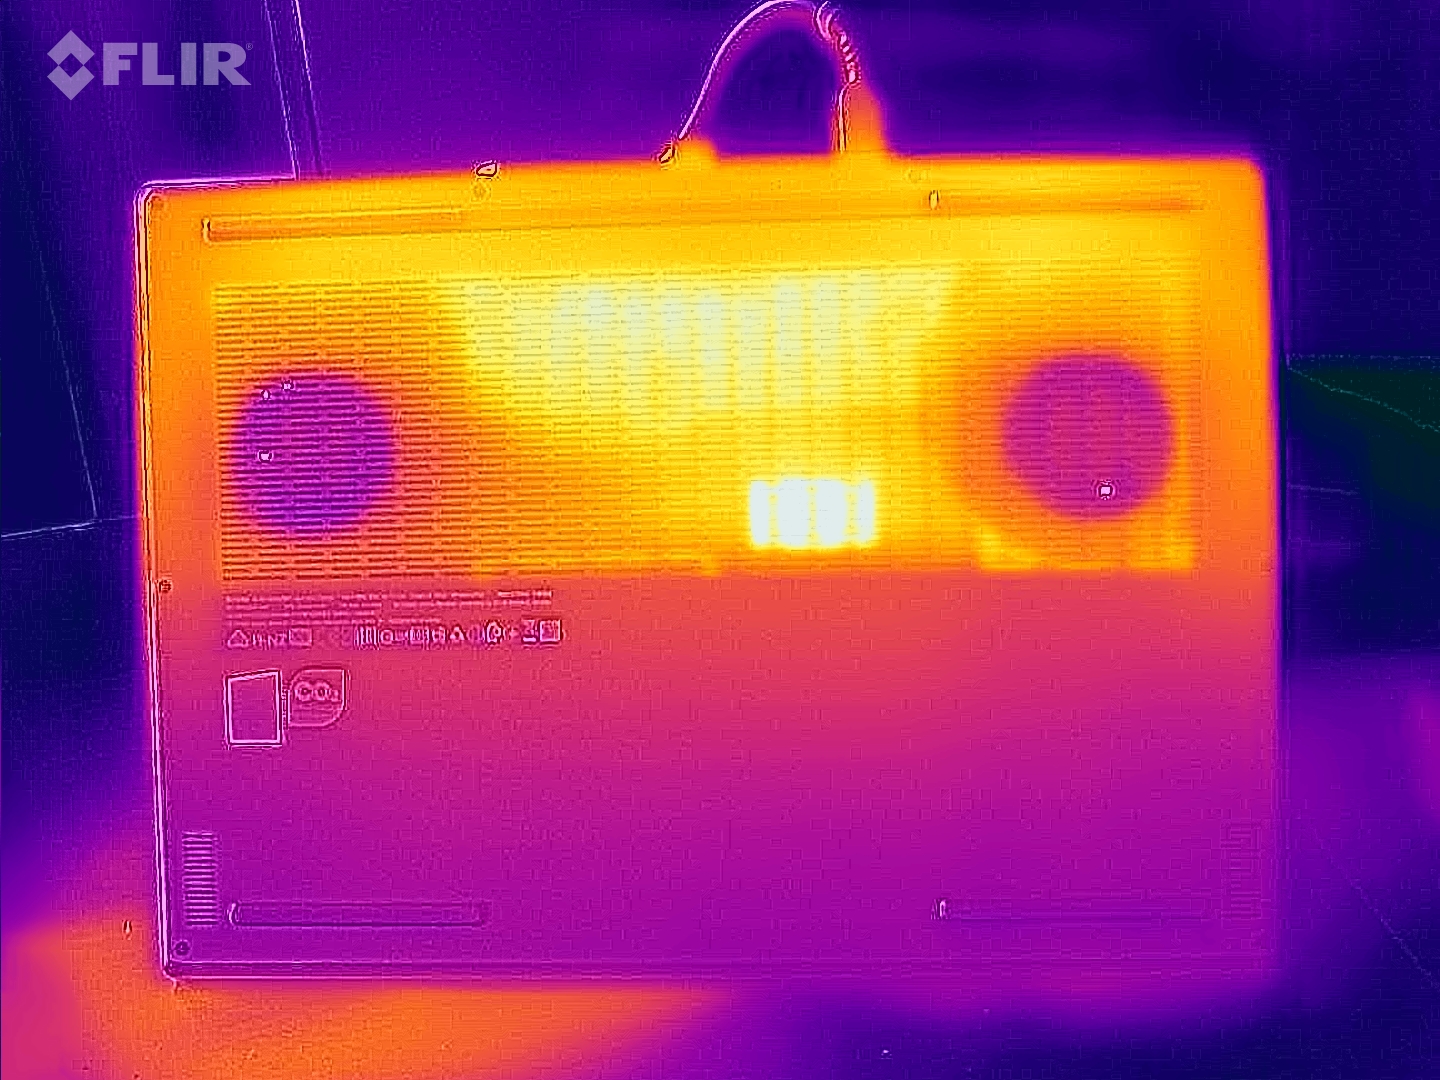
Temperature
The temperature inside the case is within the mid-range and doesn't reach exceptionally low or high levels. During stress tests with Furmark and Prime95 tools, the graphics card throttled, causing the highest temperatures to be observed in gaming mode. After 60 minutes of running The Witcher 3, the chassis reached a maximum of 49°C on the top and 52°C on the bottom, which are typical values for a gaming notebook. In idle mode, the surface temperatures hover around an average of 30°C, indicating a moderate heat level.
(-) The maximum temperature on the upper side is 46 °C / 115 F, compared to the average of 40.4 °C / 105 F, ranging from 21.2 to 68.8 °C for the class Gaming.
(-) The bottom heats up to a maximum of 46 °C / 115 F, compared to the average of 43.2 °C / 110 F
(+) In idle usage, the average temperature for the upper side is 30.3 °C / 87 F, compared to the device average of 33.9 °C / 93 F.
(-) Playing The Witcher 3, the average temperature for the upper side is 41.6 °C / 107 F, compared to the device average of 33.9 °C / 93 F.
(+) The palmrests and touchpad are reaching skin temperature as a maximum (35 °C / 95 F) and are therefore not hot.
(-) The average temperature of the palmrest area of similar devices was 29 °C / 84.2 F (-6 °C / -10.8 F).
| Lenovo Legion Slim 7 16APH8 R7 7840HS, NVIDIA GeForce RTX 4060 Laptop GPU | Asus ROG Flow X16 GV601V i9-13900H, NVIDIA GeForce RTX 4060 Laptop GPU | Alienware m16 R1 Intel i7-13700HX, NVIDIA GeForce RTX 4060 Laptop GPU | Acer Predator Helios 16 PH16-71-731Q i7-13700HX, NVIDIA GeForce RTX 4060 Laptop GPU | Lenovo Legion Pro 5 16IRX8 i7-13700HX, NVIDIA GeForce RTX 4060 Laptop GPU | Lenovo LOQ 16IRH8 i7-13620H, NVIDIA GeForce RTX 4060 Laptop GPU | |
|---|---|---|---|---|---|---|
| Heat | 1% | -12% | -13% | 2% | 0% | |
| Maximum Upper Side * | 46 | 46 -0% | 49 -7% | 41 11% | 42.8 7% | 48 -4% |
| Maximum Bottom * | 46 | 41 11% | 48 -4% | 66 -43% | 50 -9% | 59 -28% |
| Idle Upper Side * | 33 | 36 -9% | 40 -21% | 36 -9% | 29.6 10% | 28 15% |
| Idle Bottom * | 34 | 33 3% | 39 -15% | 37 -9% | 34 -0% | 28 18% |
* ... smaller is better
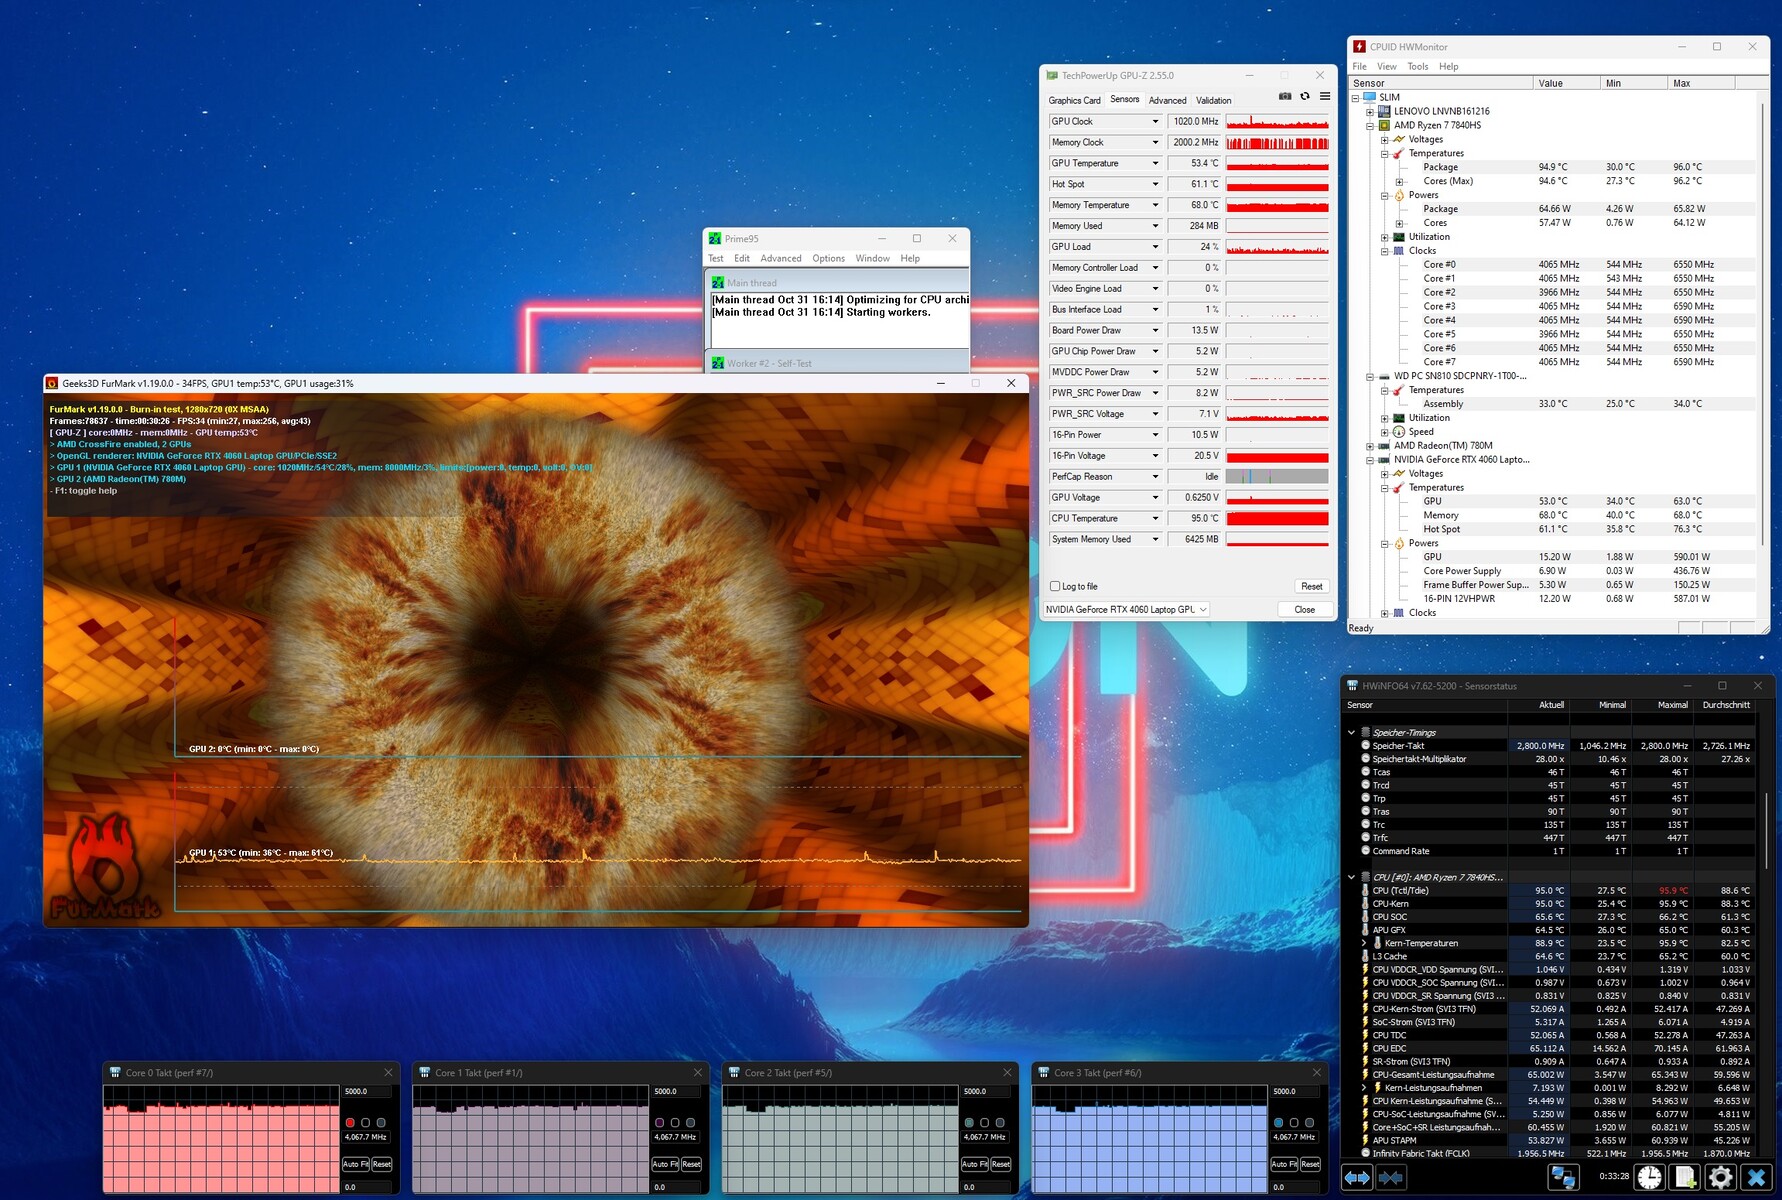
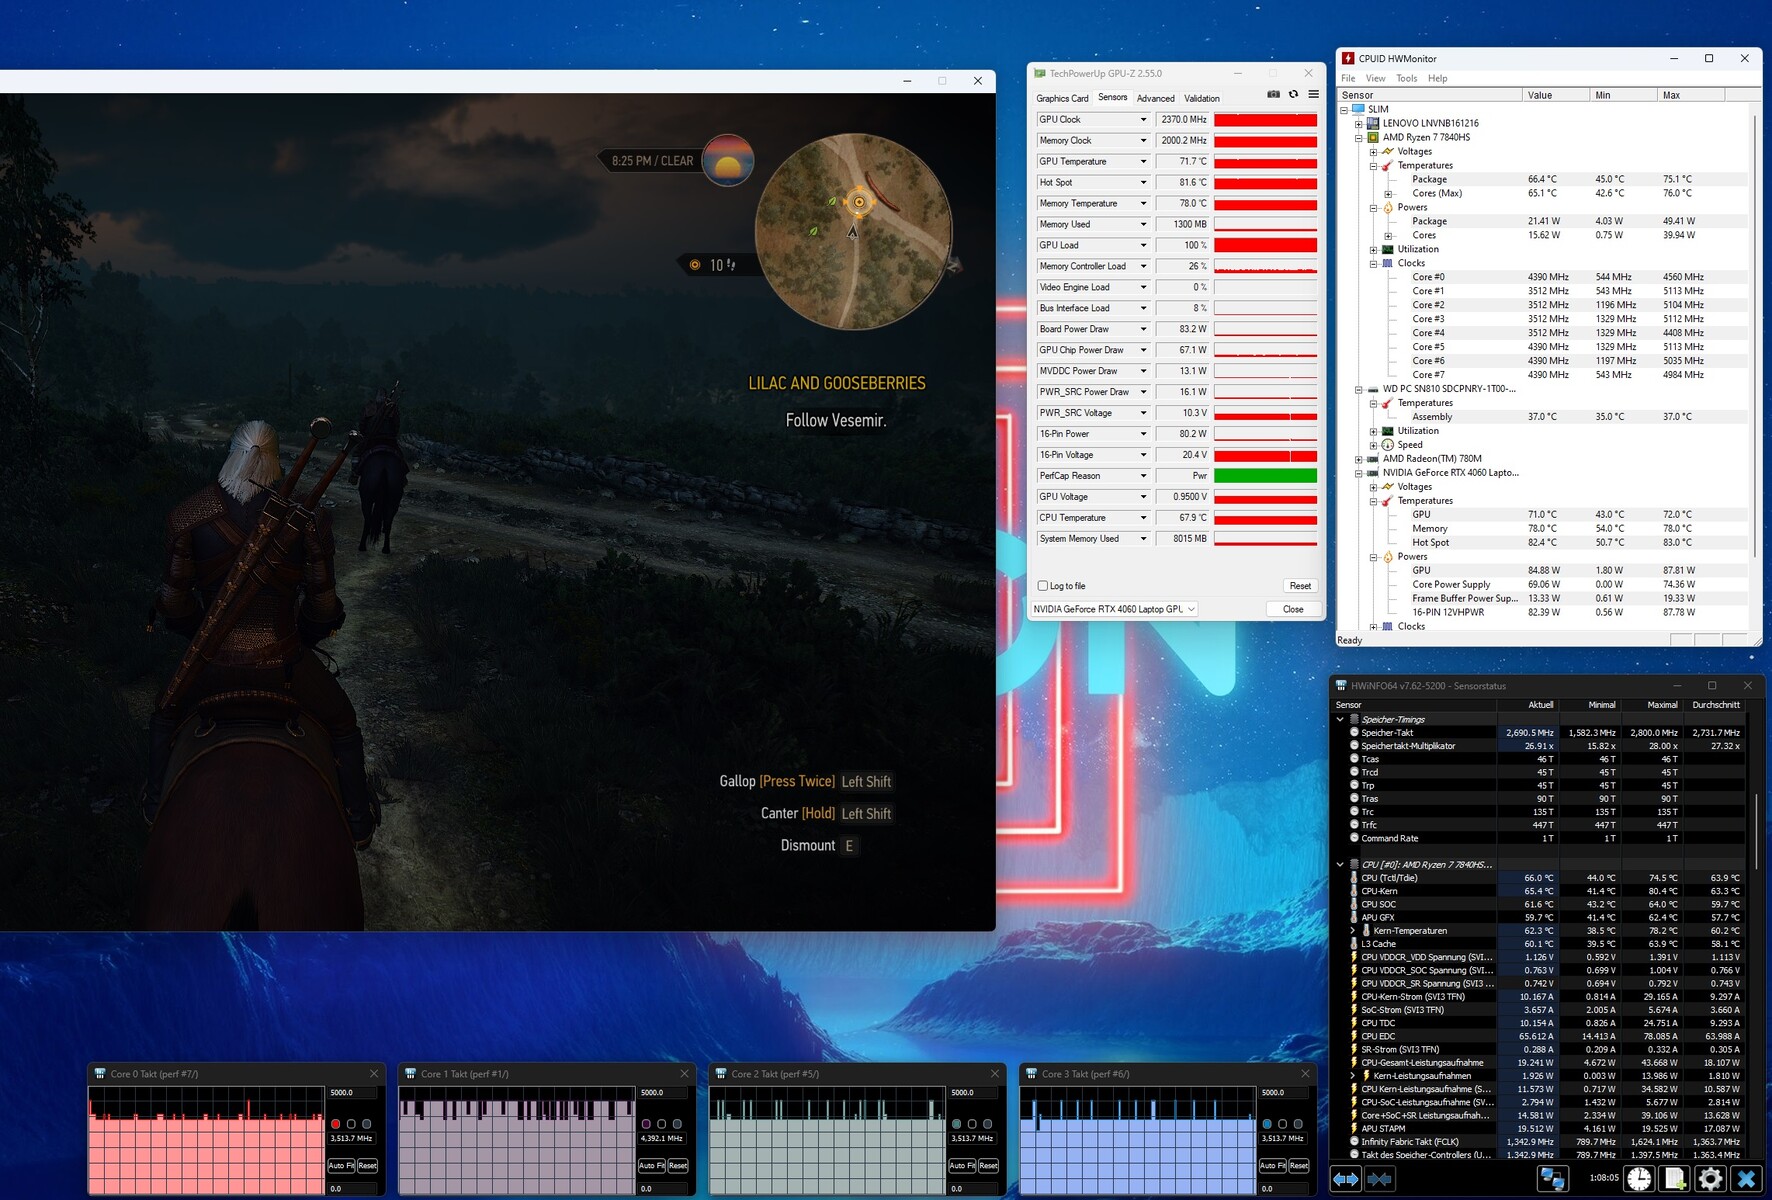
Stress Test
The CPU became quite hot during our 60-minute stress test. Although the Ryzen 7 7840HS reached 95°C, it maintained a constant 4.1 GHz. In gaming mode, the situation is notably more relaxed. While playing The Witcher 3, the CPU temperature hovered at 66°C, whereas the graphics card temperature remained in the green range at just under 72°C.
Speakers
The sound quality surpasses that of most competitors. The 2.0 system (Harman) produces a robust sound that can be pleasingly loud if needed. However, similar to most notebooks, the bass is somewhat lacking.
Lenovo Legion Slim 7 16APH8 audio analysis
(+) | speakers can play relatively loud (87 dB)
Bass 100 - 315 Hz
(±) | reduced bass - on average 13.8% lower than median
(±) | linearity of bass is average (8.5% delta to prev. frequency)
Mids 400 - 2000 Hz
(+) | balanced mids - only 1.1% away from median
(+) | mids are linear (2.5% delta to prev. frequency)
Highs 2 - 16 kHz
(+) | balanced highs - only 4.1% away from median
(+) | highs are linear (4.8% delta to prev. frequency)
Overall 100 - 16.000 Hz
(+) | overall sound is linear (9.9% difference to median)
Compared to same class
» 3% of all tested devices in this class were better, 2% similar, 95% worse
» The best had a delta of 7%, average was 19%, worst was 132%
Compared to all devices tested
» 3% of all tested devices were better, 1% similar, 97% worse
» The best had a delta of 4%, average was 26%, worst was 134%
Asus ROG Flow X16 GV601V audio analysis
(±) | speaker loudness is average but good (77.38 dB)
Bass 100 - 315 Hz
(±) | reduced bass - on average 9.6% lower than median
(±) | linearity of bass is average (9.2% delta to prev. frequency)
Mids 400 - 2000 Hz
(+) | balanced mids - only 4.7% away from median
(±) | linearity of mids is average (7.5% delta to prev. frequency)
Highs 2 - 16 kHz
(+) | balanced highs - only 2.2% away from median
(+) | highs are linear (6.1% delta to prev. frequency)
Overall 100 - 16.000 Hz
(+) | overall sound is linear (12% difference to median)
Compared to same class
» 10% of all tested devices in this class were better, 4% similar, 86% worse
» The best had a delta of 7%, average was 19%, worst was 132%
Compared to all devices tested
» 6% of all tested devices were better, 2% similar, 92% worse
» The best had a delta of 4%, average was 26%, worst was 134%
Energy Management
Power Consumption
The power consumption at times appears to be inconsistent. Despite active graphics switching, the idle consumption of 33 to 45 watts is higher than average. However, 3DMark 06's power usage of roughly 59 watts is very low. Furthermore, the results obtained during The Witcher 3 (131 watts) and the stress test (maximum 177 watts) are below the competition, showing the Zen 4 CPU's energy efficiency, at least under load.
| Off / Standby | |
| Idle | |
| Load |
|
| Lenovo Legion Slim 7 16APH8 R7 7840HS, NVIDIA GeForce RTX 4060 Laptop GPU | Asus ROG Flow X16 GV601V i9-13900H, NVIDIA GeForce RTX 4060 Laptop GPU | Alienware m16 R1 Intel i7-13700HX, NVIDIA GeForce RTX 4060 Laptop GPU | Acer Predator Helios 16 PH16-71-731Q i7-13700HX, NVIDIA GeForce RTX 4060 Laptop GPU | Lenovo Legion Pro 5 16IRX8 i7-13700HX, NVIDIA GeForce RTX 4060 Laptop GPU | Lenovo LOQ 16IRH8 i7-13620H, NVIDIA GeForce RTX 4060 Laptop GPU | Average of class Gaming | |
|---|---|---|---|---|---|---|---|
| Power Consumption | 14% | -7% | -4% | -13% | 8% | 3% | |
| Idle Minimum * | 33 | 9.6 71% | 10 70% | 15.9 52% | 24.5 26% | 17.2 48% | 14 ? 58% |
| Idle Average * | 35 | 16 54% | 14 60% | 20.5 41% | 29.2 17% | 19.3 45% | 19.1 ? 45% |
| Idle Maximum * | 45 | 16.9 62% | 21 53% | 20.9 54% | 34.3 24% | 21.2 53% | 26 ? 42% |
| Load Average * | 59 | 104 -76% | 119 -102% | 106 -80% | 98.7 -67% | 90 -53% | 111.8 ? -89% |
| Witcher 3 ultra * | 131 | 142 -8% | 186.7 -43% | 175 -34% | 178.6 -36% | 168 -28% | |
| Load Maximum * | 177 | 214 -21% | 323 -82% | 276 -56% | 249.6 -41% | 211 -19% | 247 ? -40% |
* ... smaller is better
Power consumption Witcher 3 / stress test
Power consumption with external monitor
Battery Life
Considering the large 99.9 Wh battery, the runtime doesn't break any records. Approximately 7 hours of internet browsing with lowered brightness at 150 cd/m2 is good, but considering the battery size, it may be significantly better. Nevertheless, it secures the second spot in the test field, right behind the Asus ROG Flow X16.
| Lenovo Legion Slim 7 16APH8 R7 7840HS, NVIDIA GeForce RTX 4060 Laptop GPU, 99.9 Wh | Asus ROG Flow X16 GV601V i9-13900H, NVIDIA GeForce RTX 4060 Laptop GPU, 90 Wh | Alienware m16 R1 Intel i7-13700HX, NVIDIA GeForce RTX 4060 Laptop GPU, 86 Wh | Acer Predator Helios 16 PH16-71-731Q i7-13700HX, NVIDIA GeForce RTX 4060 Laptop GPU, 90 Wh | Lenovo Legion Pro 5 16IRX8 i7-13700HX, NVIDIA GeForce RTX 4060 Laptop GPU, 80 Wh | Lenovo LOQ 16IRH8 i7-13620H, NVIDIA GeForce RTX 4060 Laptop GPU, 80 Wh | Average of class Gaming | |
|---|---|---|---|---|---|---|---|
| Battery Runtime | 12% | -33% | -20% | -52% | -11% | -15% | |
| WiFi v1.3 | 424 | 474 12% | 286 -33% | 338 -20% | 205 -52% | 376 -11% | 361 ? -15% |
| H.264 | 532 | 336 | 286 | 385 | 383 ? | ||
| Load | 89 | 62 | 88 | 41 | 88 | 87.3 ? | |
| Reader / Idle | 383 | 401 | 538 ? | ||||
| Witcher 3 ultra | 87 | 77.9 ? |
Pros
Cons
Verdict


The AMD version of the laptop, much like its Intel counterpart, comes highly recommended.
The synergy between the Ryzen 7 7840HS and the GeForce RTX 4060 allows for smooth performance, enabling high to maximum settings using a resolution of 2,560 x 1,600 pixels.
The 240 Hz display is notable not just for its high brightness, but also for its visibility in outdoor environments. The laptop's case excels in various aspects, including connections, stability, design, and material quality. Despite its 16-inch size, it is rather light (4.6 lbs). It also has well-thought-out input devices and excellent sound quality.
While there are small flaws, such as slightly greater power consumption in idle mode and occasional SSD throttling over time, these shortcomings do not significantly distract from the overall excellent experience. Consequently, the laptop receives a very good overall rating.
It's worth mentioning that the competition, such as the Asus ROG Flow X16, provides excellent performance as well, but at a greater price, making our suggestion even more tempting.
Price & Availability
The tested Lenovo Legion Slim 7 16APH8 is available for around $1750 USD on Amazon.
Lenovo Legion Slim 7 16APH8
-
11/03/2023 v7
Florian Glaser
Transparency
The present review sample was made available to the author as a loan by the manufacturer or a shop for the purposes of review. The lender had no influence on this review, nor did the manufacturer receive a copy of this review before publication. There was no obligation to publish this review.
Pricecompare

