 Deutsch
 English
 Español
 Français
 Italiano
 Nederlands
 Polski
 Português
 Русский
 Türkçe
 Svenska
 Chinese
 Magyar
Lenovo LOQ 15 Core i7 Review: Affordable Legion alternative that throws up an Intel vs AMD conundrum

The Lenovo LOQ series is aimed at budget, entry-level gamers similar to the Dell G Series, HP Victus, Asus TUF, MSI Katana, and Acer Nitro lineups. We recently reviewed the LOQ 15APH8 with an AMD Ryzen 7 7840HS and Nvidia RTX 4050 Laptop GPU. The LOQ 16IRH8 likewise combined Intel and Nvidia silicon, pairing a Core i7-13620H with RTX 4060 graphics.
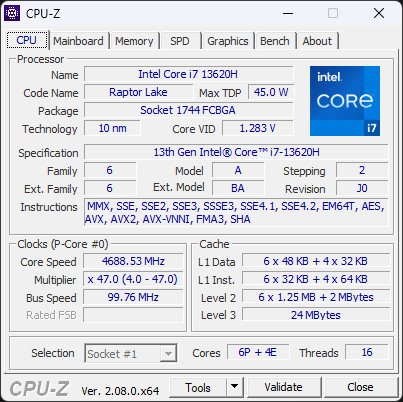
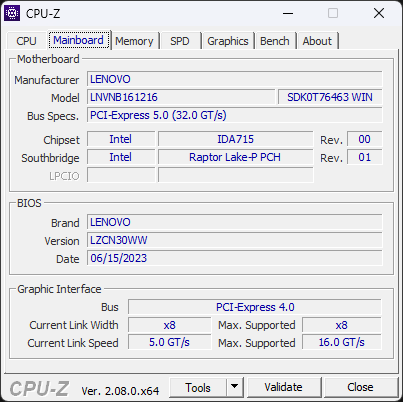
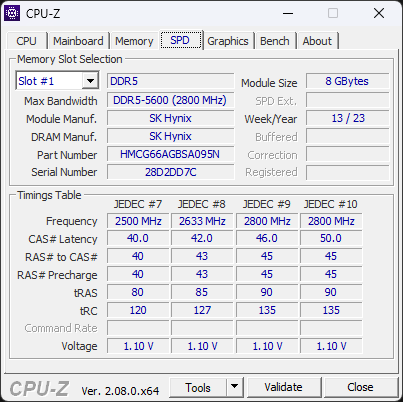
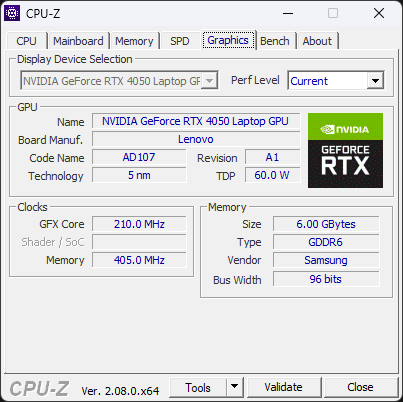
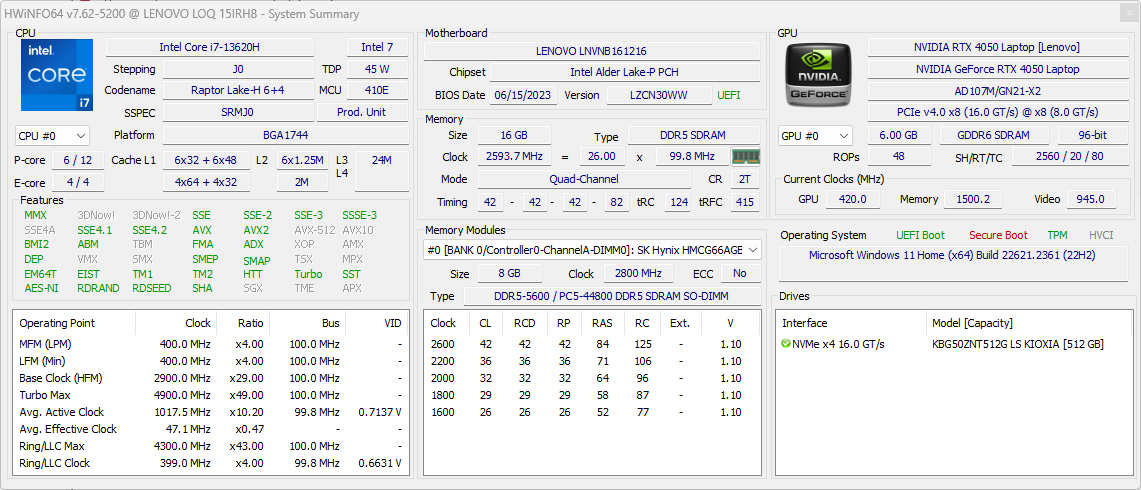
Now in our labs is the 15-inch LOQ 15IRH8, powered by the Core i7-13620H and RTX 4050. Our test model also came equipped with 16 GB of DDR5-5200 memory, a 512 GB PCIe Gen4 NVMe SSD, and a 165 Hz QHD G-Sync display.
This upper midrange config rings the cash registers at ₹1,01,988 (US$1,224) in India, while the 1080p 144Hz variant can be had for ₹97,790 (US$1,050).
Potential competitors in comparison
Rating | Date | Model | Weight | Height | Size | Resolution | Best Price |
|---|---|---|---|---|---|---|---|
| 85.9 % | 10/2023 | Lenovo LOQ 15IRH8 Core i7 i7-13620H, NVIDIA GeForce RTX 4050 Laptop GPU | 2.4 kg | 25.2 mm | 15.60" | 2560x1440 | |
| 87.3 % | 09/2023 | Lenovo LOQ 16IRH8 i7-13620H, NVIDIA GeForce RTX 4060 Laptop GPU | 2.7 kg | 25.9 mm | 16.00" | 2560x1600 | |
| 85.7 % | 07/2023 | Lenovo LOQ 15APH8 R7 7840HS, NVIDIA GeForce RTX 4050 Laptop GPU | 2.5 kg | 25.2 mm | 15.60" | 1920x1080 | |
| 82.1 % | 02/2023 | MSI Katana 17 B13VFK i7-13620H, NVIDIA GeForce RTX 4060 Laptop GPU | 2.8 kg | 25.2 mm | 17.30" | 1920x1080 | |
| 89 % | 08/2023 | Lenovo Legion Pro 5 16ARX8 (R5 7645HX, RTX 4050) R5 7645HX, NVIDIA GeForce RTX 4050 Laptop GPU | 2.5 kg | 27.3 mm | 16.00" | 2560x1600 | |
| 85.1 % | 09/2023 | HP Victus 16-r0077ng i7-13700H, NVIDIA GeForce RTX 4070 Laptop GPU | 2.4 kg | 24 mm | 16.10" | 1920x1080 | |
| 84.2 % | 06/2023 | Dell G15 5530 i7-13650HX, NVIDIA GeForce RTX 4060 Laptop GPU | 3 kg | 26.95 mm | 15.60" | 1920x1080 | |
| 86.9 % | 06/2023 | Asus TUF Gaming A16 FA617XS R9 7940HS, Radeon RX 7600S | 2.2 kg | 22.1 mm | 16.00" | 1920x1200 |
Chassis and Input devices: Same plastic construction as the AMD variant
For more details on the Lenovo LOQ 15IRH8's chassis, maintenance, and input devices, please see our LOQ 15APH8 review — these aspects are identical between Lenovo's Intel and AMD-based LOQ laptops.


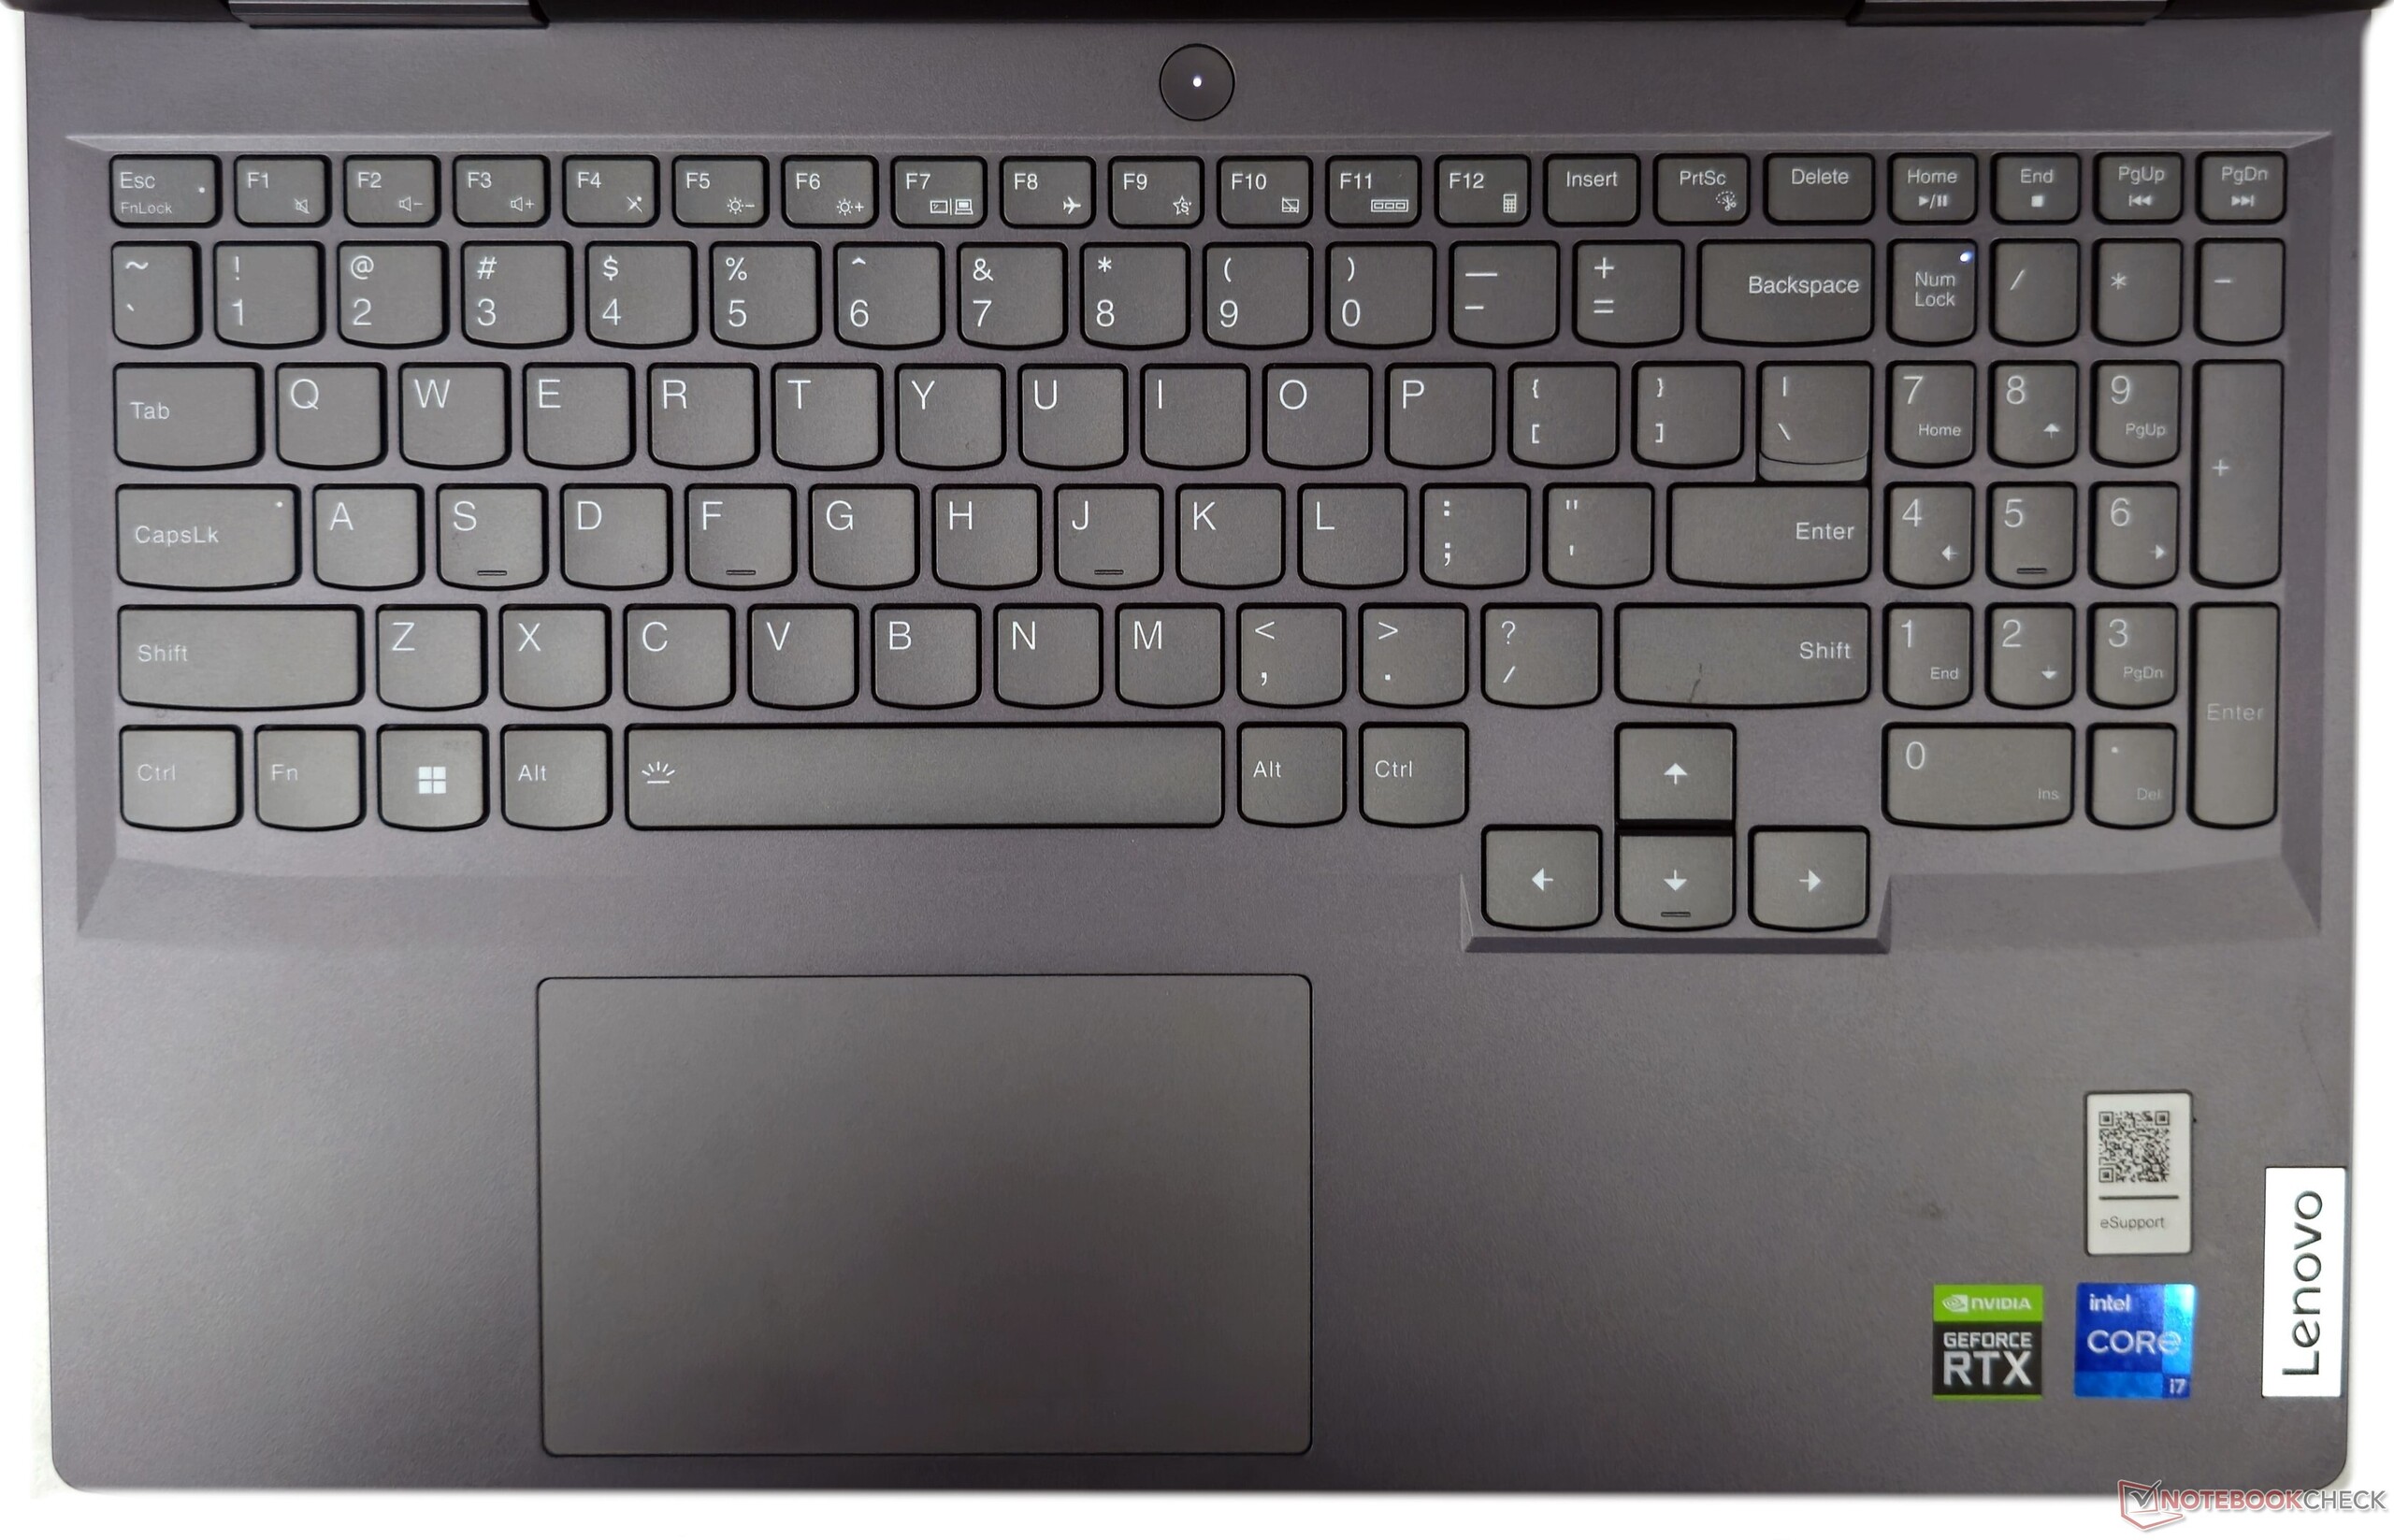


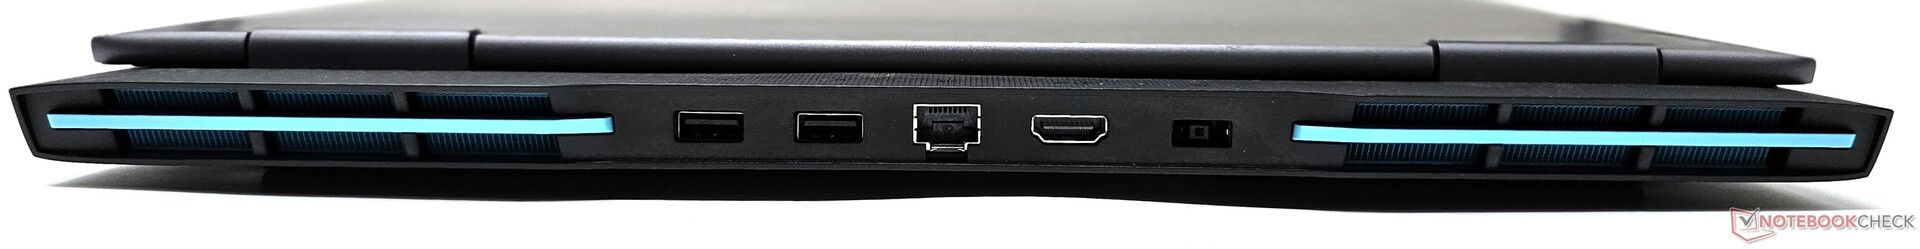
Connectivity: 140 W USB-C power delivery but no Thunderbolt 4
Port selection and placement is exactly the same as the Intel-based LOQ 16. Unlike the LOQ 15APH8's use of a USB 2.0 port among other USB 3.2 ports, the Intel variants standardize fully on USB 3.2 connectivity.
According to Lenovo, the lone USB 3.2 Gen2 Type-C port is capable of 140 W power delivery. There is no USB4 or Thunderbolt 4 option provided.


Communication
Wireless performance is on expected lines for a Realtek Wi-Fi 6 module. Both transmit and receive tests showed stable throughput when tested with our reference Asus ROG Rapture GT-AXE11000 router.
| Networking / iperf3 transmit AXE11000 | |
| Lenovo Legion Pro 5 16ARX8 (R5 7645HX, RTX 4050) | |
| Dell G15 5530 | |
| MSI Katana 17 B13VFK | |
| Average of class Gaming (648 - 1780, n=124, last 2 years) | |
| Lenovo LOQ 15IRH8 Core i7 | |
| Lenovo LOQ 15APH8 | |
| Average Realtek RTL8852BE (620 - 925, n=25) | |
| Asus TUF Gaming A16 FA617XS | |
| Lenovo LOQ 16IRH8 | |
| HP Victus 16-r0077ng | |
| Networking / iperf3 receive AXE11000 | |
| MSI Katana 17 B13VFK | |
| Lenovo Legion Pro 5 16ARX8 (R5 7645HX, RTX 4050) | |
| Dell G15 5530 | |
| Average of class Gaming (685 - 1890, n=131, last 2 years) | |
| Lenovo LOQ 15IRH8 Core i7 | |
| Asus TUF Gaming A16 FA617XS | |
| Average Realtek RTL8852BE (624 - 984, n=26) | |
| Lenovo LOQ 16IRH8 | |
| Lenovo LOQ 15APH8 | |
| HP Victus 16-r0077ng | |
Webcam
The 1080p webcam shows high deviations in all colors except white. The image quality is still serviceable for video calls in good ambient light. An electronic camera shutter switch is provided on the right side of the device.


Warranty
In India, Lenovo offers a standard one-year on-site warranty for the LOQ 15. Buyers can additionally opt for several warranty upgrade and accidental damage protection options directly from Lenovo.
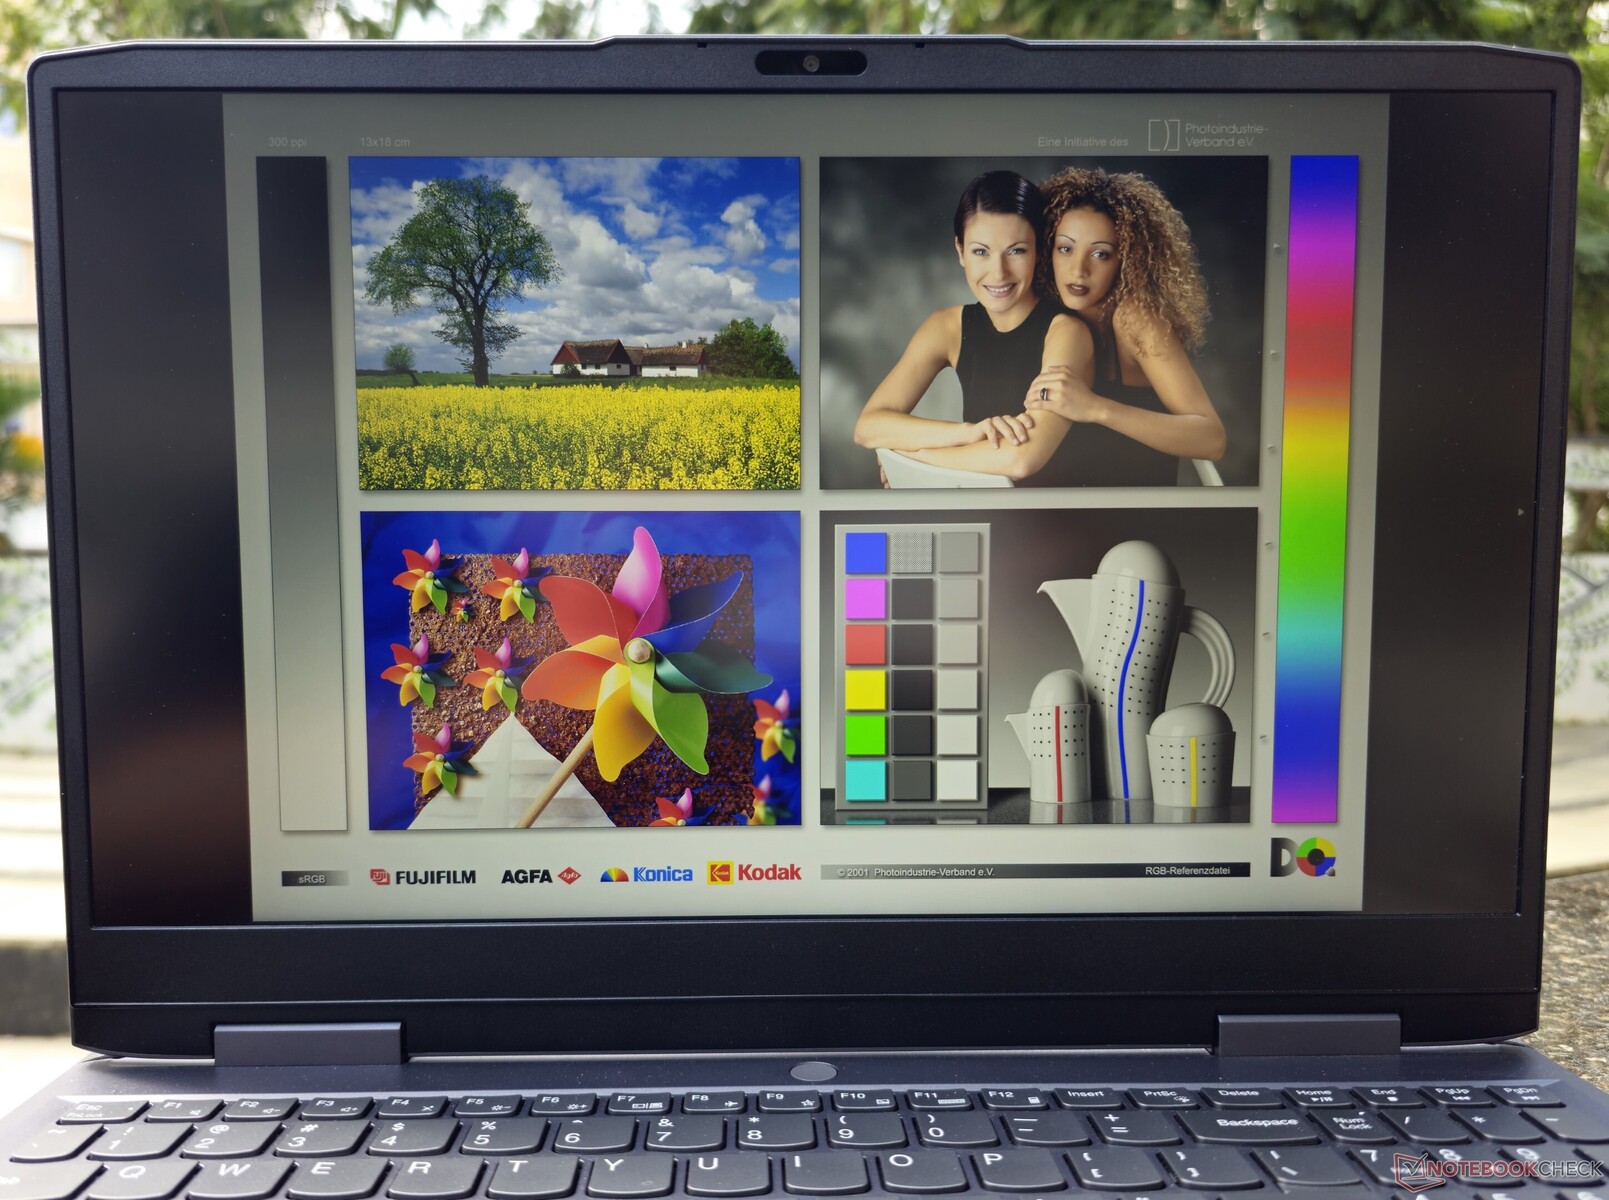
Display: 165 Hz QHD G-Sync panel presents a significant upgrade option
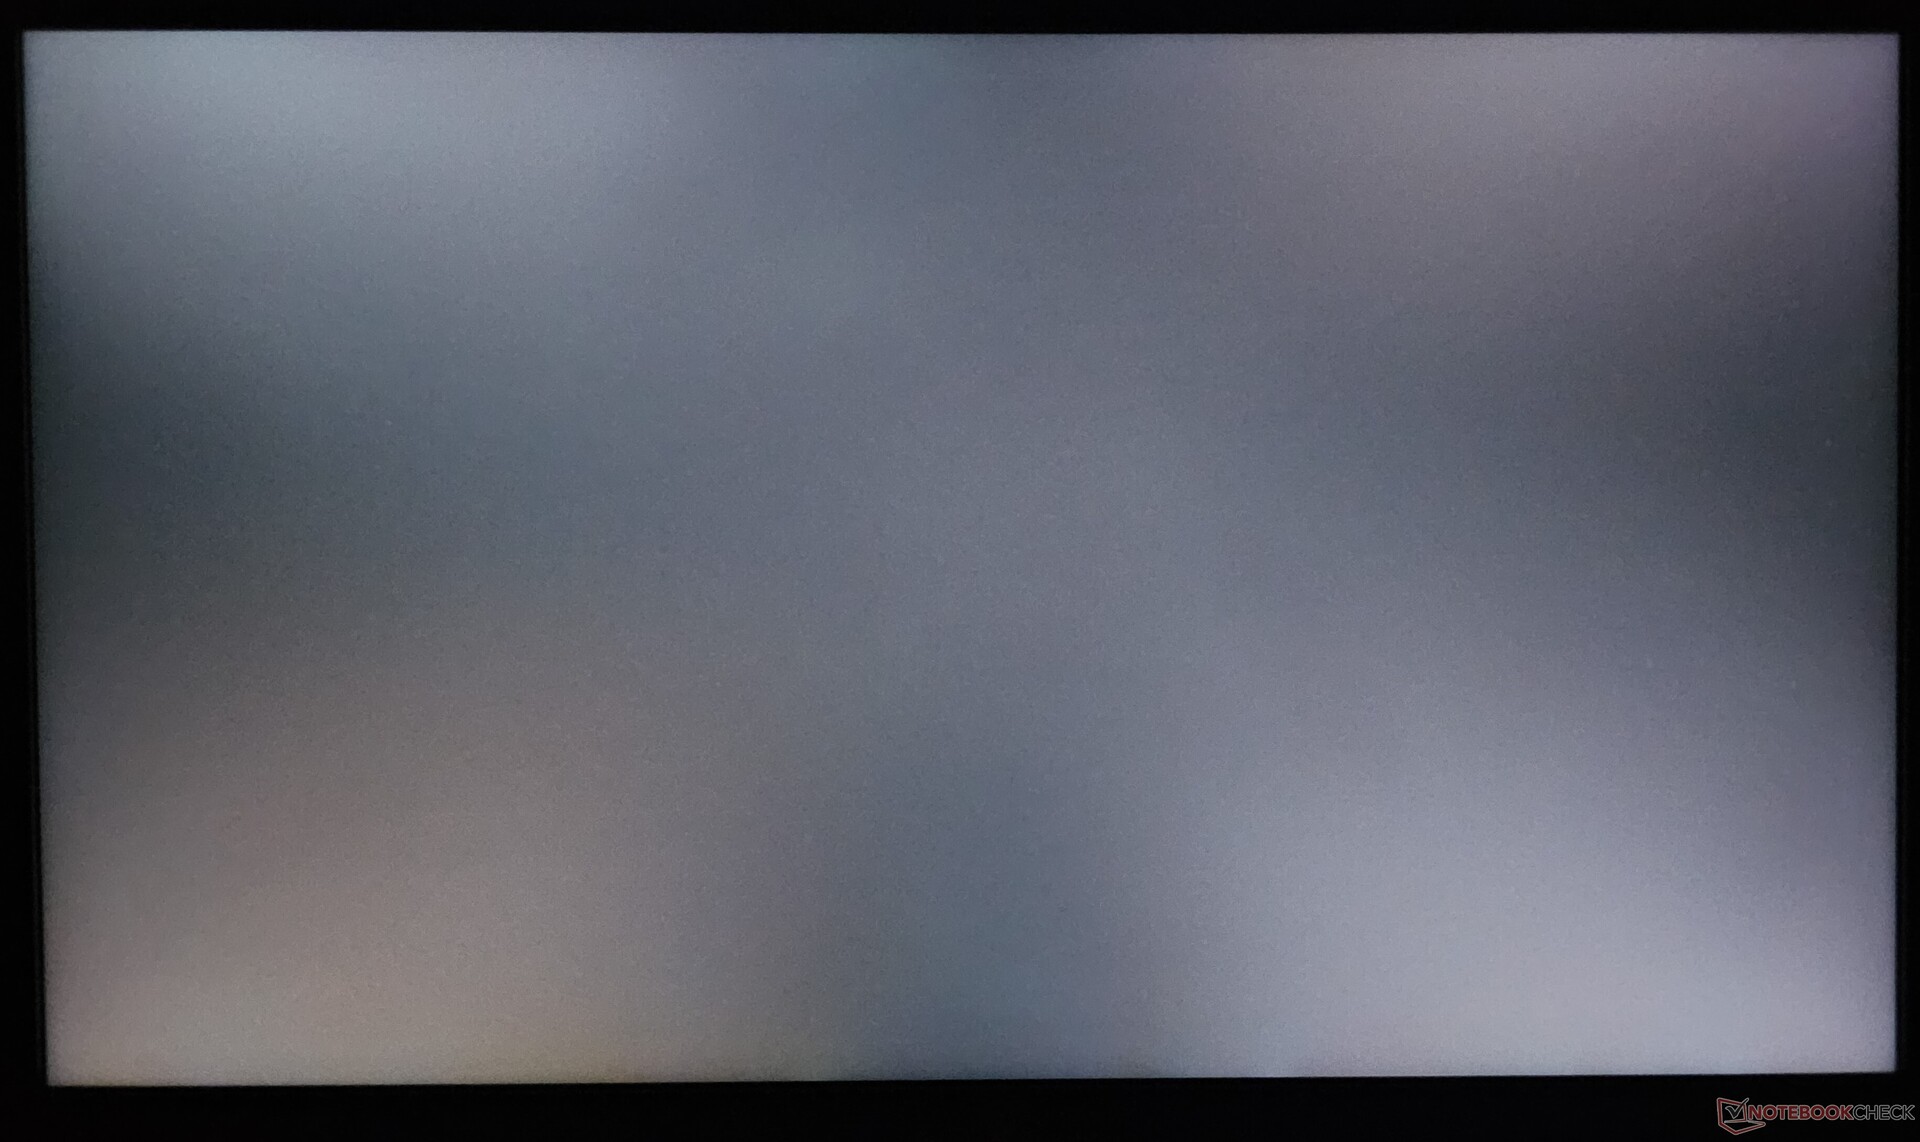
Our LOQ 15 unit came equipped with a BOE QHD panel with a 165 Hz refresh rate. The panel supports Nvidia G-Sync in the discrete GPU mode. Lenovo rates the brightness at 350 nits, but we recorded up to 383 nits at the display's brightest point.
There's backlight bleed in the corners, but the overall brightness uniformity is good at 90%. Black levels and contrast ratio outperform the AUO-made QHD+ panel in the LOQ 16IRH8.

| |||||||||||||||||||||||||
Brightness Distribution: 90 %
Center on Battery: 372 cd/m²
Contrast: 1130:1 (Black: 0.33 cd/m²)
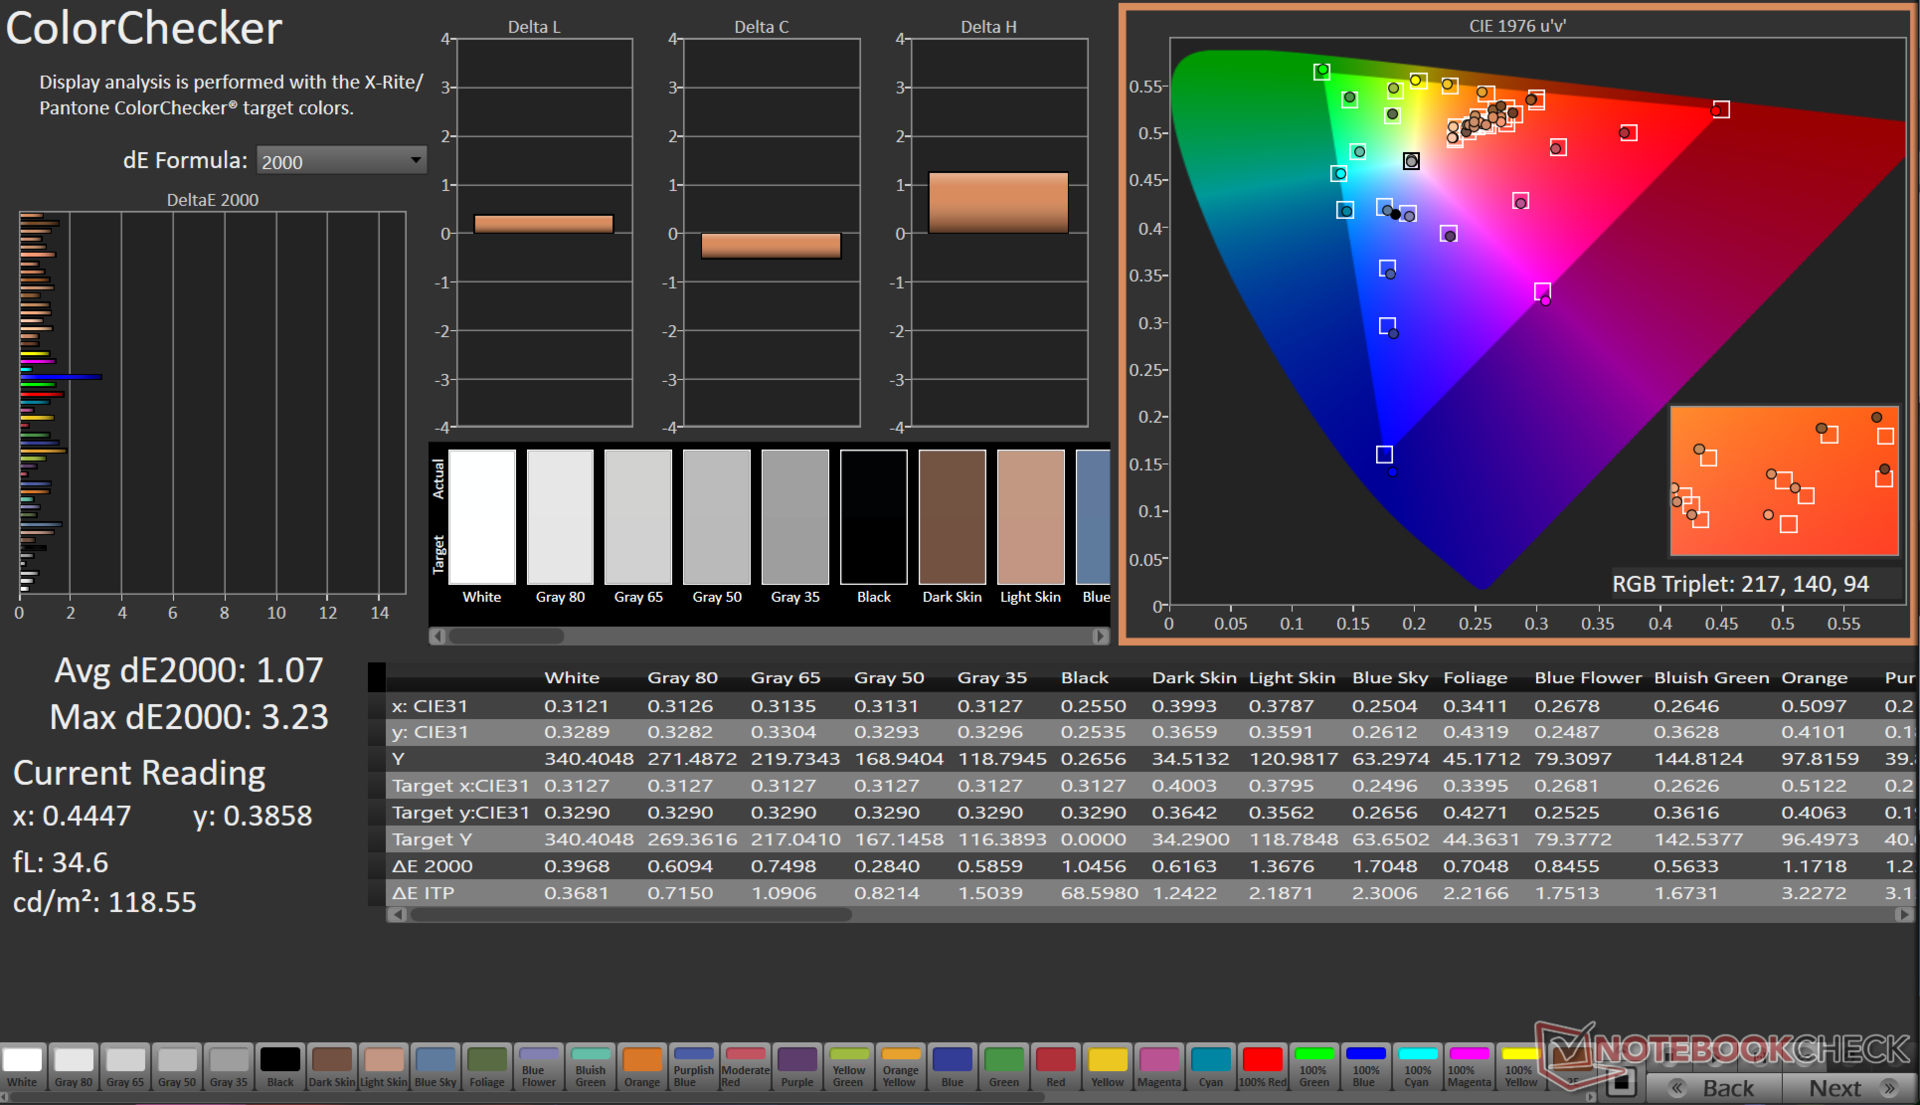
ΔE Color 4.19 | 0.5-29.43 Ø5.1, calibrated: 1.07
ΔE Greyscale 5 | 0.57-98 Ø5.3
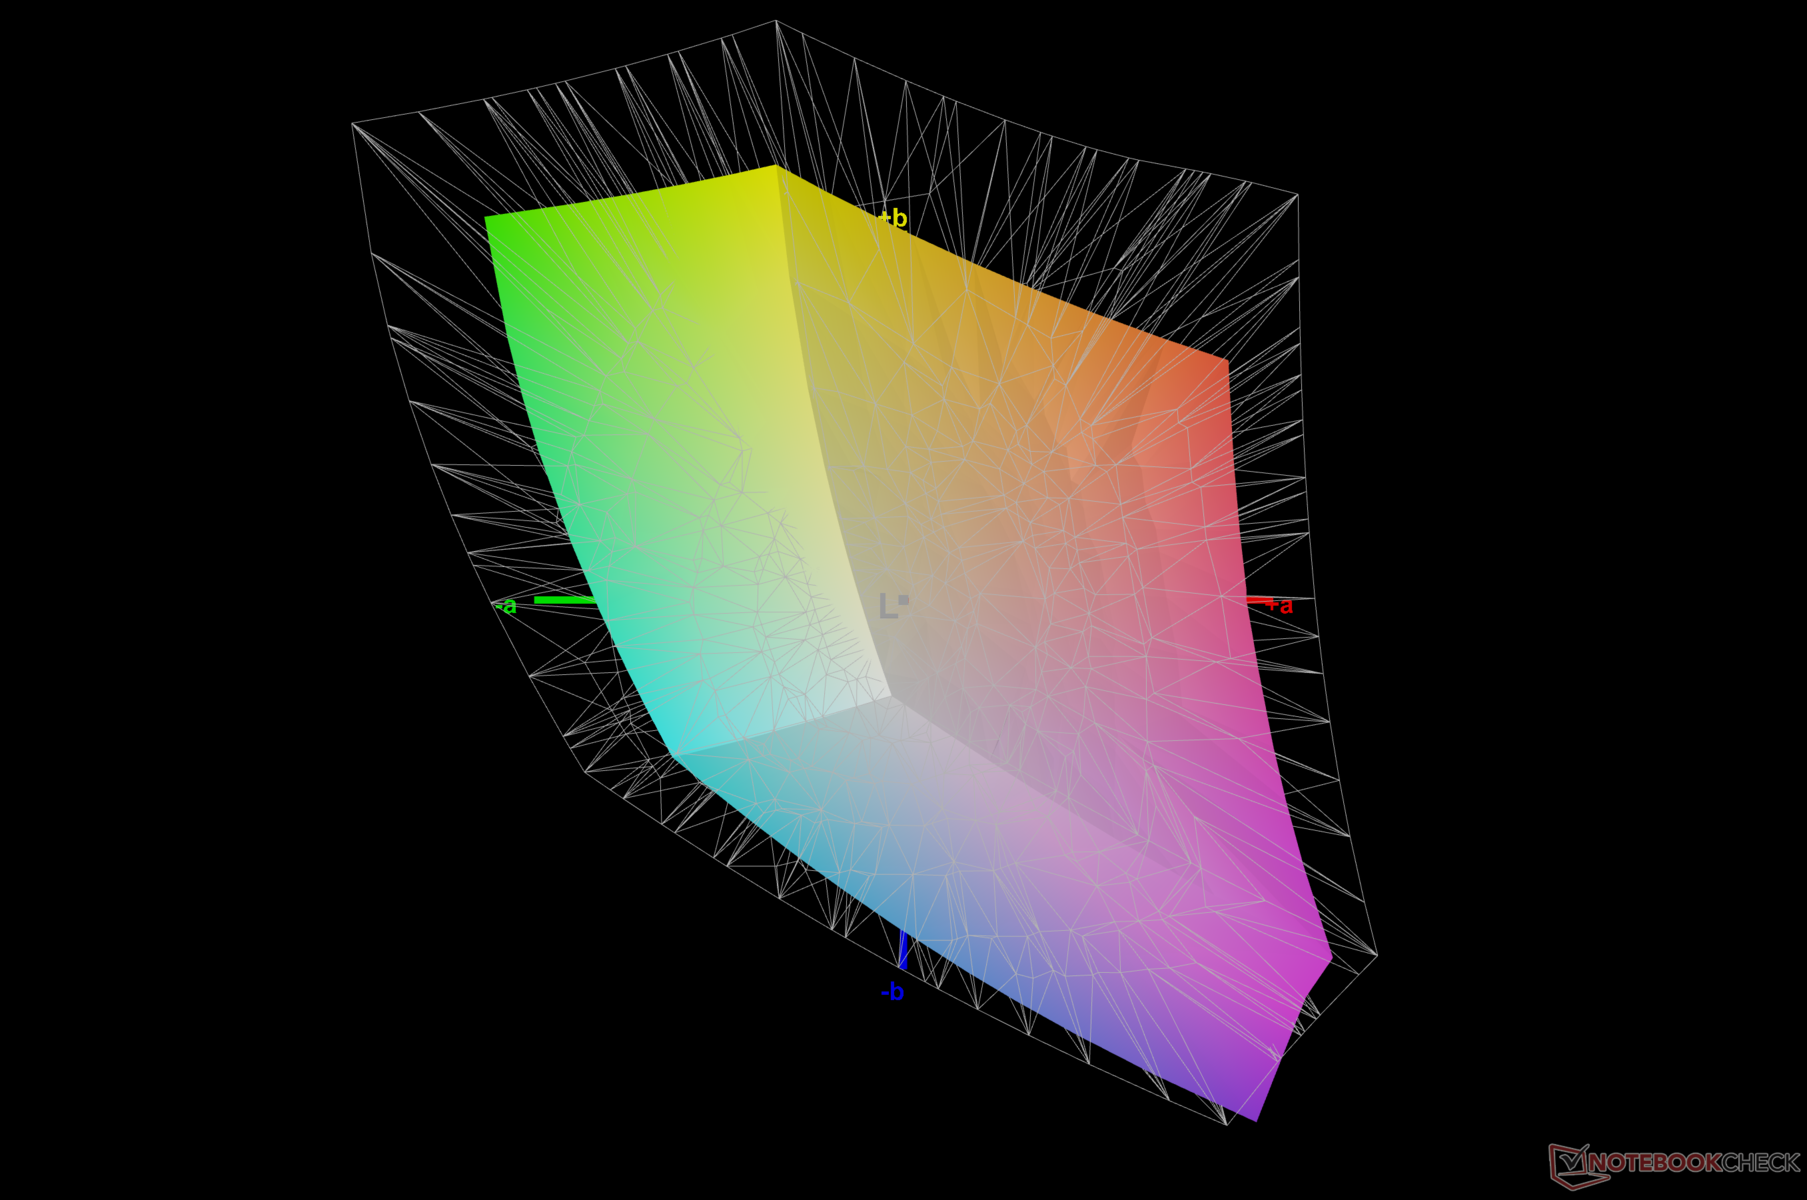
67.7% AdobeRGB 1998 (Argyll 2.2.0 3D)
96.6% sRGB (Argyll 2.2.0 3D)
66.3% Display P3 (Argyll 2.2.0 3D)
Gamma: 1.93
| Lenovo LOQ 15IRH8 Core i7 BOE CQ NE156QHM-NY4, IPS, 2560x1440, 15.60 | Lenovo LOQ 16IRH8 AUOC1A5 (B160QAN03.L), IPS, 2560x1600, 16.00 | Lenovo LOQ 15APH8 BOE NJ NE156FHM-NX3, IPS, 1920x1080, 15.60 | MSI Katana 17 B13VFK B173HAN04.9, IPS LED, 1920x1080, 17.30 | Lenovo Legion Pro 5 16ARX8 (R5 7645HX, RTX 4050) CSOT T3 MNG007DA2-2, IPS, 2560x1600, 16.00 | HP Victus 16-r0077ng CMN162D, IPS, 1920x1080, 16.10 | Dell G15 5530 AUO B156HAN, IPS, 1920x1080, 15.60 | Asus TUF Gaming A16 FA617XS BOE NE160WUM-NX2, IPS, 1920x1200, 16.00 | |
|---|---|---|---|---|---|---|---|---|
| Display | 5% | -39% | -38% | 6% | 1% | 7% | 3% | |
| Display P3 Coverage | 66.3 | 70.5 6% | 40.2 -39% | 40.8 -38% | 71.6 8% | 66.7 1% | 73.1 10% | 69.3 5% |
| sRGB Coverage | 96.6 | 98.9 2% | 60.2 -38% | 61 -37% | 99.8 3% | 98 1% | 98.4 2% | 97.3 1% |
| AdobeRGB 1998 Coverage | 67.7 | 72.6 7% | 41.5 -39% | 42.2 -38% | 72.9 8% | 69 2% | 74.4 10% | 70.7 4% |
| Response Times | -16% | -473% | -385% | -51% | -82% | 34% | -116% | |
| Response Time Grey 50% / Grey 80% * | 5 ? | 7.2 ? -44% | 42.7 ? -754% | 33 ? -560% | 12 ? -140% | 13.3 ? -166% | 3.39 ? 32% | 15.6 ? -212% |
| Response Time Black / White * | 8.41 ? | 7.4 ? 12% | 24.5 ? -191% | 26 ? -209% | 5.2 ? 38% | 8.2 ? 2% | 5.35 ? 36% | 10 ? -19% |
| PWM Frequency | 21620 ? | |||||||
| Screen | 17% | -17% | -46% | 20% | 23% | -5% | 20% | |
| Brightness middle | 373 | 407 9% | 346.2 -7% | 267 -28% | 543 46% | 308 -17% | 320 -14% | 301 -19% |
| Brightness | 365 | 369 1% | 329 -10% | 256 -30% | 516 41% | 285 -22% | 316 -13% | 294 -19% |
| Brightness Distribution | 90 | 85 -6% | 81 -10% | 93 3% | 87 -3% | 85 -6% | 94 4% | 94 4% |
| Black Level * | 0.33 | 0.45 -36% | 0.31 6% | 0.21 36% | 0.58 -76% | 0.25 24% | 0.21 36% | 0.21 36% |
| Contrast | 1130 | 904 -20% | 1117 -1% | 1271 12% | 936 -17% | 1232 9% | 1524 35% | 1433 27% |
| Colorchecker dE 2000 * | 4.19 | 1.43 66% | 4.19 -0% | 4.7 -12% | 1.35 68% | 1.3 69% | 4.55 -9% | 1.79 57% |
| Colorchecker dE 2000 max. * | 8.47 | 3.58 58% | 19.19 -127% | 20.4 -141% | 3.22 62% | 2.76 67% | 9.83 -16% | 3.48 59% |
| Colorchecker dE 2000 calibrated * | 1.07 | 1.07 -0% | 1.66 -55% | 4.5 -321% | 1.31 -22% | 0.92 14% | 1.51 -41% | 1.2 -12% |
| Greyscale dE 2000 * | 5 | 1.13 77% | 2.6 48% | 1.5 70% | 1.03 79% | 1.7 66% | 6.2 -24% | 2.5 50% |
| Gamma | 1.93 114% | 2.5 88% | 2.19 100% | 2.12 104% | 2.38 92% | 2.167 102% | 2.07 106% | 2.265 97% |
| CCT | 7520 86% | 6526 100% | 6749 96% | 6552 99% | 6452 101% | 6767 96% | 6479 100% | 6157 106% |
| Total Average (Program / Settings) | 2% /
9% | -176% /
-87% | -156% /
-92% | -8% /
7% | -19% /
3% | 12% /
3% | -31% /
-3% |
* ... smaller is better
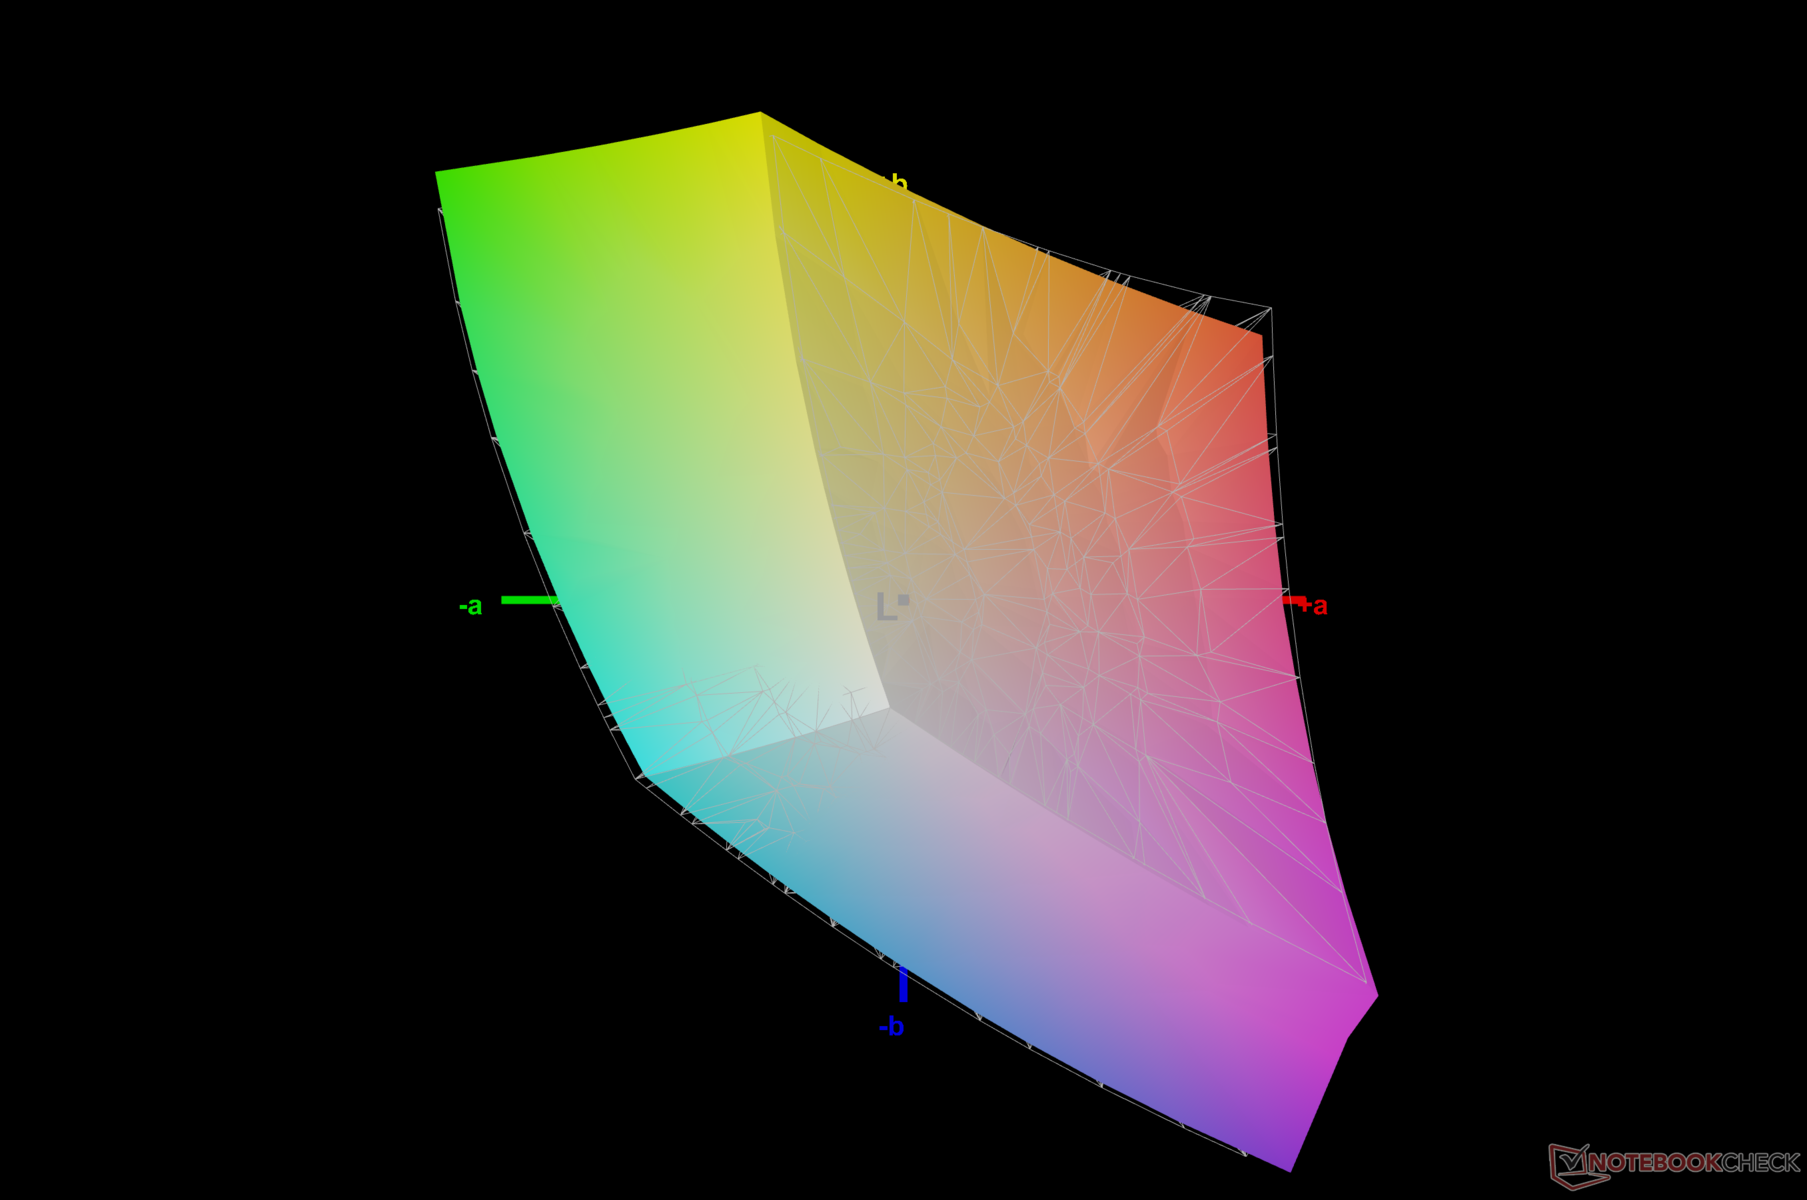
The display covers nearly 97% of the sRGB color gamut, which should be good enough for most gaming and web content. However, Adobe RGB and Display P3 coverage is only mediocre.
That being said, the LOQ 15IRH8's QHD panel has far better color characteristics compared to the 1080p 144 Hz panel in the AMD-powered LOQ 15APH8.

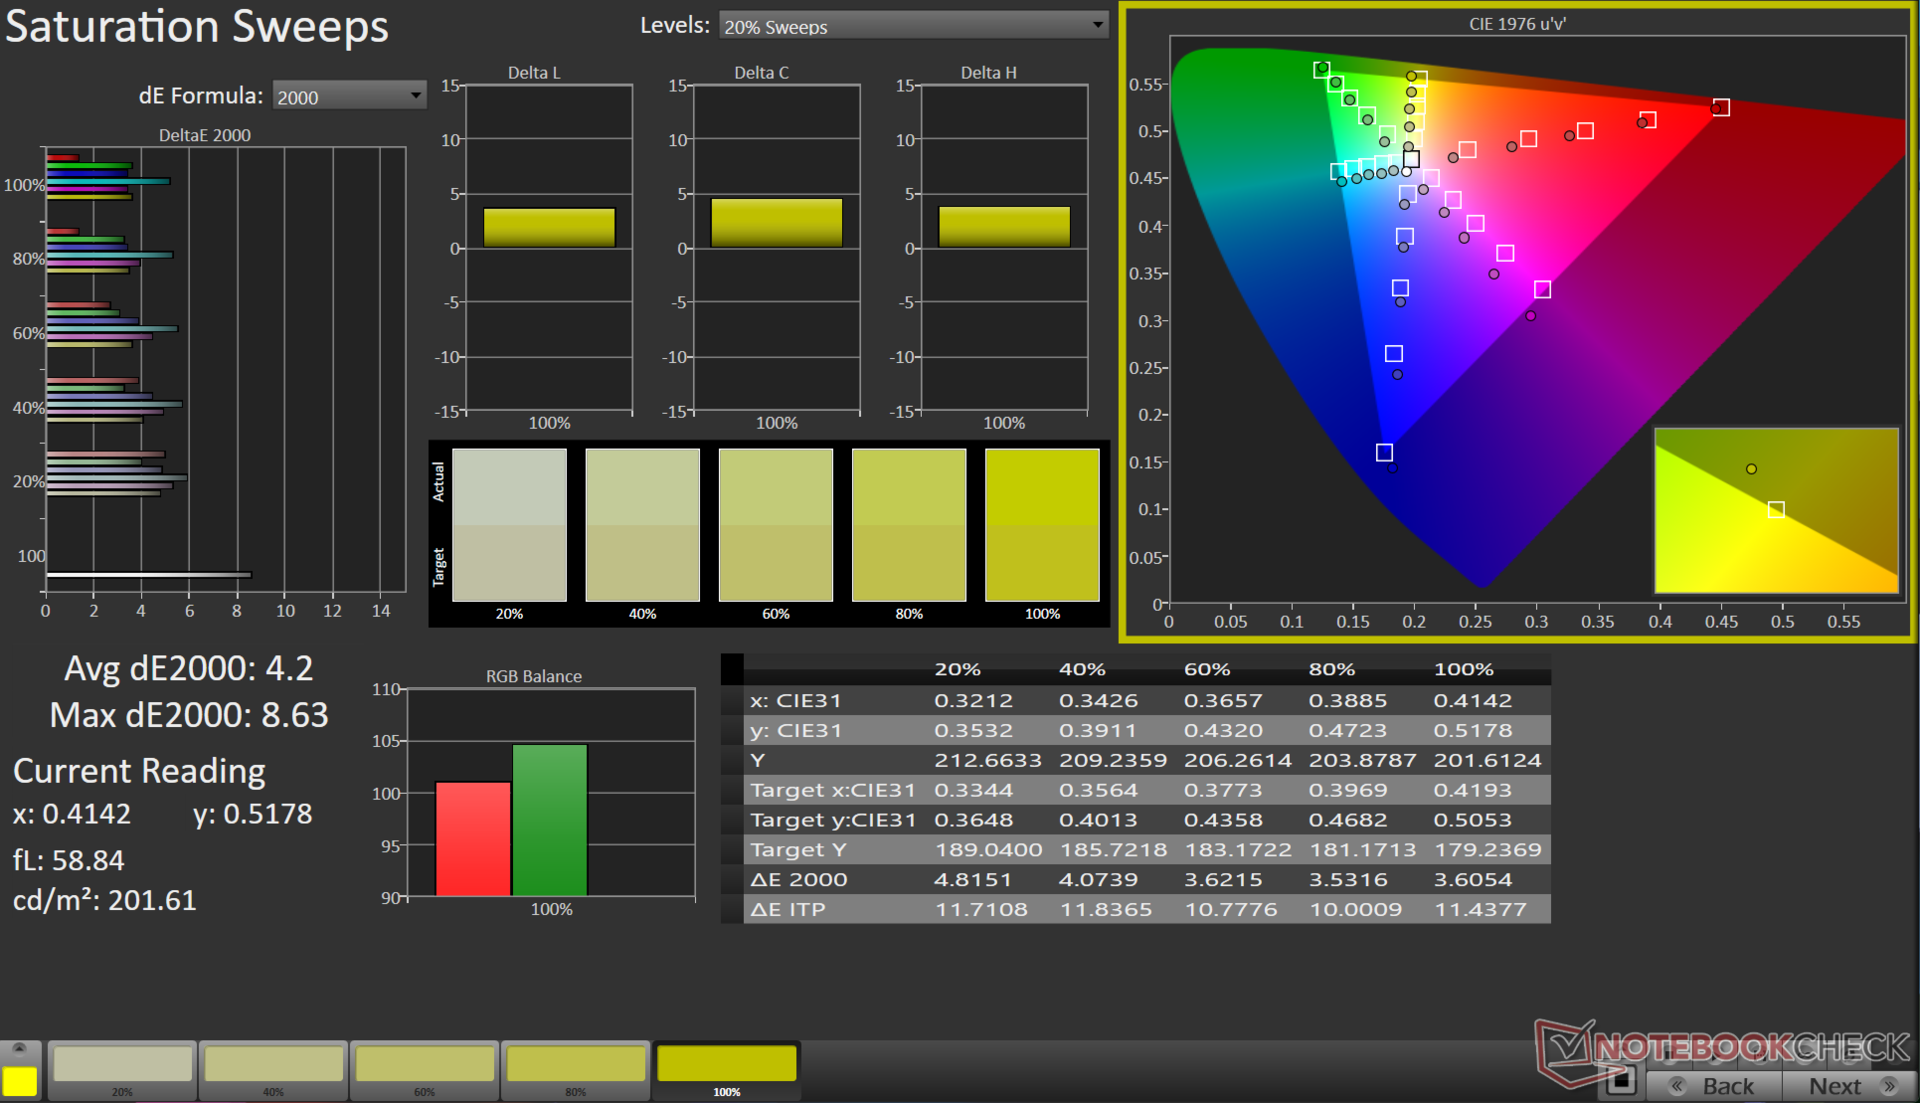
Out-of-the-box colors show large deviations, but our calibration routine using the X-Rite i1Basic Pro 3 spectrophotometer and Calman Ultimate software from Portrait Displays shows significant improvements in Grayscale and ColorChecker Delta E values.
The panel still has trouble in accurately reproducing the 100% Blue part of the spectrum.
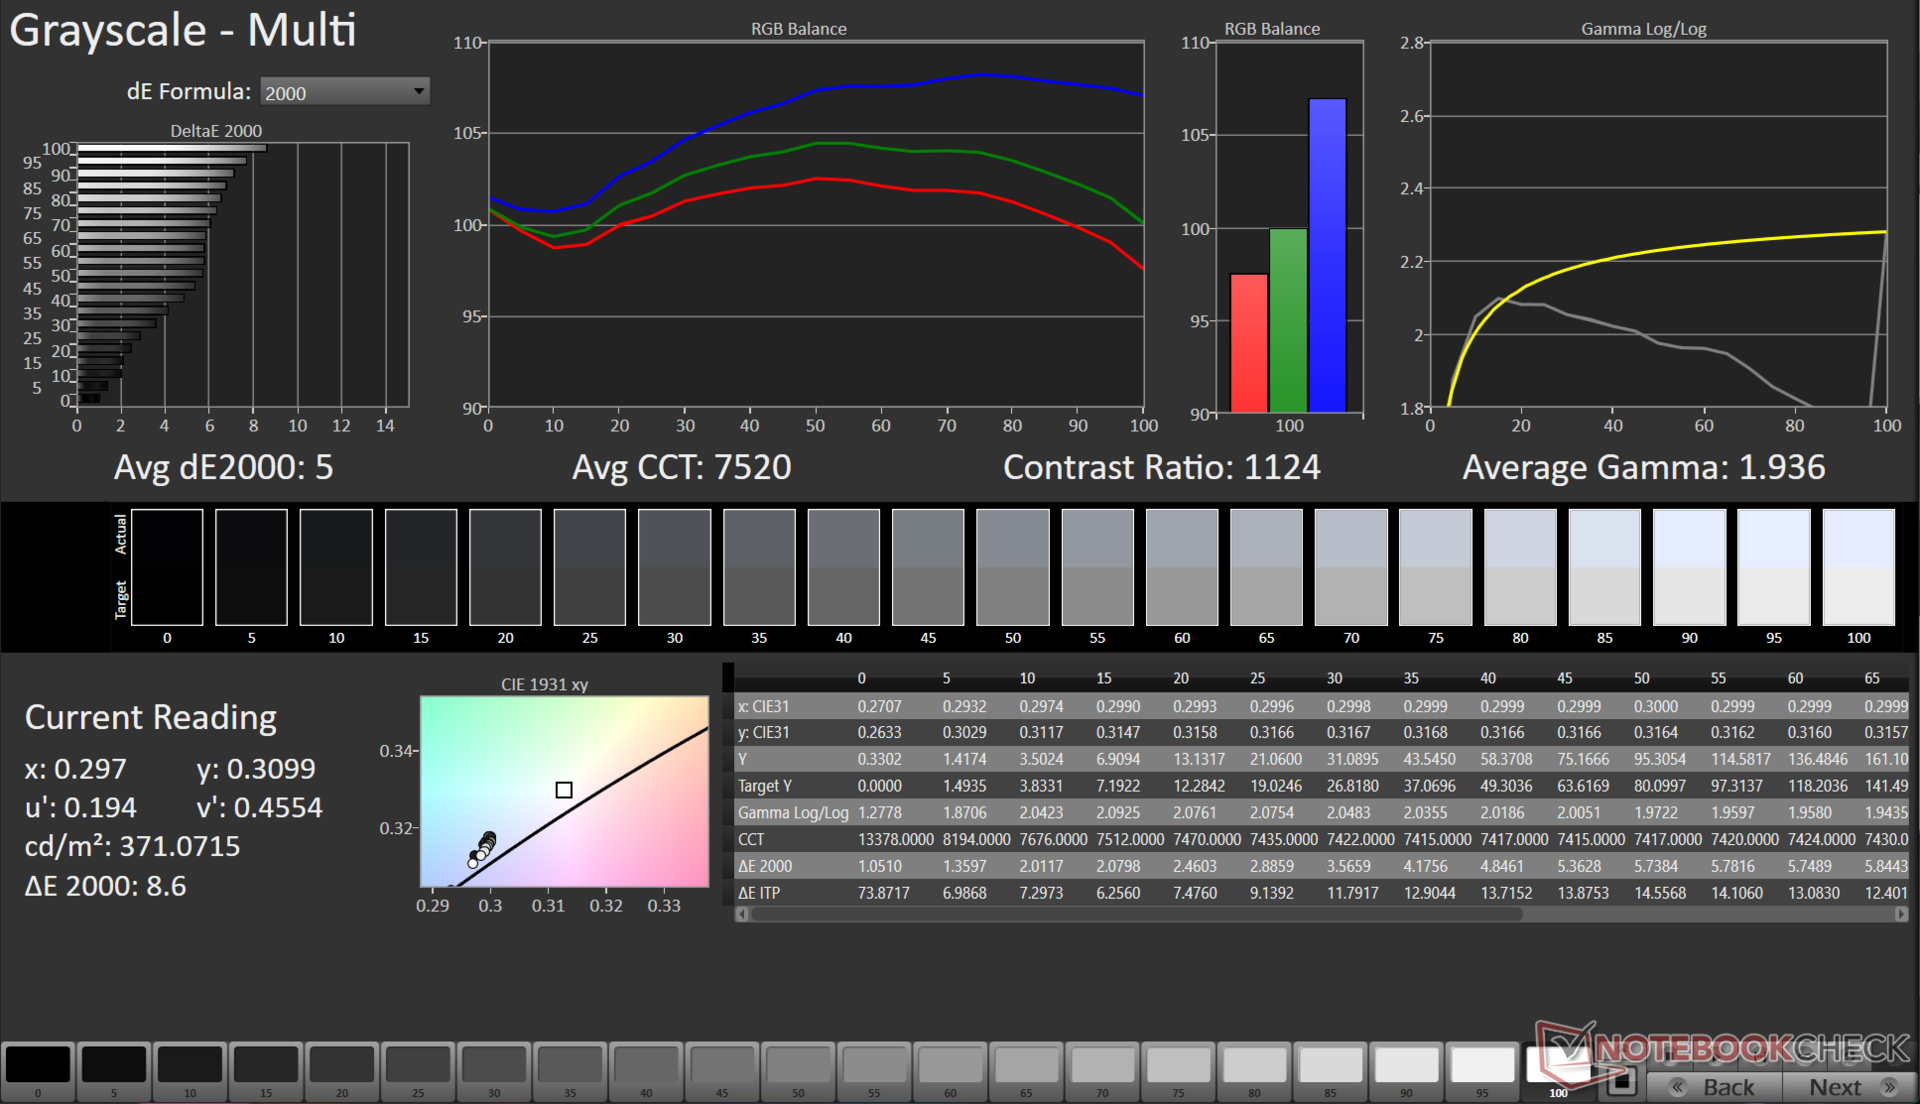


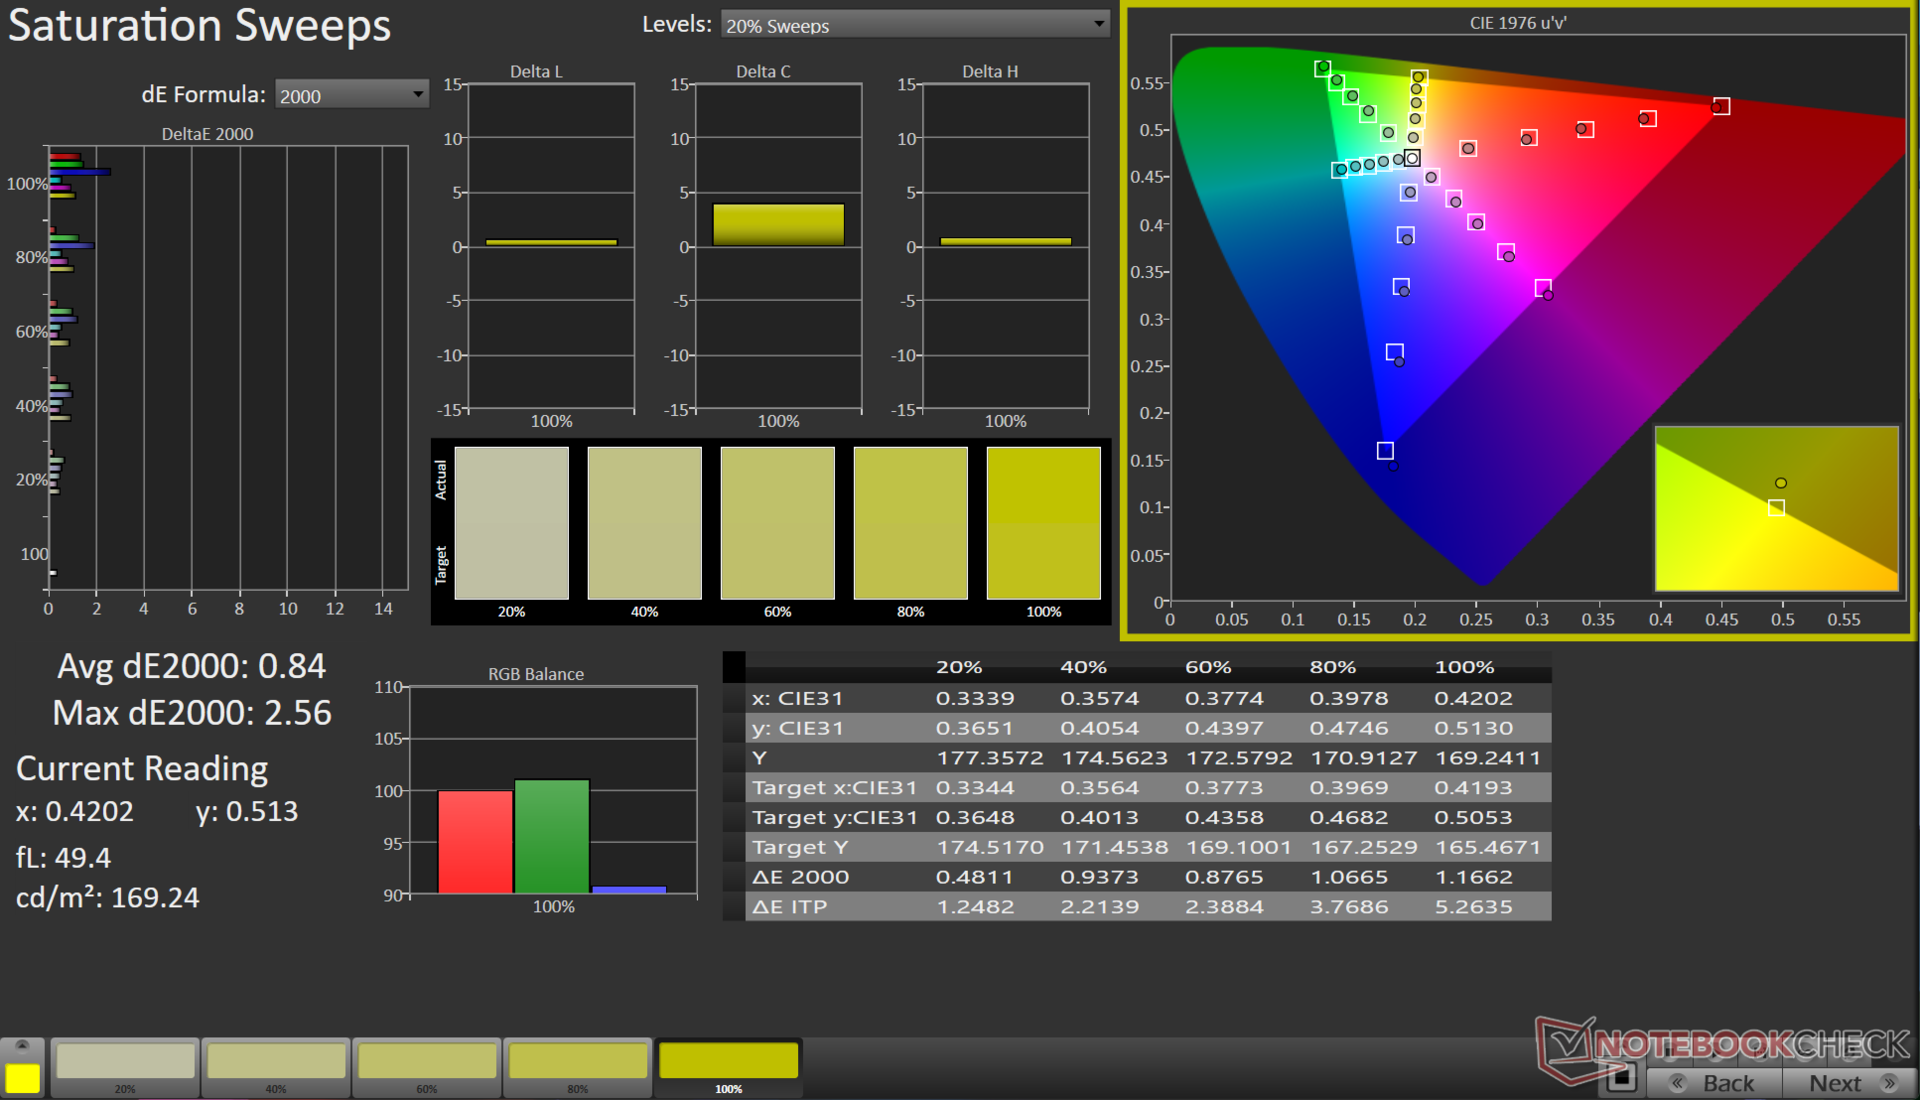
Our calibrated ICC file can be downloaded from the link above.
Display Response Times
| ↔ Response Time Black to White | ||
|---|---|---|
| 8.41 ms ... rise ↗ and fall ↘ combined | ↗ 3.96 ms rise | 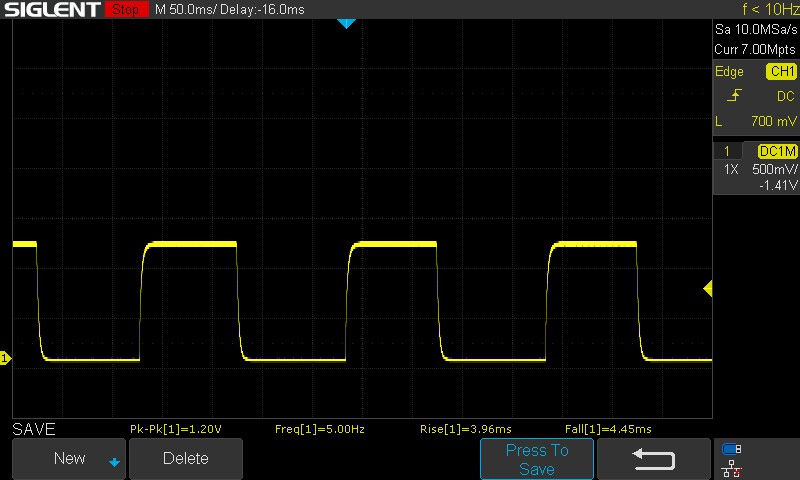 |
| ↘ 4.45 ms fall | ||
| The screen shows fast response rates in our tests and should be suited for gaming. In comparison, all tested devices range from 0.1 (minimum) to 240 (maximum) ms. » 17 % of all devices are better. This means that the measured response time is better than the average of all tested devices (21.8 ms). | ||
| ↔ Response Time 50% Grey to 80% Grey | ||
| 5 ms ... rise ↗ and fall ↘ combined | ↗ 2.16 ms rise | 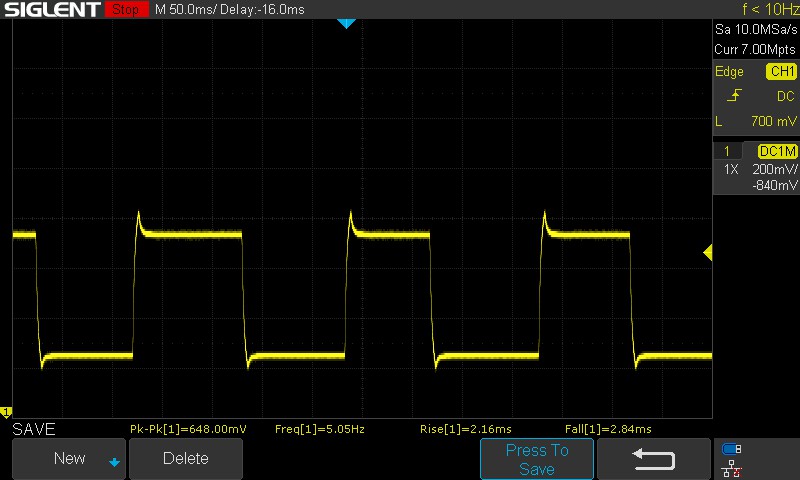 |
| ↘ 2.84 ms fall | ||
| The screen shows very fast response rates in our tests and should be very well suited for fast-paced gaming. In comparison, all tested devices range from 0.2 (minimum) to 636 (maximum) ms. » 10 % of all devices are better. This means that the measured response time is better than the average of all tested devices (34.3 ms). | ||
Response times are a vast improvement over the 1080p panel in the LOQ 15APH8. The panel uses overdrive by default, which helps in fast 5 ms 50% grey to 80% grey transitions. Disabling overdrive from the Lenovo Vantage app increases the combined 50% grey to 80% grey response time to 11 ms.
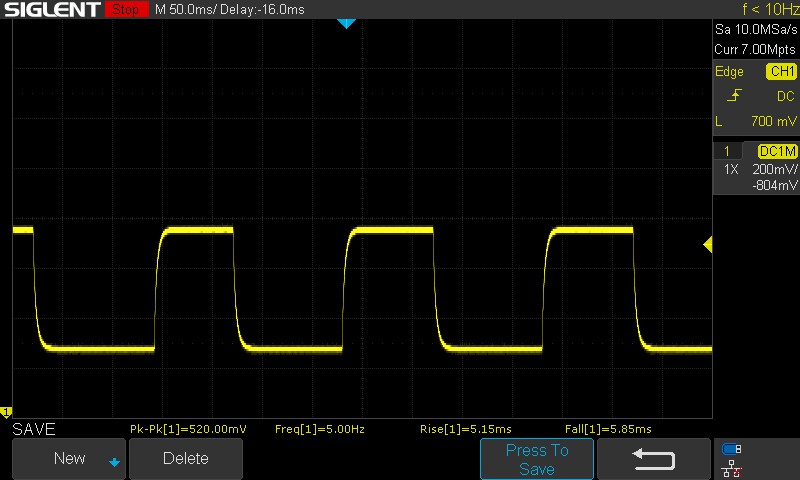
The panel does not show PWM flickering at all tested brightness levels. For more information, refer to our article "Why PWM is such a headache" and also our PWM Ranking Table for a comparison of measured PWM across all reviewed devices.
Screen Flickering / PWM (Pulse-Width Modulation)
| Screen flickering / PWM not detected | ≤ 100 % brightness setting |  | |
In comparison: 53 % of all tested devices do not use PWM to dim the display. If PWM was detected, an average of 18732 (minimum: 5 - maximum: 3846000) Hz was measured. | |||
Outdoor visibility is fine for general use, although particularly bright sunny days can be overwhelming for the 350 nits panel. Viewing angles are relatively stable with minimal brightness and color loss at the extremes.


Performance: Core i7-13620H struggles in putting up a steady show
In India, Lenovo provides multiple LOQ 15 configuration options with both Intel and AMD processors. The Intel-based models offer a choice between the Core i5-12450H and Core i7-13620H CPUs, while the AMD variants feature the Ryzen 5 7640HS or Ryzen 7 7840HS parts. For graphics, customers can select laptop versions of the RTX 2050, RTX 3050, RTX 4050, or RTX 4060 GPUs.
For the US market, Lenovo configures the LOQ 15 with either the Core i7-13700H paired with the RTX 4050 or the Core i5-13420H coupled with the RTX 2050.
Testing Conditions
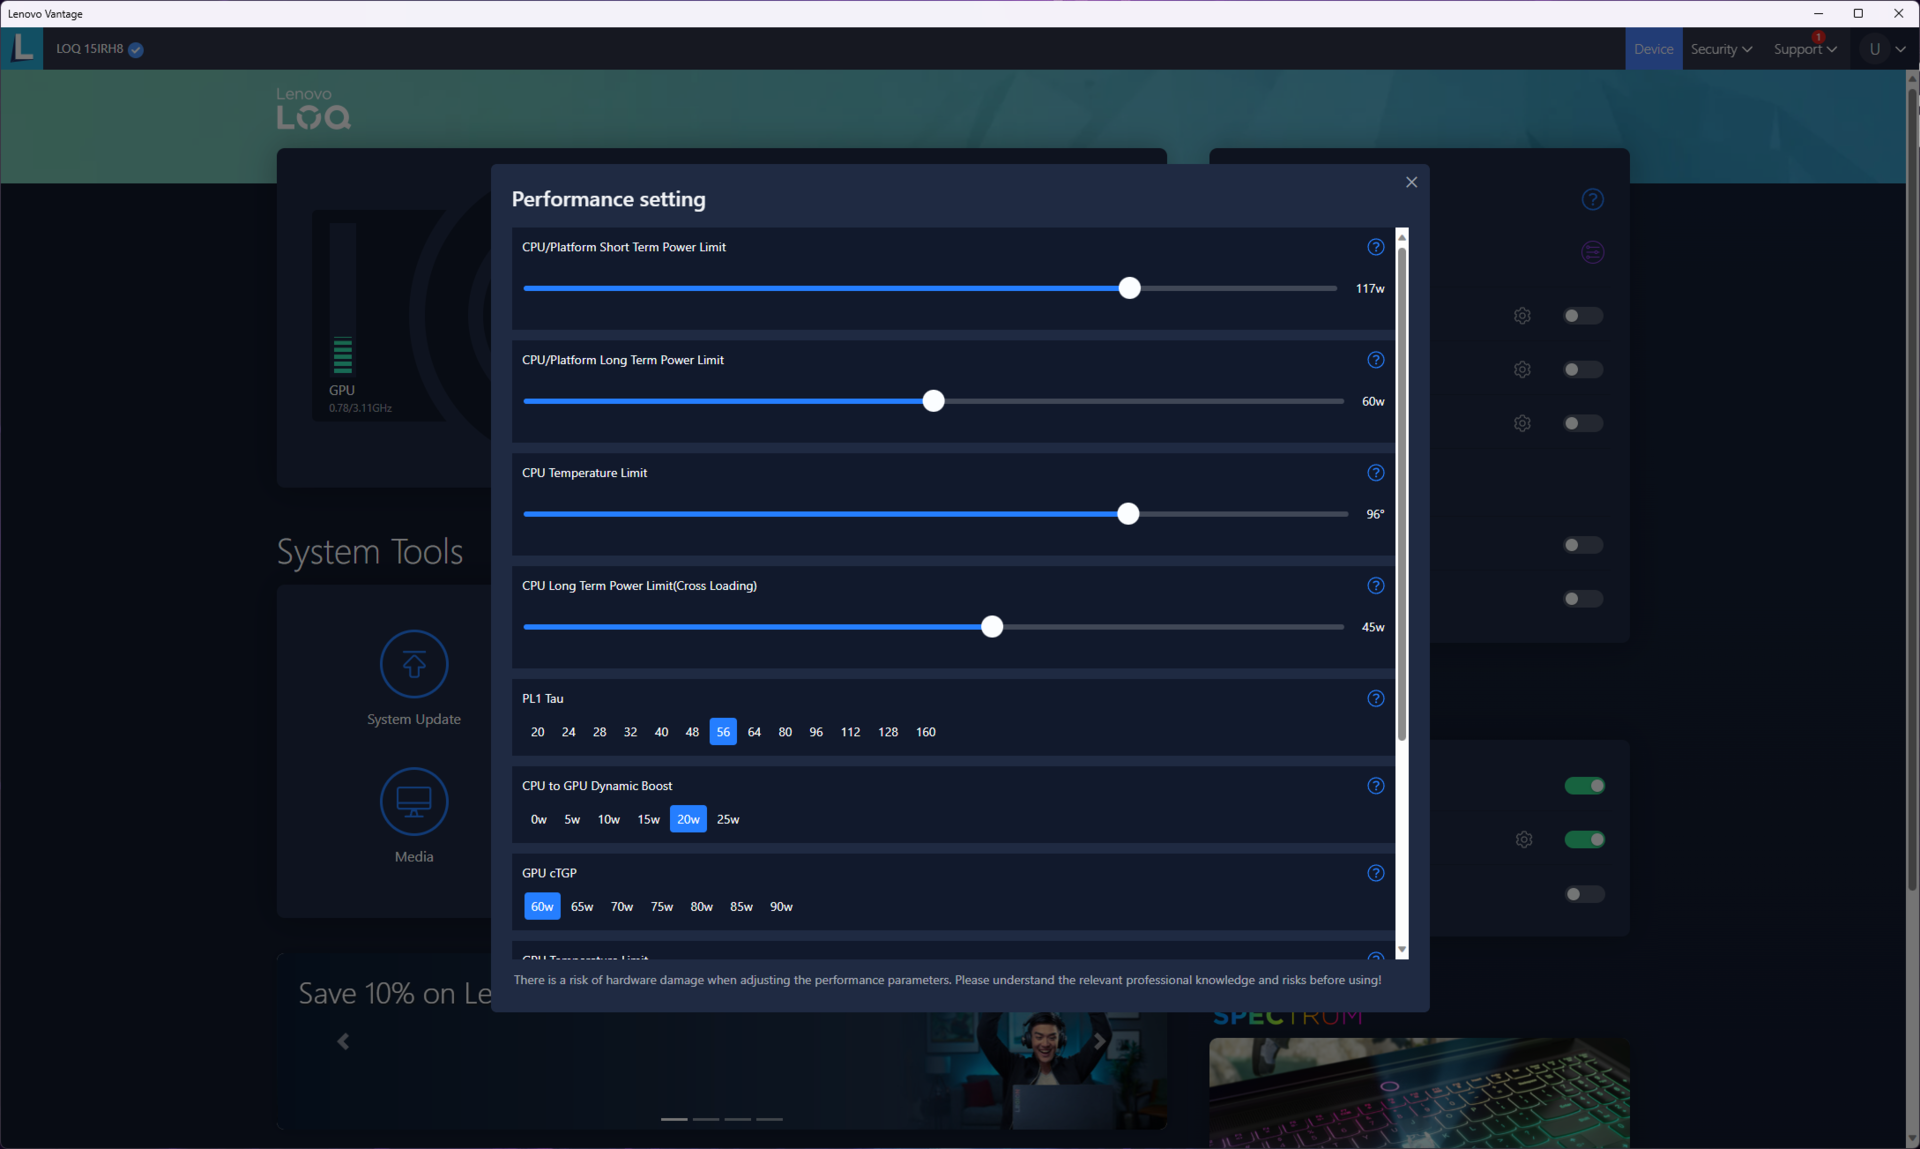
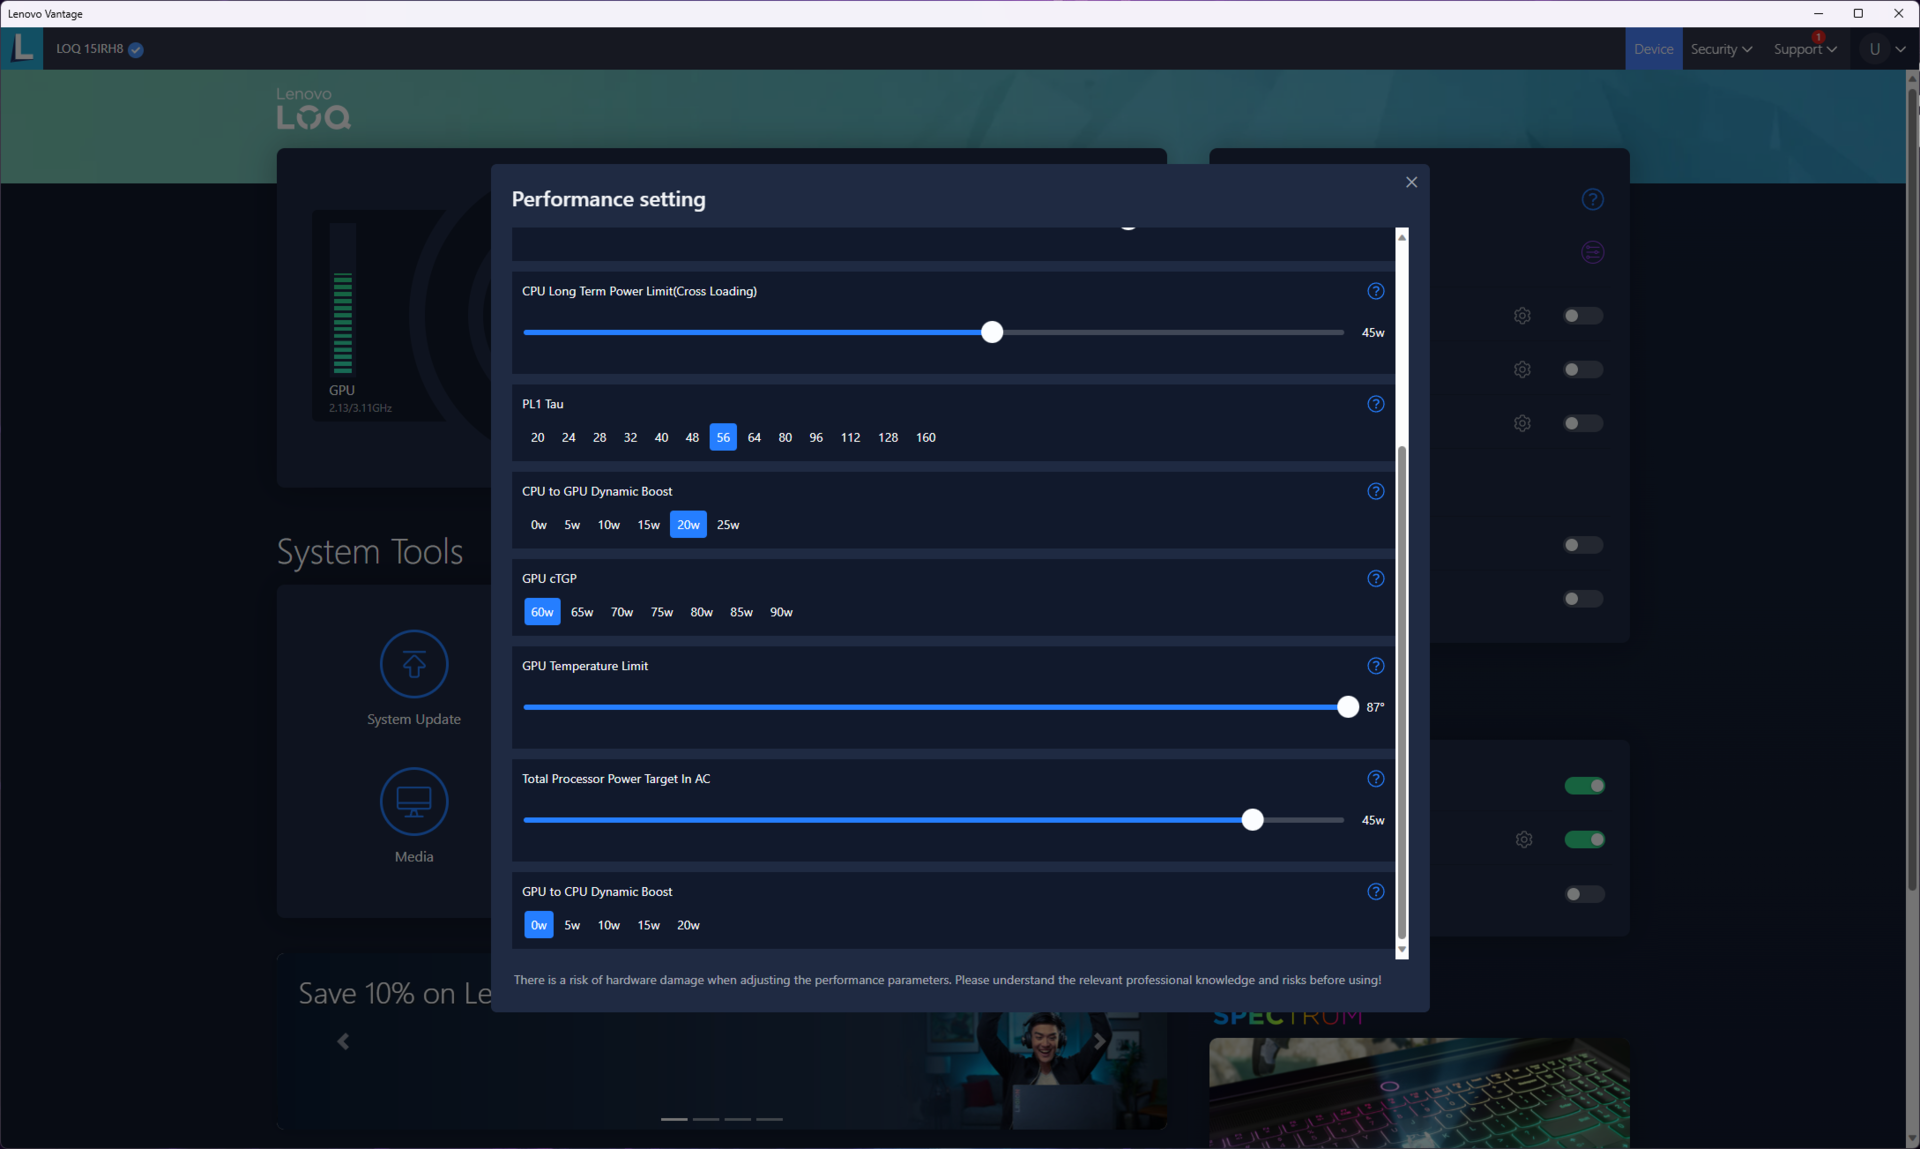
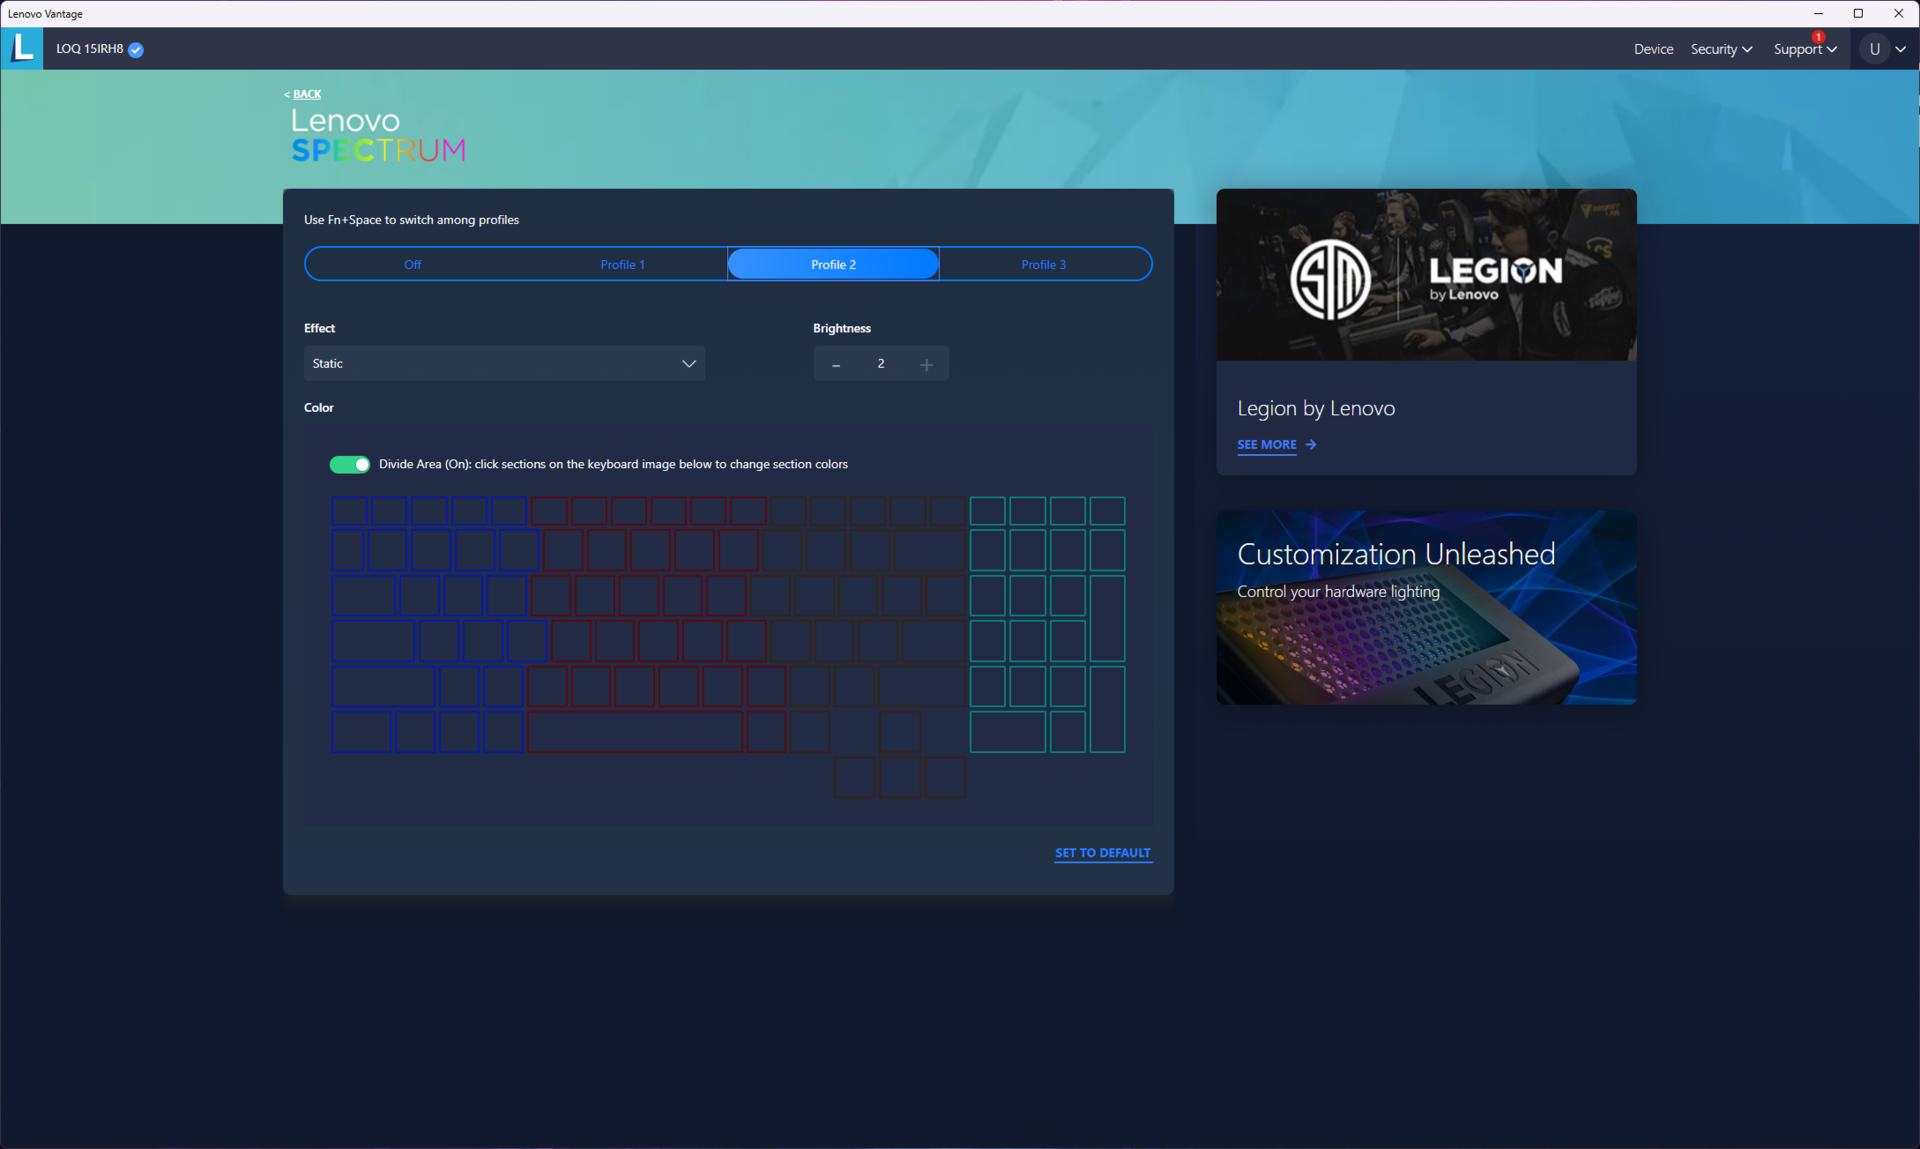
Lenovo Vantage allows easily changing power profiles, RGB effects, and other properties of the LOQ 15. The app also allows experienced users to set their own CPU power limits, duration, GPU TDP, GPU to CPU Dynamic Boost, and temperature limits as desired.
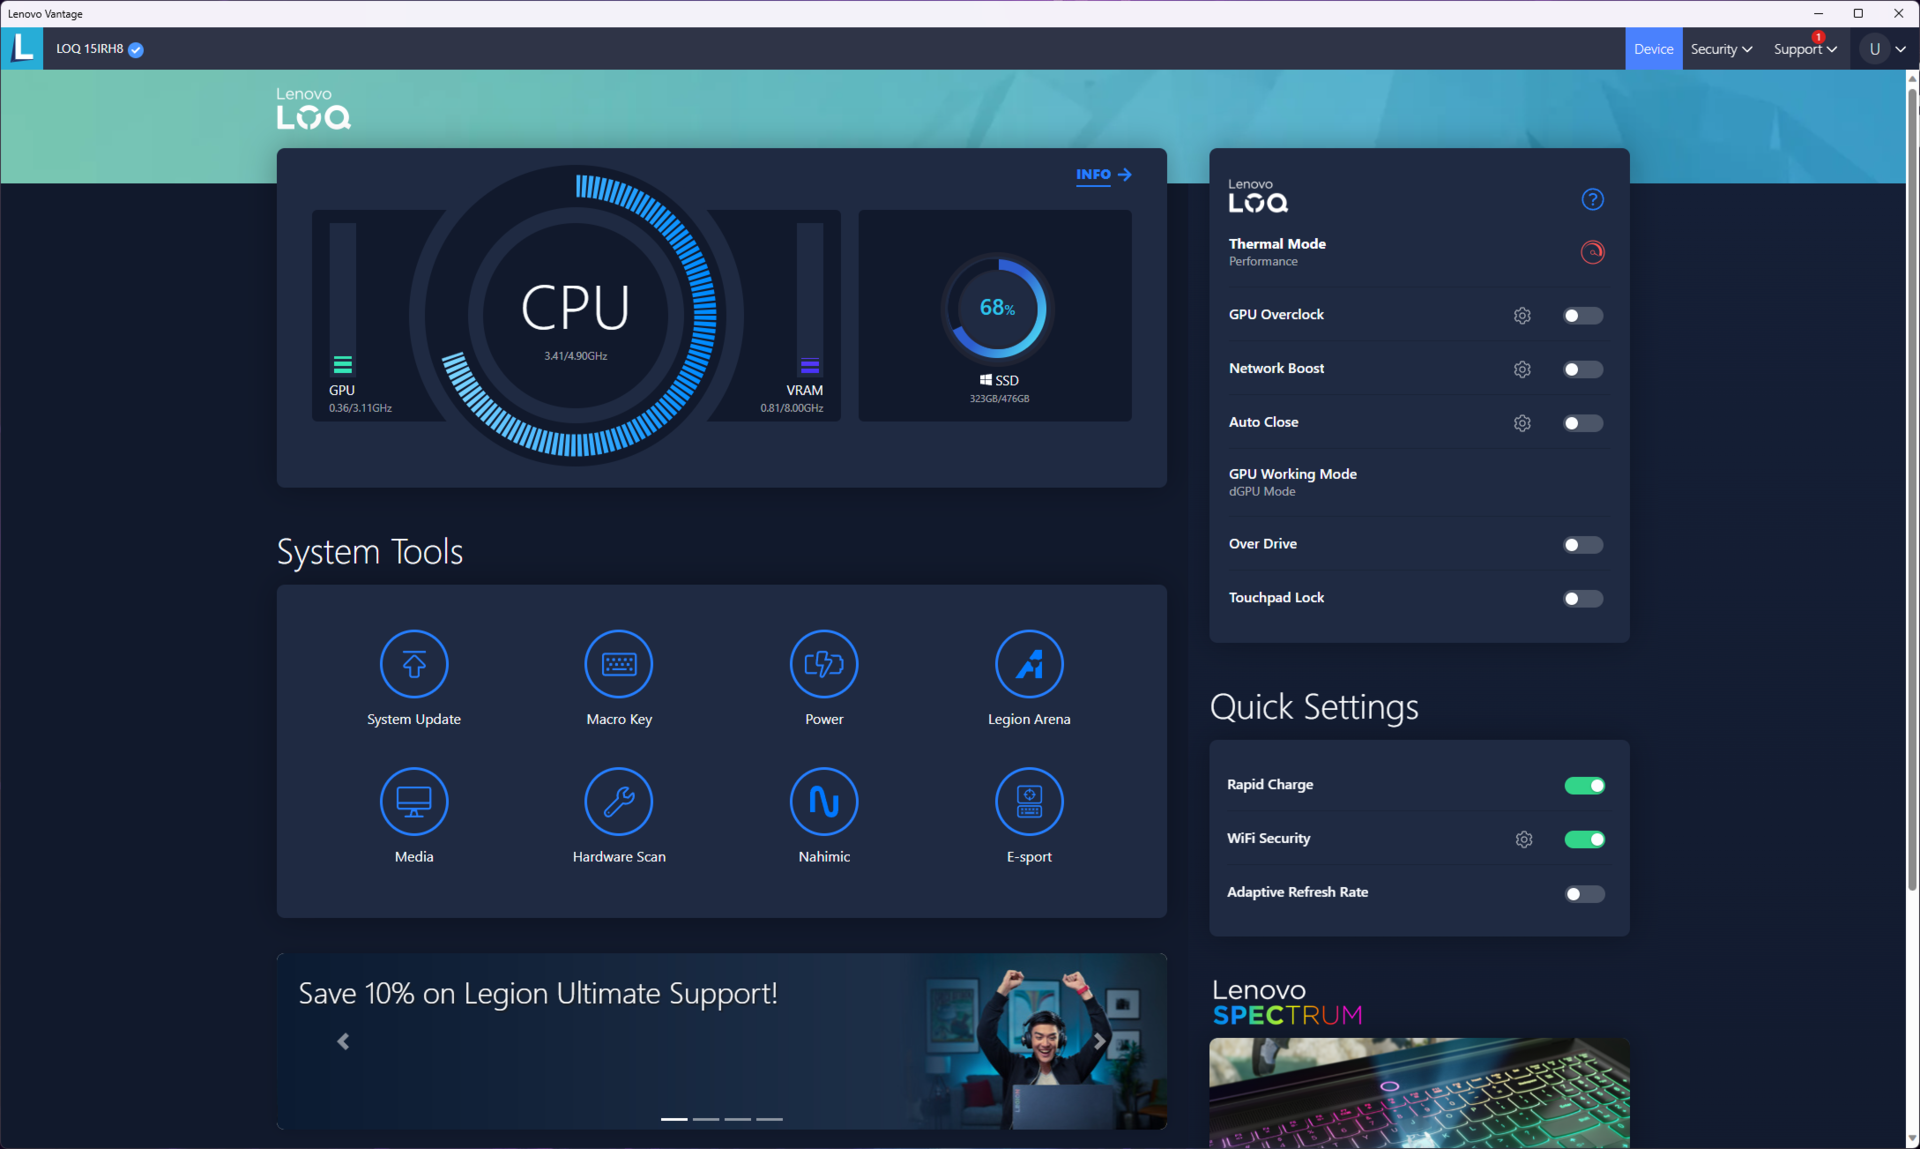
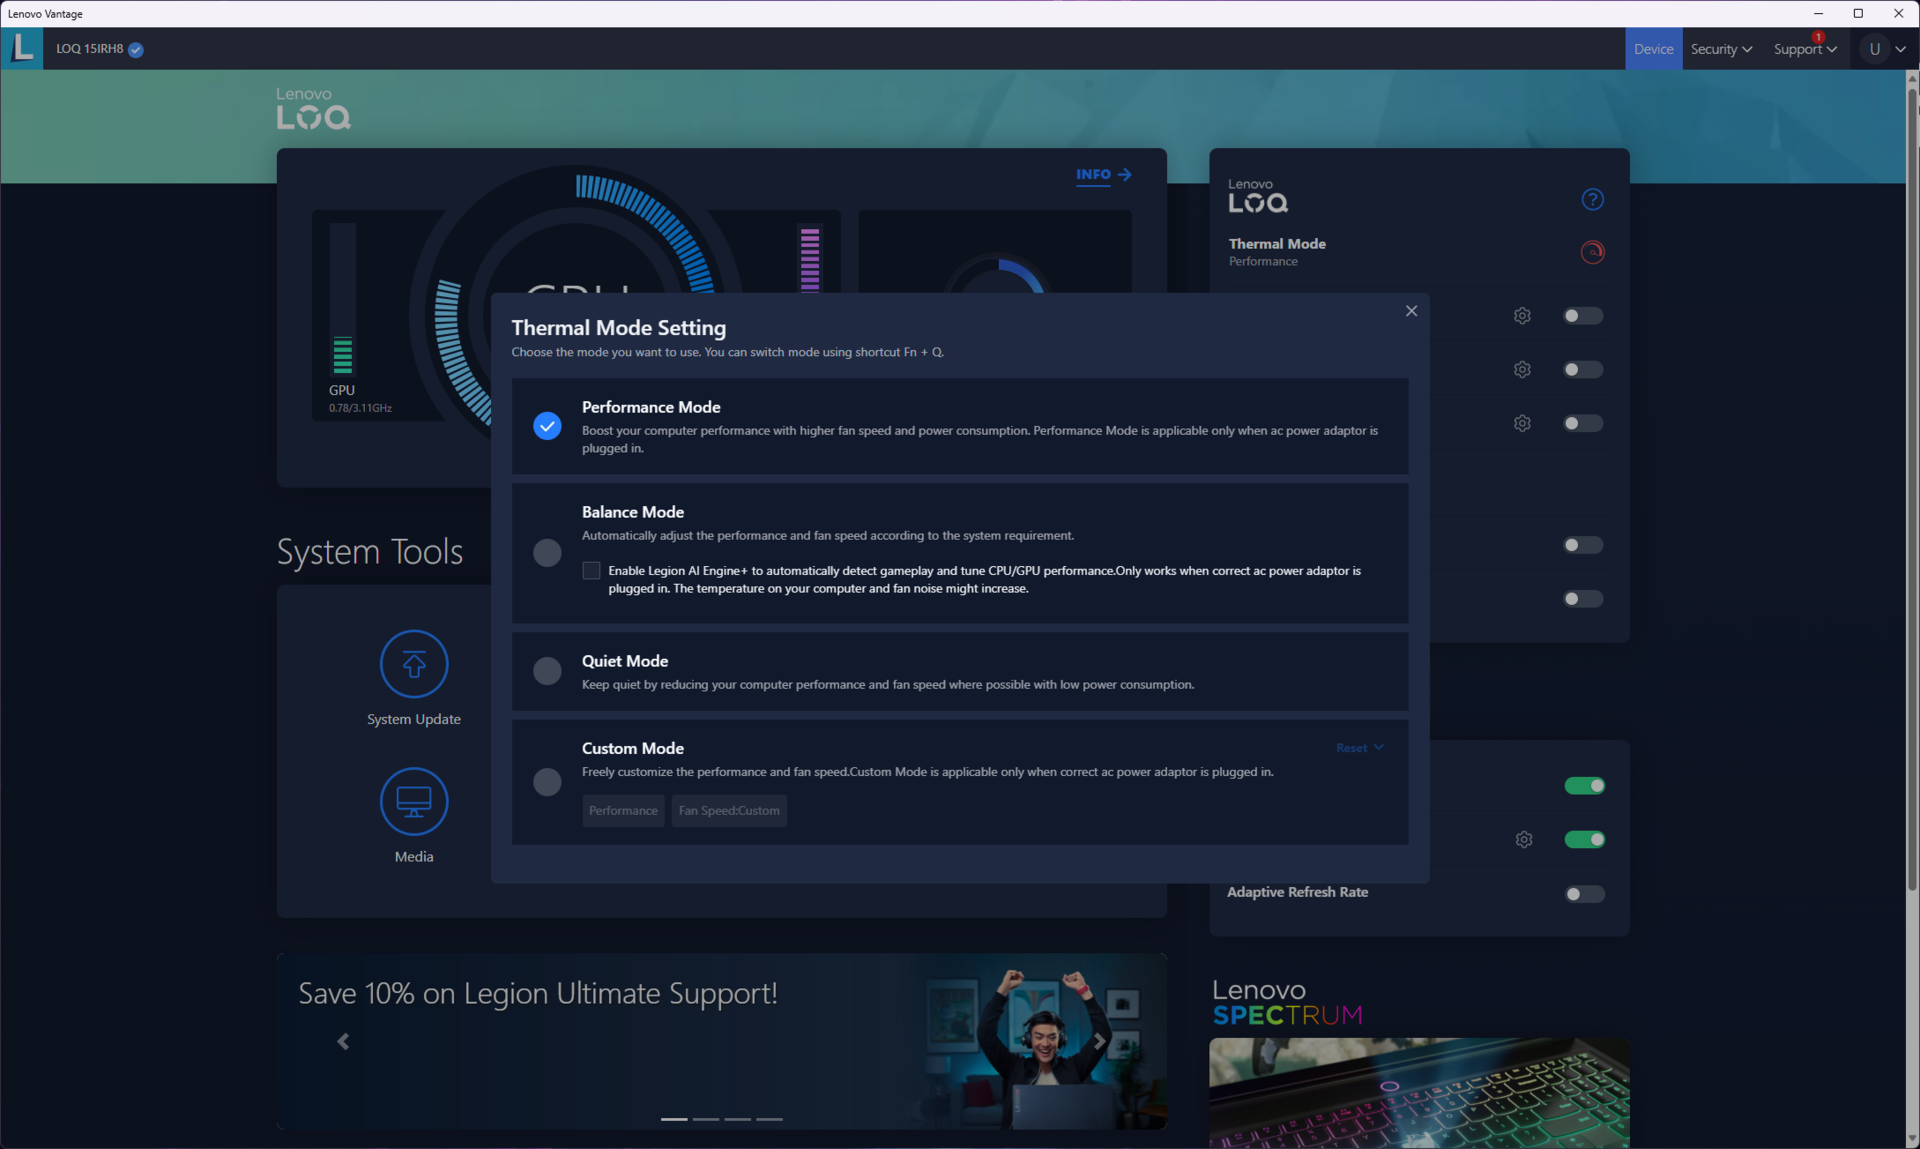
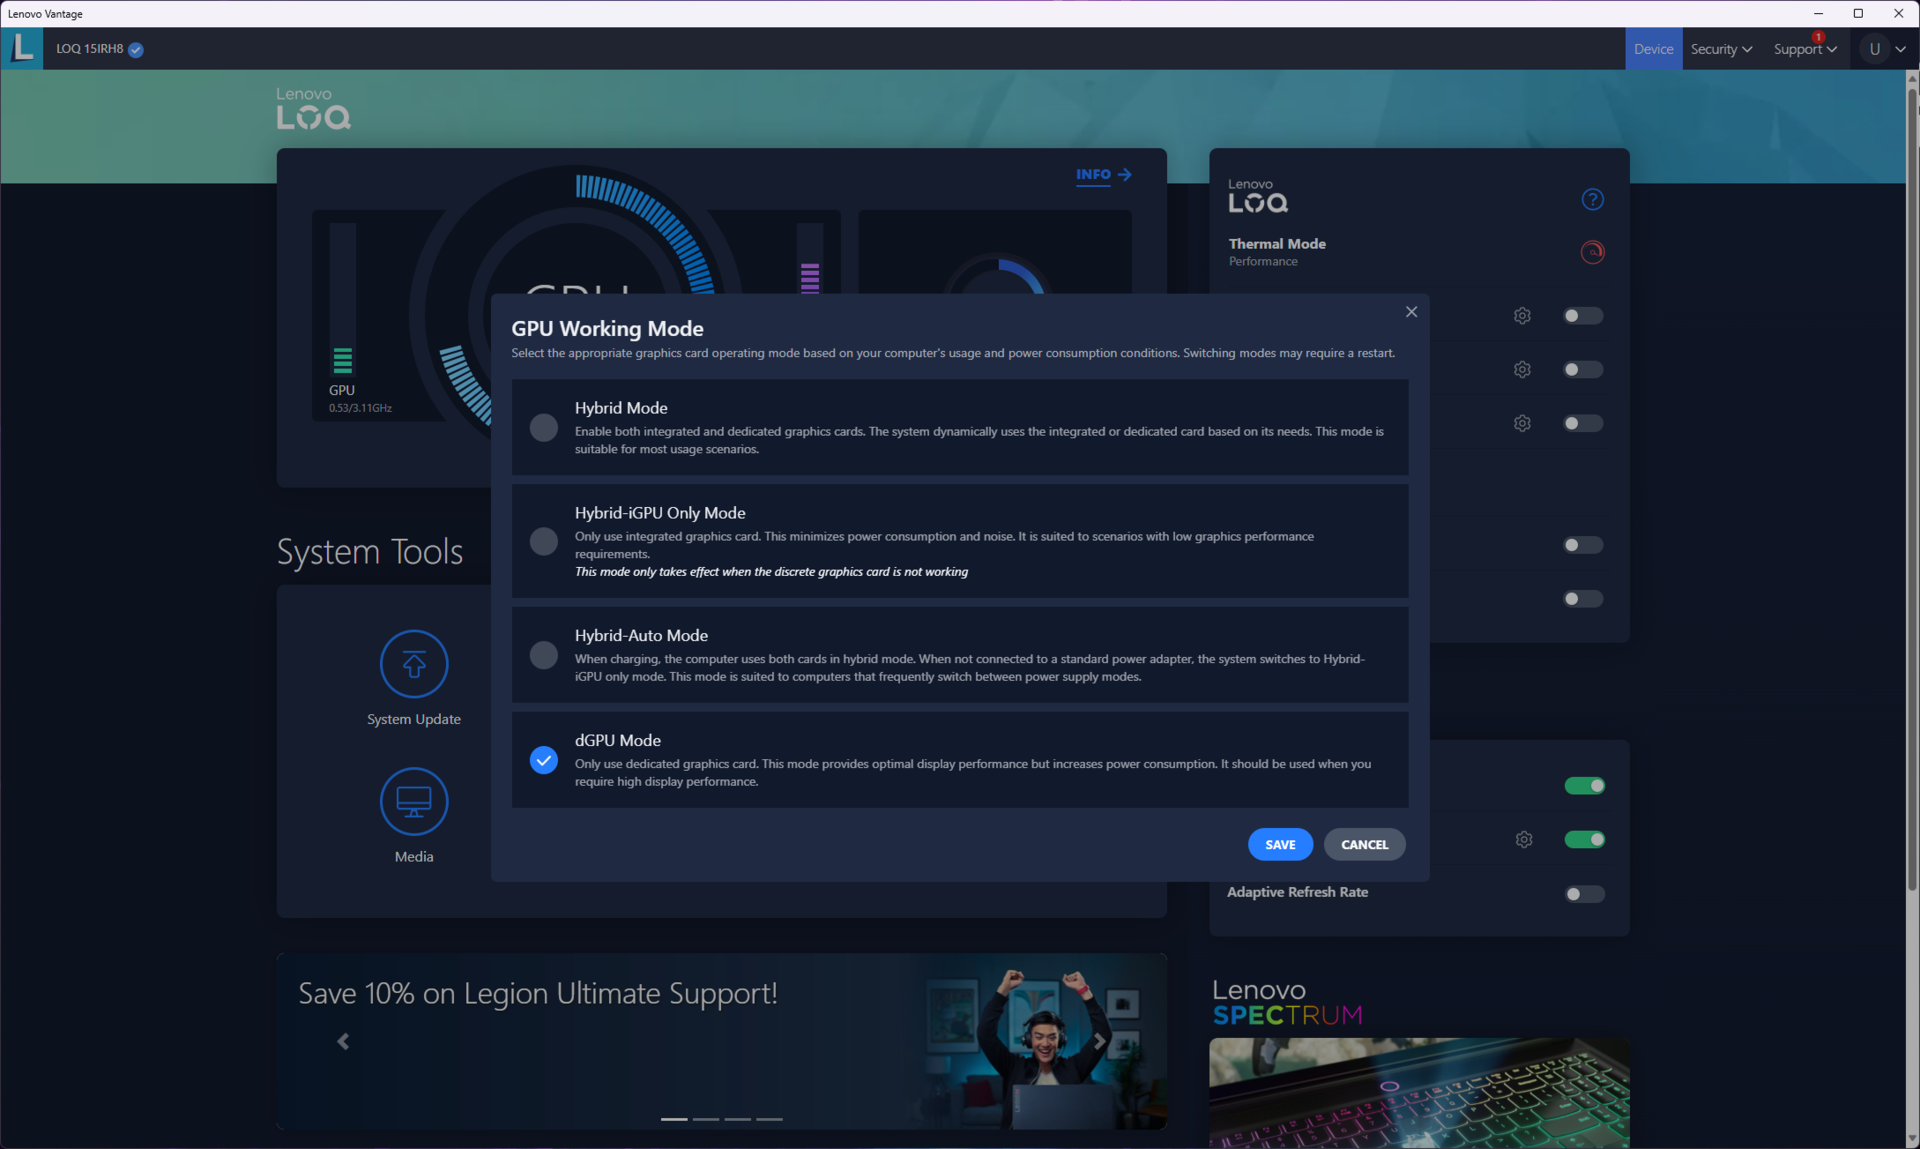
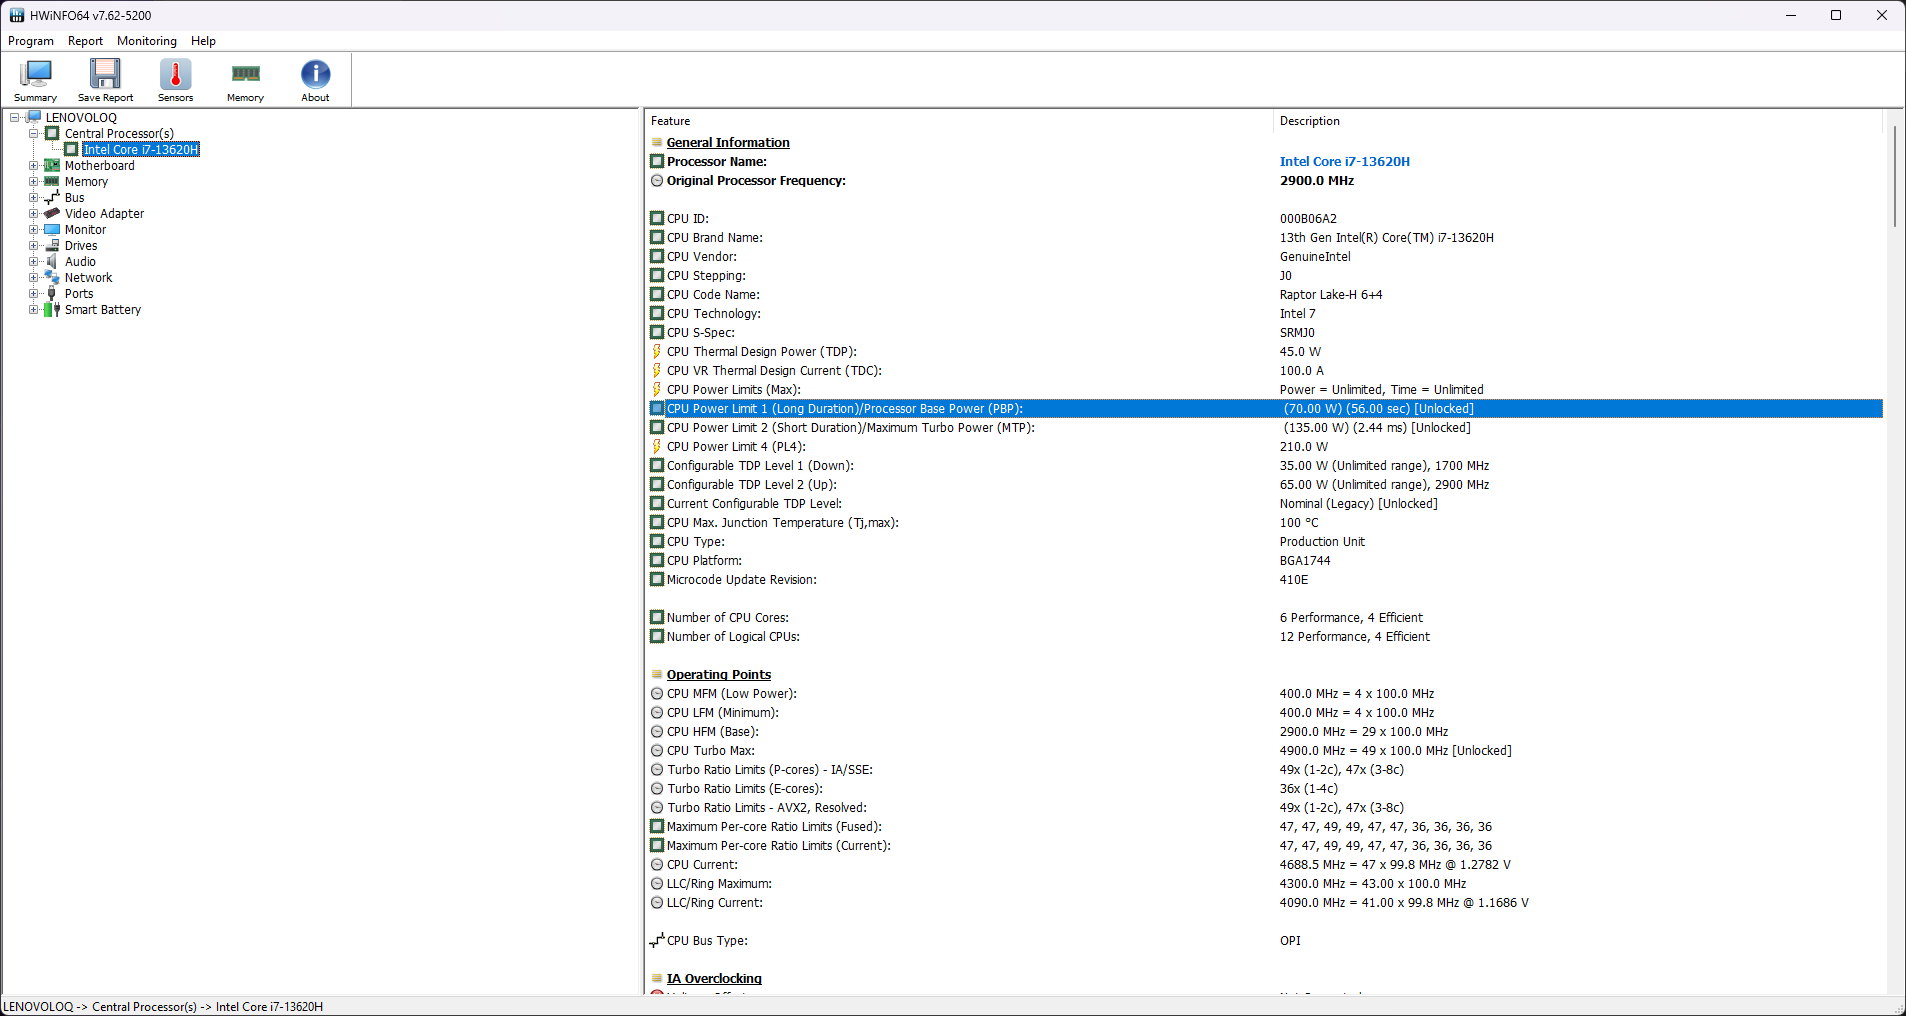
The table below shows how the default power profiles affect the PL1 and PL2 of the processor. For our testing, we used the Performance profile and engaged the dGPU mode to allow the Core i7-13620H and the RTX 4050 to fully flex their muscles. Battery tests were run in the Quiet profile with the GPU set to Hybrid mode.
| Performance mode | PL1 (PBP) / Tau | PL2 (MTP) / Tau | PL4 | Cinebench R15 Multi score | Cinebench R15 Multi score (30 loops) |
|---|---|---|---|---|---|
| Quiet | 45 W / 56 s | 55 W / 2.44 ms | 210 W | 1,879 (-17.98%) | 1,412 (-26.34%) |
| Balance | 60 W / 56 s | 117 W / 2.44 ms | 210 W | 2,178 (-4.93%) | 1,657 (-13.56%) |
| Performance | 70 W / 56 s | 135 W / 2.44 ms | 210 W | 2,291 (100%) | 1,917 (100%) |
Processor

The LOQ 15IRH8's Core i7-13620H trails behind the Ryzen 7 7840HS-powered LOQ 15APH8 by as much as 16% in Cinebench multi-core tests despite sporting the same thread counts, likely due to higher clocks in the latter. However, we see a reversal of roles in Geekbench multi-core. The Intel chip also puts up a good show in most single-core benchmarks.
The LOQ 15IRH8's chassis and cooling seem to be having trouble in properly sustaining a Cinebench R15 multi-core loop test. The Core i7-13620H finds a better home in the LOQ 16IRH8 wherein the processor's performance is very stable.
Cinebench R15 Multi Loop
Cinebench R23: Multi Core | Single Core
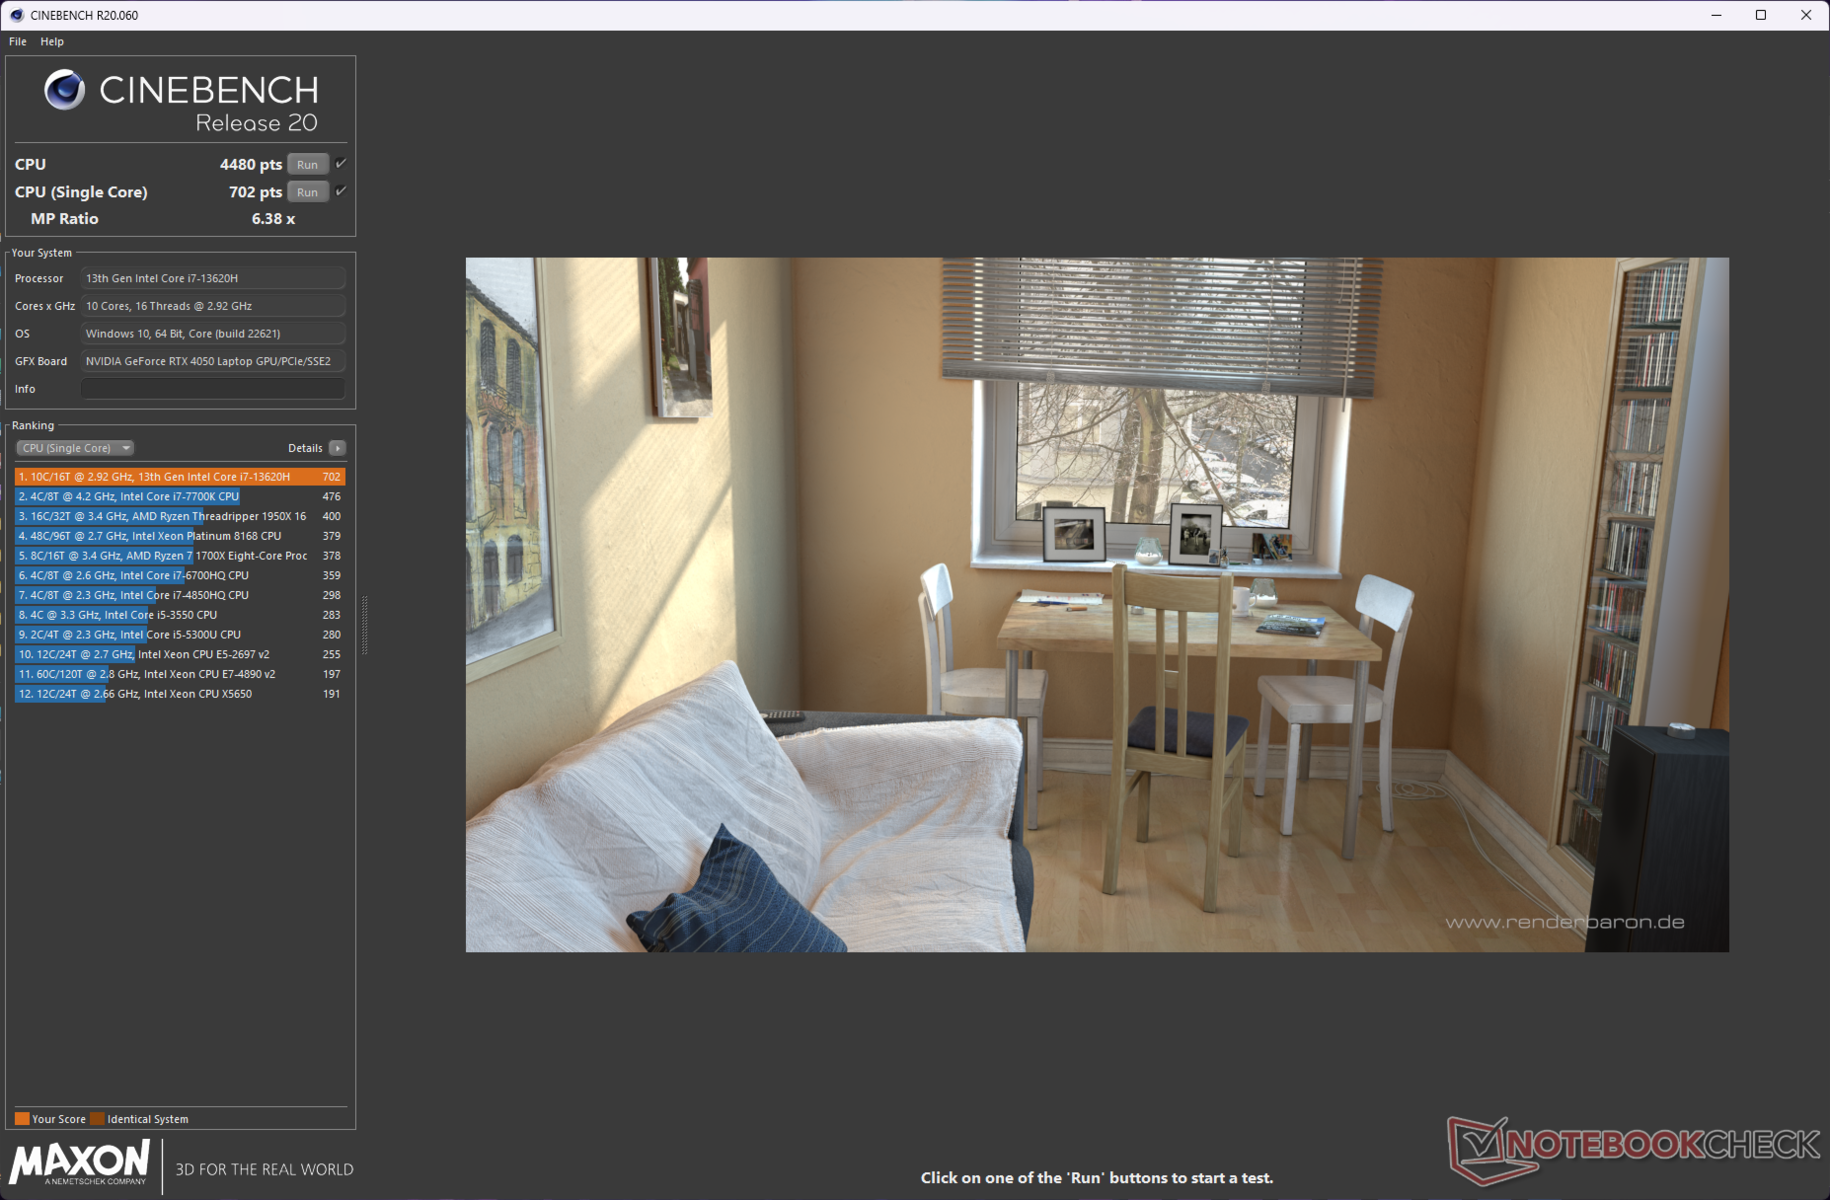
Cinebench R20: CPU (Multi Core) | CPU (Single Core)
Cinebench R15: CPU Multi 64Bit | CPU Single 64Bit
Blender: v2.79 BMW27 CPU
7-Zip 18.03: 7z b 4 | 7z b 4 -mmt1
Geekbench 5.5: Multi-Core | Single-Core
HWBOT x265 Benchmark v2.2: 4k Preset
LibreOffice : 20 Documents To PDF
R Benchmark 2.5: Overall mean
| Cinebench R23 / Multi Core | |
| Dell G15 5530 | |
| Average of class Gaming (2435 - 34521, n=241, last 2 years) | |
| Lenovo LOQ 15APH8 | |
| Asus TUF Gaming A16 FA617XS | |
| MSI Katana 17 B13VFK | |
| HP Victus 16-r0077ng | |
| Lenovo LOQ 16IRH8 | |
| Average Intel Core i7-13620H (15176 - 15496, n=3) | |
| Lenovo LOQ 15IRH8 Core i7 | |
| Lenovo Legion Pro 5 16ARX8 (R5 7645HX, RTX 4050) | |
| Cinebench R23 / Single Core | |
| Lenovo LOQ 16IRH8 | |
| Lenovo LOQ 15IRH8 Core i7 | |
| Average Intel Core i7-13620H (1805 - 1871, n=3) | |
| Dell G15 5530 | |
| Lenovo Legion Pro 5 16ARX8 (R5 7645HX, RTX 4050) | |
| MSI Katana 17 B13VFK | |
| Asus TUF Gaming A16 FA617XS | |
| Lenovo LOQ 15APH8 | |
| Average of class Gaming (527 - 2169, n=239, last 2 years) | |
| HP Victus 16-r0077ng | |
| Cinebench R20 / CPU (Multi Core) | |
| Dell G15 5530 | |
| Average of class Gaming (930 - 13769, n=238, last 2 years) | |
| Lenovo LOQ 15APH8 | |
| Asus TUF Gaming A16 FA617XS | |
| MSI Katana 17 B13VFK | |
| HP Victus 16-r0077ng | |
| Lenovo LOQ 15IRH8 Core i7 | |
| Average Intel Core i7-13620H (5626 - 5905, n=3) | |
| Lenovo LOQ 16IRH8 | |
| Lenovo Legion Pro 5 16ARX8 (R5 7645HX, RTX 4050) | |
| Cinebench R20 / CPU (Single Core) | |
| Lenovo LOQ 15IRH8 Core i7 | |
| Dell G15 5530 | |
| Lenovo LOQ 16IRH8 | |
| Average Intel Core i7-13620H (693 - 719, n=3) | |
| Asus TUF Gaming A16 FA617XS | |
| Lenovo Legion Pro 5 16ARX8 (R5 7645HX, RTX 4050) | |
| Lenovo LOQ 15APH8 | |
| MSI Katana 17 B13VFK | |
| Average of class Gaming (169 - 825, n=238, last 2 years) | |
| HP Victus 16-r0077ng | |
| Cinebench R15 / CPU Multi 64Bit | |
| Dell G15 5530 | |
| Average of class Gaming (400 - 5663, n=244, last 2 years) | |
| Lenovo LOQ 15APH8 | |
| Asus TUF Gaming A16 FA617XS | |
| Lenovo LOQ 16IRH8 | |
| Average Intel Core i7-13620H (2278 - 2492, n=3) | |
| MSI Katana 17 B13VFK | |
| HP Victus 16-r0077ng | |
| Lenovo LOQ 15IRH8 Core i7 | |
| Lenovo Legion Pro 5 16ARX8 (R5 7645HX, RTX 4050) | |
| Cinebench R15 / CPU Single 64Bit | |
| Lenovo Legion Pro 5 16ARX8 (R5 7645HX, RTX 4050) | |
| Asus TUF Gaming A16 FA617XS | |
| Lenovo LOQ 15APH8 | |
| Dell G15 5530 | |
| Lenovo LOQ 16IRH8 | |
| Lenovo LOQ 15IRH8 Core i7 | |
| Average Intel Core i7-13620H (258 - 264, n=3) | |
| Average of class Gaming (79.2 - 312, n=243, last 2 years) | |
| MSI Katana 17 B13VFK | |
| HP Victus 16-r0077ng | |
| Blender / v2.79 BMW27 CPU | |
| Lenovo LOQ 15IRH8 Core i7 | |
| Average Intel Core i7-13620H (215 - 243, n=3) | |
| Lenovo Legion Pro 5 16ARX8 (R5 7645HX, RTX 4050) | |
| Lenovo LOQ 16IRH8 | |
| Average of class Gaming (91 - 1259, n=236, last 2 years) | |
| MSI Katana 17 B13VFK | |
| HP Victus 16-r0077ng | |
| Asus TUF Gaming A16 FA617XS | |
| Lenovo LOQ 15APH8 | |
| Dell G15 5530 | |
| 7-Zip 18.03 / 7z b 4 | |
| Dell G15 5530 | |
| Average of class Gaming (11386 - 140932, n=235, last 2 years) | |
| Asus TUF Gaming A16 FA617XS | |
| HP Victus 16-r0077ng | |
| MSI Katana 17 B13VFK | |
| Lenovo Legion Pro 5 16ARX8 (R5 7645HX, RTX 4050) | |
| Lenovo LOQ 15APH8 | |
| Lenovo LOQ 16IRH8 | |
| Average Intel Core i7-13620H (55381 - 62324, n=3) | |
| Lenovo LOQ 15IRH8 Core i7 | |
| 7-Zip 18.03 / 7z b 4 -mmt1 | |
| Lenovo Legion Pro 5 16ARX8 (R5 7645HX, RTX 4050) | |
| Asus TUF Gaming A16 FA617XS | |
| Lenovo LOQ 15APH8 | |
| Average of class Gaming (2685 - 7581, n=236, last 2 years) | |
| Lenovo LOQ 15IRH8 Core i7 | |
| Lenovo LOQ 16IRH8 | |
| Average Intel Core i7-13620H (5742 - 5915, n=3) | |
| Dell G15 5530 | |
| MSI Katana 17 B13VFK | |
| HP Victus 16-r0077ng | |
| Geekbench 5.5 / Multi-Core | |
| Dell G15 5530 | |
| Average of class Gaming (1946 - 22200, n=242, last 2 years) | |
| Lenovo LOQ 16IRH8 | |
| Asus TUF Gaming A16 FA617XS | |
| Average Intel Core i7-13620H (11289 - 12223, n=3) | |
| HP Victus 16-r0077ng | |
| Lenovo LOQ 15IRH8 Core i7 | |
| MSI Katana 17 B13VFK | |
| Lenovo Legion Pro 5 16ARX8 (R5 7645HX, RTX 4050) | |
| Lenovo LOQ 15APH8 | |
| Geekbench 5.5 / Single-Core | |
| Asus TUF Gaming A16 FA617XS | |
| Lenovo Legion Pro 5 16ARX8 (R5 7645HX, RTX 4050) | |
| Lenovo LOQ 15IRH8 Core i7 | |
| Dell G15 5530 | |
| Lenovo LOQ 15APH8 | |
| Lenovo LOQ 16IRH8 | |
| Average Intel Core i7-13620H (1793 - 1865, n=3) | |
| MSI Katana 17 B13VFK | |
| Average of class Gaming (158 - 2139, n=242, last 2 years) | |
| HP Victus 16-r0077ng | |
| HWBOT x265 Benchmark v2.2 / 4k Preset | |
| Dell G15 5530 | |
| Asus TUF Gaming A16 FA617XS | |
| Average of class Gaming (3 - 37.6, n=239, last 2 years) | |
| Lenovo Legion Pro 5 16ARX8 (R5 7645HX, RTX 4050) | |
| Lenovo LOQ 15APH8 | |
| MSI Katana 17 B13VFK | |
| Average Intel Core i7-13620H (16.6 - 17.1, n=3) | |
| Lenovo LOQ 16IRH8 | |
| Lenovo LOQ 15IRH8 Core i7 | |
| HP Victus 16-r0077ng | |
| LibreOffice / 20 Documents To PDF | |
| HP Victus 16-r0077ng | |
| MSI Katana 17 B13VFK | |
| Lenovo Legion Pro 5 16ARX8 (R5 7645HX, RTX 4050) | |
| Average of class Gaming (32.8 - 332, n=234, last 2 years) | |
| Average Intel Core i7-13620H (43.8 - 56.8, n=3) | |
| Dell G15 5530 | |
| Lenovo LOQ 16IRH8 | |
| Lenovo LOQ 15IRH8 Core i7 | |
| Asus TUF Gaming A16 FA617XS | |
| Lenovo LOQ 15APH8 | |
| R Benchmark 2.5 / Overall mean | |
| HP Victus 16-r0077ng | |
| Average of class Gaming (0.375 - 4.47, n=236, last 2 years) | |
| Lenovo LOQ 15IRH8 Core i7 | |
| Lenovo LOQ 15APH8 | |
| Average Intel Core i7-13620H (0.4438 - 0.4509, n=3) | |
| Lenovo LOQ 16IRH8 | |
| MSI Katana 17 B13VFK | |
| Lenovo Legion Pro 5 16ARX8 (R5 7645HX, RTX 4050) | |
| Dell G15 5530 | |
| Asus TUF Gaming A16 FA617XS | |
* ... smaller is better
An analysis of the Cinebench R15 multi-core loop test shows how the in-built power profiles influence various CPU parameters.
While the Performance mode is supposed to allow the processor to utilize up to 135 W PL2, we see that it only maxes out at 116.5 W. The Balance mode also seems to make do with lesser package power than possible (101 W vs 117 W), but here we see a more stable run compared to Performance.
It is possible that the LOQ 15IRH8's cooling system is struggling whenever the power limit crosses 116 W, which explains the poorly sustained performance in this benchmark.
Cinebench R20 multi-core scores drop by 23% on battery power, though single-core performance takes only a minor hit.

AIDA64: FP32 Ray-Trace | FPU Julia | CPU SHA3 | CPU Queen | FPU SinJulia | FPU Mandel | CPU AES | CPU ZLib | FP64 Ray-Trace | CPU PhotoWorxx
| AIDA64 / FP32 Ray-Trace | |
| Lenovo LOQ 15APH8 | |
| Asus TUF Gaming A16 FA617XS | |
| Lenovo Legion Pro 5 16ARX8 (R5 7645HX, RTX 4050) | |
| Dell G15 5530 | |
| Average of class Gaming (2585 - 55084, n=232, last 2 years) | |
| HP Victus 16-r0077ng | |
| MSI Katana 17 B13VFK | |
| Lenovo LOQ 16IRH8 | |
| Average Intel Core i7-13620H (10779 - 13601, n=3) | |
| Lenovo LOQ 15IRH8 Core i7 | |
| AIDA64 / FPU Julia | |
| Lenovo LOQ 15APH8 | |
| Asus TUF Gaming A16 FA617XS | |
| Lenovo Legion Pro 5 16ARX8 (R5 7645HX, RTX 4050) | |
| Dell G15 5530 | |
| Average of class Gaming (12439 - 234848, n=232, last 2 years) | |
| HP Victus 16-r0077ng | |
| MSI Katana 17 B13VFK | |
| Average Intel Core i7-13620H (63195 - 67187, n=3) | |
| Lenovo LOQ 16IRH8 | |
| Lenovo LOQ 15IRH8 Core i7 | |
| AIDA64 / CPU SHA3 | |
| Lenovo LOQ 15APH8 | |
| Asus TUF Gaming A16 FA617XS | |
| Dell G15 5530 | |
| Average of class Gaming (629 - 9930, n=232, last 2 years) | |
| Lenovo Legion Pro 5 16ARX8 (R5 7645HX, RTX 4050) | |
| HP Victus 16-r0077ng | |
| MSI Katana 17 B13VFK | |
| Average Intel Core i7-13620H (2576 - 2773, n=3) | |
| Lenovo LOQ 16IRH8 | |
| Lenovo LOQ 15IRH8 Core i7 | |
| AIDA64 / CPU Queen | |
| Asus TUF Gaming A16 FA617XS | |
| Lenovo LOQ 15APH8 | |
| Dell G15 5530 | |
| Average of class Gaming (15371 - 186519, n=232, last 2 years) | |
| Lenovo Legion Pro 5 16ARX8 (R5 7645HX, RTX 4050) | |
| HP Victus 16-r0077ng | |
| Lenovo LOQ 15IRH8 Core i7 | |
| Lenovo LOQ 16IRH8 | |
| Average Intel Core i7-13620H (78352 - 78867, n=3) | |
| MSI Katana 17 B13VFK | |
| AIDA64 / FPU SinJulia | |
| Asus TUF Gaming A16 FA617XS | |
| Lenovo LOQ 15APH8 | |
| Lenovo Legion Pro 5 16ARX8 (R5 7645HX, RTX 4050) | |
| Average of class Gaming (2137 - 30810, n=232, last 2 years) | |
| Dell G15 5530 | |
| HP Victus 16-r0077ng | |
| MSI Katana 17 B13VFK | |
| Lenovo LOQ 16IRH8 | |
| Average Intel Core i7-13620H (7192 - 8421, n=3) | |
| Lenovo LOQ 15IRH8 Core i7 | |
| AIDA64 / FPU Mandel | |
| Lenovo LOQ 15APH8 | |
| Asus TUF Gaming A16 FA617XS | |
| Lenovo Legion Pro 5 16ARX8 (R5 7645HX, RTX 4050) | |
| Dell G15 5530 | |
| Average of class Gaming (7135 - 124377, n=232, last 2 years) | |
| HP Victus 16-r0077ng | |
| MSI Katana 17 B13VFK | |
| Average Intel Core i7-13620H (31055 - 32787, n=3) | |
| Lenovo LOQ 16IRH8 | |
| Lenovo LOQ 15IRH8 Core i7 | |
| AIDA64 / CPU AES | |
| Average of class Gaming (18146 - 328679, n=232, last 2 years) | |
| Asus TUF Gaming A16 FA617XS | |
| Dell G15 5530 | |
| Lenovo LOQ 15APH8 | |
| HP Victus 16-r0077ng | |
| MSI Katana 17 B13VFK | |
| Lenovo LOQ 16IRH8 | |
| Average Intel Core i7-13620H (52697 - 58525, n=3) | |
| Lenovo Legion Pro 5 16ARX8 (R5 7645HX, RTX 4050) | |
| Lenovo LOQ 15IRH8 Core i7 | |
| AIDA64 / CPU ZLib | |
| Dell G15 5530 | |
| Lenovo LOQ 15APH8 | |
| Average of class Gaming (150.9 - 2231, n=232, last 2 years) | |
| Asus TUF Gaming A16 FA617XS | |
| HP Victus 16-r0077ng | |
| Lenovo Legion Pro 5 16ARX8 (R5 7645HX, RTX 4050) | |
| Lenovo LOQ 16IRH8 | |
| MSI Katana 17 B13VFK | |
| Average Intel Core i7-13620H (760 - 835, n=3) | |
| Lenovo LOQ 15IRH8 Core i7 | |
| AIDA64 / FP64 Ray-Trace | |
| Lenovo LOQ 15APH8 | |
| Asus TUF Gaming A16 FA617XS | |
| Lenovo Legion Pro 5 16ARX8 (R5 7645HX, RTX 4050) | |
| Dell G15 5530 | |
| Average of class Gaming (1437 - 29473, n=232, last 2 years) | |
| HP Victus 16-r0077ng | |
| MSI Katana 17 B13VFK | |
| Lenovo LOQ 16IRH8 | |
| Average Intel Core i7-13620H (6398 - 7364, n=3) | |
| Lenovo LOQ 15IRH8 Core i7 | |
| AIDA64 / CPU PhotoWorxx | |
| HP Victus 16-r0077ng | |
| Dell G15 5530 | |
| MSI Katana 17 B13VFK | |
| Average of class Gaming (8341 - 60161, n=233, last 2 years) | |
| Average Intel Core i7-13620H (33601 - 34544, n=3) | |
| Lenovo LOQ 15IRH8 Core i7 | |
| Lenovo LOQ 16IRH8 | |
| Asus TUF Gaming A16 FA617XS | |
| Lenovo Legion Pro 5 16ARX8 (R5 7645HX, RTX 4050) | |
| Lenovo LOQ 15APH8 | |
Check out our dedicated Intel Core i7-13620H page for more information and performance comparisons.
System Performance
The LOQ 15IRH8 leads its AMD-based LOQ 15APH8 cousin by 19% in overall CrossMark, but both these devices are virtually tied in PCMark. We observed no hiccups in daily system performance during productivity or gaming tasks.
CrossMark: Overall | Productivity | Creativity | Responsiveness
AIDA64: Memory Copy | Memory Read | Memory Write | Memory Latency
| PCMark 10 / Digital Content Creation | |
| Asus TUF Gaming A16 FA617XS | |
| Lenovo LOQ 15APH8 | |
| Lenovo LOQ 15IRH8 Core i7 | |
| Average Intel Core i7-13620H, NVIDIA GeForce RTX 4050 Laptop GPU | |
| Average of class Gaming (5288 - 16424, n=199, last 2 years) | |
| Lenovo Legion Pro 5 16ARX8 (R5 7645HX, RTX 4050) | |
| HP Victus 16-r0077ng | |
| MSI Katana 17 B13VFK | |
| Lenovo LOQ 16IRH8 | |
| Dell G15 5530 | |
* ... smaller is better
| PCMark 8 Home Score Accelerated v2 | 5795 points | |
| PCMark 8 Work Score Accelerated v2 | 6177 points | |
| PCMark 10 Score | 7656 points | |
Help | ||
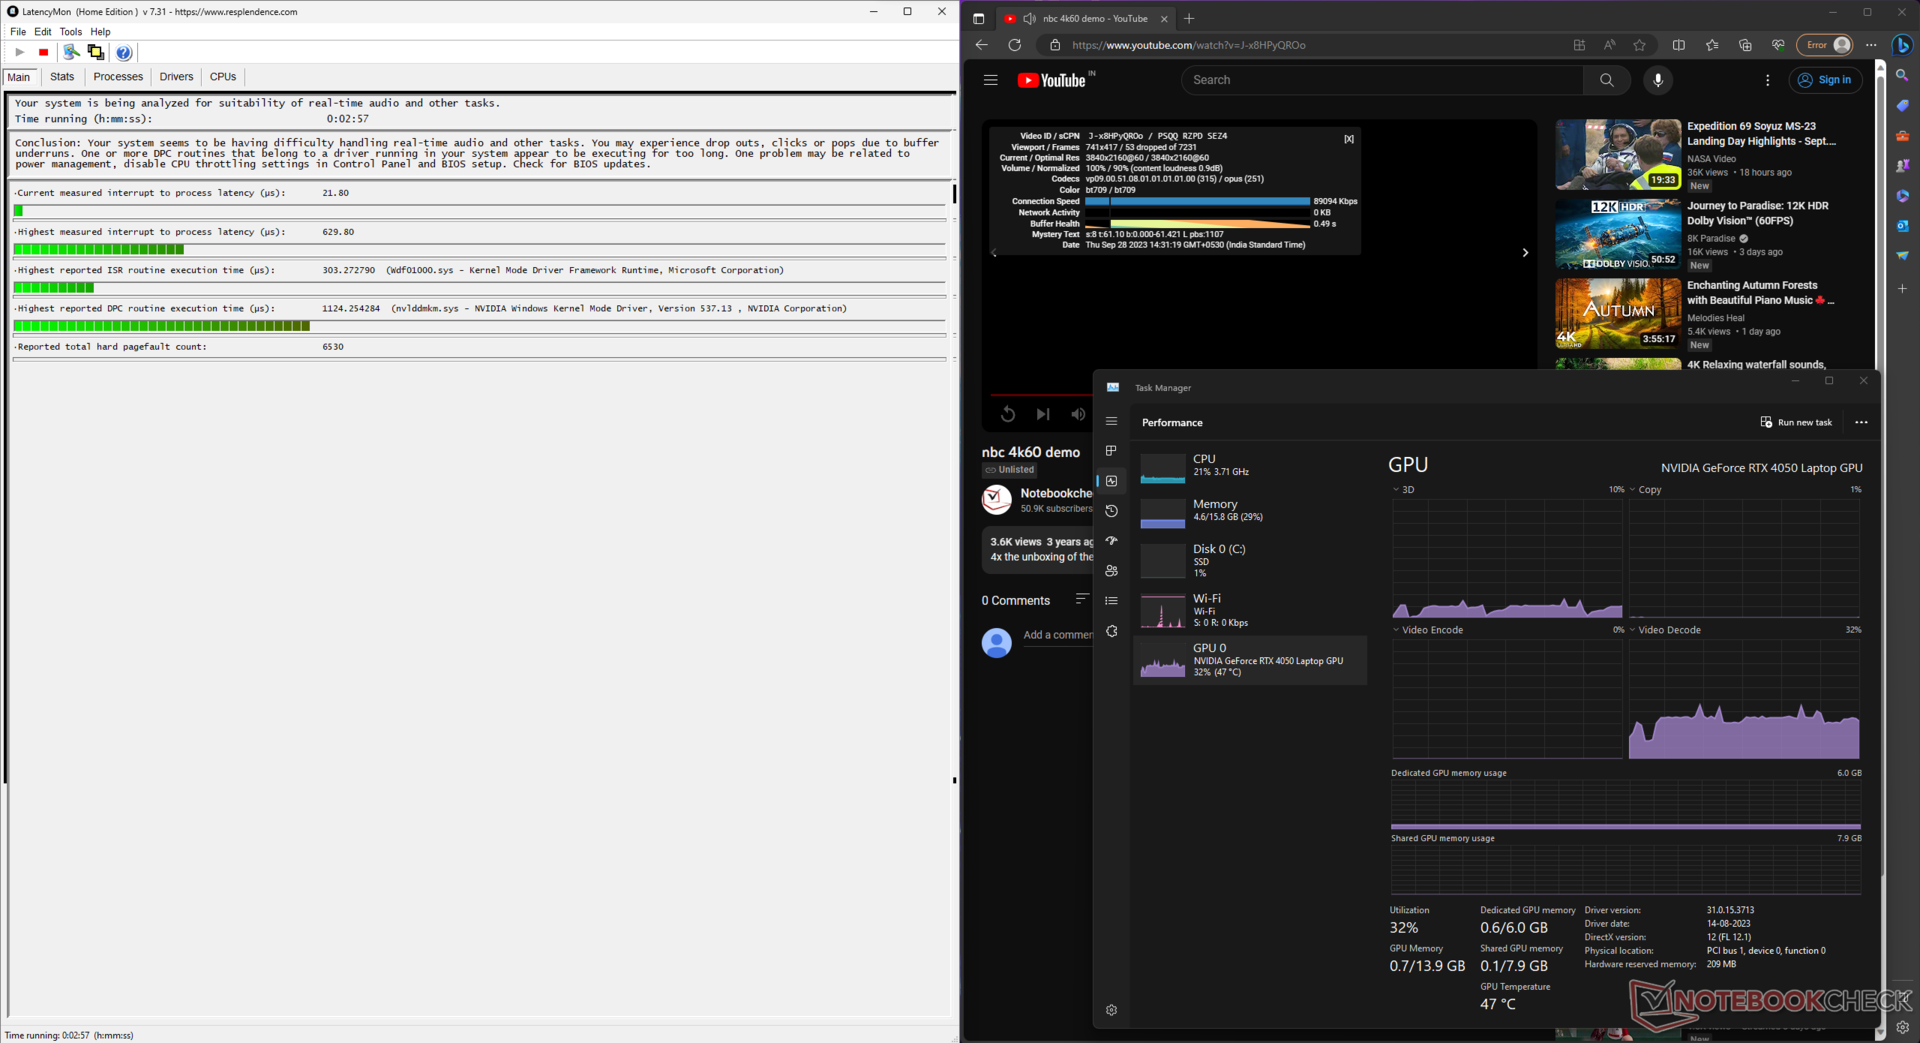
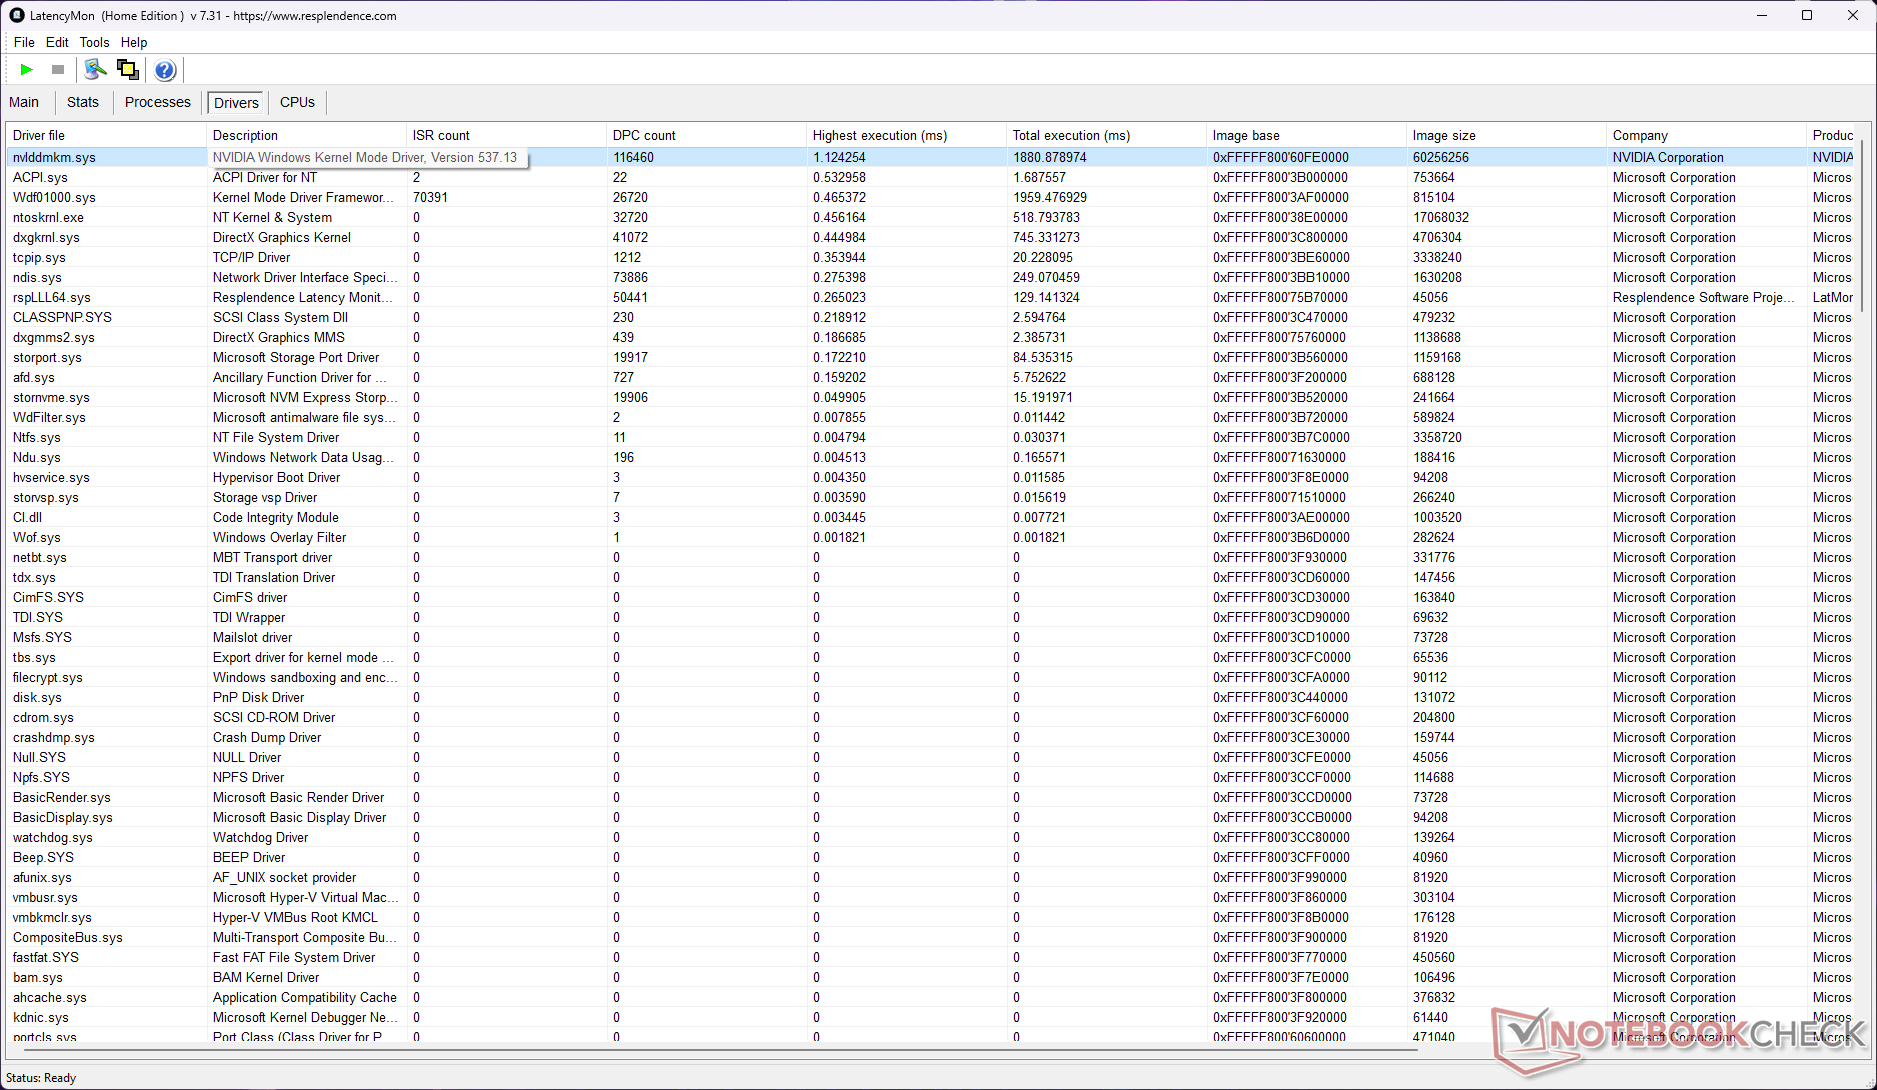
DPC Latency
DPC latency is a bit on the higher side, but the LOQ 15 Core i7 fares a lot better compared to its peers in the test.
| DPC Latencies / LatencyMon - interrupt to process latency (max), Web, Youtube, Prime95 | |
| Dell G15 5530 | |
| MSI Katana 17 B13VFK | |
| HP Victus 16-r0077ng | |
| Lenovo LOQ 15APH8 | |
| Lenovo LOQ 16IRH8 | |
| Asus TUF Gaming A16 FA617XS | |
| Lenovo Legion Pro 5 16ARX8 (R5 7645HX, RTX 4050) | |
| Lenovo LOQ 15IRH8 Core i7 | |
* ... smaller is better
Our DPC Latency Ranking page offers an overview of measured latency across reviewed devices.
Storage Devices
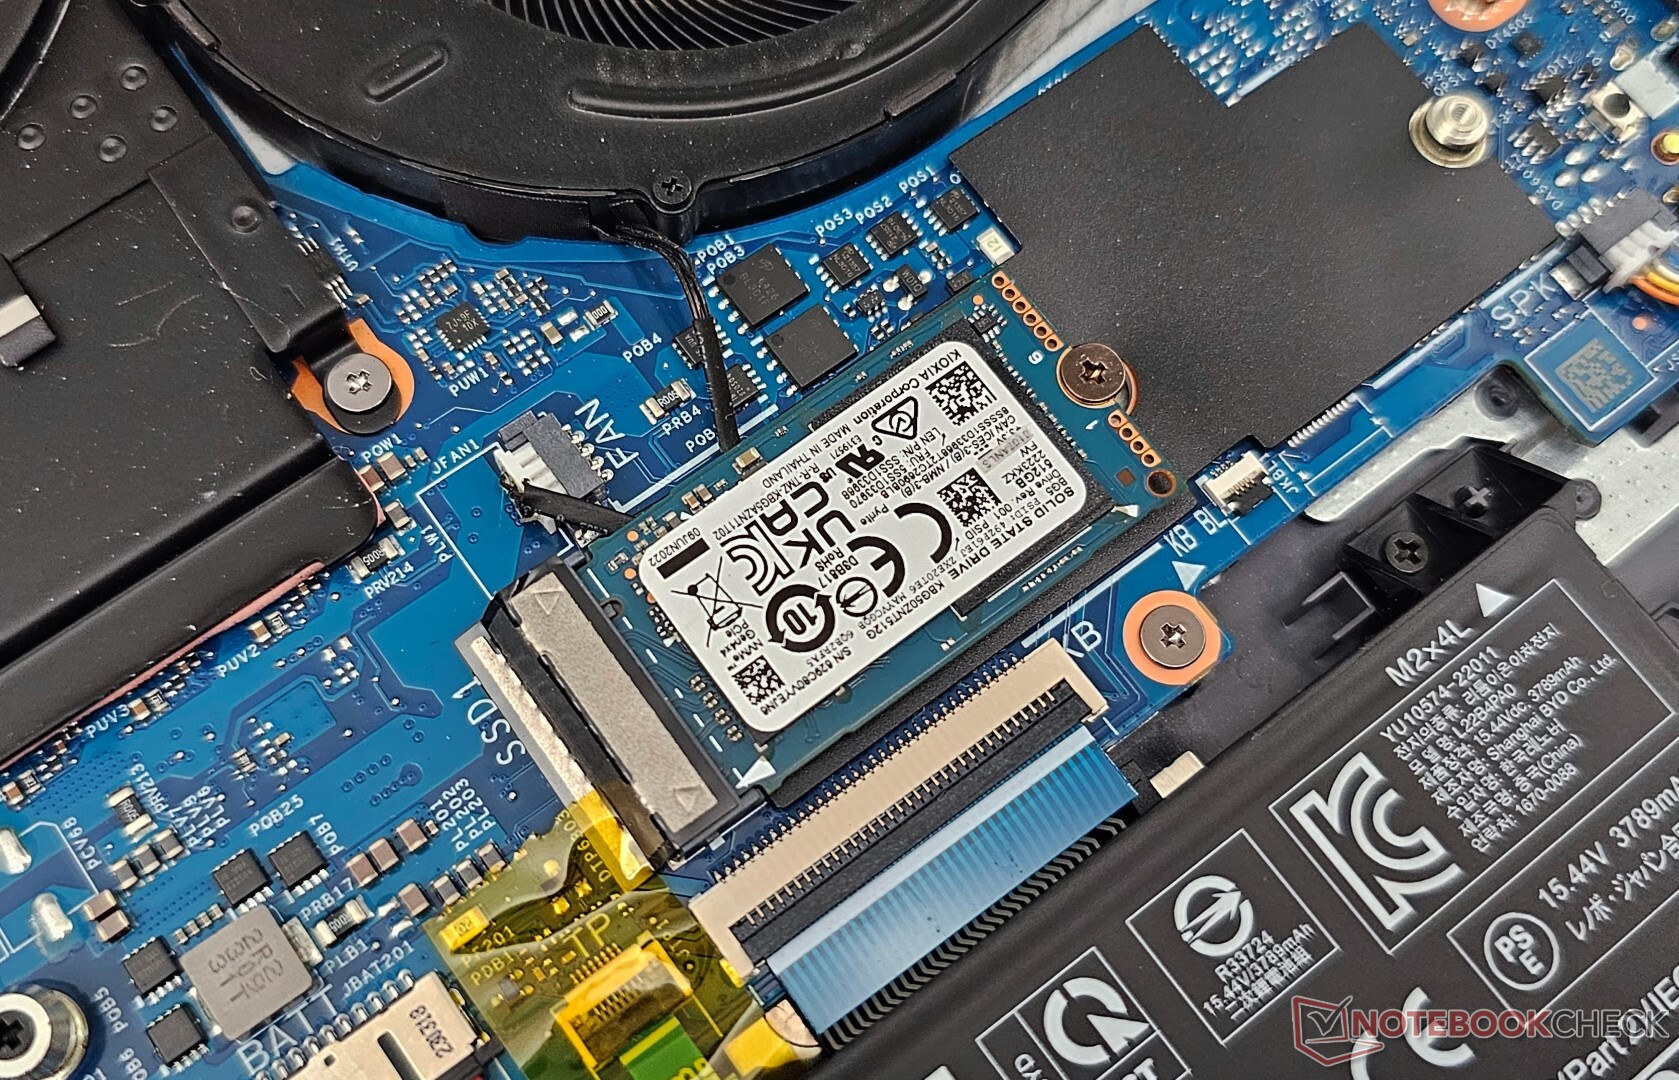
Our LOQ 15IRH8 unit came equipped with a Kioxia 512 GB M.2 2230 PCIe Gen4 NVMe SSD. You can replace it with a larger capacity M.2280 drive if needed. There's also a free M.2 2280 slot available for storage expansion.
Overall drive performance trails behind the Kioxia 1 TB drive found in the HP Victus 16. The SSD also struggles with maintaining a consistent read speed as we see performance dips after the 25th run in our DiskSpd read loop test at a queue depth of 8.

* ... smaller is better
Disk Throttling: DiskSpd Read Loop, Queue Depth 8
More information and performance comparisons can be had from our HDD and SSD benchmarks page.
GPU Performance
The RTX 4050 Laptop GPU in the LOQ 15IRH8 is rated at a 95 W TGP, but it does have the headroom to utilize more power during stress. We see that the same GPU in the LOQ 15APH8 is about 6% faster in cumulative 3DMark tests.
Interestingly, this 95 W RTX 4050 is only a whisker behind the 140 W variant in the Lenovo Legion Pro 5. However, the latter makes up for this deficit in the Blender CUDA benchmark.
| 3DMark 11 - 1280x720 Performance GPU | |
| HP Victus 16-r0077ng | |
| Average of class Gaming (1029 - 72070, n=235, last 2 years) | |
| Dell G15 5530 | |
| MSI Katana 17 B13VFK | |
| Lenovo LOQ 16IRH8 | |
| Asus TUF Gaming A16 FA617XS | |
| Lenovo LOQ 15APH8 | |
| Lenovo Legion Pro 5 16ARX8 (R5 7645HX, RTX 4050) | |
| Lenovo LOQ 15IRH8 Core i7 | |
| Average NVIDIA GeForce RTX 4050 Laptop GPU (19643 - 32642, n=28) | |
| 3DMark | |
| 1920x1080 Fire Strike Graphics | |
| HP Victus 16-r0077ng | |
| Average of class Gaming (781 - 53059, n=241, last 2 years) | |
| MSI Katana 17 B13VFK | |
| Dell G15 5530 | |
| Asus TUF Gaming A16 FA617XS | |
| Lenovo LOQ 16IRH8 | |
| Lenovo Legion Pro 5 16ARX8 (R5 7645HX, RTX 4050) | |
| Lenovo LOQ 15APH8 | |
| Lenovo LOQ 15IRH8 Core i7 | |
| Average NVIDIA GeForce RTX 4050 Laptop GPU (14121 - 24007, n=27) | |
| 2560x1440 Time Spy Graphics | |
| Average of class Gaming (224 - 22547, n=241, last 2 years) | |
| HP Victus 16-r0077ng | |
| Dell G15 5530 | |
| Lenovo LOQ 16IRH8 | |
| MSI Katana 17 B13VFK | |
| Asus TUF Gaming A16 FA617XS | |
| Lenovo LOQ 15APH8 | |
| Lenovo Legion Pro 5 16ARX8 (R5 7645HX, RTX 4050) | |
| Lenovo LOQ 15IRH8 Core i7 | |
| Average NVIDIA GeForce RTX 4050 Laptop GPU (5123 - 9040, n=27) | |
| 3DMark 11 Performance | 27474 points | |
| 3DMark Ice Storm Standard Score | 229274 points | |
| 3DMark Cloud Gate Standard Score | 49040 points | |
| 3DMark Fire Strike Score | 19230 points | |
| 3DMark Fire Strike Extreme Score | 9873 points | |
| 3DMark Time Spy Score | 8701 points | |
Help | ||
| Blender / v3.3 Classroom OPTIX/RTX | |
| Average NVIDIA GeForce RTX 4050 Laptop GPU (25 - 36, n=28) | |
| Lenovo Legion Pro 5 16ARX8 (R5 7645HX, RTX 4050) | |
| Lenovo LOQ 15IRH8 Core i7 | |
| MSI Katana 17 B13VFK | |
| Lenovo LOQ 15APH8 | |
| Average of class Gaming (9 - 142, n=139, last 2 years) | |
| HP Victus 16-r0077ng | |
| Lenovo LOQ 16IRH8 | |
| Dell G15 5530 | |
| Blender / v3.3 Classroom CUDA | |
| Average NVIDIA GeForce RTX 4050 Laptop GPU (47 - 175, n=29) | |
| Lenovo LOQ 15IRH8 Core i7 | |
| Lenovo LOQ 15APH8 | |
| Lenovo Legion Pro 5 16ARX8 (R5 7645HX, RTX 4050) | |
| MSI Katana 17 B13VFK | |
| Lenovo LOQ 16IRH8 | |
| Average of class Gaming (16 - 175, n=144, last 2 years) | |
| Dell G15 5530 | |
| HP Victus 16-r0077ng | |
| Blender / v3.3 Classroom CPU | |
| Lenovo LOQ 15IRH8 Core i7 | |
| Average NVIDIA GeForce RTX 4050 Laptop GPU (243 - 907, n=28) | |
| Lenovo LOQ 16IRH8 | |
| HP Victus 16-r0077ng | |
| Lenovo Legion Pro 5 16ARX8 (R5 7645HX, RTX 4050) | |
| MSI Katana 17 B13VFK | |
| Average of class Gaming (144 - 907, n=155, last 2 years) | |
| Asus TUF Gaming A16 FA617XS | |
| Lenovo LOQ 15APH8 | |
| Dell G15 5530 | |
* ... smaller is better
Gaming Performance
Similar trends are seen in gaming benchmarks as well. The LOQ 15's 95 W RTX 4050 and the 140 W RTX 4050 in the Legion Pro 5 put up a near-identical show in cumulative 1080p Ultra gaming tests, but latter's higher wattage allows perceivable leads in QHD Ultra.
The LOQ 15IRH8 is essentially a 1080p Ultra gaming machine. Playable framerates can be achieved in QHD Ultra in somewhat older titles. Gamers who wish to push more frames at QHD or 4K will have to inevitably make use of upscaling technologies like AMD FSR, Nvidia DLSS, or Intel XeSS depending on the title.
| The Witcher 3 - 1920x1080 Ultra Graphics & Postprocessing (HBAO+) | |
| HP Victus 16-r0077ng | |
| Average of class Gaming (8.61 - 216, n=235, last 2 years) | |
| MSI Katana 17 B13VFK | |
| Dell G15 5530 | |
| Lenovo LOQ 16IRH8 | |
| Asus TUF Gaming A16 FA617XS | |
| Lenovo Legion Pro 5 16ARX8 (R5 7645HX, RTX 4050) | |
| Lenovo LOQ 15IRH8 Core i7 | |
| Lenovo LOQ 15APH8 | |
| GTA V - 1920x1080 Highest Settings possible AA:4xMSAA + FX AF:16x | |
| Lenovo LOQ 16IRH8 | |
| HP Victus 16-r0077ng | |
| MSI Katana 17 B13VFK | |
| Dell G15 5530 | |
| Average of class Gaming (6.38 - 167.7, n=224, last 2 years) | |
| Lenovo Legion Pro 5 16ARX8 (R5 7645HX, RTX 4050) | |
| Lenovo LOQ 15IRH8 Core i7 | |
| Asus TUF Gaming A16 FA617XS | |
| Lenovo LOQ 15APH8 | |
| Final Fantasy XV Benchmark - 1920x1080 High Quality | |
| HP Victus 16-r0077ng | |
| Average of class Gaming (9.13 - 194.9, n=234, last 2 years) | |
| Lenovo LOQ 16IRH8 | |
| Dell G15 5530 | |
| MSI Katana 17 B13VFK | |
| Lenovo Legion Pro 5 16ARX8 (R5 7645HX, RTX 4050) | |
| Lenovo LOQ 15APH8 | |
| Asus TUF Gaming A16 FA617XS | |
| Lenovo LOQ 15IRH8 Core i7 | |
| Strange Brigade - 1920x1080 ultra AA:ultra AF:16 | |
| Average of class Gaming (14.6 - 421, n=232, last 2 years) | |
| HP Victus 16-r0077ng | |
| Dell G15 5530 | |
| Lenovo LOQ 16IRH8 | |
| MSI Katana 17 B13VFK | |
| Asus TUF Gaming A16 FA617XS | |
| Lenovo LOQ 15APH8 | |
| Lenovo Legion Pro 5 16ARX8 (R5 7645HX, RTX 4050) | |
| Lenovo LOQ 15IRH8 Core i7 | |
| Dota 2 Reborn - 1920x1080 ultra (3/3) best looking | |
| Lenovo Legion Pro 5 16ARX8 (R5 7645HX, RTX 4050) | |
| Lenovo LOQ 15IRH8 Core i7 | |
| MSI Katana 17 B13VFK | |
| Lenovo LOQ 16IRH8 | |
| Dell G15 5530 | |
| Average of class Gaming (26.9 - 220, n=247, last 2 years) | |
| HP Victus 16-r0077ng | |
| Lenovo LOQ 15APH8 | |
| Asus TUF Gaming A16 FA617XS | |
| X-Plane 11.11 - 1920x1080 high (fps_test=3) | |
| MSI Katana 17 B13VFK | |
| Dell G15 5530 | |
| Lenovo LOQ 15IRH8 Core i7 | |
| Lenovo Legion Pro 5 16ARX8 (R5 7645HX, RTX 4050) | |
| Lenovo LOQ 16IRH8 | |
| Average of class Gaming (12.4 - 166.2, n=251, last 2 years) | |
| HP Victus 16-r0077ng | |
| Lenovo LOQ 15APH8 | |
| Asus TUF Gaming A16 FA617XS | |
| The Witcher 3 - 2560x1440 Ultra Graphics & Postprocessing (HBAO+) | |
| Average of class Gaming (60.3 - 168.3, n=12, last 2 years) | |
| Lenovo LOQ 16IRH8 | |
| Lenovo LOQ 15IRH8 Core i7 | |
| Average NVIDIA GeForce RTX 4050 Laptop GPU (56.1 - 61.3, n=4) | |
| Far Cry 5 | |
| 1920x1080 Ultra Preset AA:T | |
| Dell G15 5530 | |
| MSI Katana 17 B13VFK | |
| Lenovo LOQ 16IRH8 | |
| Average of class Gaming (14 - 218, n=134, last 2 years) | |
| Lenovo LOQ 15IRH8 Core i7 | |
| Lenovo Legion Pro 5 16ARX8 (R5 7645HX, RTX 4050) | |
| Asus TUF Gaming A16 FA617XS | |
| Average NVIDIA GeForce RTX 4050 Laptop GPU (50 - 127, n=16) | |
| 2560x1440 Ultra Preset AA:T | |
| Average of class Gaming (14 - 194, n=82, last 2 years) | |
| Lenovo LOQ 16IRH8 | |
| MSI Katana 17 B13VFK | |
| Lenovo Legion Pro 5 16ARX8 (R5 7645HX, RTX 4050) | |
| Lenovo LOQ 15IRH8 Core i7 | |
| Average NVIDIA GeForce RTX 4050 Laptop GPU (47 - 88, n=10) | |
| Cyberpunk 2077 1.6 | |
| 1920x1080 Ultra Preset | |
| Average of class Gaming (16.7 - 159.7, n=115, last 2 years) | |
| Dell G15 5530 | |
| MSI Katana 17 B13VFK | |
| Lenovo LOQ 15APH8 | |
| Lenovo LOQ 15IRH8 Core i7 | |
| Average NVIDIA GeForce RTX 4050 Laptop GPU (44.4 - 79.4, n=14) | |
| 2560x1440 Ultra Preset | |
| Average of class Gaming (10.7 - 116, n=85, last 2 years) | |
| MSI Katana 17 B13VFK | |
| Lenovo LOQ 15IRH8 Core i7 | |
| Average NVIDIA GeForce RTX 4050 Laptop GPU (27.2 - 43.1, n=10) | |
| 1920x1080 Ray Tracing Ultra Preset (DLSS off) | |
| Average of class Gaming (12.6 - 74, n=45, last 2 years) | |
| Dell G15 5530 | |
| Average NVIDIA GeForce RTX 4050 Laptop GPU (15.8 - 65.6, n=5) | |
| MSI Katana 17 B13VFK | |
| Lenovo LOQ 15IRH8 Core i7 | |
| F1 22 | |
| 1920x1080 Ultra High Preset AA:T AF:16x | |
| Average of class Gaming (13 - 144.7, n=93, last 2 years) | |
| Dell G15 5530 | |
| MSI Katana 17 B13VFK | |
| Lenovo LOQ 15IRH8 Core i7 | |
| Asus TUF Gaming A16 FA617XS | |
| Average NVIDIA GeForce RTX 4050 Laptop GPU (10.9 - 56.4, n=20) | |
| 2560x1440 Ultra High Preset AA:T AF:16x | |
| Average of class Gaming (21 - 92.2, n=67, last 2 years) | |
| MSI Katana 17 B13VFK | |
| Lenovo LOQ 15IRH8 Core i7 | |
| Average NVIDIA GeForce RTX 4050 Laptop GPU (6.58 - 33.9, n=12) | |
| F1 23 | |
| 1920x1080 Ultra High Preset AA:T AF:16x | |
| Average of class Gaming (39.5 - 132, n=22, last 2 years) | |
| Lenovo Legion Pro 5 16ARX8 (R5 7645HX, RTX 4050) | |
| Average NVIDIA GeForce RTX 4050 Laptop GPU (39.5 - 60.8, n=12) | |
| Lenovo LOQ 15IRH8 Core i7 | |
| 2560x1440 Ultra High Preset AA:T AF:16x | |
| Average of class Gaming (31 - 85.1, n=15, last 2 years) | |
| Lenovo Legion Pro 5 16ARX8 (R5 7645HX, RTX 4050) | |
| Average NVIDIA GeForce RTX 4050 Laptop GPU (25.6 - 40.8, n=9) | |
| Lenovo LOQ 15IRH8 Core i7 | |
The Witcher 3 FPS Chart
While the LOQ 15's CPU sustained performance (or lack thereof) raises eyebrows, the laptop's cooling seems adequate for the RTX 4050 Laptop GPU as evidenced by relatively steady framerates in The Witcher 3 at 1080p Ultra.
| low | med. | high | ultra | QHD | |
| GTA V (2015) | 185.9 | 179.7 | 168.9 | 93.2 | 66 |
| The Witcher 3 (2015) | 390 | 286 | 167.6 | 85.6 | 61.3 |
| Dota 2 Reborn (2015) | 196.3 | 178.3 | 171.1 | 162.2 | |
| Final Fantasy XV Benchmark (2018) | 192.9 | 121.2 | 84 | 60.9 | |
| X-Plane 11.11 (2018) | 159.9 | 139.8 | 110.2 | ||
| Far Cry 5 (2018) | 156 | 135 | 128 | 121 | 83 |
| Strange Brigade (2018) | 475 | 211 | 171.8 | 149.2 | 95.5 |
| Cyberpunk 2077 1.6 (2022) | 103.3 | 85.5 | 72.9 | 67.8 | 41 |
| F1 22 (2022) | 233 | 224 | 172.3 | 55 | 33.9 |
| F1 23 (2023) | 228 | 222 | 158.4 | 44.1 | 34.1 |
Emissions: High surface temperatures under load
System Noise
The LOQ 15IRH8's fan noise during idle is largely similar to what we've seen with the LOQ 15 AMD variant, but the latter's fans are about 7% louder under full load. Lenovo has capped the fan noise levels under certain thresholds depending on the selected power profile as can be seen from the table below.
The Performance mode falls just short of the 50 dB(A) mark under load. While Quiet mode results in a significant hit to CPU performance, gaming should still be comparatively amenable vis-à-vis the Performance profile.
Noise Level
| Idle |
| 29.03 / 29.03 / 29.03 dB(A) |
| Load |
| 48.7 / 48.7 dB(A) |
 | ||
30 dB silent 40 dB(A) audible 50 dB(A) loud |
||
min: | ||
| Performance mode | Idle dB(A) | Load average dB(A) | Load maximum dB(A) | The Witcher 3 1080p Ultra dB(A) |
|---|---|---|---|---|
| Quiet | 25.28 | 33.09 | 36.07 | 36.69 / 78 fps |
| Balance | 25.28 | 40.40 | 45.15 | 45.42 / 83 fps |
| Performance | 29.03 | 48.72 | 48.71 | 48.52 / 85 fps |
| Lenovo LOQ 15IRH8 Core i7 i7-13620H, NVIDIA GeForce RTX 4050 Laptop GPU | Lenovo LOQ 16IRH8 i7-13620H, NVIDIA GeForce RTX 4060 Laptop GPU | Lenovo LOQ 15APH8 R7 7840HS, NVIDIA GeForce RTX 4050 Laptop GPU | MSI Katana 17 B13VFK i7-13620H, NVIDIA GeForce RTX 4060 Laptop GPU | Lenovo Legion Pro 5 16ARX8 (R5 7645HX, RTX 4050) R5 7645HX, NVIDIA GeForce RTX 4050 Laptop GPU | HP Victus 16-r0077ng i7-13700H, NVIDIA GeForce RTX 4070 Laptop GPU | Dell G15 5530 i7-13650HX, NVIDIA GeForce RTX 4060 Laptop GPU | Asus TUF Gaming A16 FA617XS R9 7940HS, Radeon RX 7600S | |
|---|---|---|---|---|---|---|---|---|
| Noise | 3% | 9% | -6% | 14% | 2% | 12% | 3% | |
| off / environment * | 23.69 | 23 3% | 23.1 2% | 24.5 -3% | 23 3% | 25 -6% | 20.41 14% | 25 -6% |
| Idle Minimum * | 29.03 | 23 21% | 23.1 20% | 24.5 16% | 23 21% | 28 4% | 26.85 8% | 25 14% |
| Idle Average * | 29.03 | 23 21% | 23.1 20% | 24.5 16% | 23 21% | 29 -0% | 26.85 8% | 26 10% |
| Idle Maximum * | 29.03 | 27.66 5% | 25.2 13% | 40 -38% | 24.42 16% | 30 -3% | 26.85 8% | 28 4% |
| Load Average * | 48.7 | 53.62 -10% | 44.3 9% | 48.3 1% | 34.94 28% | 43 12% | 27.65 43% | 43 12% |
| Witcher 3 ultra * | 48.5 | 53.5 -10% | 45.8 6% | 56 -15% | 43.79 10% | 46 5% | 47.9 1% | 51 -5% |
| Load Maximum * | 48.7 | 53.5 -10% | 52 -7% | 59.1 -21% | 50 -3% | 48 1% | 47.86 2% | 53 -9% |
* ... smaller is better
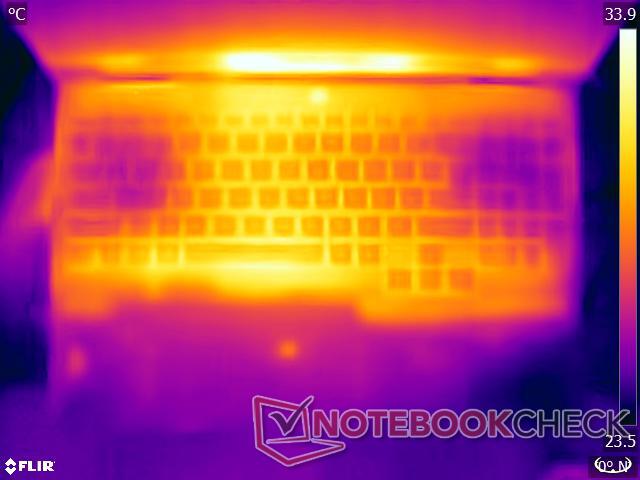
Temperature
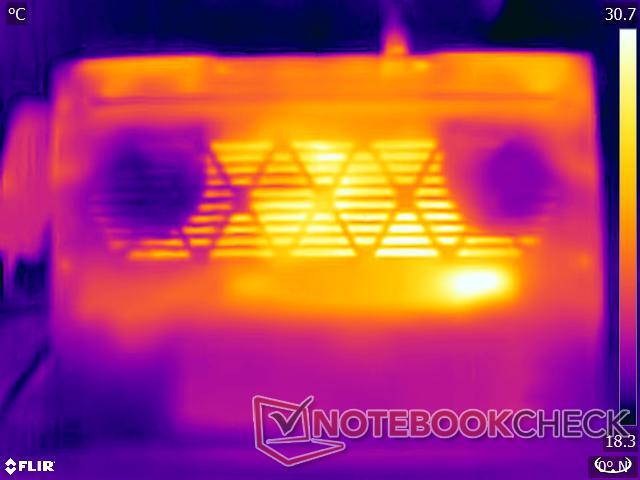
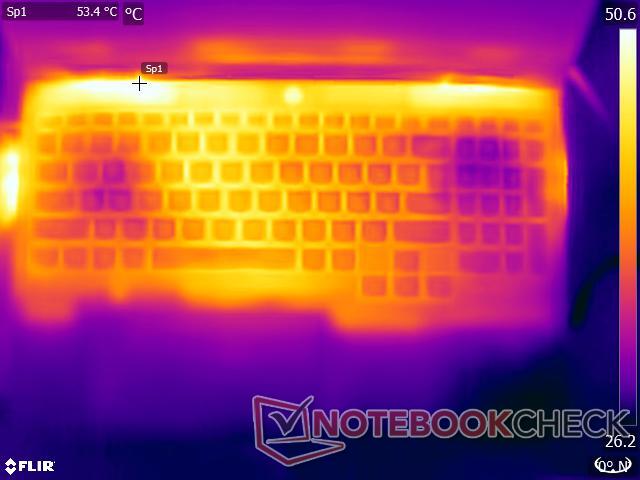
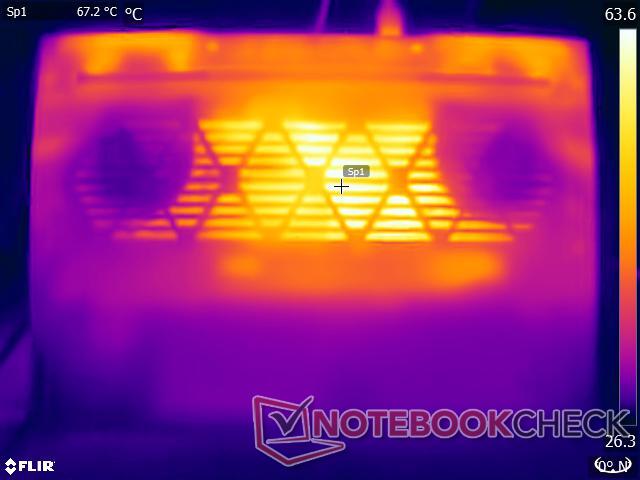
Surface temperatures while stressing in the Performance profile can get quite hot, especially on the bottom side of the chassis. Although our stress tests represent extreme scenarios, we do not recommend using this device on your lap for anything other than light usage.
(-) The maximum temperature on the upper side is 46.4 °C / 116 F, compared to the average of 40.4 °C / 105 F, ranging from 21.2 to 68.8 °C for the class Gaming.
(-) The bottom heats up to a maximum of 59.2 °C / 139 F, compared to the average of 43.3 °C / 110 F
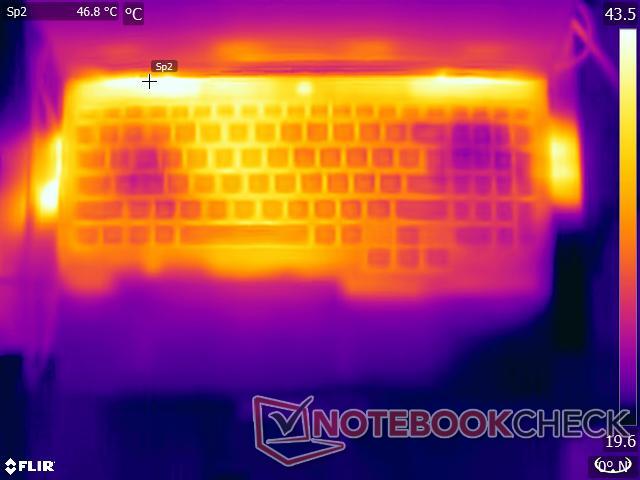
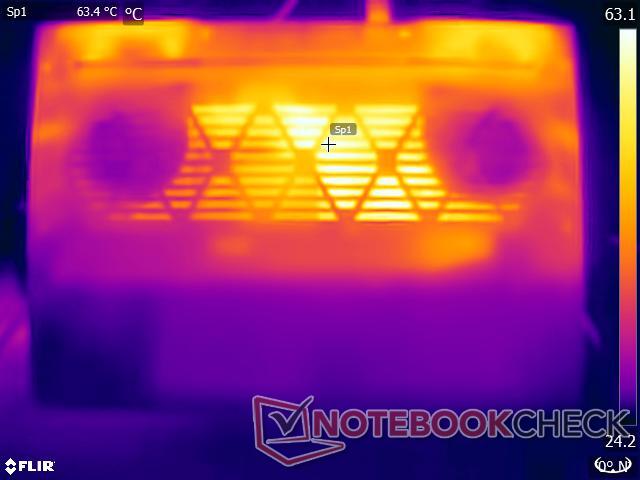
(±) In idle usage, the average temperature for the upper side is 32.7 °C / 91 F, compared to the device average of 33.9 °C / 93 F.
(-) Playing The Witcher 3, the average temperature for the upper side is 39.4 °C / 103 F, compared to the device average of 33.9 °C / 93 F.
(+) The palmrests and touchpad are reaching skin temperature as a maximum (34 °C / 93.2 F) and are therefore not hot.
(-) The average temperature of the palmrest area of similar devices was 29 °C / 84.2 F (-5 °C / -9 F).
| Lenovo LOQ 15IRH8 Core i7 Intel Core i7-13620H, NVIDIA GeForce RTX 4050 Laptop GPU | Lenovo LOQ 16IRH8 Intel Core i7-13620H, NVIDIA GeForce RTX 4060 Laptop GPU | Lenovo LOQ 15APH8 AMD Ryzen 7 7840HS, NVIDIA GeForce RTX 4050 Laptop GPU | MSI Katana 17 B13VFK Intel Core i7-13620H, NVIDIA GeForce RTX 4060 Laptop GPU | Lenovo Legion Pro 5 16ARX8 (R5 7645HX, RTX 4050) AMD Ryzen 5 7645HX, NVIDIA GeForce RTX 4050 Laptop GPU | HP Victus 16-r0077ng Intel Core i7-13700H, NVIDIA GeForce RTX 4070 Laptop GPU | Dell G15 5530 Intel Core i7-13650HX, NVIDIA GeForce RTX 4060 Laptop GPU | Asus TUF Gaming A16 FA617XS AMD Ryzen 9 7940HS, AMD Radeon RX 7600S | |
|---|---|---|---|---|---|---|---|---|
| Heat | 10% | 13% | 11% | 1% | 3% | -3% | 9% | |
| Maximum Upper Side * | 46.4 | 48 -3% | 44.4 4% | 41.6 10% | 45 3% | 51 -10% | 54 -16% | 53 -14% |
| Maximum Bottom * | 59.2 | 59 -0% | 52 12% | 43.1 27% | 54 9% | 54 9% | 62.2 -5% | 48 19% |
| Idle Upper Side * | 34.4 | 28 19% | 28 19% | 32 7% | 36 -5% | 37 -8% | 33.4 3% | 30 13% |
| Idle Bottom * | 36.2 | 28 23% | 29.6 18% | 35.8 1% | 38 -5% | 29 20% | 33.4 8% | 30 17% |
* ... smaller is better
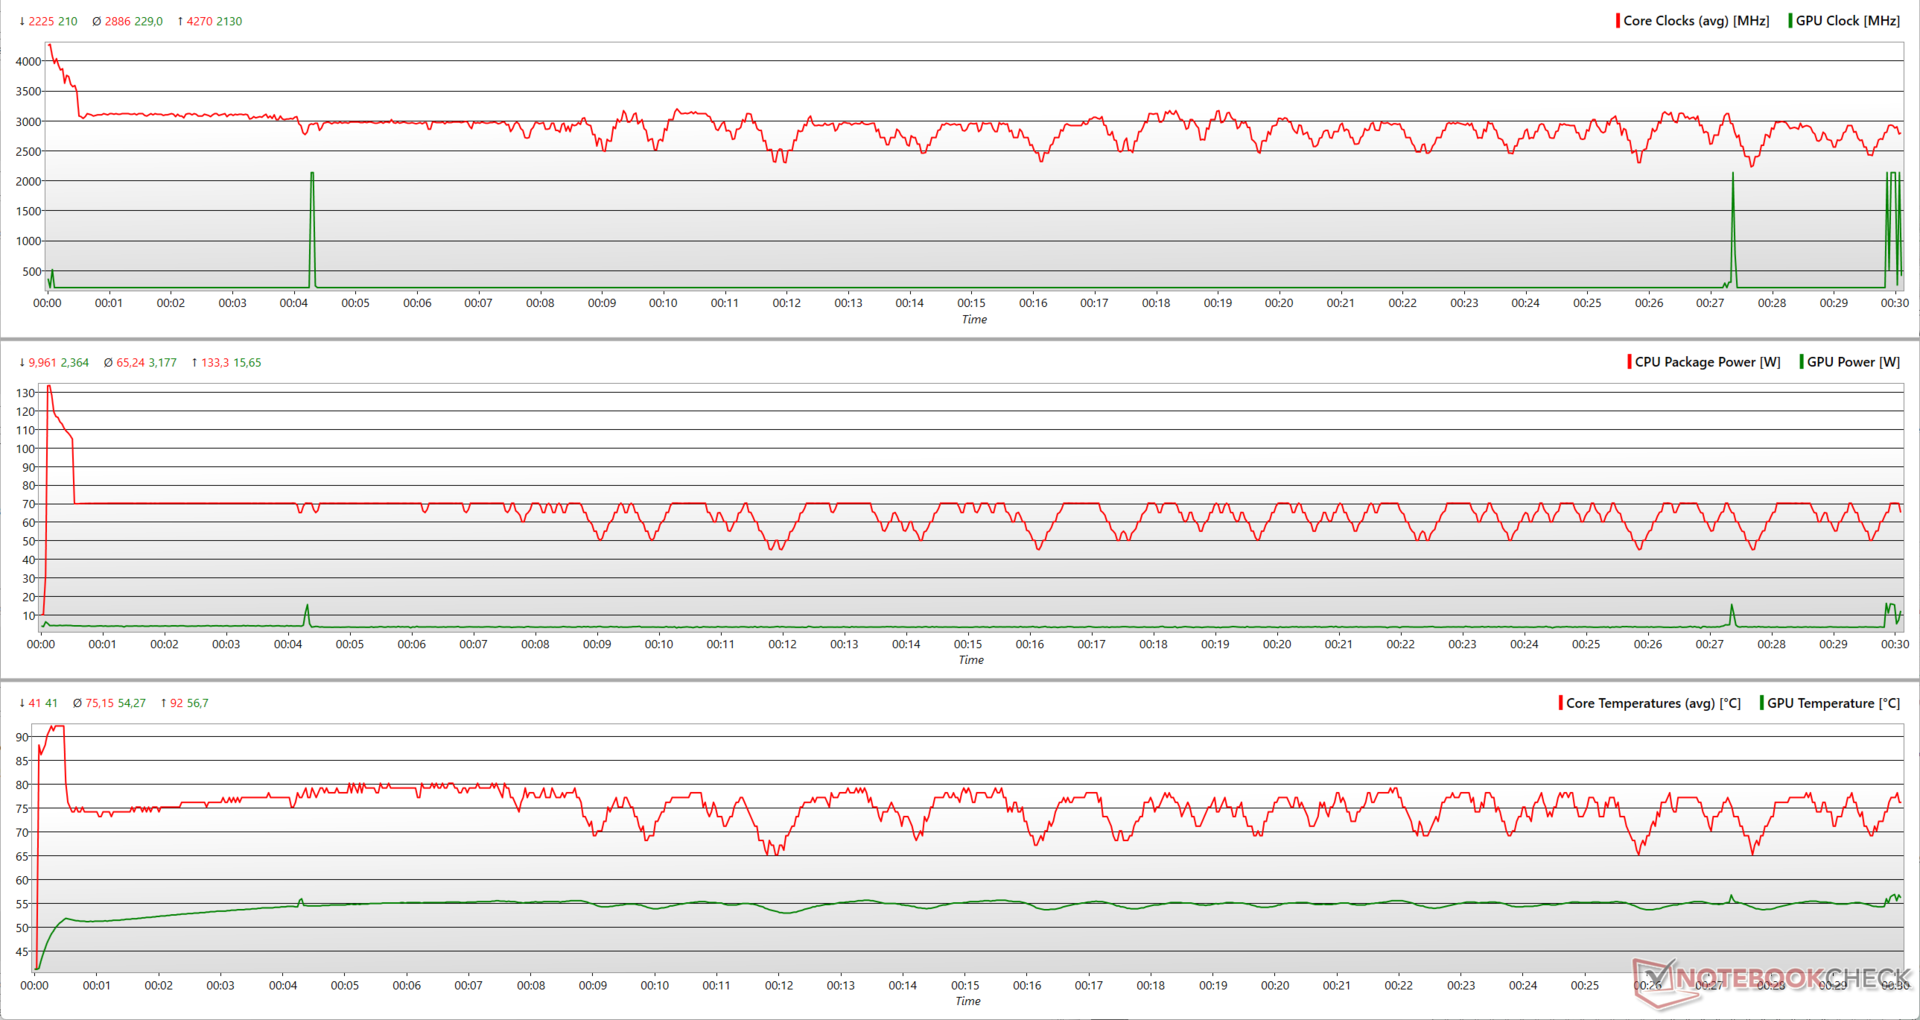
Stress Test
Unlike what we've seen with the Cinebench R15 multi-core loop test earlier, stressing the LOQ 15 with Prime95 in-place large FFTs sees the Core i7-13620H finally being able to hit 133 W with a max clock of 4.27 GHz. However, this is short-lived as the processor eventually settles at an average package power of 65 W.
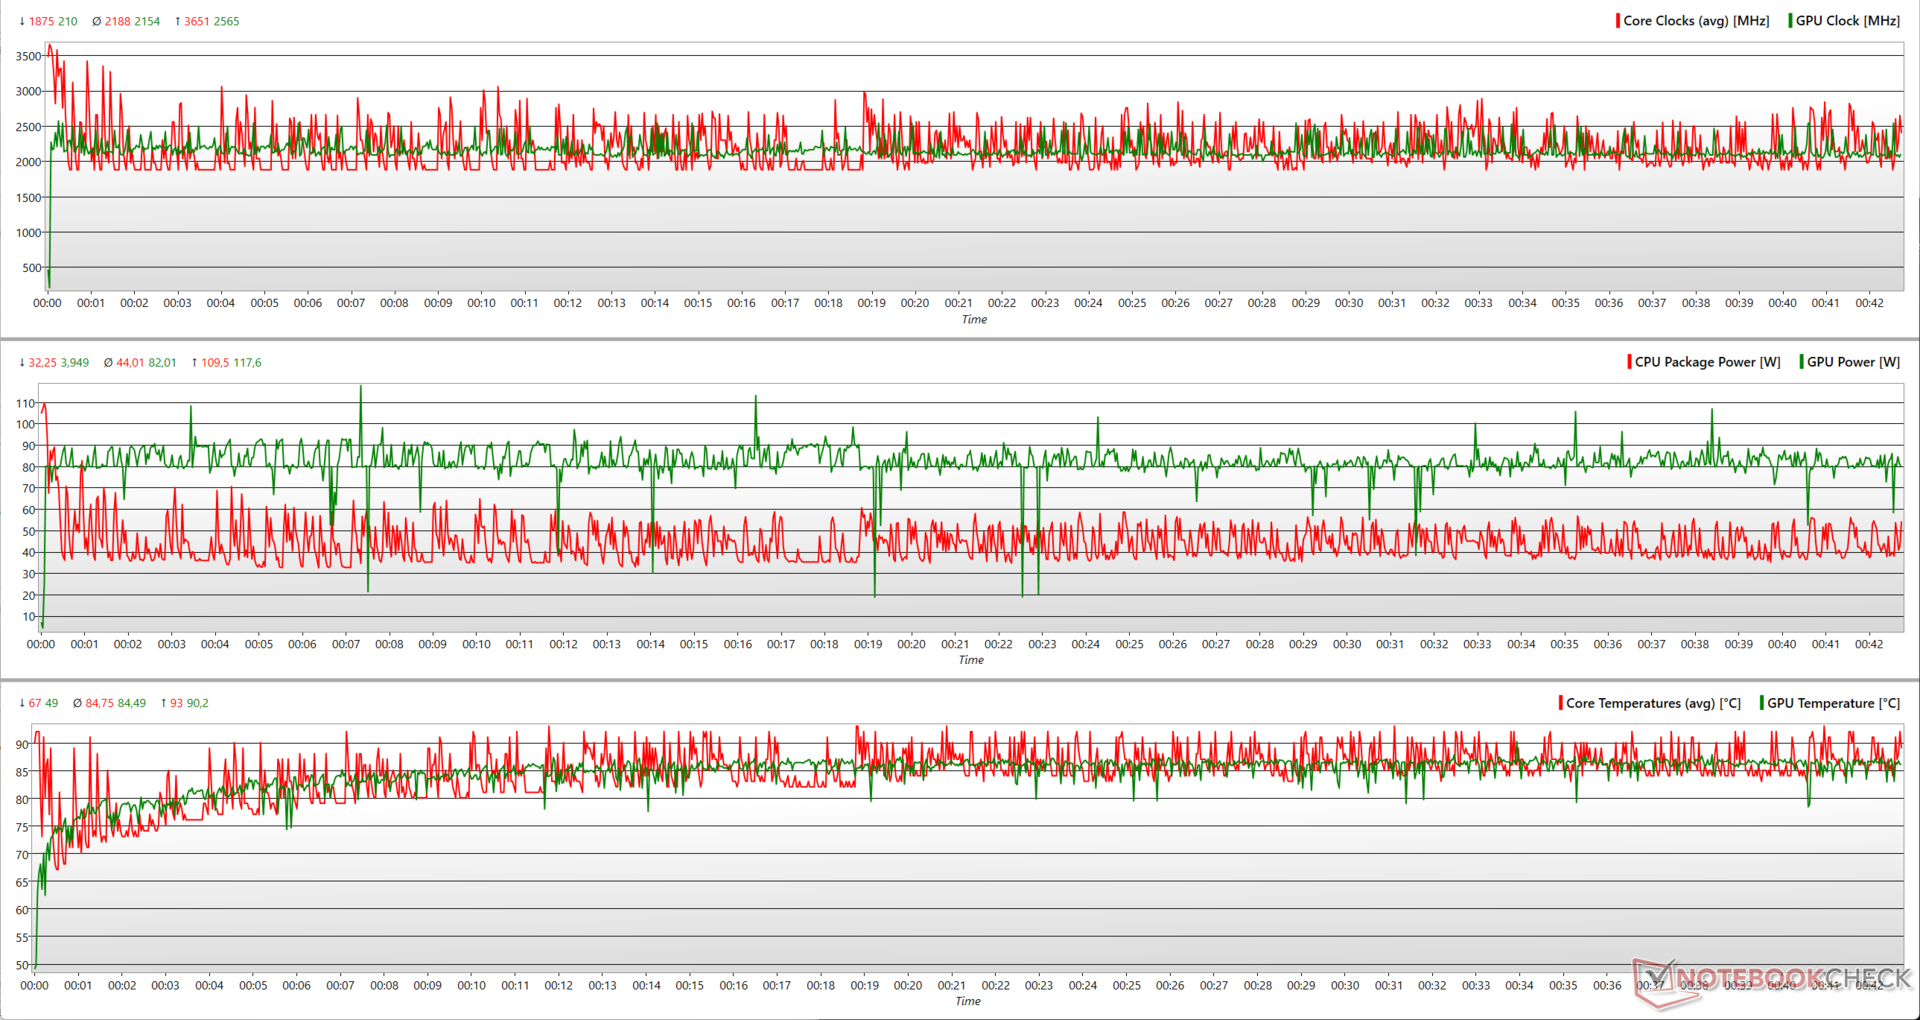
A combined Prime95 and FurMark stress indicates that the RTX 4050 can utilize up to 117 W with a maximum clock of 2,565 MHz. The Core i7-13620H has to contend with a peak boost of 3.6 GHz as it has to share the thermal and power headroom with the RTX 4050.
| Stress Test | CPU Clock (GHz) | GPU Clock (MHz) | Average CPU Temperature (°C) | Average GPU Temperature (°C) |
| System Idle | 4.3 | 210 | 37 | 38.4 |
| Prime95 | 4.8 | 210 | 75 | 54.2 |
| Prime95 + FurMark | 3.2 | 2,220 | 77 | 79.7 |
| The Witcher 3 1080p Ultra | 4.8 | 2,535 | 76 | 80.5 |
In The Witcher 3 1080p Ultra stress test, the RTX 4050 is able to attain the same 2,565 MHz clock but at a much lower max TGP of 103 W. This gives some breathing space for the Core i7-13620H to utilize up to 42 W for a max boost of 4.26 GHz.

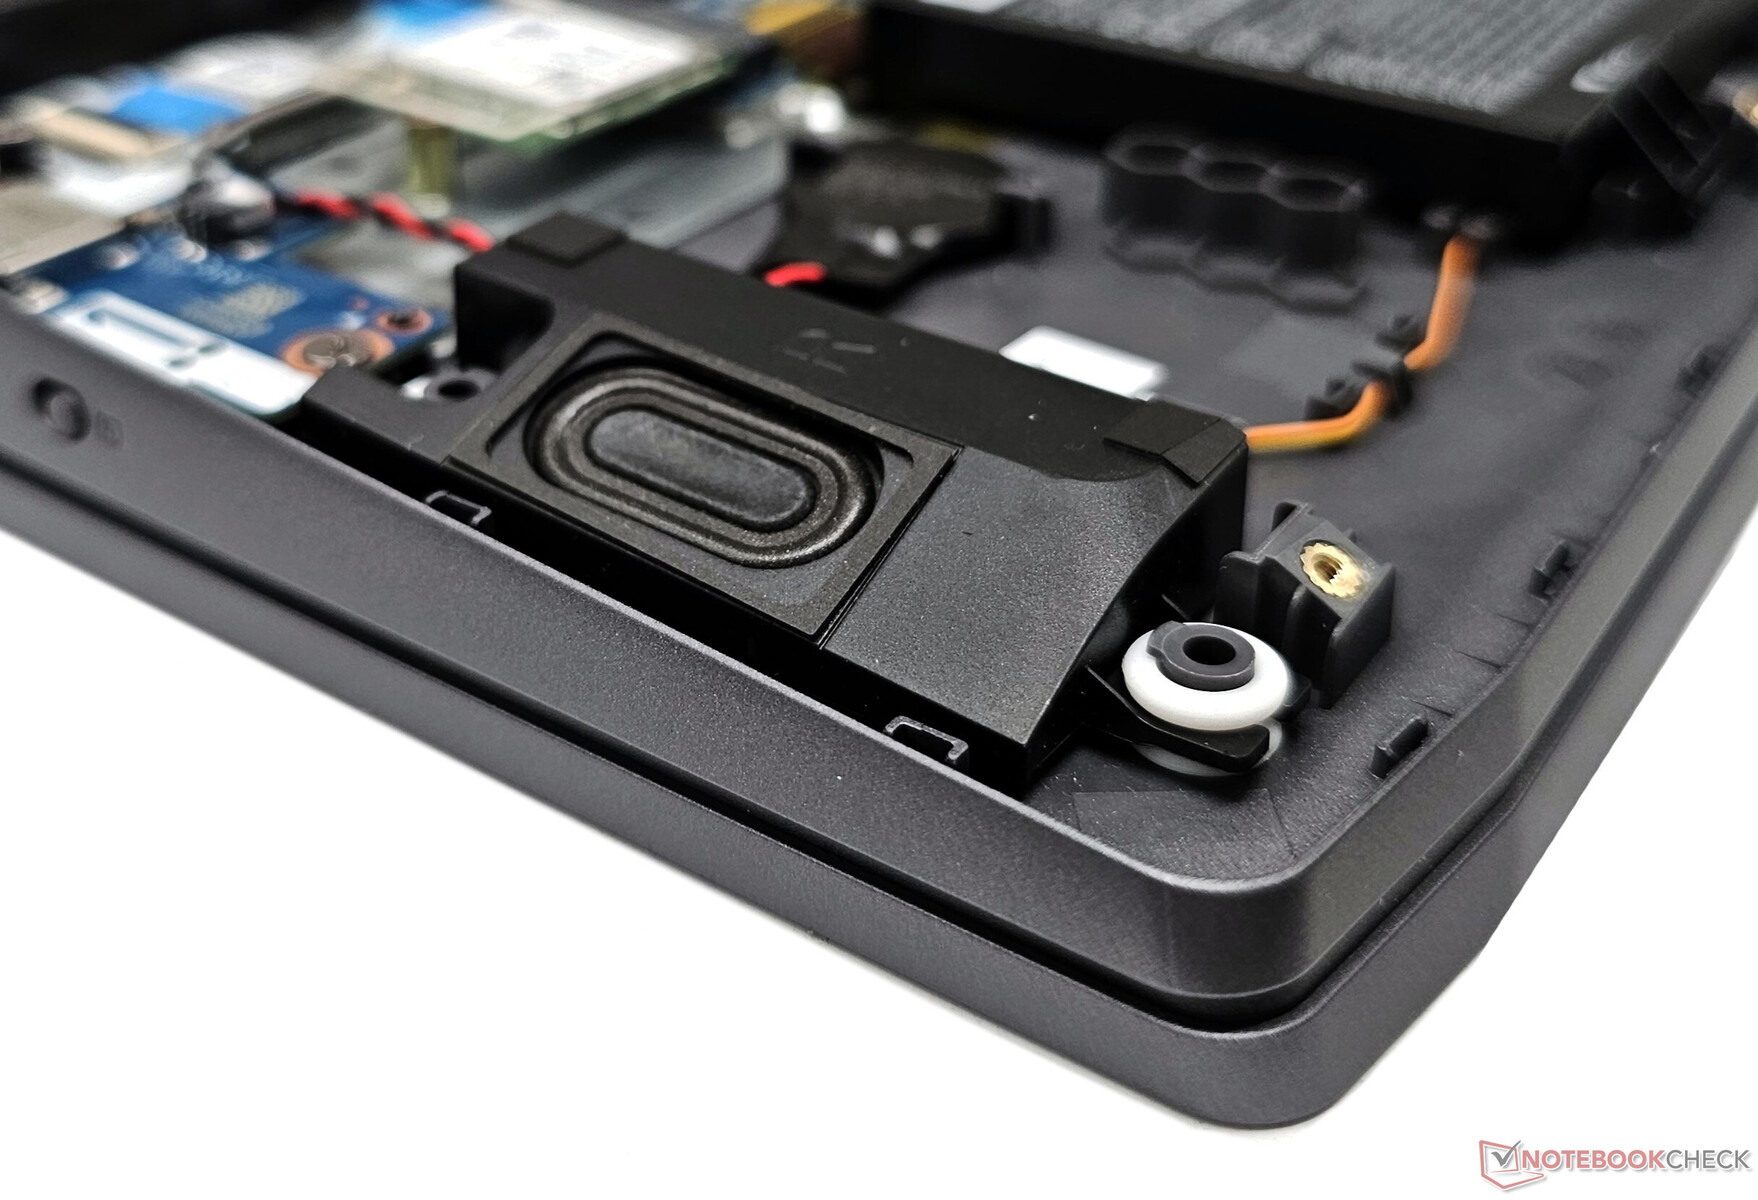
Speakers
The LOQ 15IRH8's speakers have decent loudness. The bass is not very deep, but the mids and highs are adequately reproduced. Users can get a better audio output via wired speakers or Bluetooth 5.2.
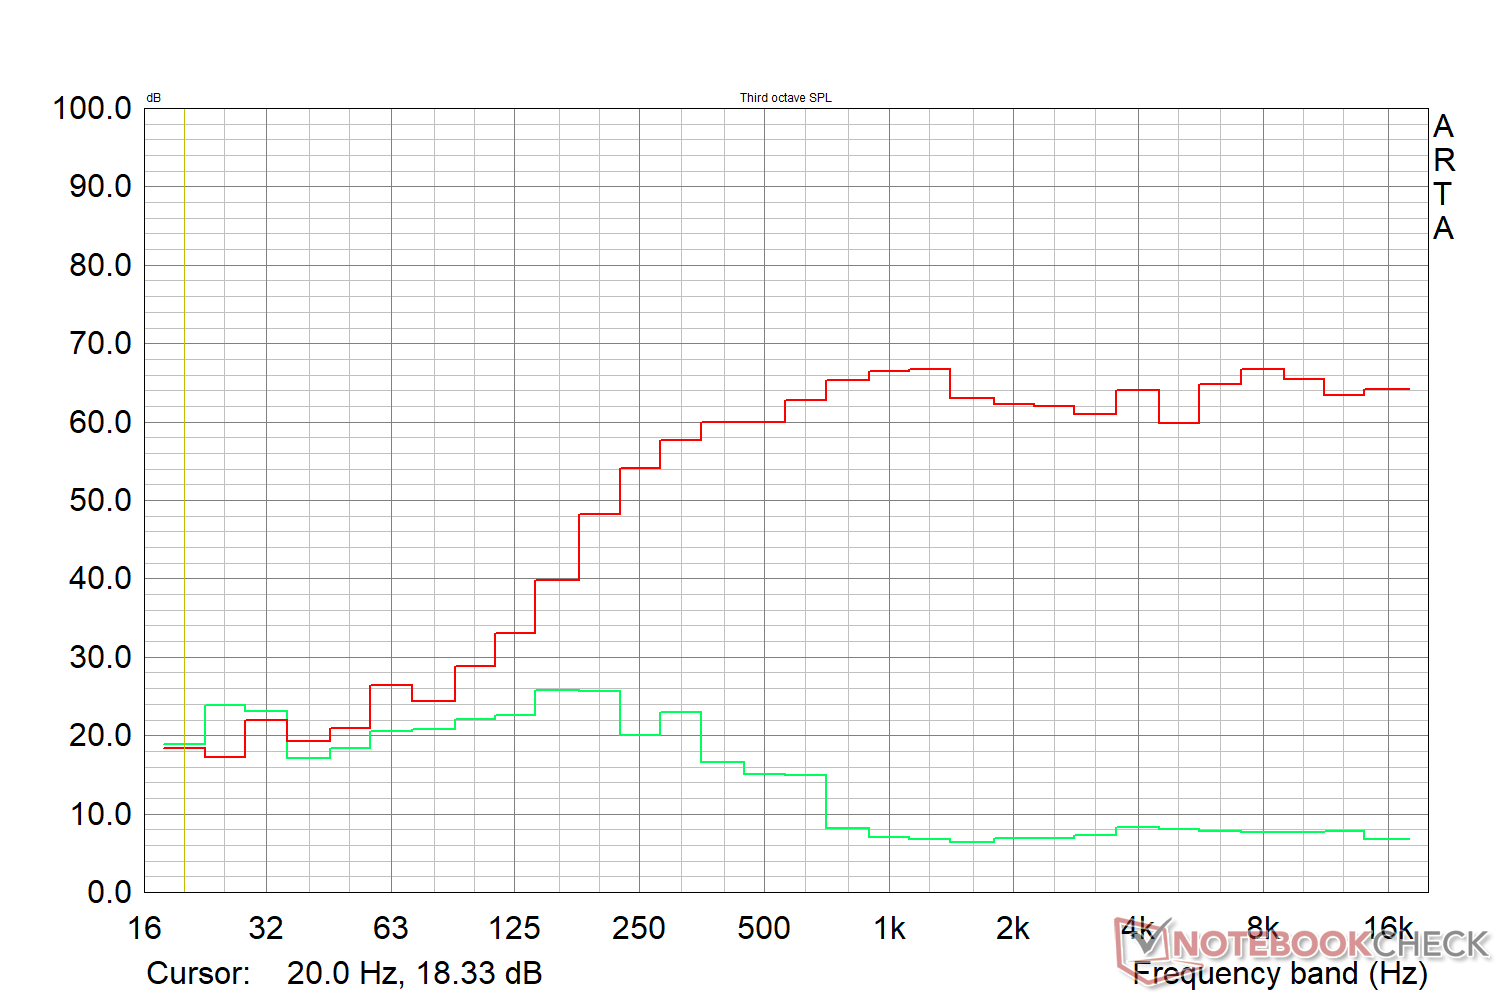
Lenovo LOQ 15IRH8 Core i7 audio analysis
(±) | speaker loudness is average but good (75.9 dB)
Bass 100 - 315 Hz
(-) | nearly no bass - on average 18.6% lower than median
(±) | linearity of bass is average (10.2% delta to prev. frequency)
Mids 400 - 2000 Hz
(+) | balanced mids - only 2.2% away from median
(+) | mids are linear (3.1% delta to prev. frequency)
Highs 2 - 16 kHz
(+) | balanced highs - only 2.3% away from median
(+) | highs are linear (4.4% delta to prev. frequency)
Overall 100 - 16.000 Hz
(+) | overall sound is linear (13.7% difference to median)
Compared to same class
» 18% of all tested devices in this class were better, 6% similar, 76% worse
» The best had a delta of 7%, average was 19%, worst was 132%
Compared to all devices tested
» 11% of all tested devices were better, 3% similar, 86% worse
» The best had a delta of 4%, average was 26%, worst was 134%
Apple MacBook Pro 16 2021 M1 Pro audio analysis
(+) | speakers can play relatively loud (84.7 dB)
Bass 100 - 315 Hz
(+) | good bass - only 3.8% away from median
(+) | bass is linear (5.2% delta to prev. frequency)
Mids 400 - 2000 Hz
(+) | balanced mids - only 1.3% away from median
(+) | mids are linear (2.1% delta to prev. frequency)
Highs 2 - 16 kHz
(+) | balanced highs - only 1.9% away from median
(+) | highs are linear (2.7% delta to prev. frequency)
Overall 100 - 16.000 Hz
(+) | overall sound is linear (4.6% difference to median)
Compared to same class
» 0% of all tested devices in this class were better, 0% similar, 100% worse
» The best had a delta of 5%, average was 18%, worst was 45%
Compared to all devices tested
» 0% of all tested devices were better, 0% similar, 100% worse
» The best had a delta of 4%, average was 26%, worst was 134%
Energy Management: AMD variant looks to be more economical
Power Consumption
Power consumption under load is generally on the lower side compared to the competition. Notwithstanding the display differences, the Ryzen 7 7840HS-powered LOQ 15APH8 is about 18% more economical in overall power consumption than our Intel-based LOQ 15IRH8 unit.
The all-AMD Asus TUF Gaming A16 is the most frugal overall, but the load consumption is within comparable range of the LOQ 15IRH8. Power consumption under maximum load exceeds the supplied charger's 170 W rating.
| Off / Standby | |
| Idle | |
| Load |
|
| Lenovo LOQ 15IRH8 Core i7 i7-13620H, NVIDIA GeForce RTX 4050 Laptop GPU, IPS, 2560x1440, 15.60 | Lenovo LOQ 16IRH8 i7-13620H, NVIDIA GeForce RTX 4060 Laptop GPU, IPS, 2560x1600, 16.00 | Lenovo LOQ 15APH8 R7 7840HS, NVIDIA GeForce RTX 4050 Laptop GPU, IPS, 1920x1080, 15.60 | MSI Katana 17 B13VFK i7-13620H, NVIDIA GeForce RTX 4060 Laptop GPU, IPS LED, 1920x1080, 17.30 | Lenovo Legion Pro 5 16ARX8 (R5 7645HX, RTX 4050) R5 7645HX, NVIDIA GeForce RTX 4050 Laptop GPU, IPS, 2560x1600, 16.00 | HP Victus 16-r0077ng i7-13700H, NVIDIA GeForce RTX 4070 Laptop GPU, IPS, 1920x1080, 16.10 | Dell G15 5530 i7-13650HX, NVIDIA GeForce RTX 4060 Laptop GPU, IPS, 1920x1080, 15.60 | Asus TUF Gaming A16 FA617XS R9 7940HS, Radeon RX 7600S, IPS, 1920x1200, 16.00 | Average NVIDIA GeForce RTX 4050 Laptop GPU | Average of class Gaming | |
|---|---|---|---|---|---|---|---|---|---|---|
| Power Consumption | 6% | 18% | 19% | 15% | 20% | 12% | 31% | 22% | 1% | |
| Idle Minimum * | 18.52 | 17.2 7% | 15 19% | 12.2 34% | 13 30% | 8 57% | 8.4 55% | 7 62% | 11.3 ? 39% | 13.9 ? 25% |
| Idle Average * | 22.54 | 19.3 14% | 17.7 21% | 14.9 34% | 17.4 23% | 13 42% | 14.98 34% | 10 56% | 16.5 ? 27% | 19 ? 16% |
| Idle Maximum * | 29.79 | 21.2 29% | 21.5 28% | 15.8 47% | 21.8 27% | 22 26% | 15.56 48% | 15 50% | 19.1 ? 36% | 25.9 ? 13% |
| Load Average * | 94.5 | 90 5% | 73.5 22% | 85.22 10% | 96.4 -2% | 86 9% | 96.8 -2% | 86 9% | 89.3 ? 6% | 112 ? -19% |
| Witcher 3 ultra * | 154.4 | 168 -9% | 138.6 10% | 151.1 2% | 125 19% | 141.8 8% | 186 -20% | 160.6 -4% | ||
| Load Maximum * | 190.4 | 211 -11% | 176.5 7% | 212.8 -12% | 204 -7% | 233 -22% | 271.42 -43% | 172 10% | 185.9 ? 2% | 247 ? -30% |
* ... smaller is better
Power Consumption: The Witcher 3 / Stress test
Power Consumption: External Monitor
Battery Life
Battery runtimes are similar to what we've observed with the LOQ 16IRH8. The LOQ 15APH8's power consumption gains translate into a 25% longer battery life compared to the LOQ 15IRH8.
The supplied 170 W power adapter supports Rapid Charge fast charging, which can be enabled in the Lenovo Vantage app. This allows the device to be charged from zero to 100% in approximately 45 minutes.
| Lenovo LOQ 15IRH8 Core i7 i7-13620H, NVIDIA GeForce RTX 4050 Laptop GPU, 60 Wh | Lenovo LOQ 16IRH8 i7-13620H, NVIDIA GeForce RTX 4060 Laptop GPU, 80 Wh | Lenovo LOQ 15APH8 R7 7840HS, NVIDIA GeForce RTX 4050 Laptop GPU, 60 Wh | MSI Katana 17 B13VFK i7-13620H, NVIDIA GeForce RTX 4060 Laptop GPU, 53.5 Wh | Lenovo Legion Pro 5 16ARX8 (R5 7645HX, RTX 4050) R5 7645HX, NVIDIA GeForce RTX 4050 Laptop GPU, 80 Wh | HP Victus 16-r0077ng i7-13700H, NVIDIA GeForce RTX 4070 Laptop GPU, 83 Wh | Dell G15 5530 i7-13650HX, NVIDIA GeForce RTX 4060 Laptop GPU, 86 Wh | Asus TUF Gaming A16 FA617XS R9 7940HS, Radeon RX 7600S, 90 Wh | Average of class Gaming | |
|---|---|---|---|---|---|---|---|---|---|
| Battery Runtime | 6% | 25% | -50% | -9% | 21% | 11% | 108% | 4% | |
| H.264 | 366 | 385 5% | 325 -11% | 405 11% | 746 104% | 383 ? 5% | |||
| WiFi v1.3 | 353 | 376 7% | 441 25% | 176 -50% | 333 -6% | 426 21% | 391 11% | 745 111% | 360 ? 2% |
| Load | 88 | 65 | 58 | 50 | 52 | 87 ? | |||
| Reader / Idle | 587 | 1217 | 535 ? | ||||||
| Witcher 3 ultra | 47 | 47 | 77.9 ? |
Pros
Cons
Verdict: 1080p Ultra gaming that doesn't break the bank
The LOQ 15 Core i7 features a 165 Hz QHD G-Sync display and 1080p webcam despite its low cost. The QHD panel especially impresses with significantly improved color and response times over the FHD 144 Hz option.
The build quality understandably suffers from copious plastic. A more concerning aspect is that the LOQ 15IRH8's Core i7-13620H struggles to sustain its performance unlike what we've seen with the AMD Ryzen 7 7840HS-based LOQ 15APH8 or even the LOQ 16IRH8.
However, performance is adequate for smooth 1080p gaming, thanks to the Intel i7-13620H processor and RTX 4050 graphics that can utilize more than its rated TGP.
The Lenovo LOQ 15 Core i7 checks most boxes and merits a high consideration if you're on the lookout for a capable 1080p gaming laptop around the US$1,200 or ₹1,00,00 mark. However, expectations need to be tempered with regards to build quality and heat emissions."
Another area where the Intel-based LOQ 15 disappoints is in terms of heat emissions. Conversely, fan noise levels are manageable, and it is possible to adequately game at 1080p even in lower power profiles.
Choosing between the Intel and AMD-powered LOQ 15 SKUs comes down to priorities. The Intel version provides better gaming grunt at 1080p and lower fan noise under load. But the AMD variant has an edge in overall CPU performance, runs cooler, is more power-efficient, and has better battery life.
That being said, both the LOQ 15 variants present strong value compared to the Legion Pro 5 16. Laptops such as the HP Victus 16 and the MSI Katana 17 fare noticeably better in the charts, but their pricing doesn't seem to scale well with the hardware on offer relative to the LOQ 15.
Price and Availability
The LOQ 15 Core i7 starts from ₹97,790 for the FHD 144 Hz variant and can be purchased directly from Lenovo India. The website does not currently list availability of the tested QHD variant.
Amazon India does not have most LOQ 15 variants in stock currently except for the LOQ 16IRH8 with a Core i7-13700H and RTX 4060 that is listed at ₹2,25,766.
Lenovo US also has a host of Intel 13th gen LOQ 15s with several Nvidia GPU options. Best Buy is offering a LOQ 15 powered by the Core i5-13420H and RTX 3050 graphics for US$650. Amazon US has a variant with an RTX 4050 for US$1,227. A Ryzen 7 7840HS option with RTX 4050 is also available on Best Buy for US$1,240.
Lenovo LOQ 15IRH8 Core i7
-
10/13/2023 v7
Vaidyanathan Subramaniam


Transparency
The present review sample was made available to the author as a loan by the manufacturer or a shop for the purposes of review. The lender had no influence on this review, nor did the manufacturer receive a copy of this review before publication. There was no obligation to publish this review.
Pricecompare
