 Deutsch
 English
 Español
 Français
 Italiano
 Nederlands
 Polski
 Português
 Русский
 Türkçe
 Svenska
 Chinese
 Magyar
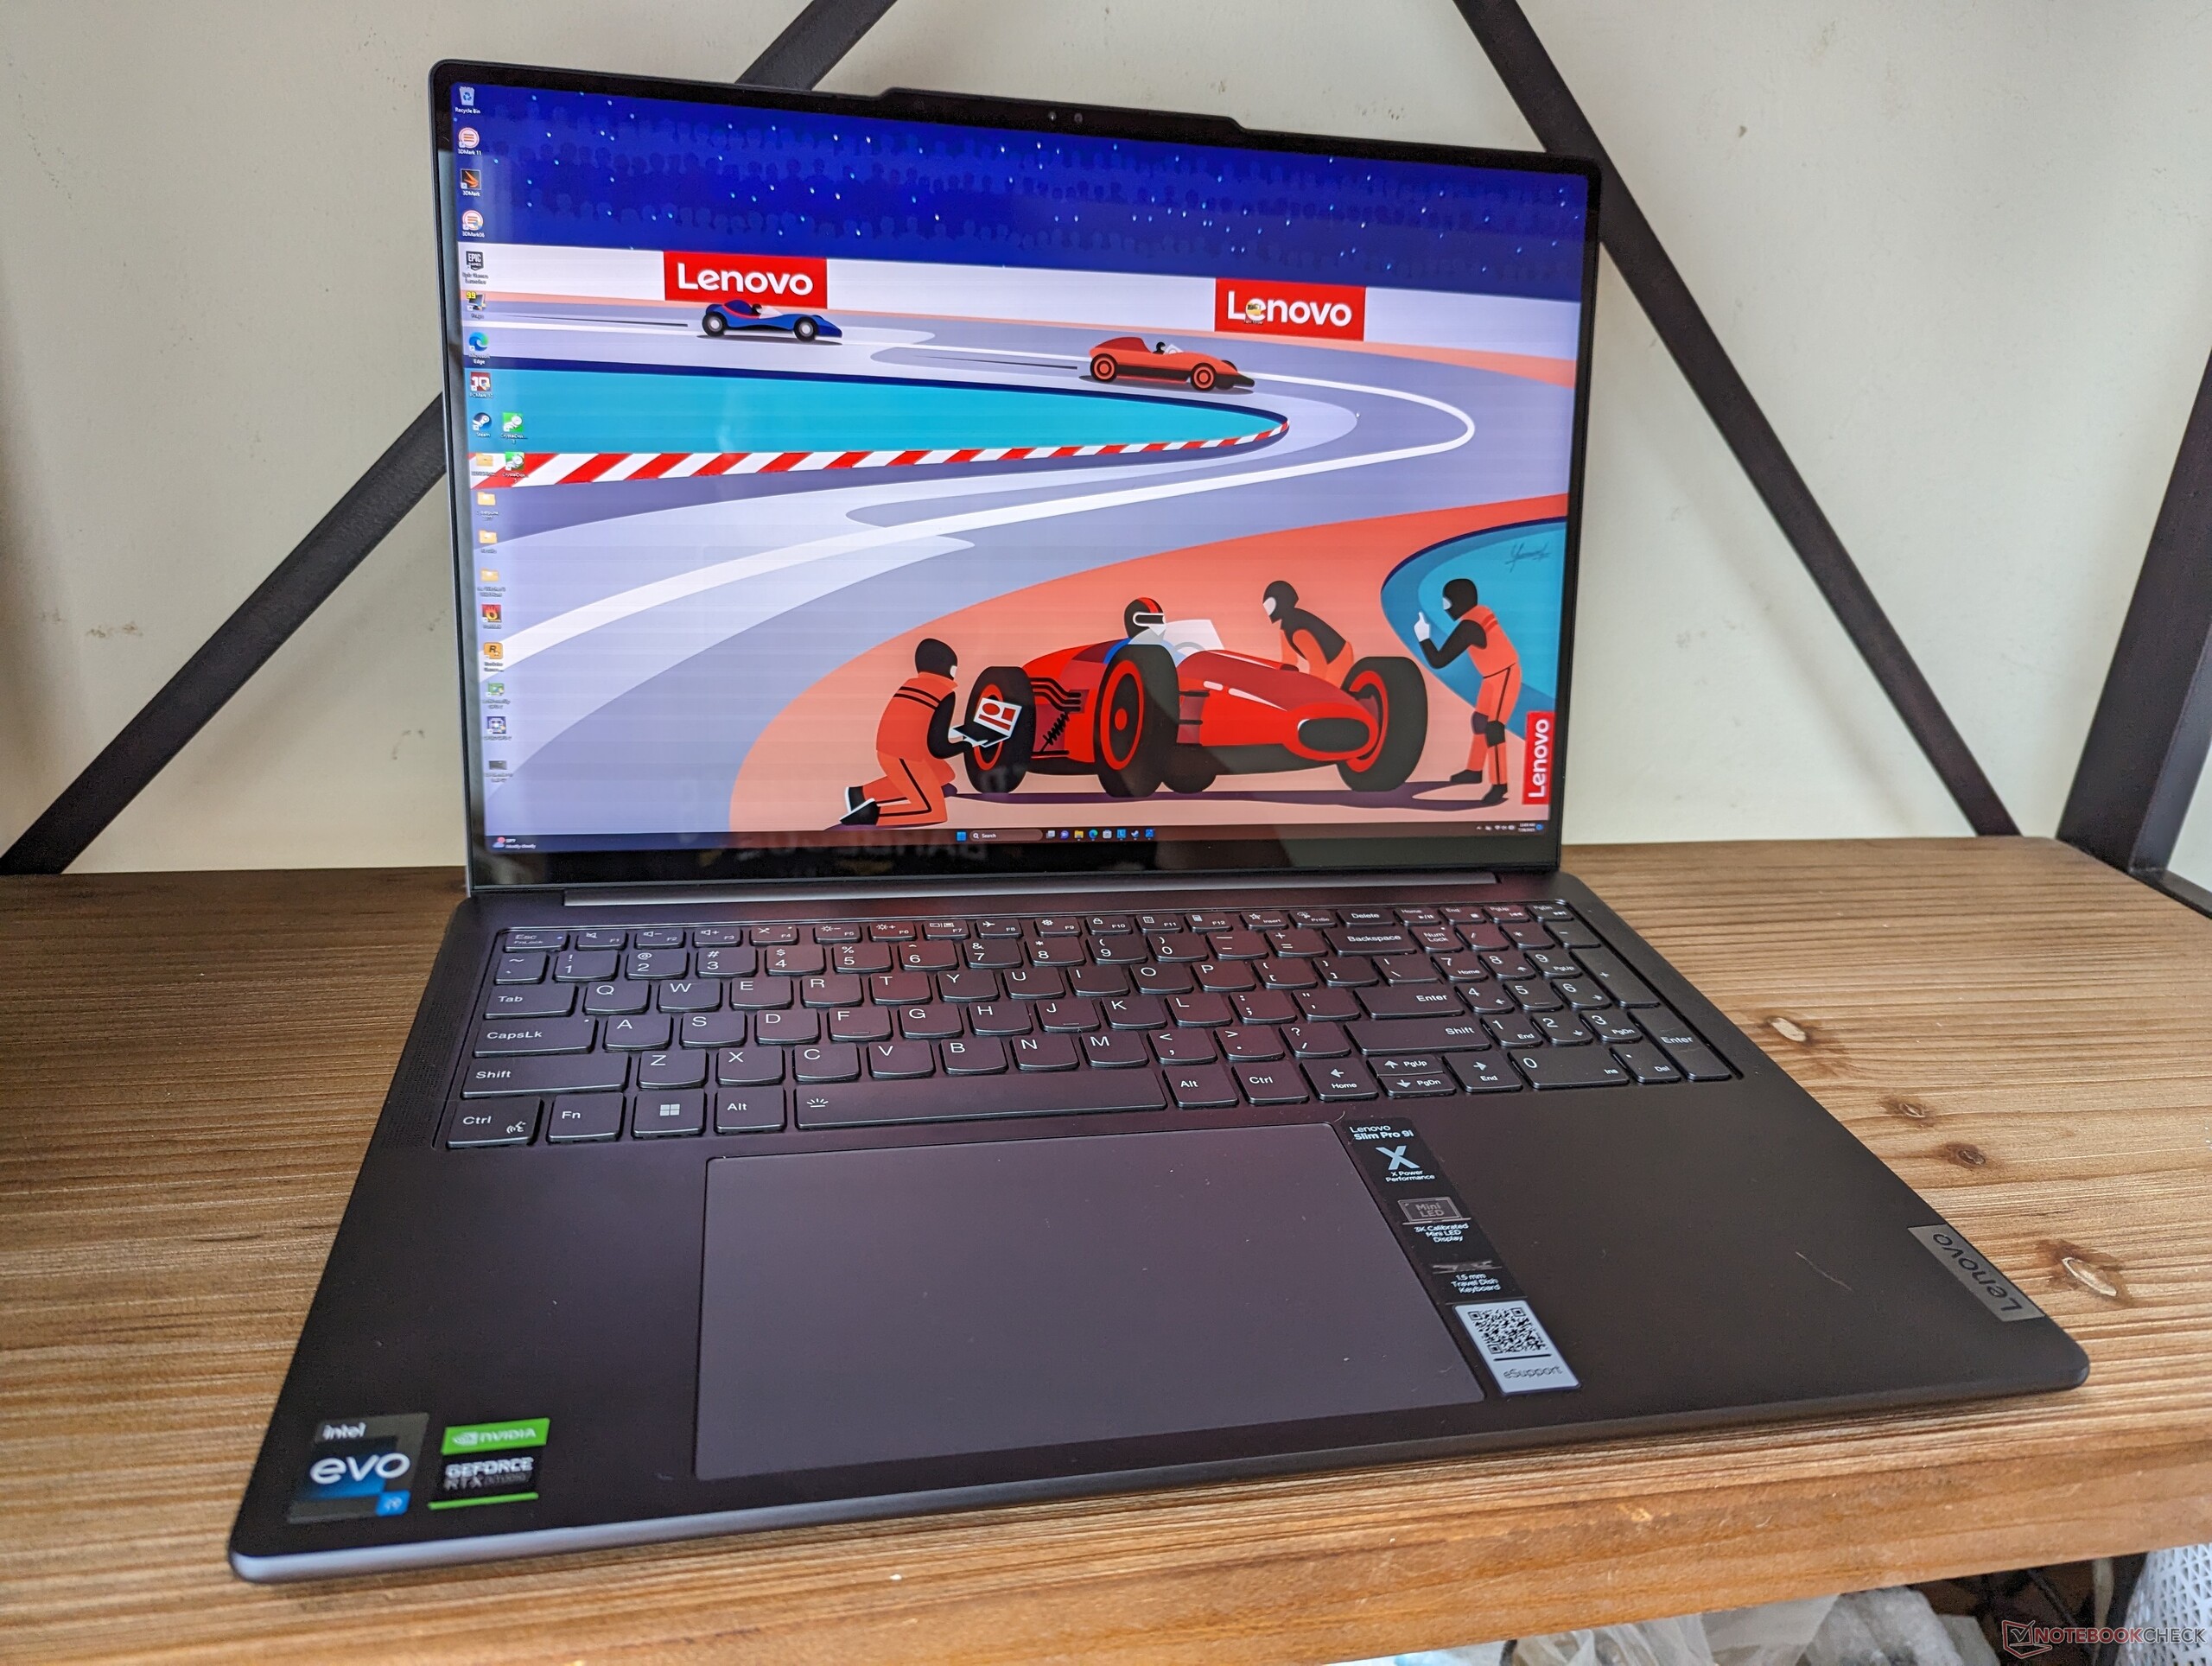
Lenovo Slim Pro 9i 16IRP8 laptop review: The Apple MacBook Pro 16 alternative

The Lenovo Slim Pro 9i 16 G8 is a high-end laptop designed for content creation and multimedia purposes. It competes with 16-inch creator-centric models like the MSI CreatorPro Z16P, Apple MacBook Pro 16, HP Envy 16, or the Asus ProArt StudioBook 16.
Confusingly, the name of this model is different depending on region. In Europe, for example, this model is known as the Yoga Pro 9i 16 whereas it is the Slim Pro 9i 16 in North America. We recommend checking out our review on the Yoga Pro 9i 16 to learn more about the physical features of this laptop.
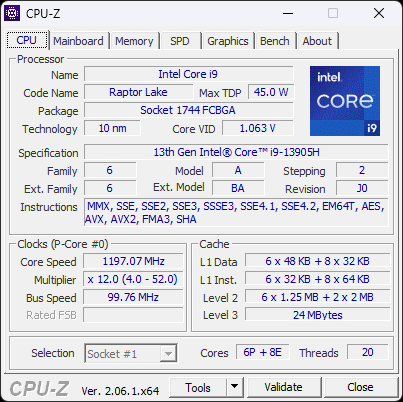
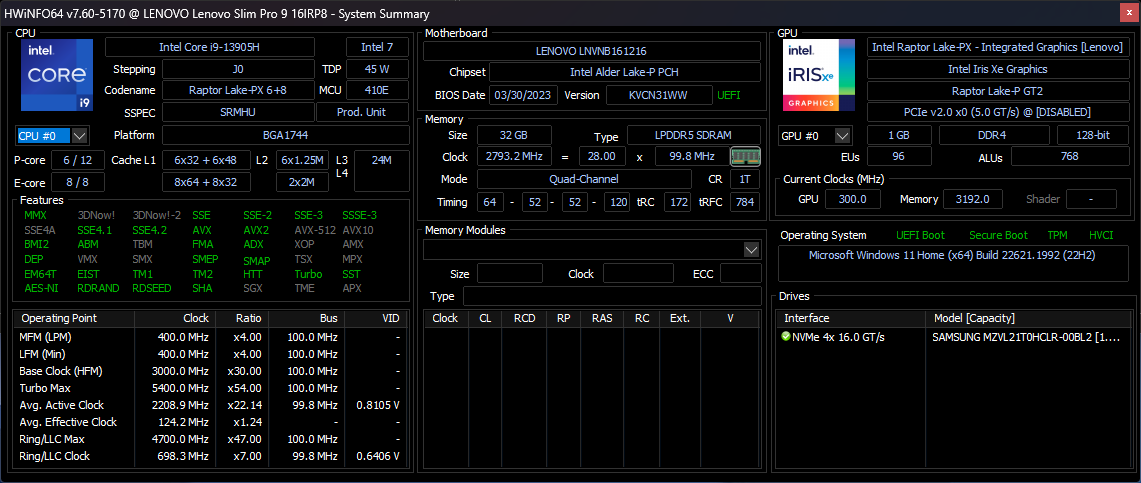
Our review configuration ships with the uncommon 13th gen Raptor Lake Core i9-13905H CPU and 100 W GeForce RTX 4050 in contrast to the Core i7-13705H and RTX 4060 on our Yoga Pro 9i 16. Both configurations otherwise ship with the same 3.2K (3200 x 2000) mini-LED touchscreen with full DCI-P3 colors.
A 14-inch version of this model is also available called the Slim Pro 9i 14 or Yoga Pro 9i 14.
More Lenovo reviews:
Potential Competitors in Comparison
Rating | Date | Model | Weight | Height | Size | Resolution | Best Price |
|---|---|---|---|---|---|---|---|
| 88 % | 08/2023 | Lenovo Slim Pro 9i 16IRP8 i9-13905H, NVIDIA GeForce RTX 4050 Laptop GPU | 2.2 kg | 18.2 mm | 16.00" | 3200x2000 | |
| 88.4 % | 08/2023 | Lenovo Yoga Pro 9 16-IRP G8 i7-13705H, NVIDIA GeForce RTX 4060 Laptop GPU | 2.2 kg | 18.2 mm | 16.00" | 3200x2000 | |
| 86.3 % | 05/2023 | Asus VivoBook Pro 16 i7-12700H, GeForce RTX 3050 Ti Laptop GPU | 1.9 kg | 20 mm | 16.00" | 2560x1600 | |
| 87.5 % | 06/2023 | Acer Swift Edge SFE16-42-R1GM R7 7735U, Radeon 680M | 1.2 kg | 13.95 mm | 16.00" | 3840x2400 | |
| 87.4 % | 08/2022 | Dell Inspiron 16 Plus 7620 i7-12700H, GeForce RTX 3050 Ti Laptop GPU | 2.1 kg | 18.99 mm | 16.00" | 3072x1920 | |
| 86.9 % | 09/2022 | HP Envy 16 h0112nr i7-12700H, GeForce RTX 3060 Laptop GPU | 2.3 kg | 19.8 mm | 16.00" | 3840x2400 |
Case
SD Card Reader
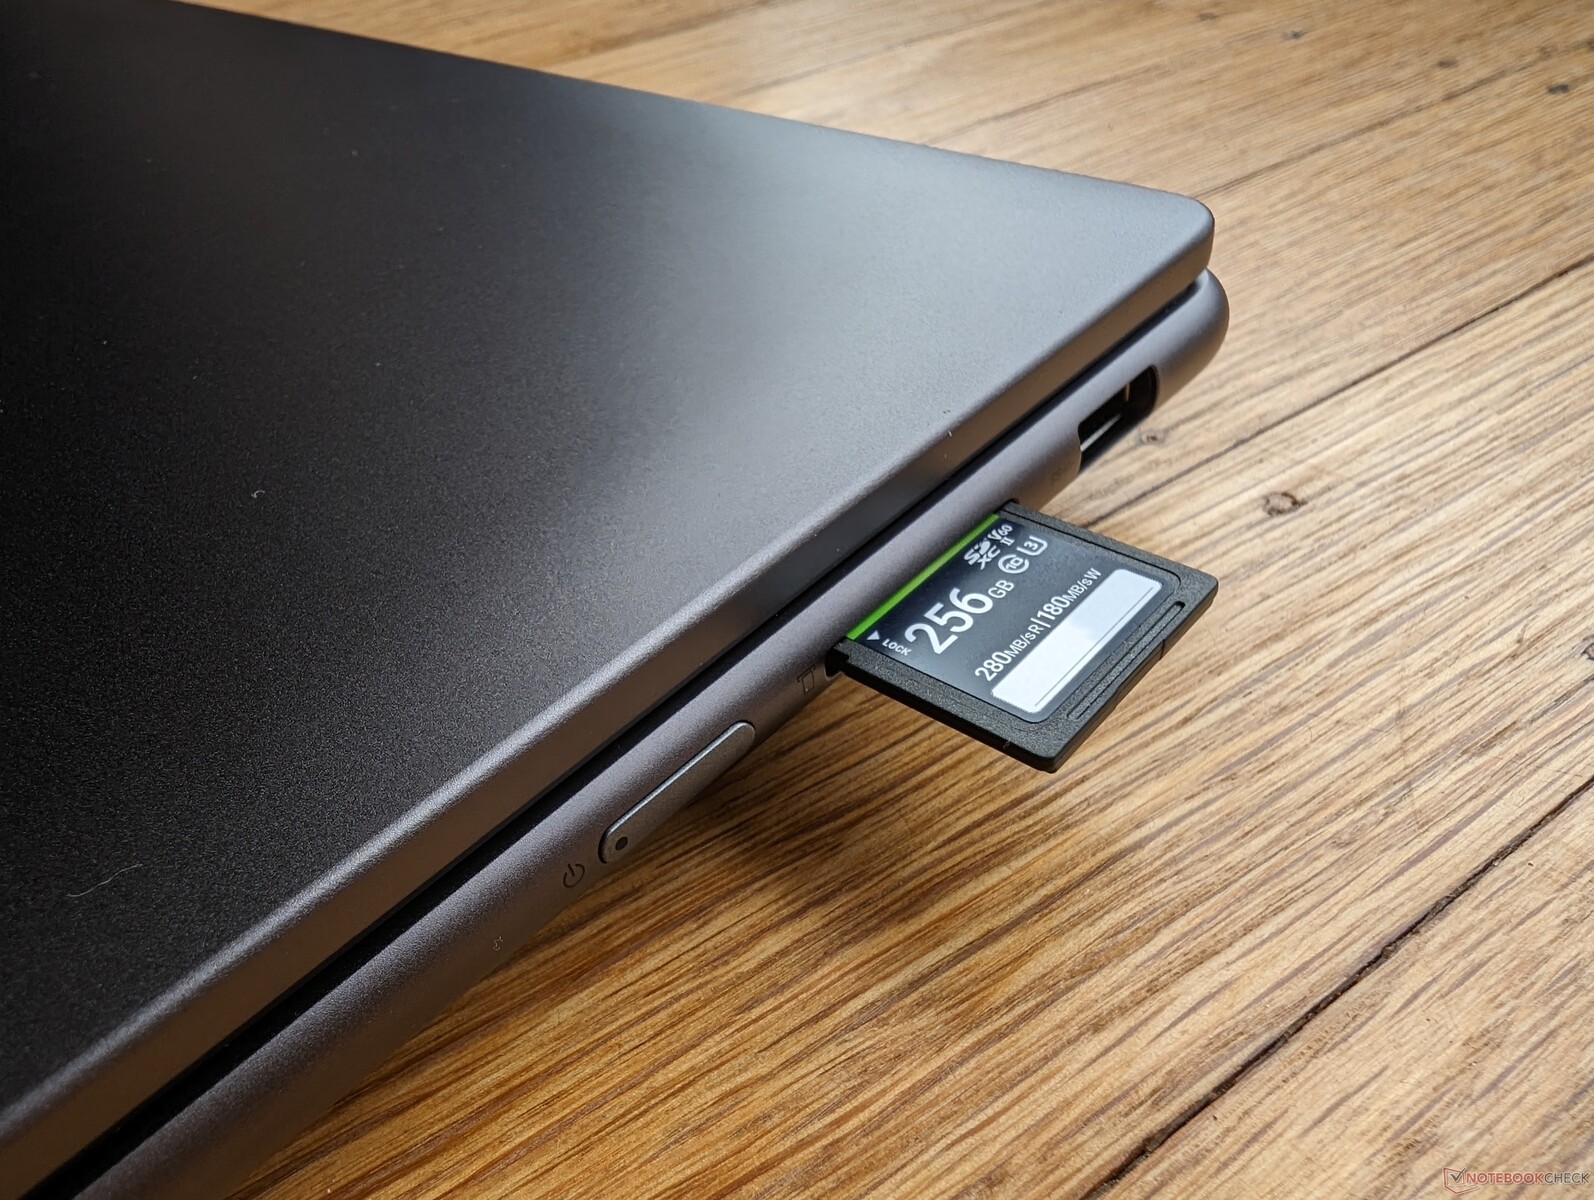
Transfer rates are average for the category with our PNY EliteX-Pro60 V60 UHS-II test card. Unfortunately, the card reader on the Lenovo is shallow and so the SD card would protrude by over half its length for unsafe transporting.
| SD Card Reader | |
| average JPG Copy Test (av. of 3 runs) | |
| Lenovo Slim Pro 9i 16IRP8 (PNY EliteX-Pro60 V60 256 GB) | |
| Lenovo Yoga Pro 9 16-IRP G8 (Angelibird AV Pro V60) | |
| Asus VivoBook Pro 16 (AV Pro SD microSD 128 GB V60) | |
| HP Envy 16 h0112nr (AV Pro SD microSD 128 GB V60) | |
| Dell Inspiron 16 Plus 7620 (Toshiba Exceria Pro SDXC 64 GB UHS-II) | |
| maximum AS SSD Seq Read Test (1GB) | |
| Lenovo Slim Pro 9i 16IRP8 (PNY EliteX-Pro60 V60 256 GB) | |
| HP Envy 16 h0112nr (AV Pro SD microSD 128 GB V60) | |
| Lenovo Yoga Pro 9 16-IRP G8 (Angelibird AV Pro V60) | |
| Asus VivoBook Pro 16 (AV Pro SD microSD 128 GB V60) | |
| Dell Inspiron 16 Plus 7620 (Toshiba Exceria Pro SDXC 64 GB UHS-II) | |
Communication
| Networking | |
| iperf3 transmit AXE11000 | |
| Lenovo Yoga Pro 9 16-IRP G8 | |
| Asus VivoBook Pro 16 | |
| Lenovo Slim Pro 9i 16IRP8 | |
| Acer Swift Edge SFE16-42-R1GM | |
| iperf3 receive AXE11000 | |
| Lenovo Yoga Pro 9 16-IRP G8 | |
| Lenovo Slim Pro 9i 16IRP8 | |
| Acer Swift Edge SFE16-42-R1GM | |
| iperf3 transmit AXE11000 6GHz | |
| Lenovo Slim Pro 9i 16IRP8 | |
| Acer Swift Edge SFE16-42-R1GM | |
| HP Envy 16 h0112nr | |
| Dell Inspiron 16 Plus 7620 | |
| iperf3 receive AXE11000 6GHz | |
| Asus VivoBook Pro 16 | |
| Acer Swift Edge SFE16-42-R1GM | |
| Lenovo Slim Pro 9i 16IRP8 | |
| HP Envy 16 h0112nr | |
| Dell Inspiron 16 Plus 7620 | |
Webcam
The 5 MP sensor is of higher quality than the webcams on most other laptops where 2 MP or 1 MP are still commonplace. Both IR and a camera kill switch are included.


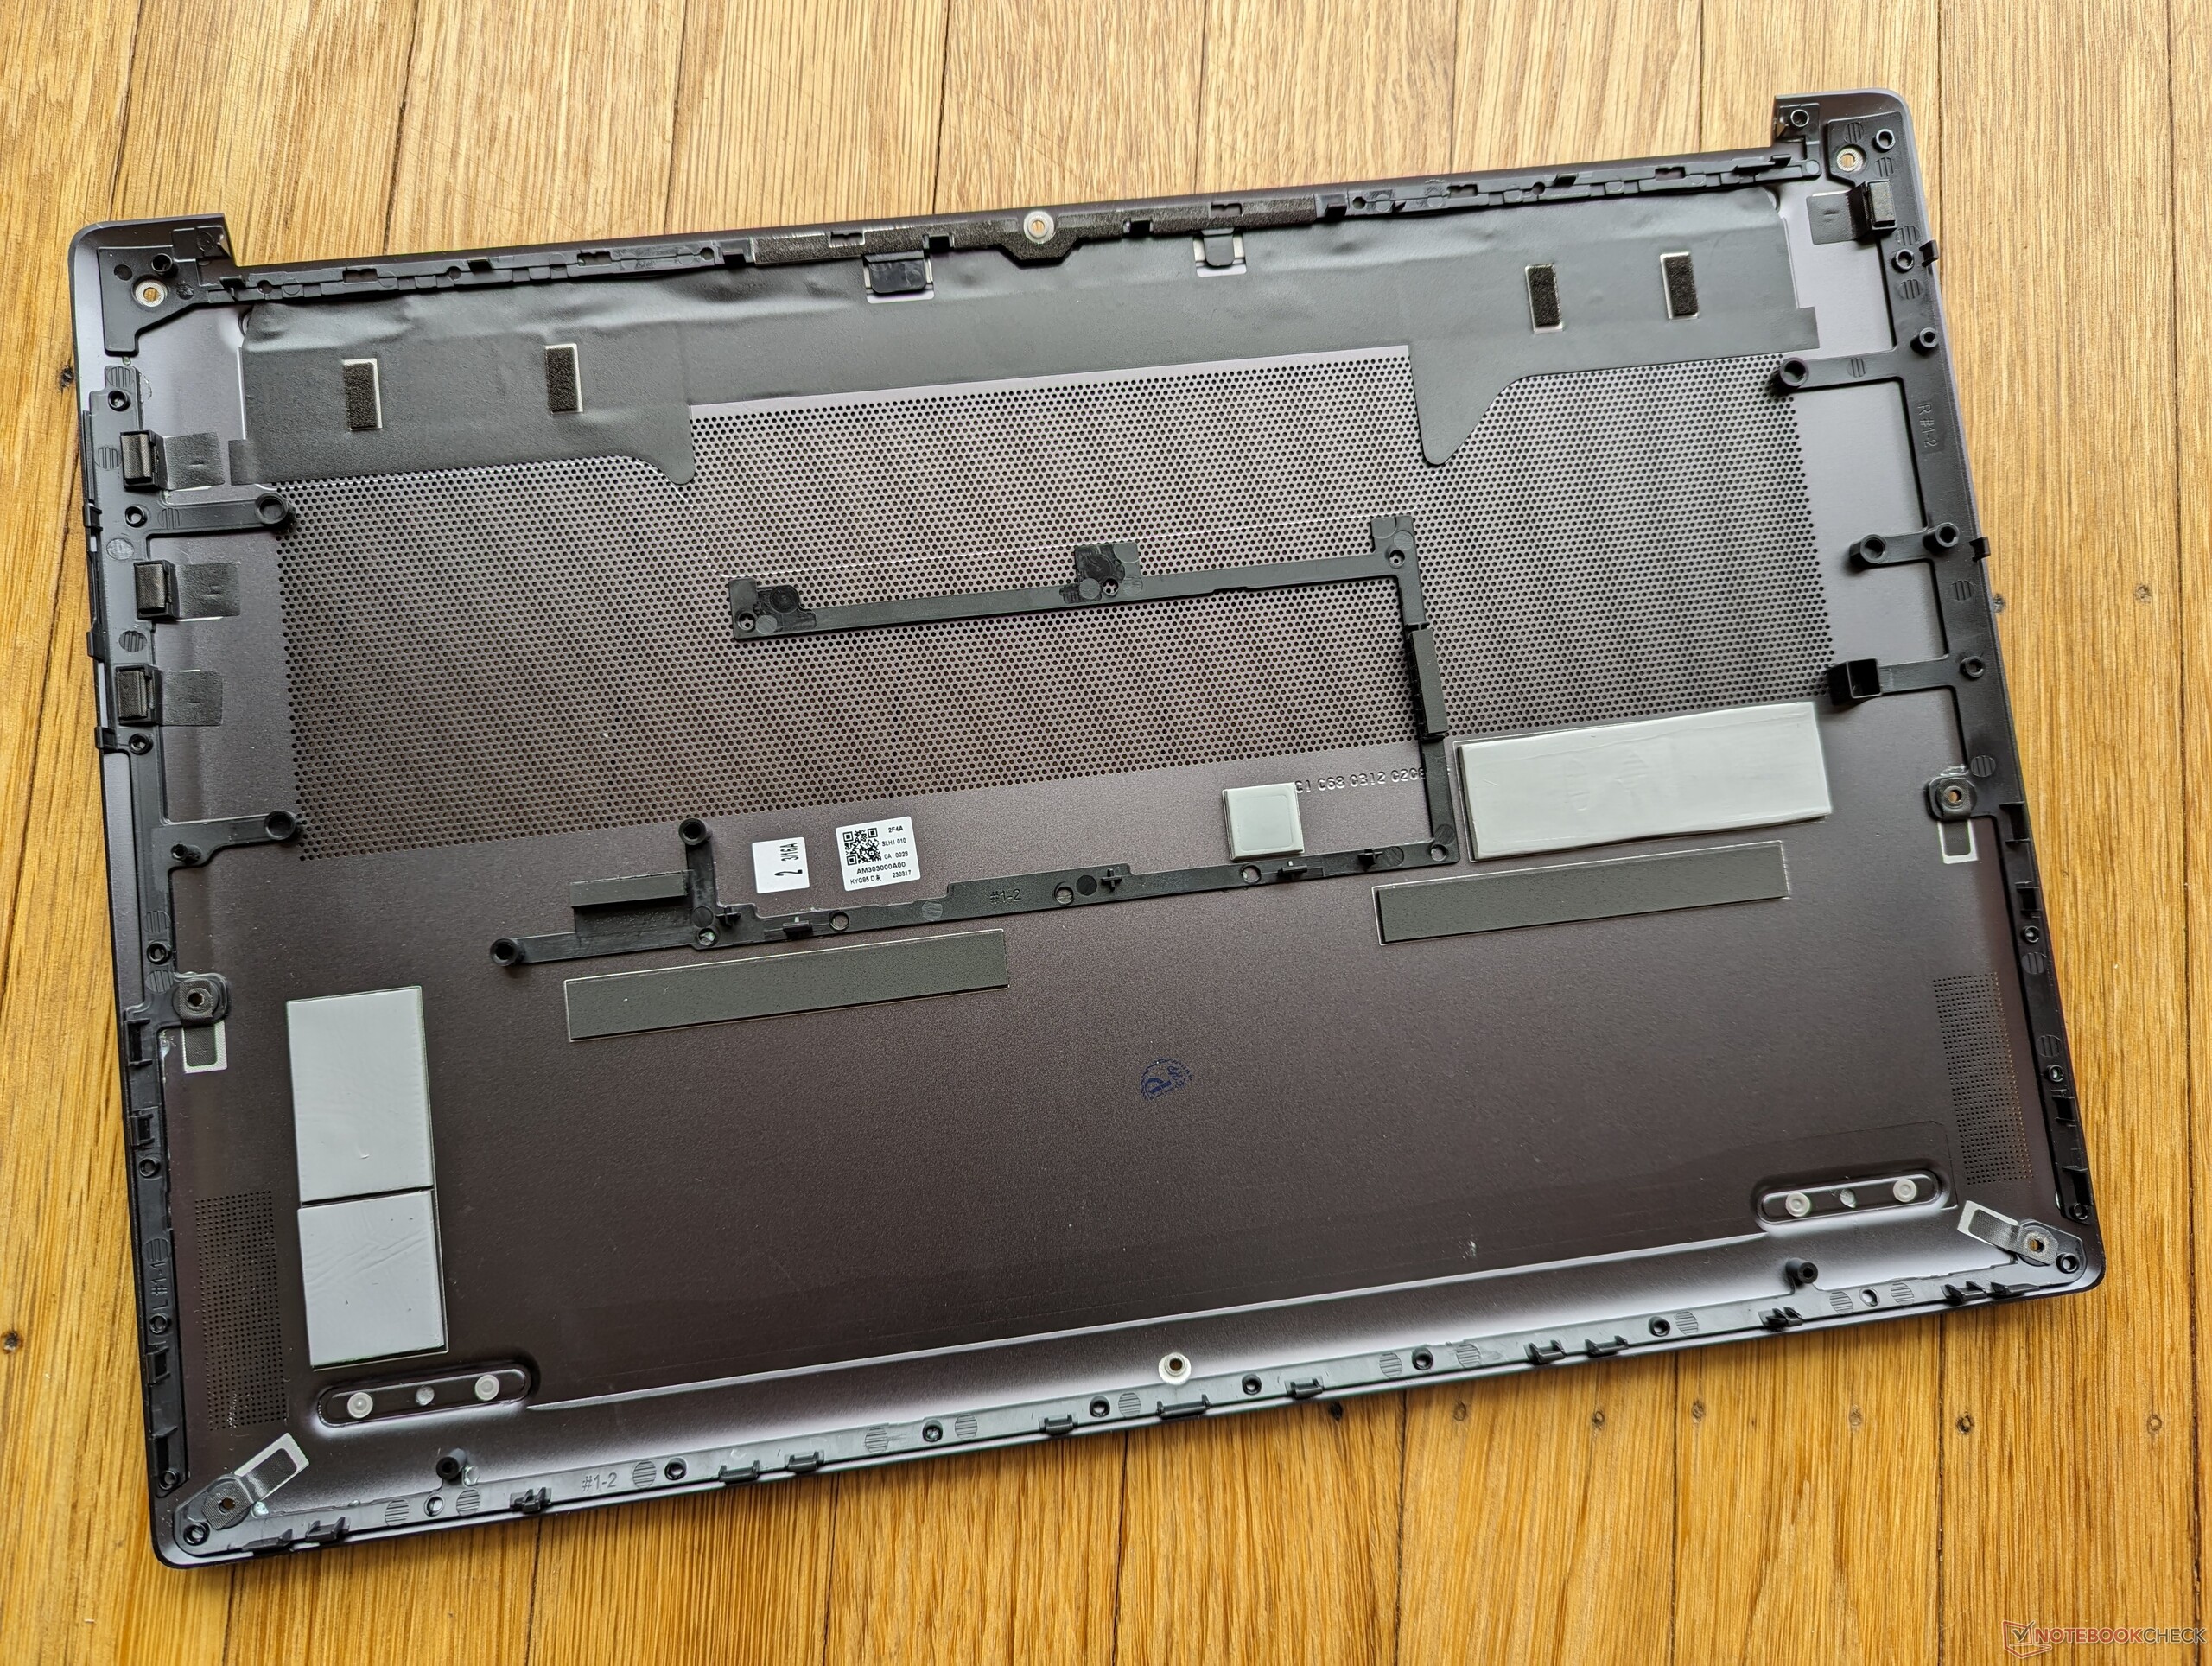
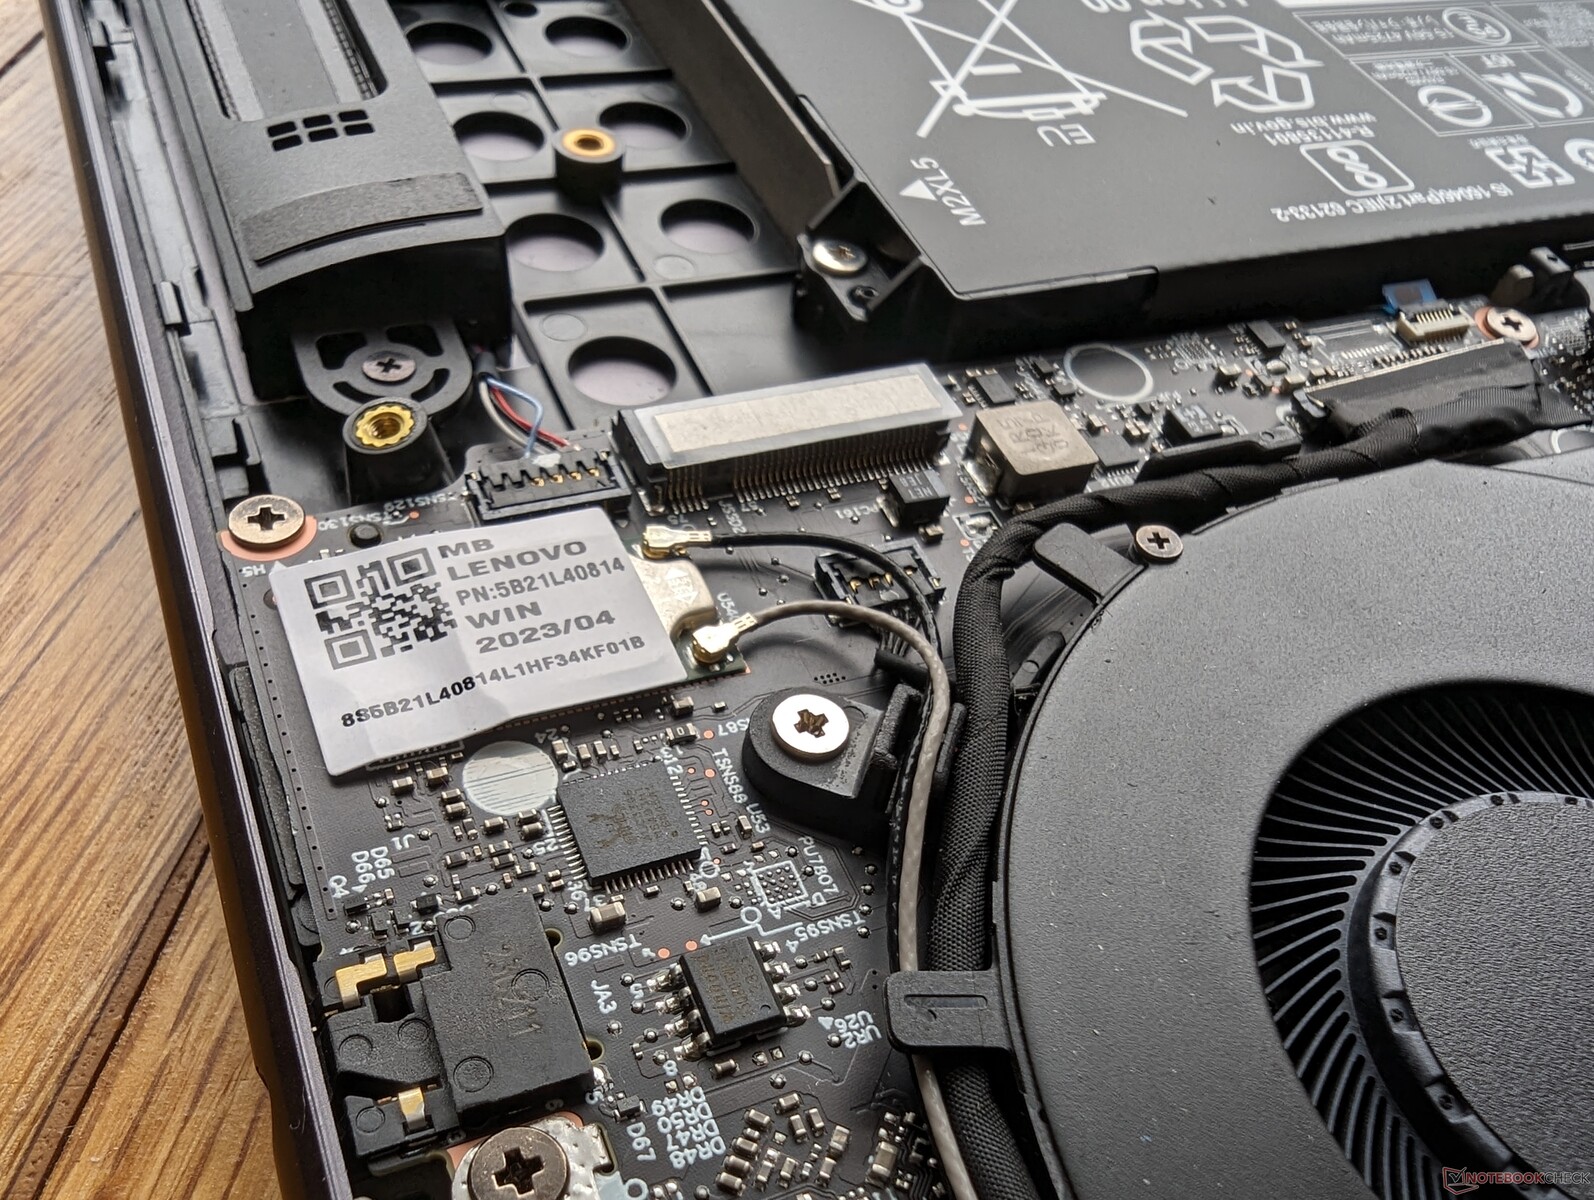
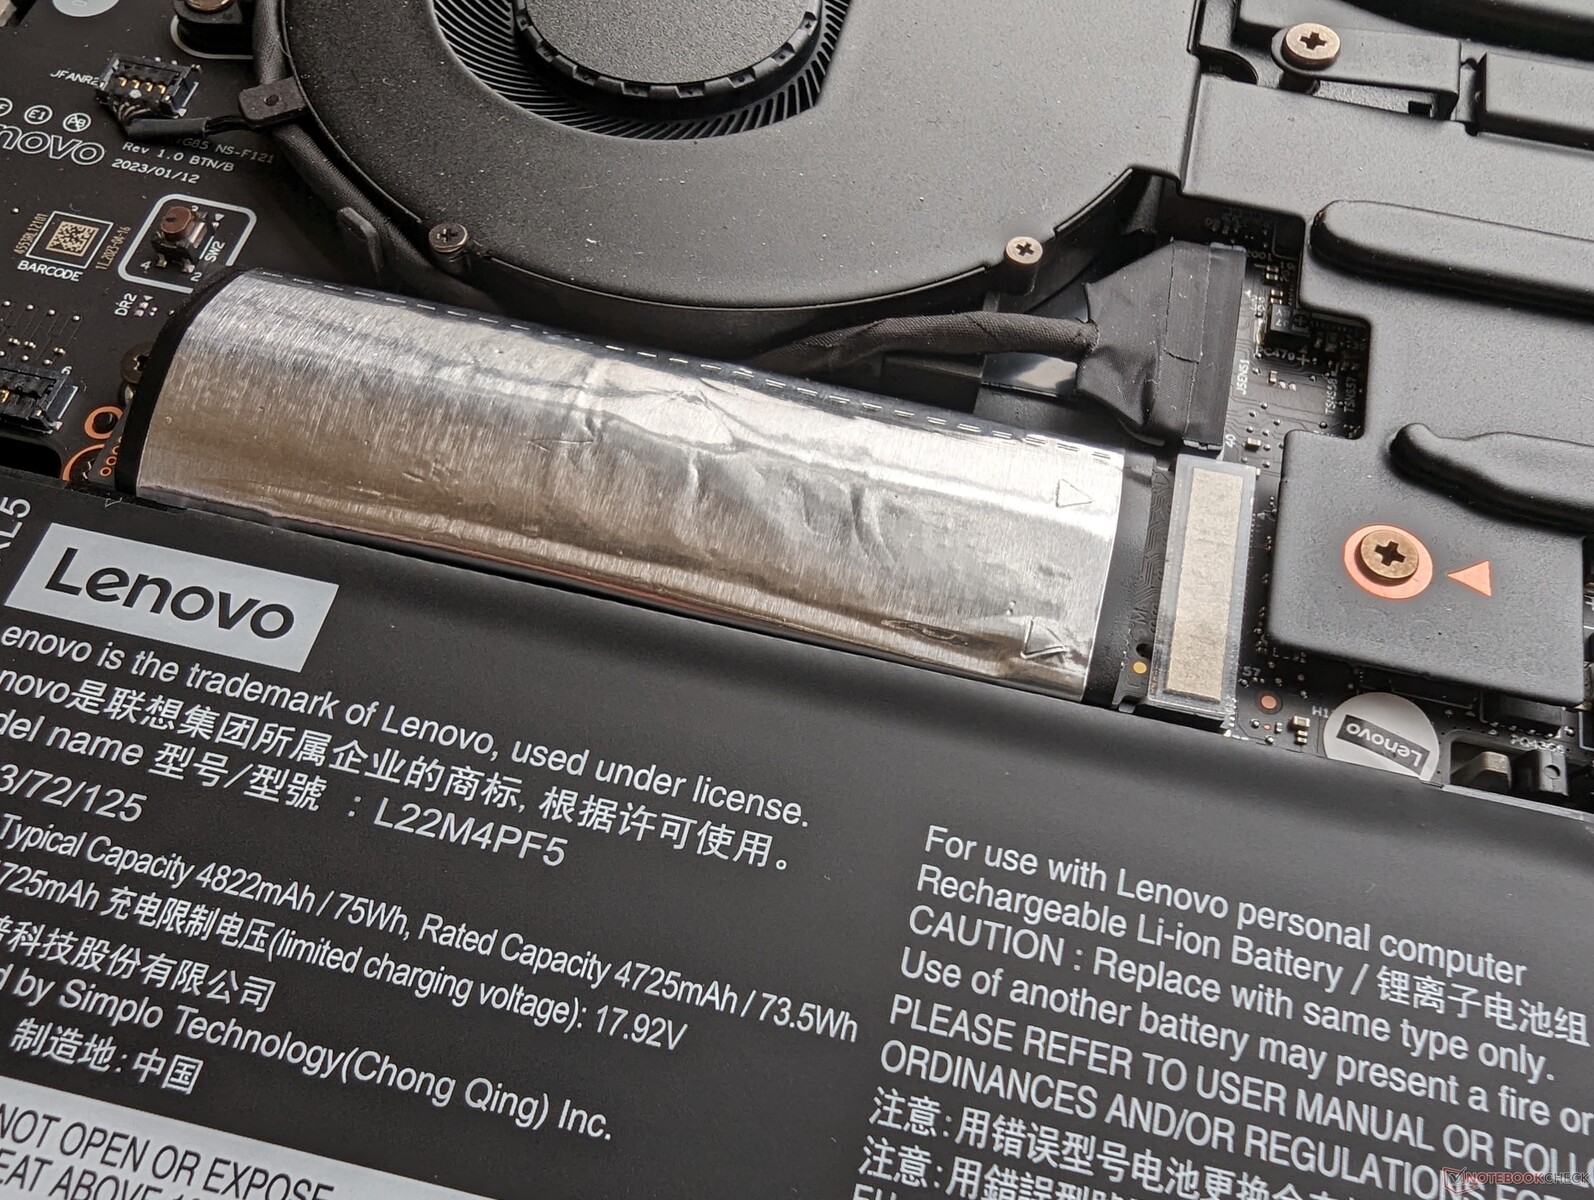
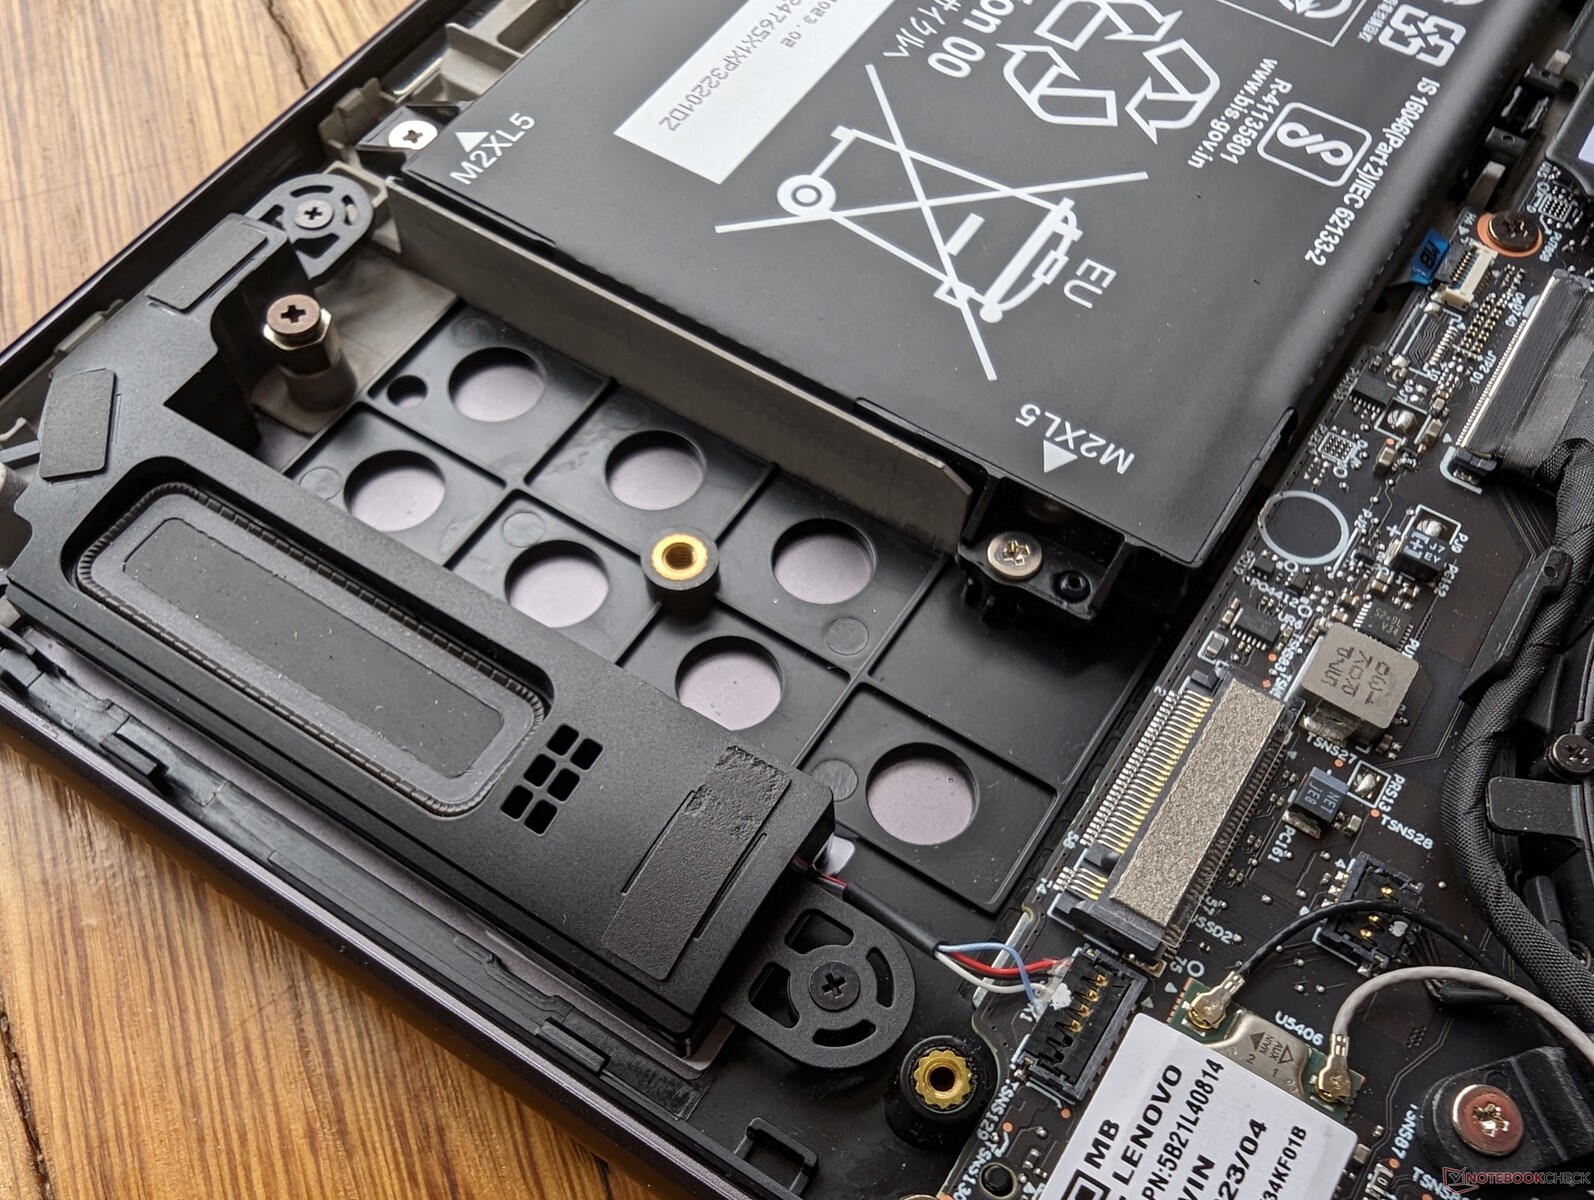
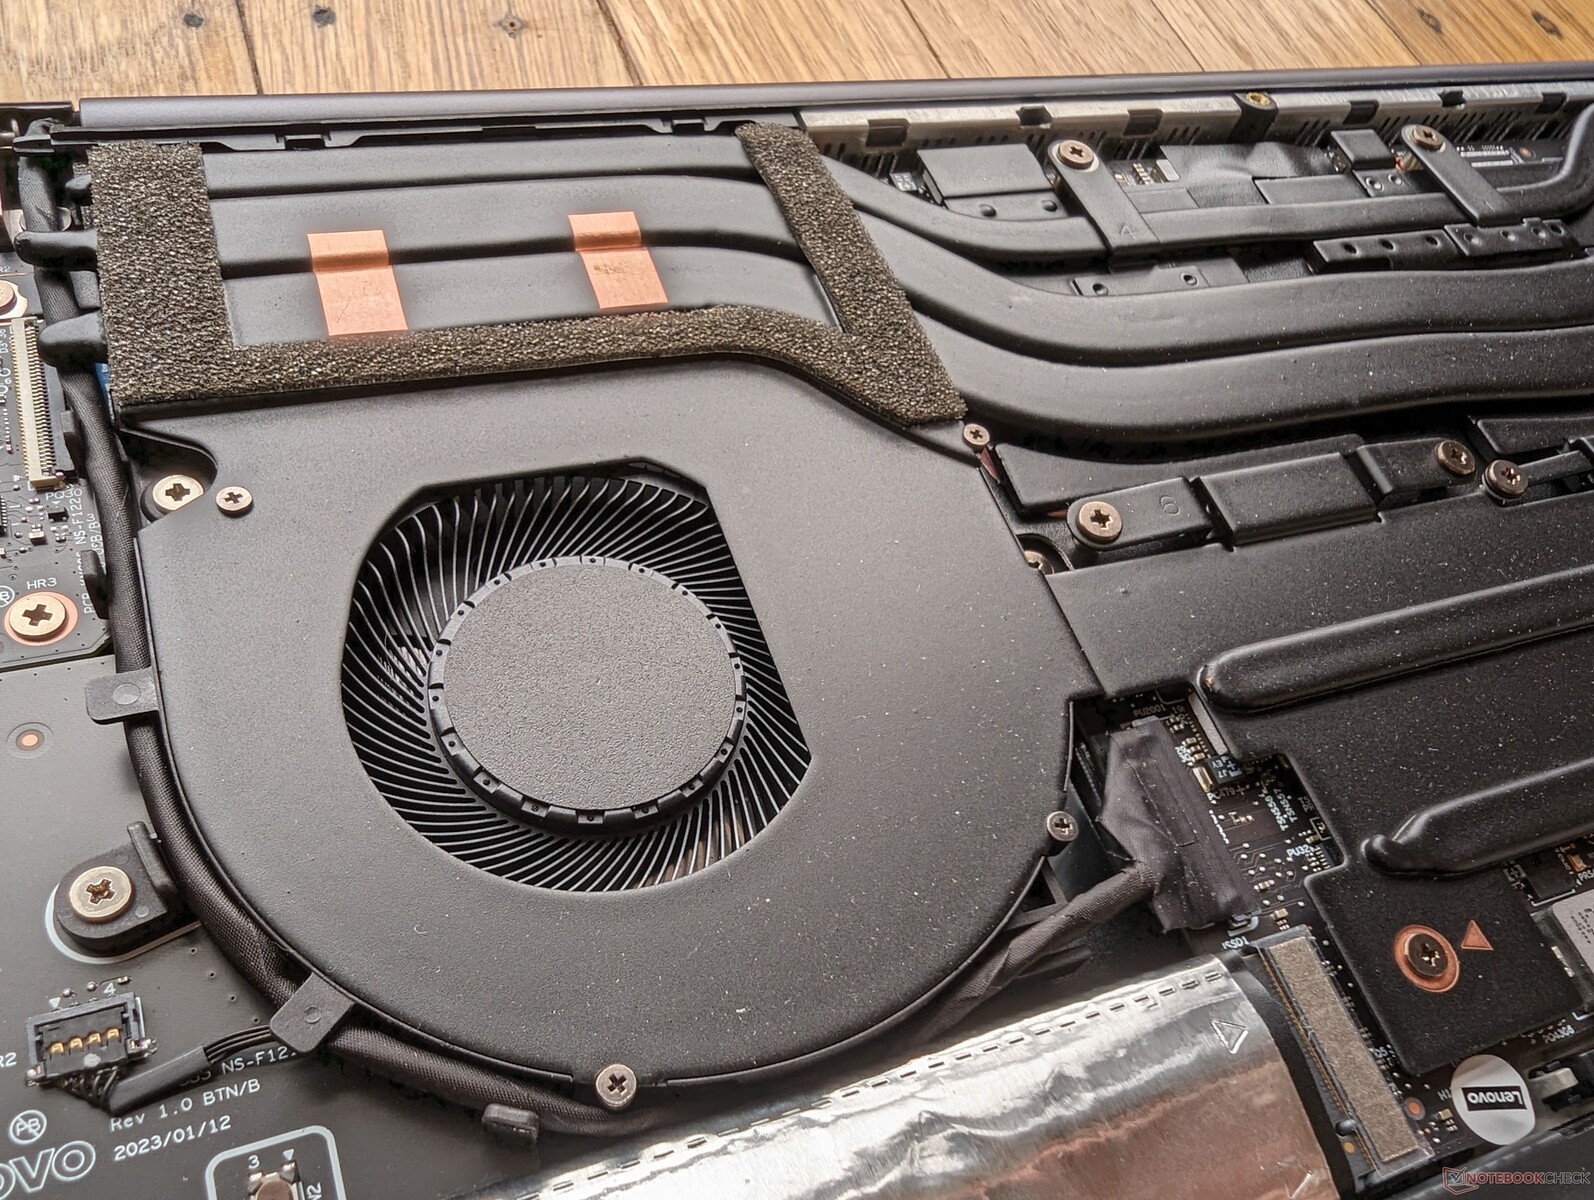
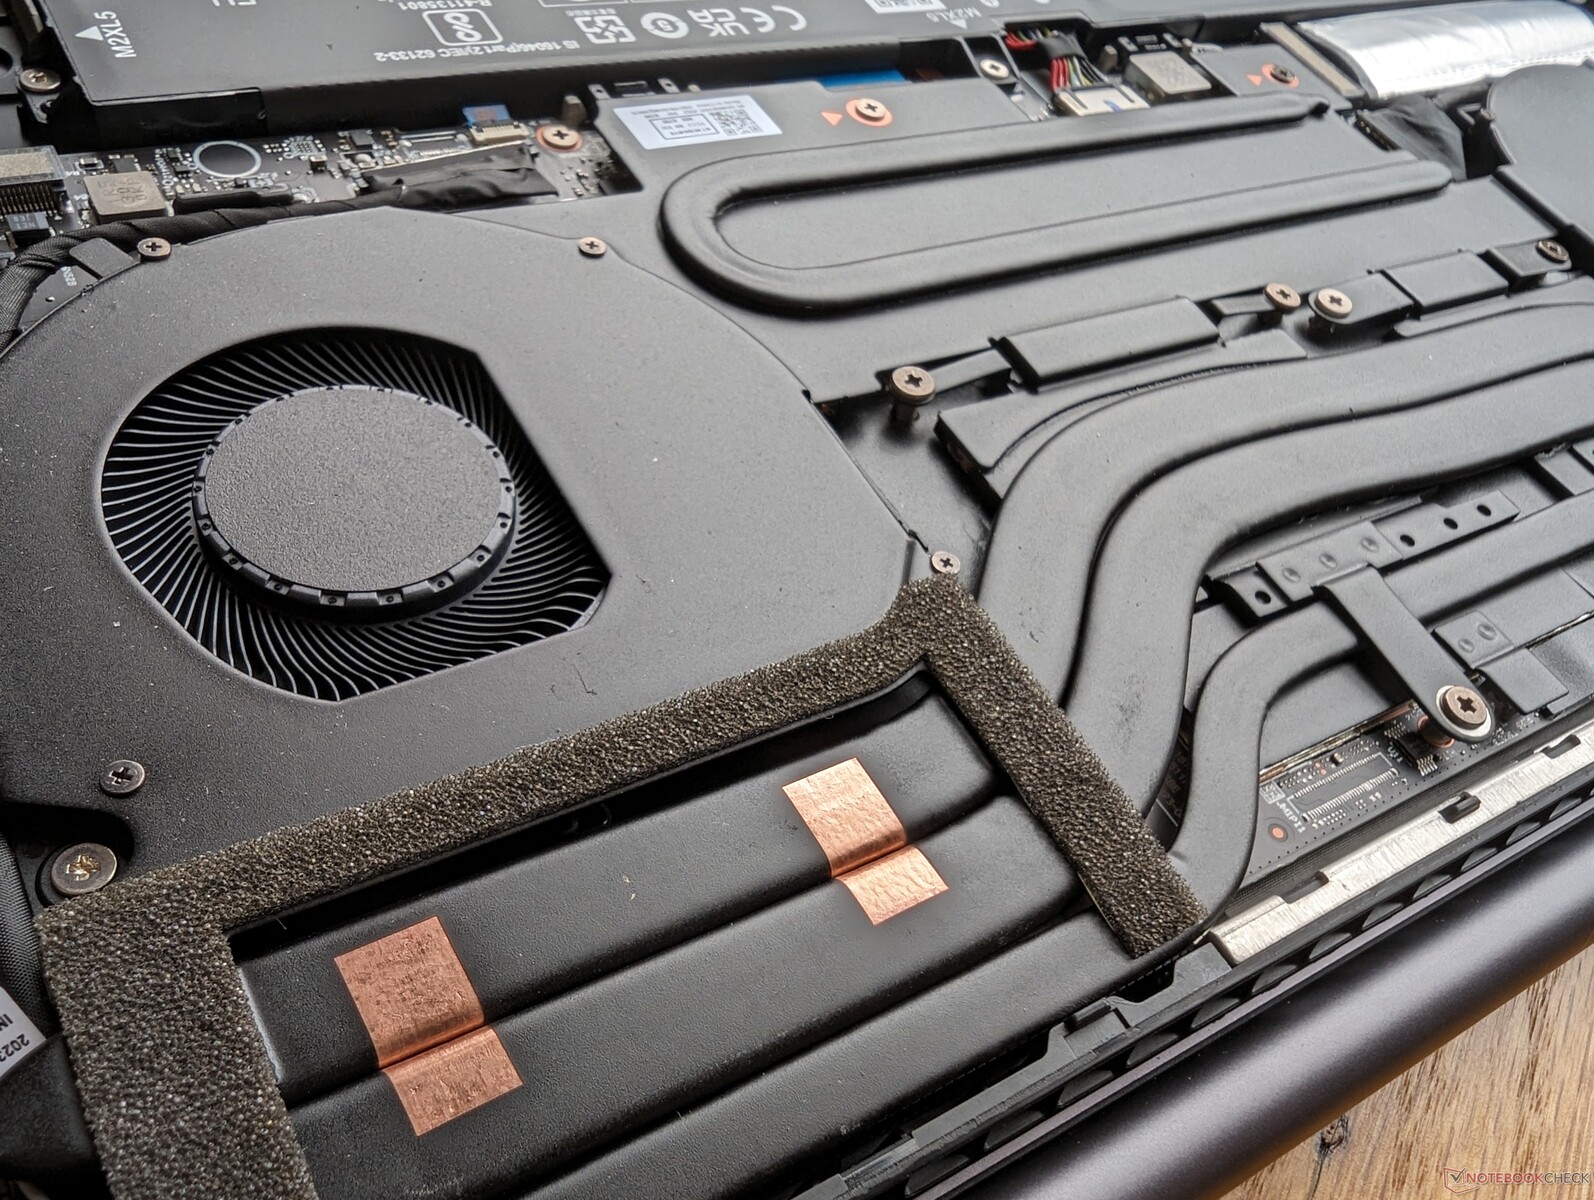
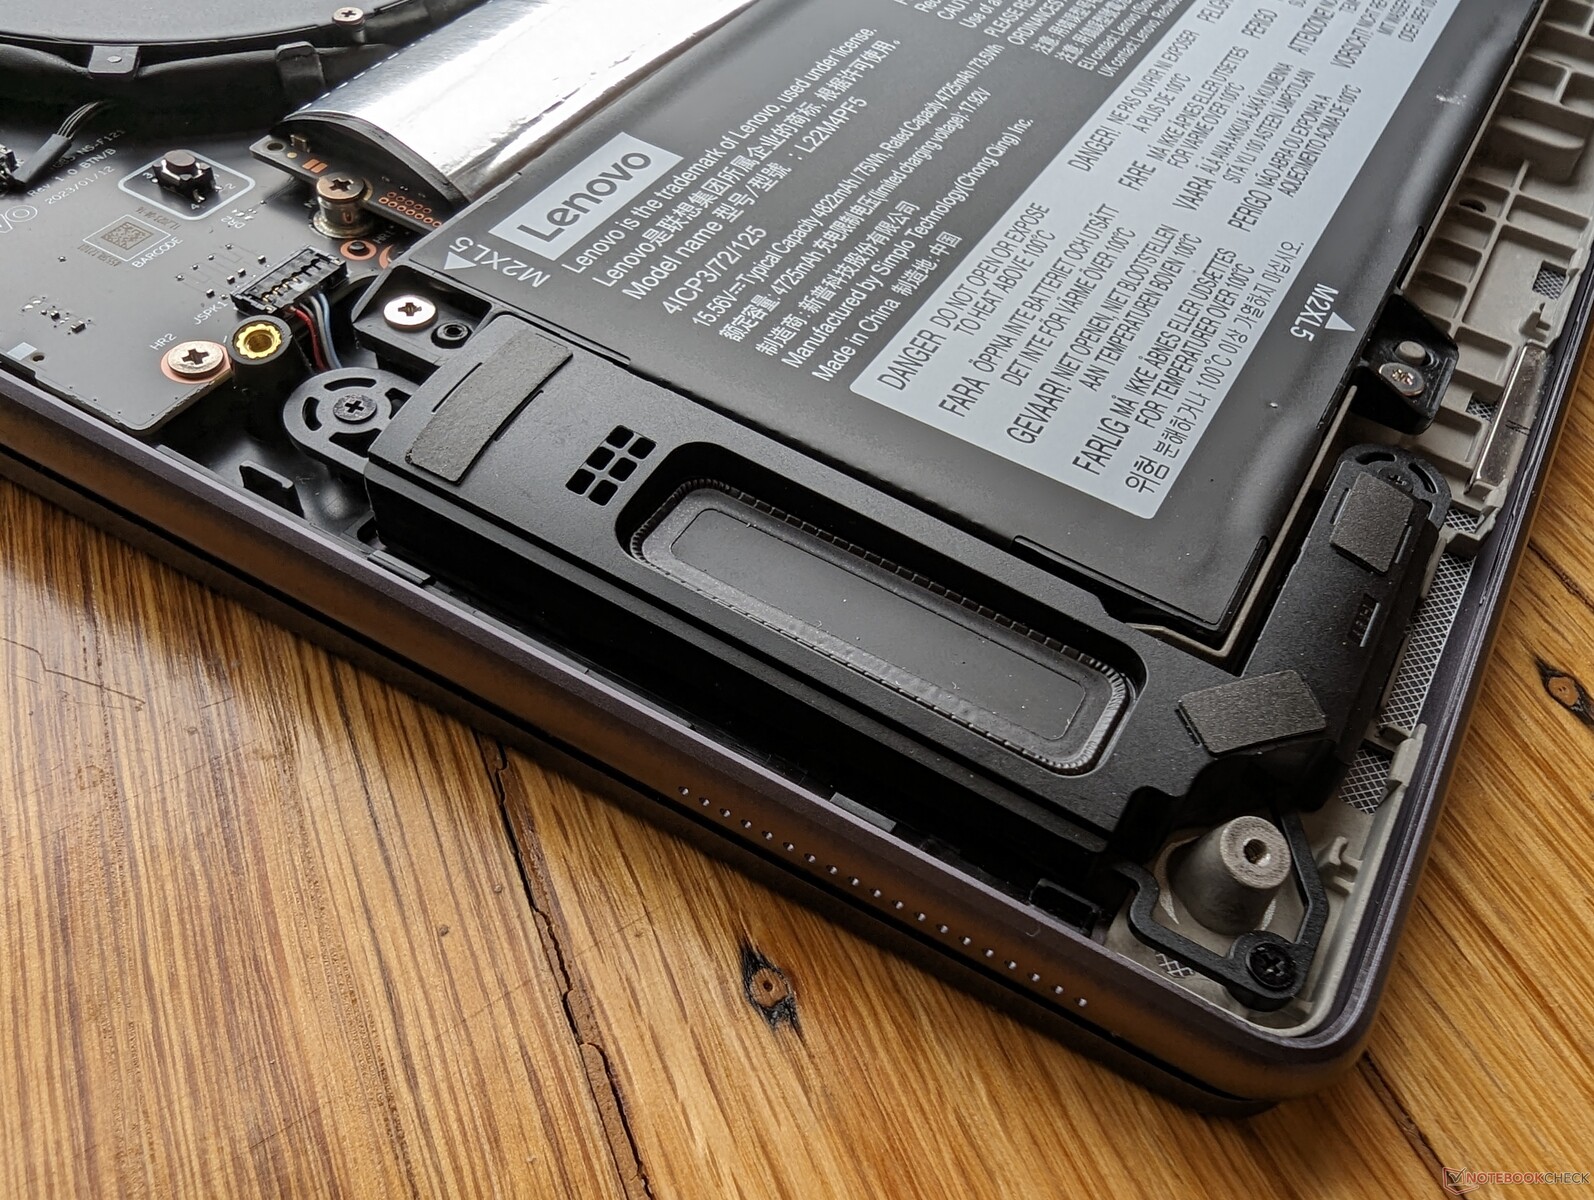
Maintenance

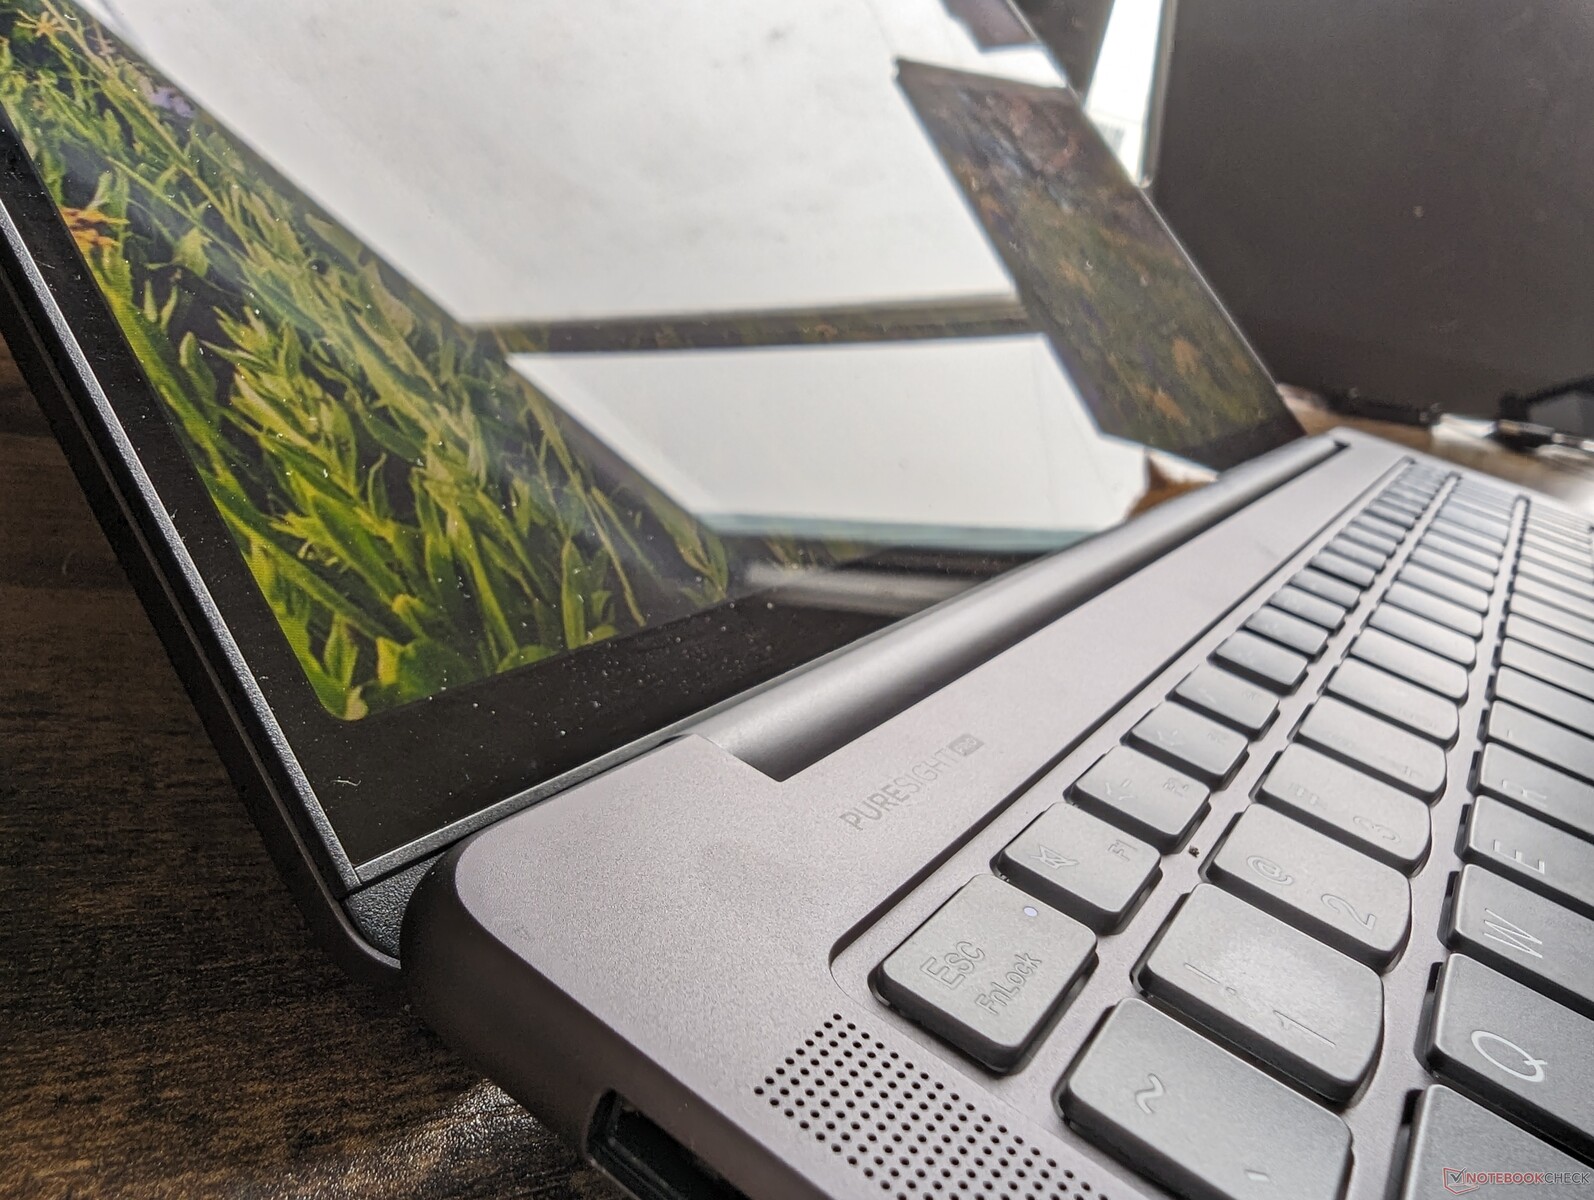
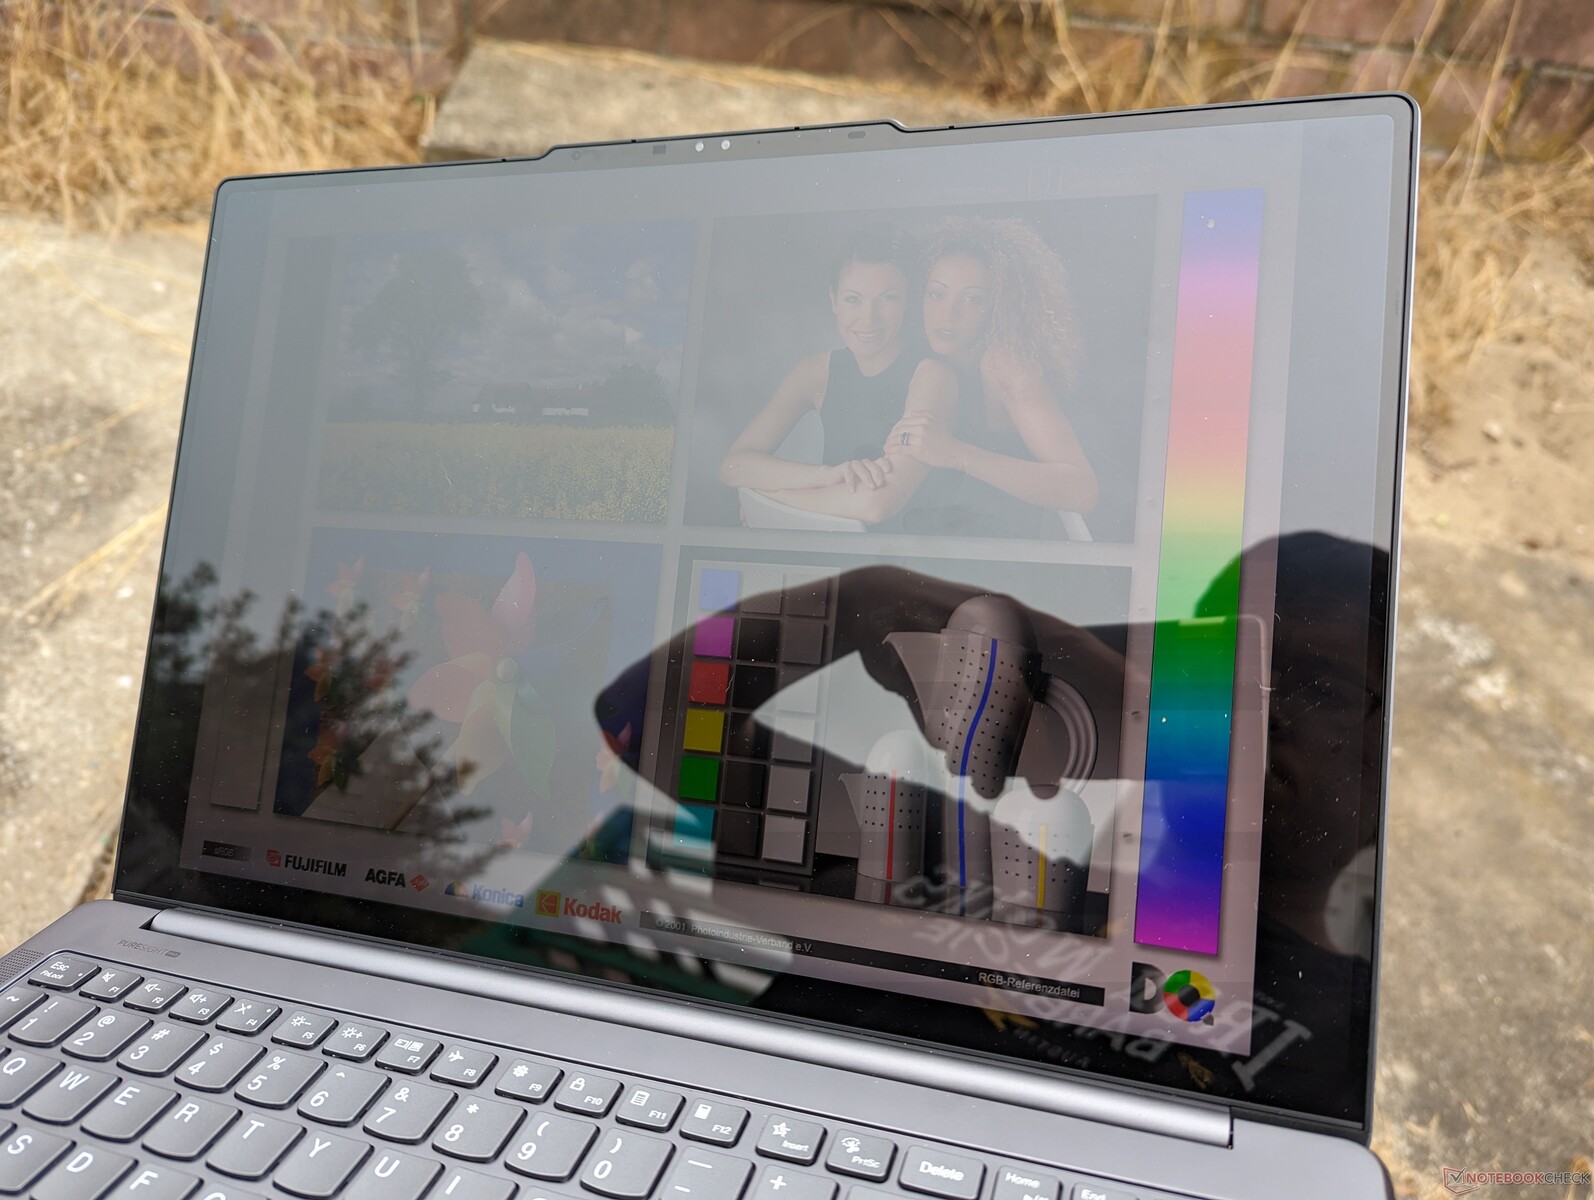
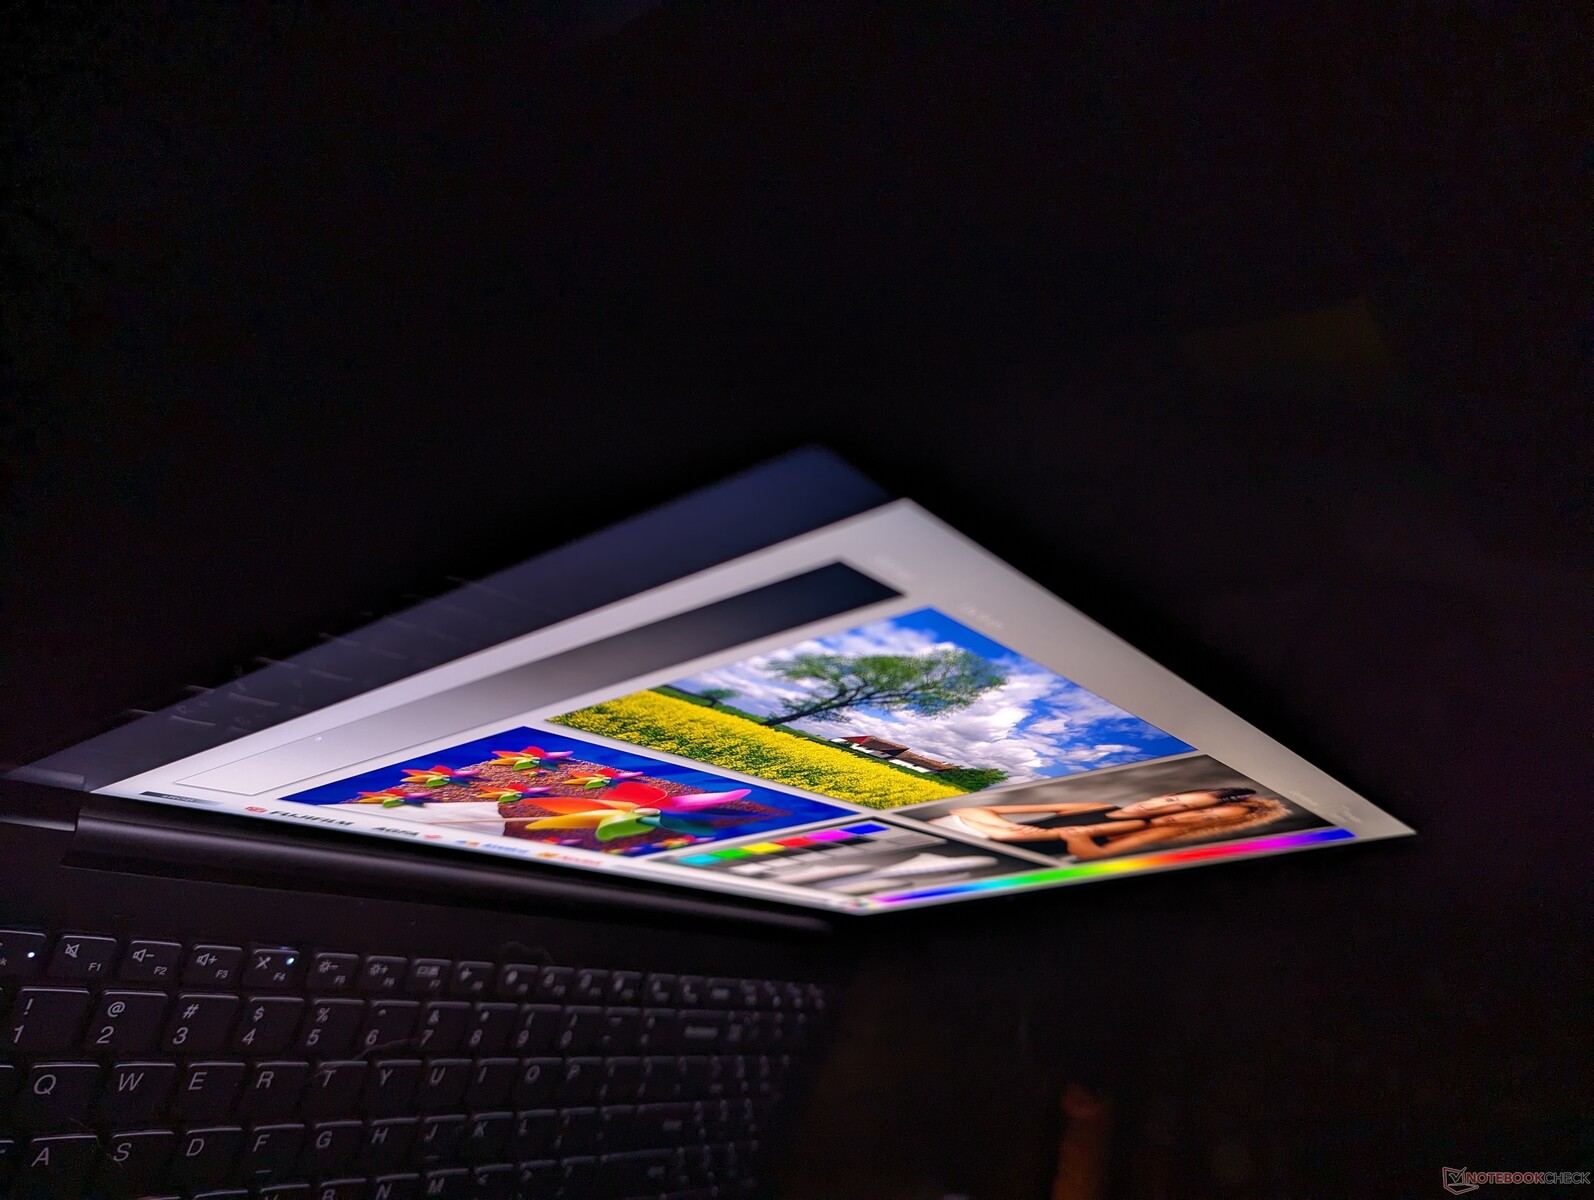
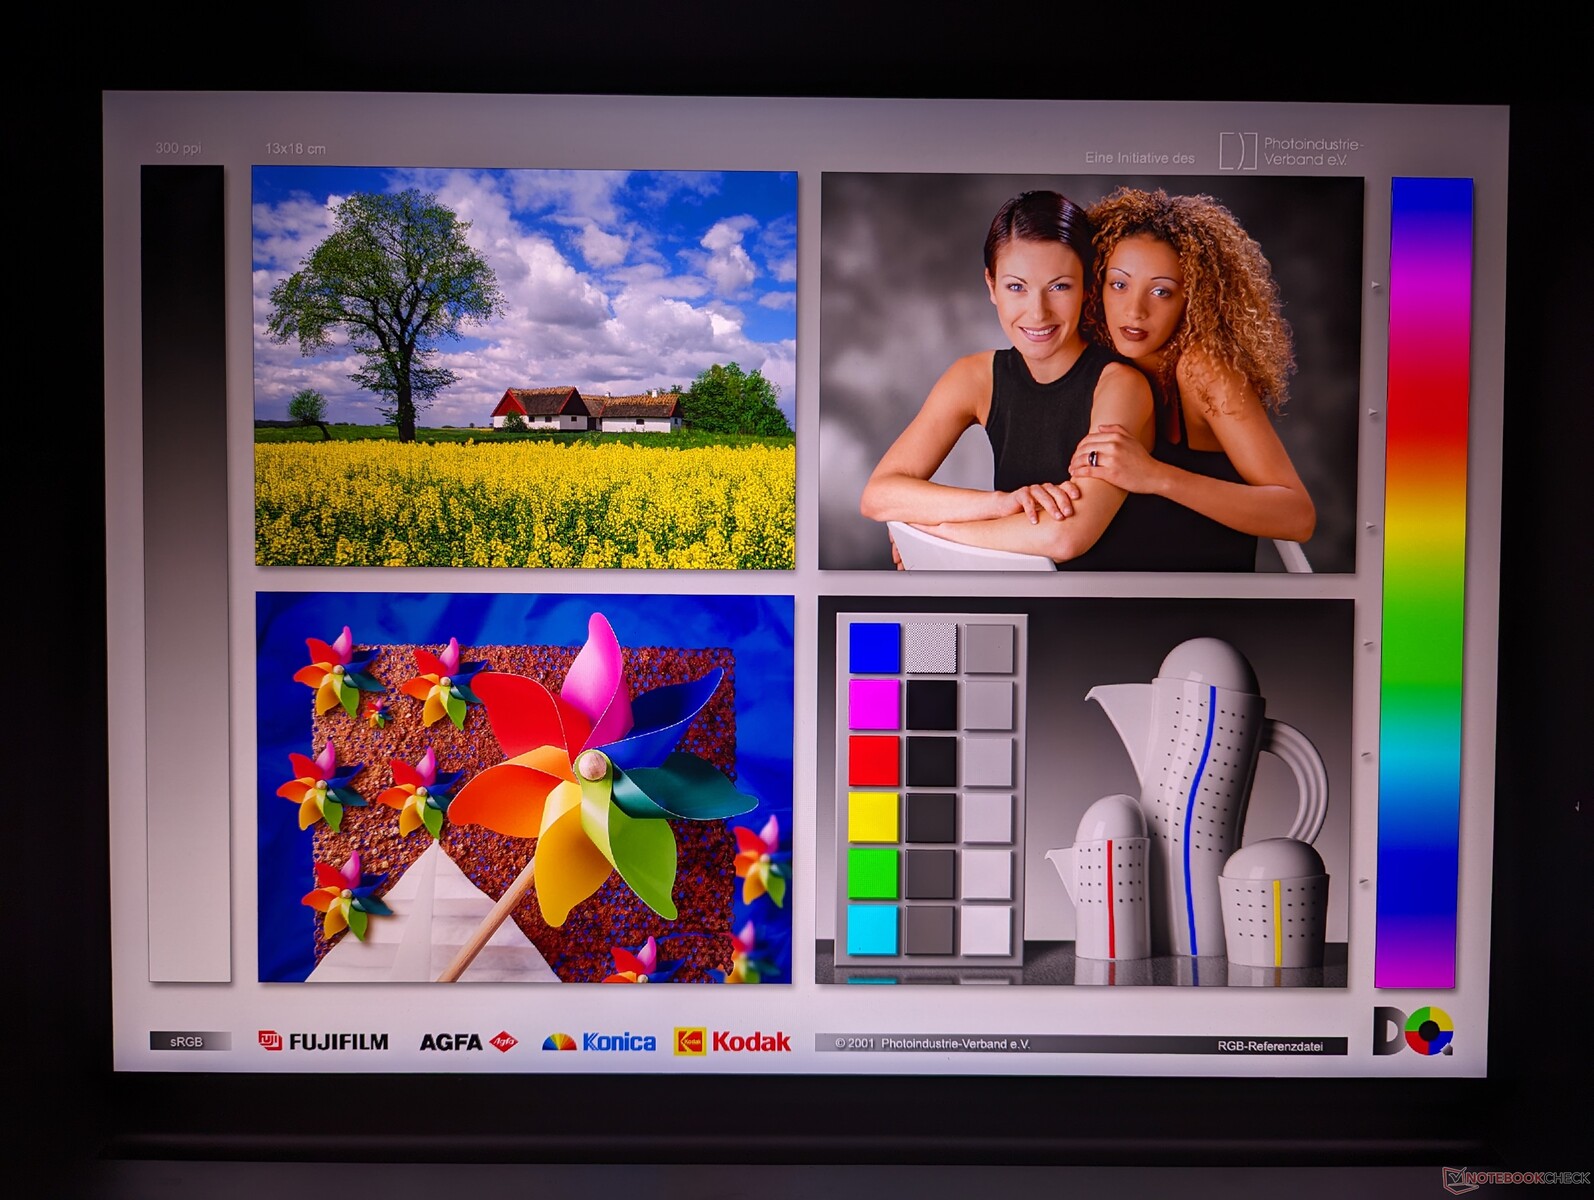
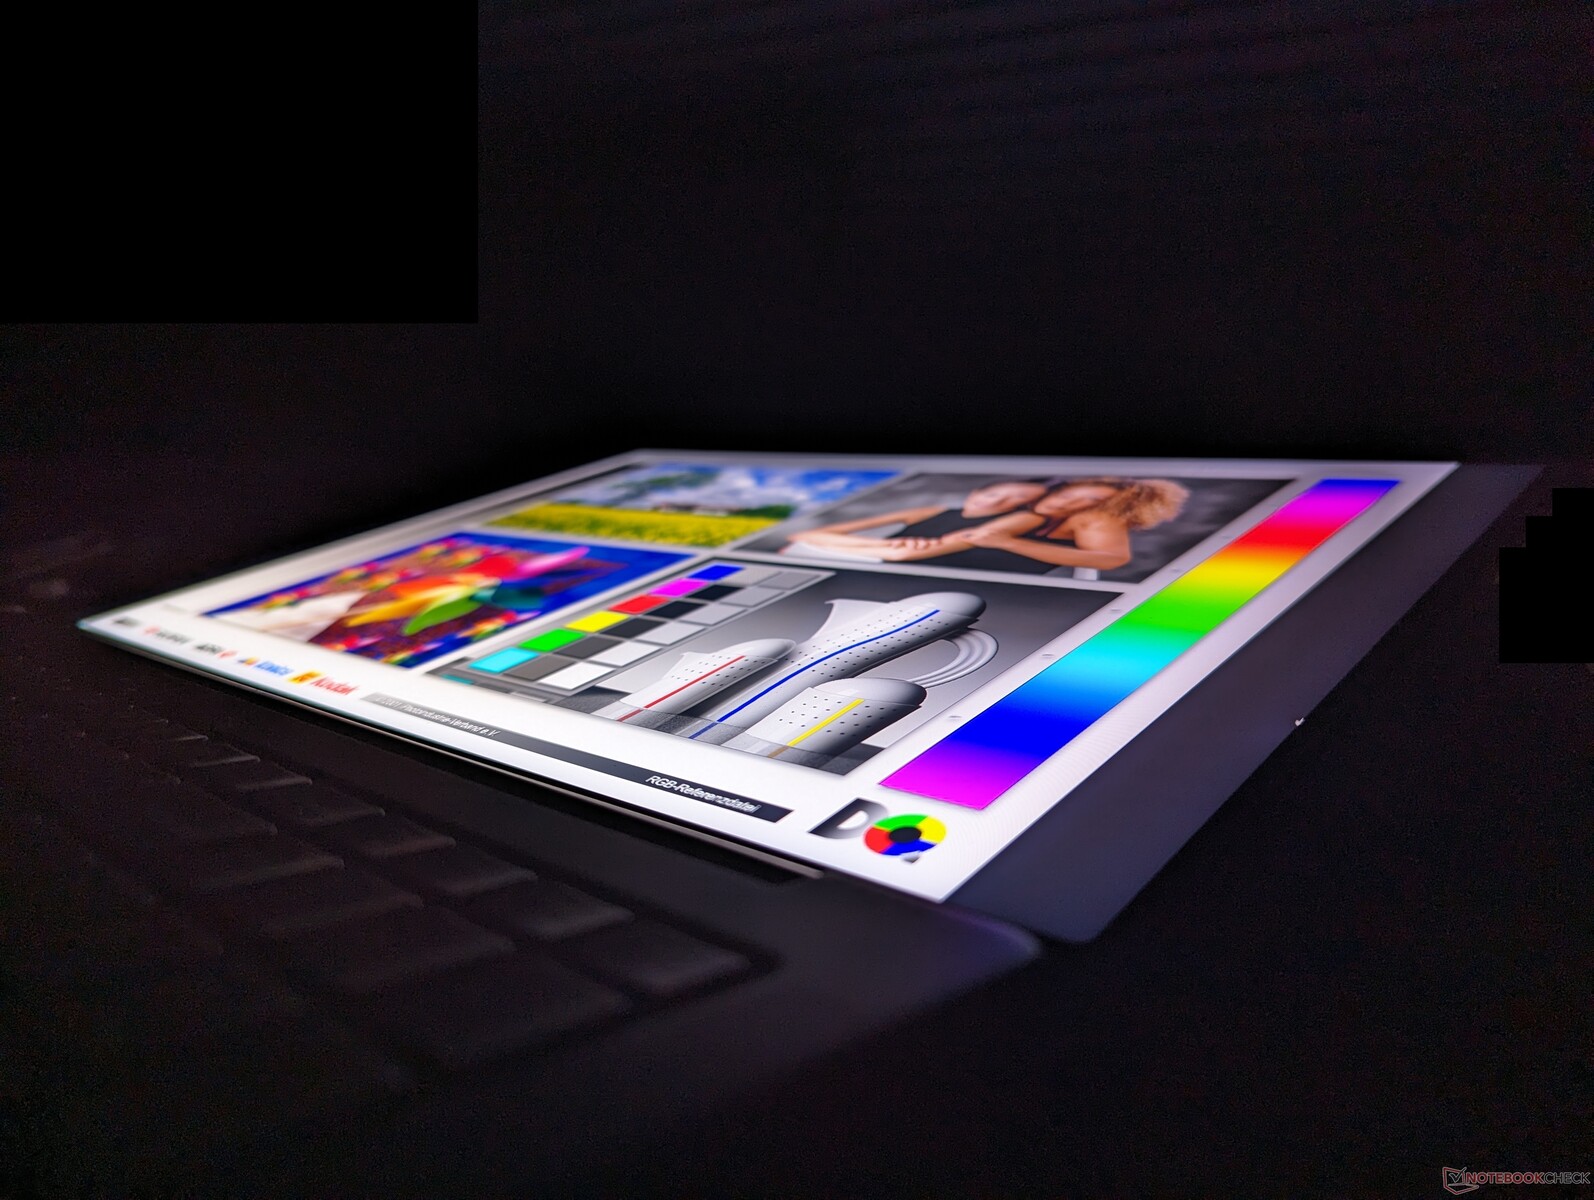
Display — 100% DCI-P3, 165 Hz, Mini-LED, Low Blue Light, 3.2K
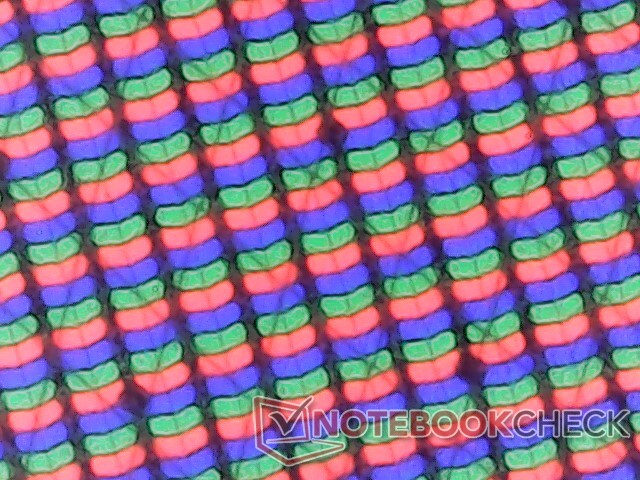
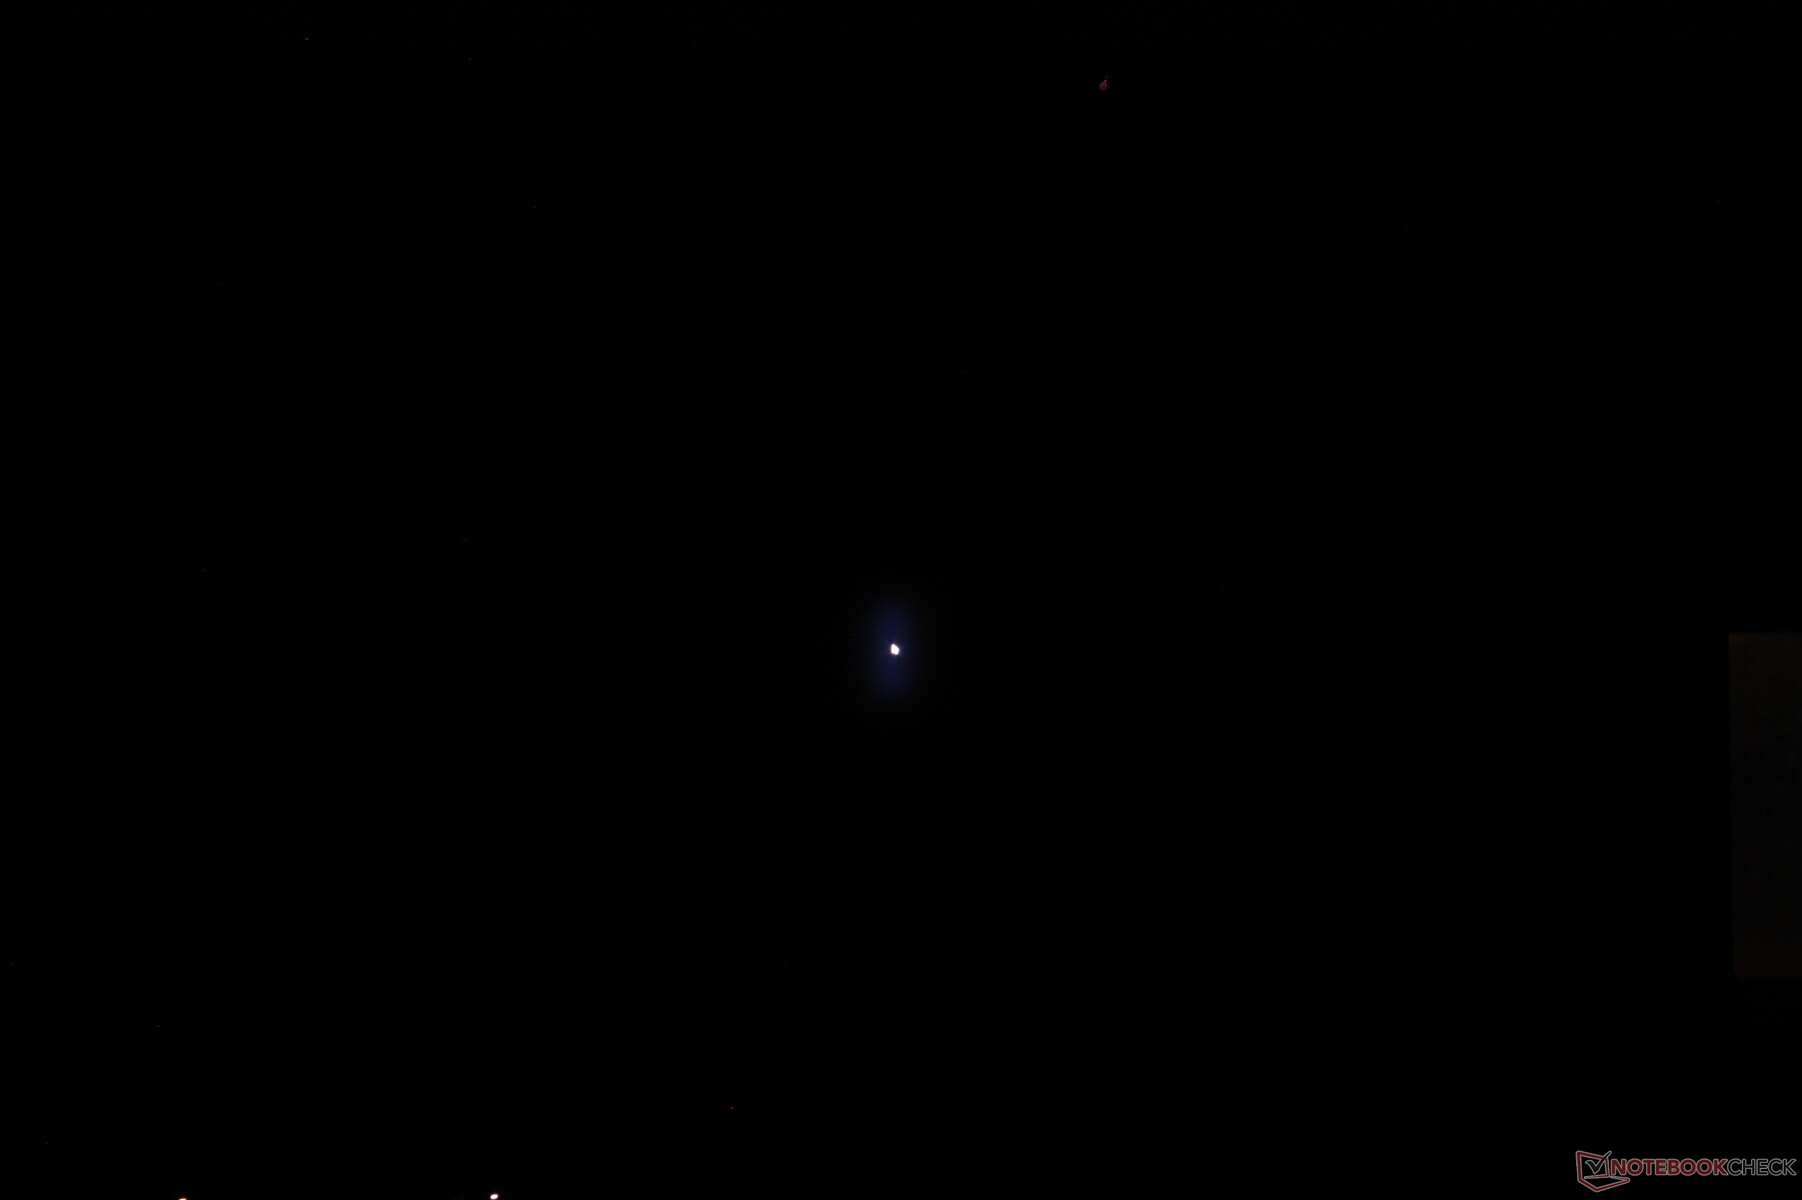
Mini-LED combines the benefits of cheaper IPS and more expensive OLED. It offers very fast native refresh rates of IPS with the higher maximum brightness of OLED via local dimming for more vibrant colors. The drawback, however, is a noticeable "halo" effect when displaying a very bright object against a very dark background. Our screenshot below, for example, shows a white mouse cursor against an all-black background. The cursor would be crisp with defined edges on an OLED panel, but it instead glows on mini-LED since local dimming is not perfect.
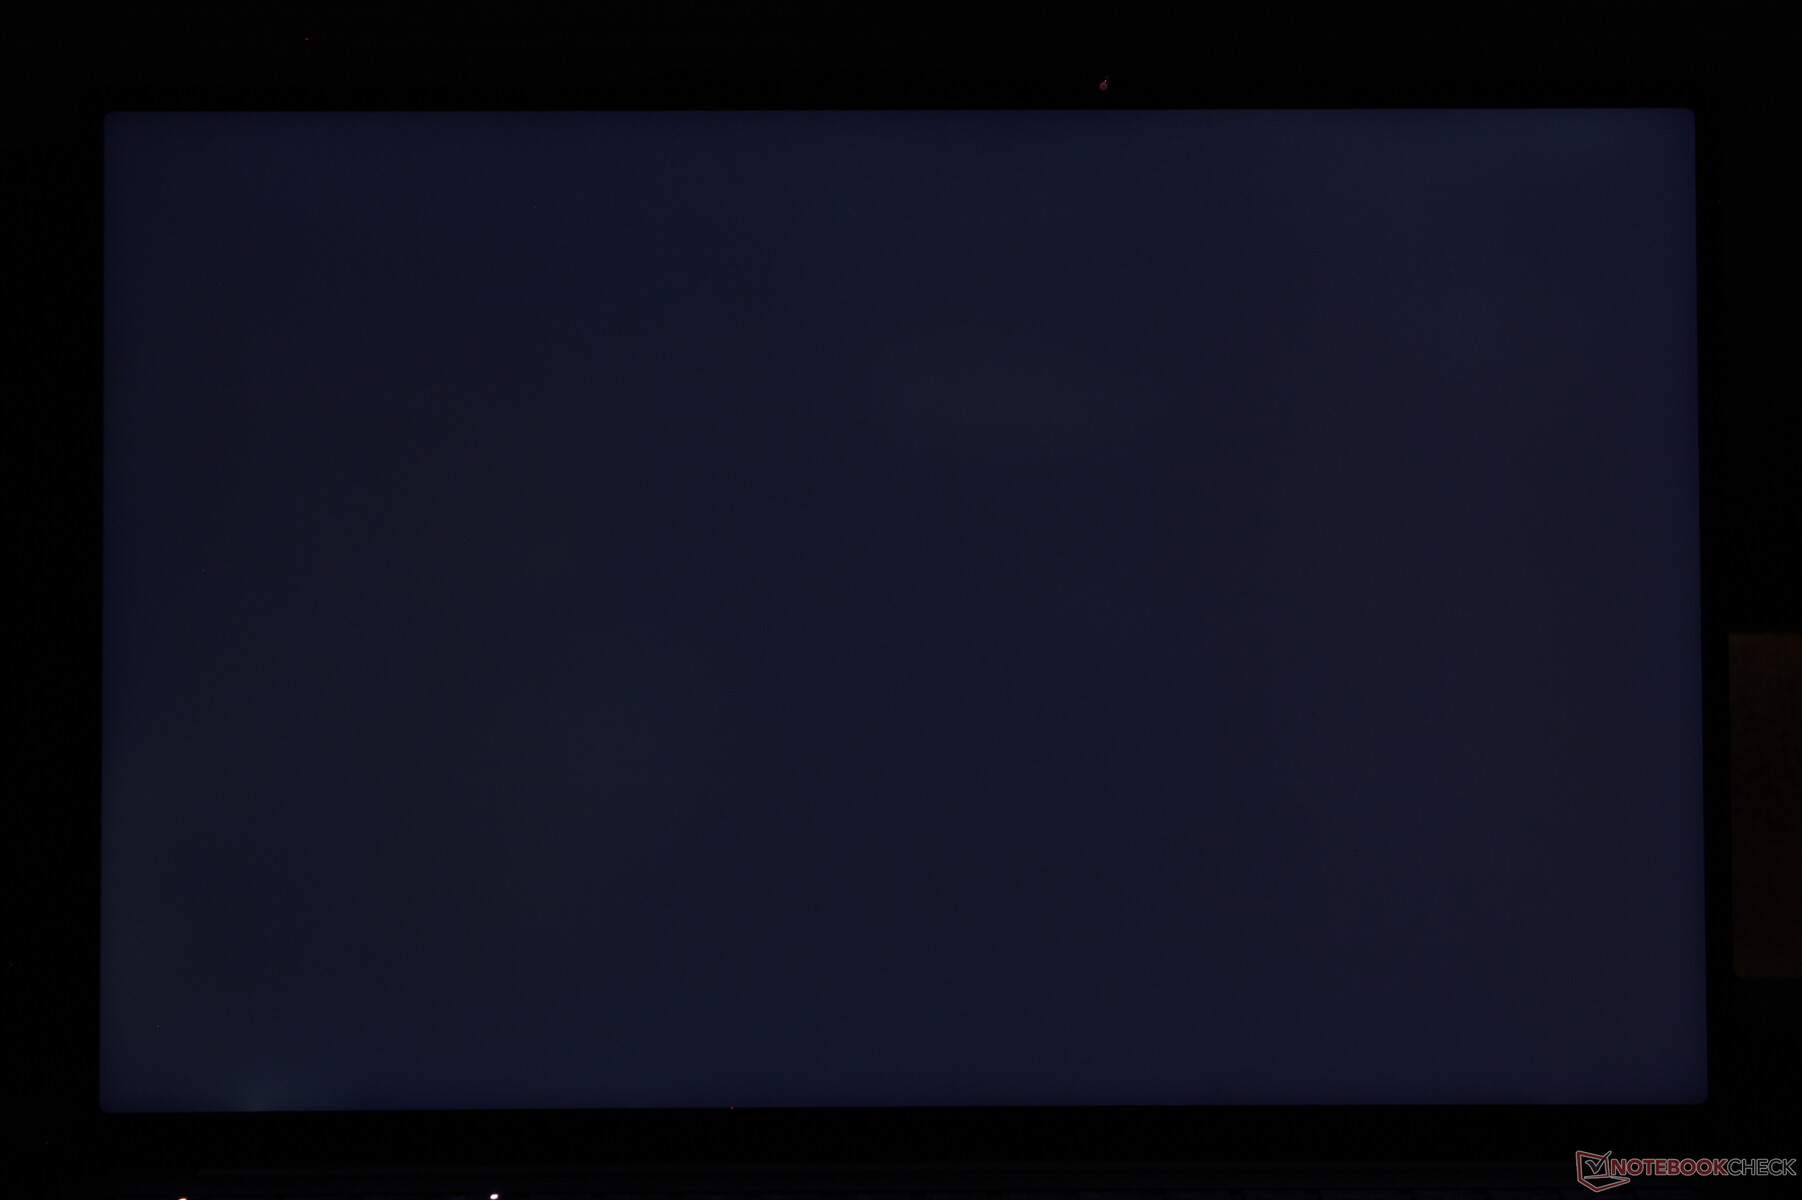
Maximum brightness is limited to about 600 nits when displaying an all-white image. When running this HDR test, however, we're able to measure a higher maximum brightness of 1330 nits which is in line with Lenovo's claim of 1200 nits.
| |||||||||||||||||||||||||
Brightness Distribution: 95 %
Center on Battery: 627.4 cd/m²
Contrast: 3302:1 (Black: 0.19 cd/m²)
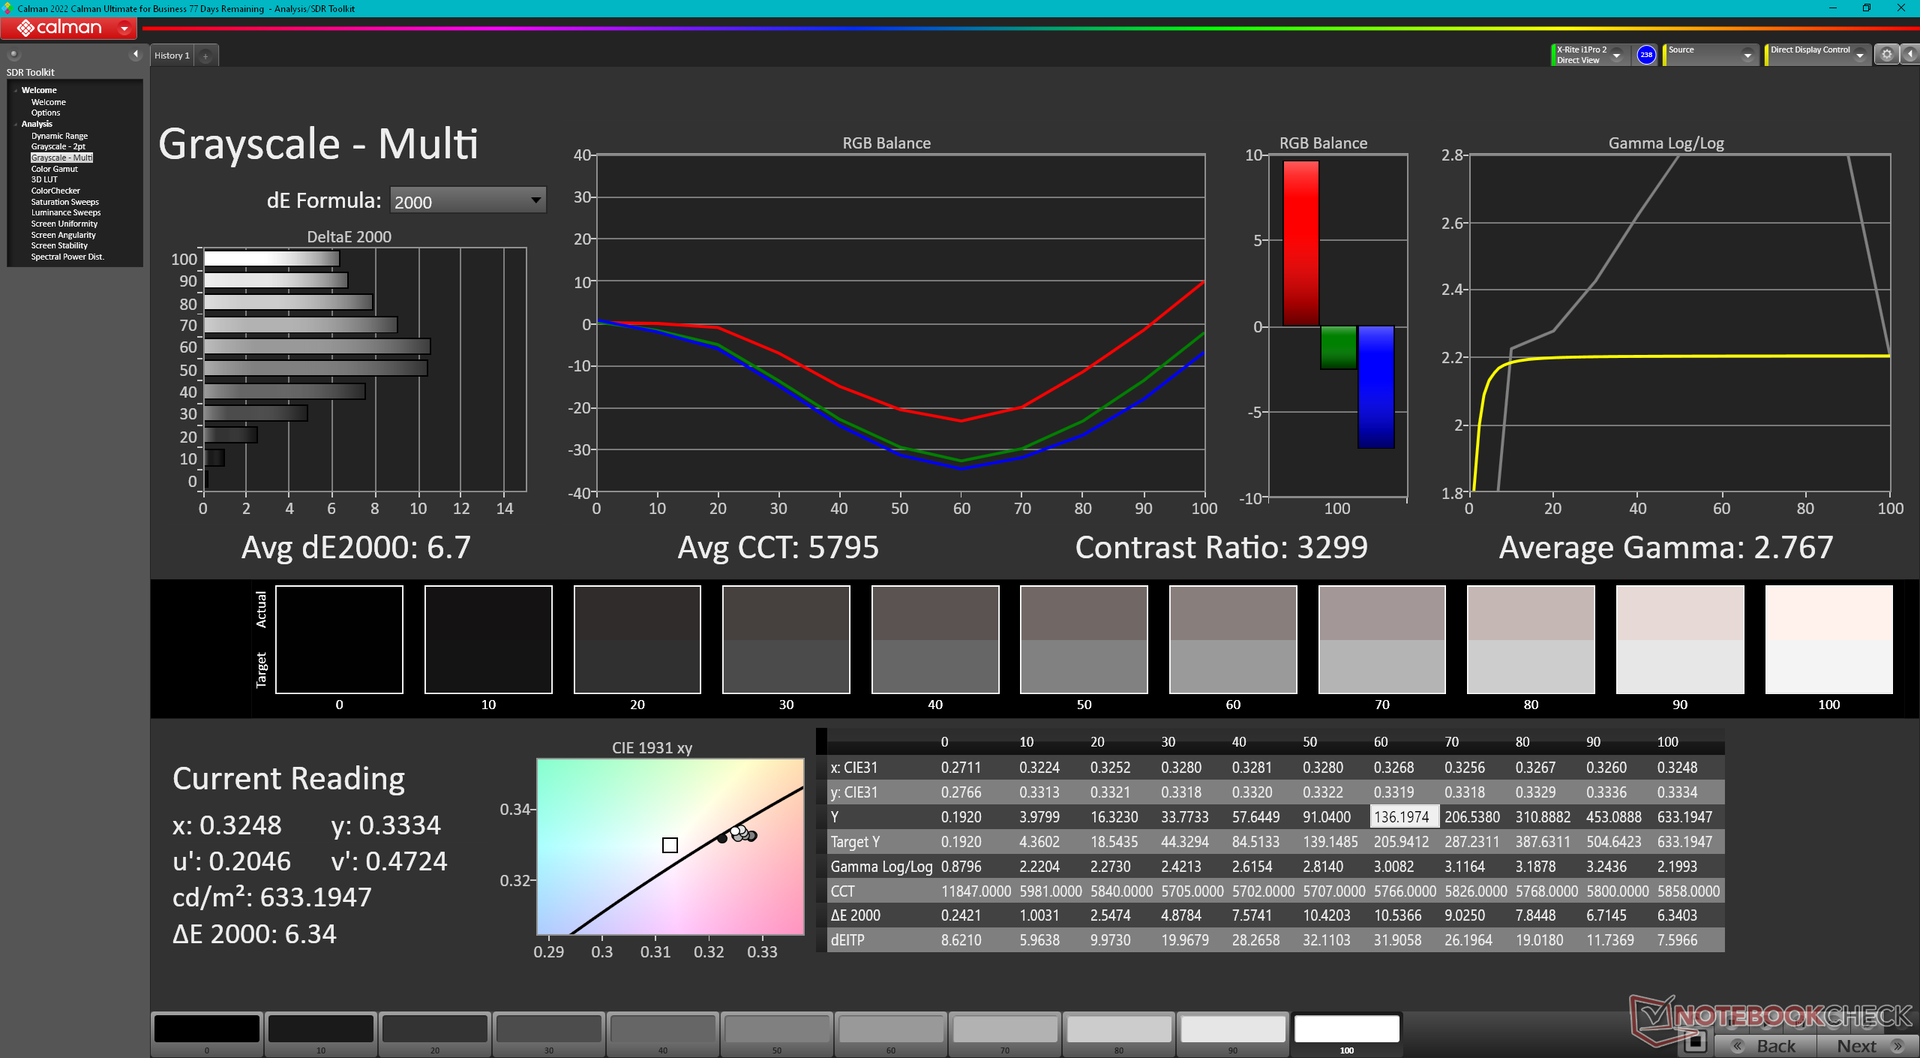
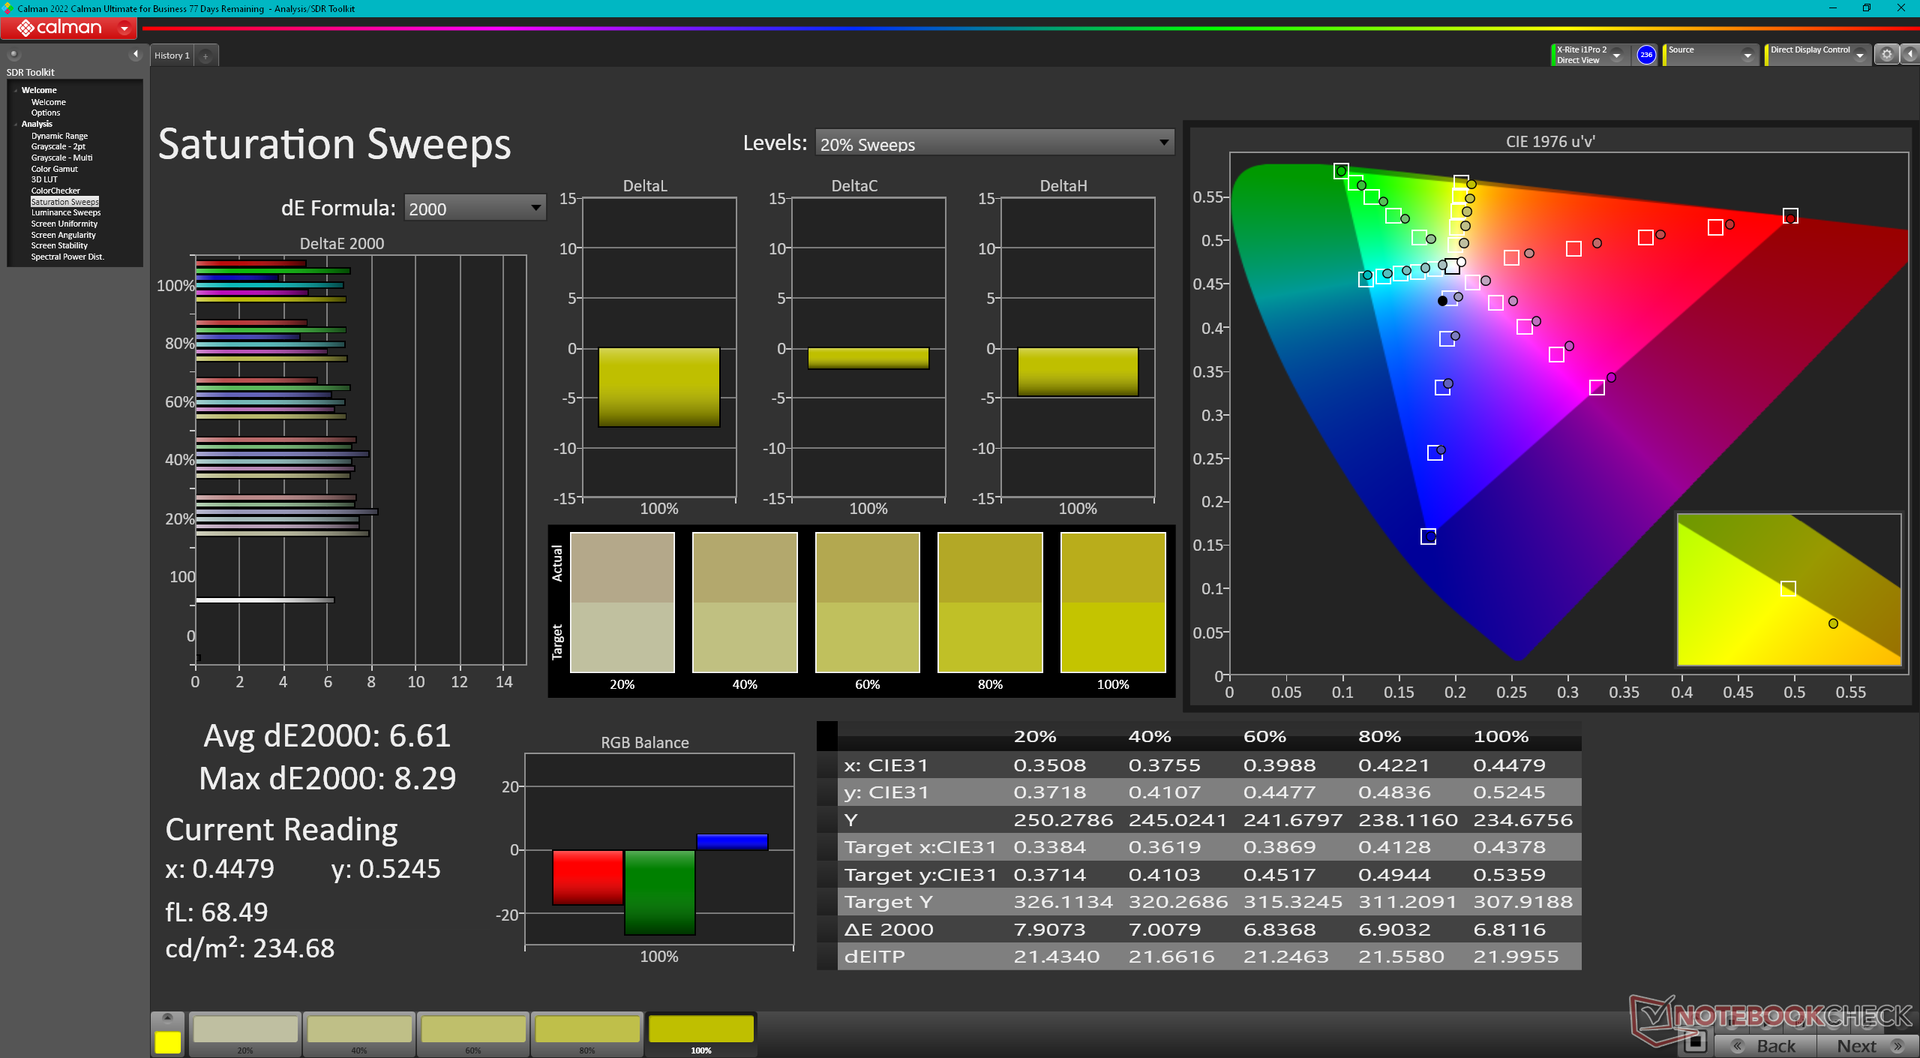
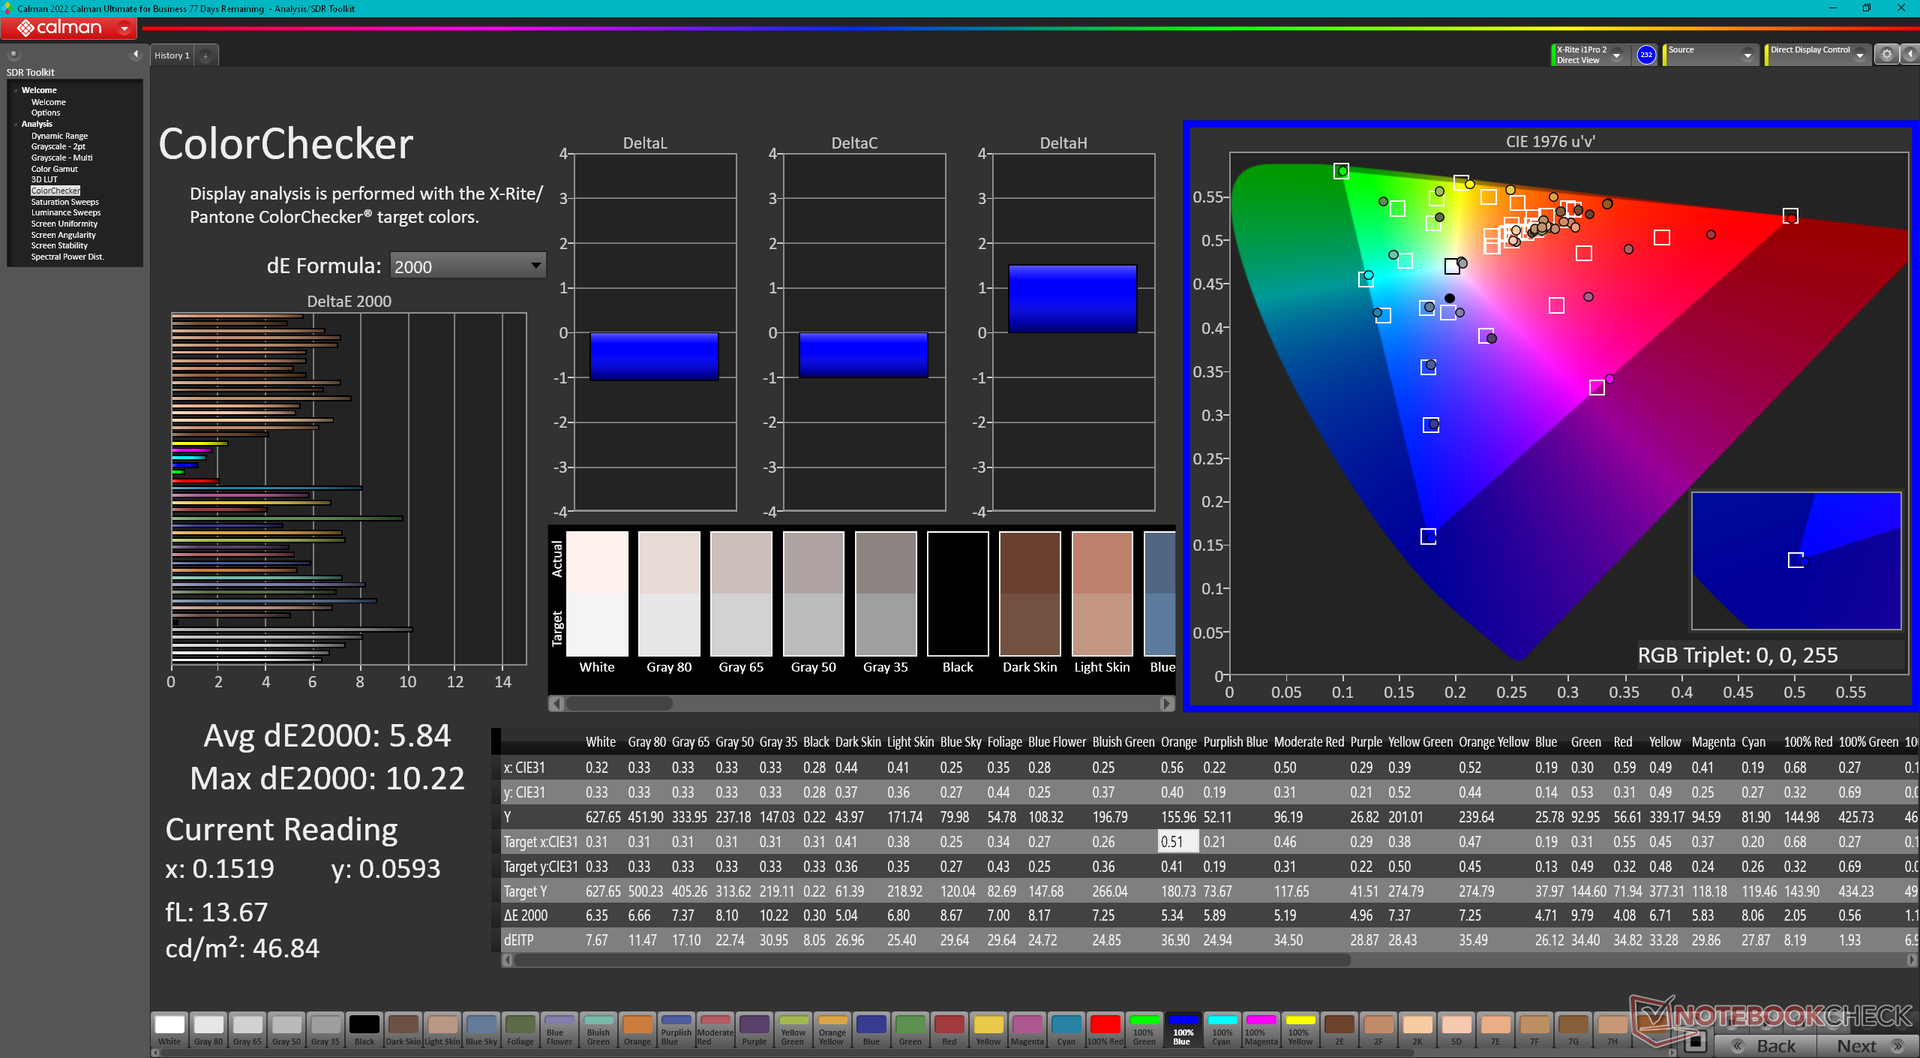
ΔE Color 5.84 | 0.5-29.43 Ø5.1, calibrated: 4.45
ΔE Greyscale 6.7 | 0.57-98 Ø5.3
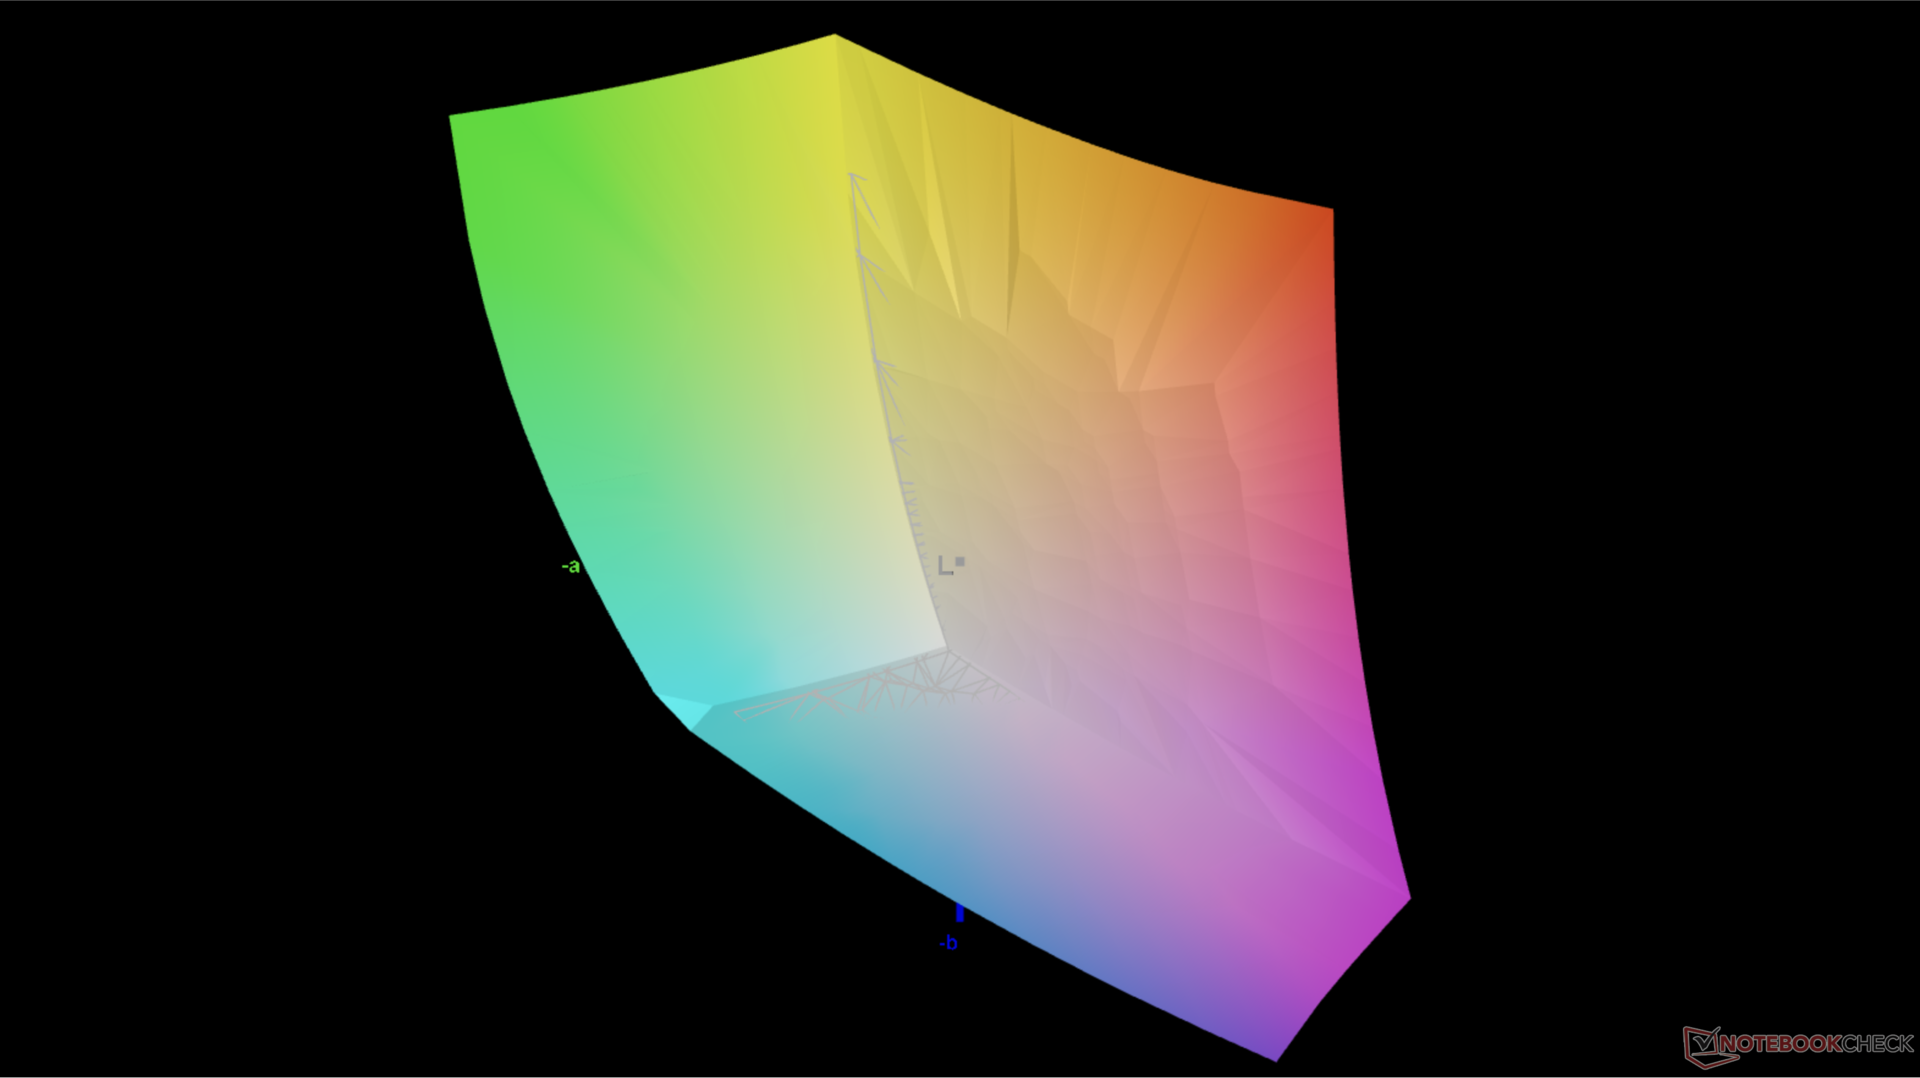
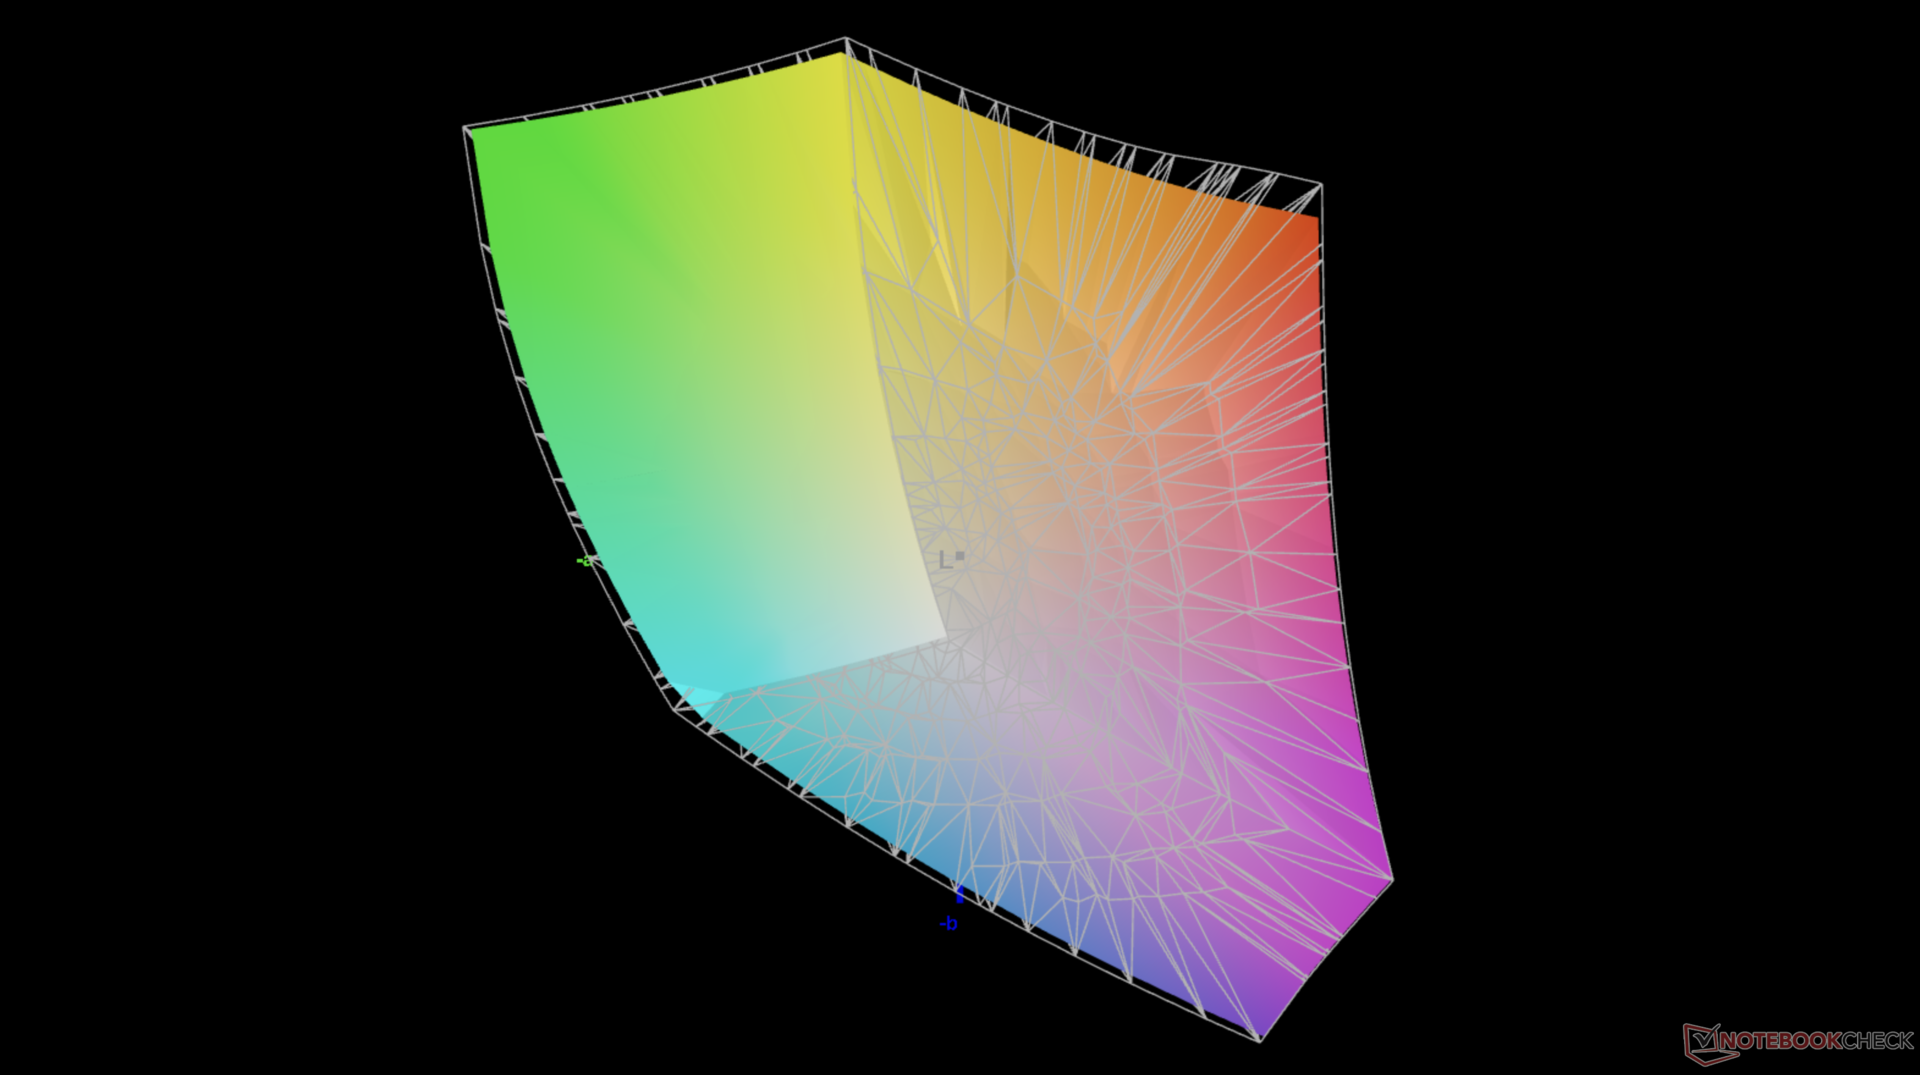
84.6% AdobeRGB 1998 (Argyll 2.2.0 3D)
99.9% sRGB (Argyll 2.2.0 3D)
95.1% Display P3 (Argyll 2.2.0 3D)
Gamma: 2.77
| Lenovo Slim Pro 9i 16IRP8 LEN160-3.2K, Mini-LED, 3200x2000, 16.00 | Lenovo Yoga Pro 9 16-IRP G8 LEN160-3.2K, Mini-LED, 3200x2000, 16.00 | Asus VivoBook Pro 16 Au Optronics B160QAN02.L, IPS, 2560x1600, 16.00 | Acer Swift Edge SFE16-42-R1GM Samsung SDC4168, OLED, 3840x2400, 16.00 | Dell Inspiron 16 Plus 7620 BOE NE16N41, IPS, 3072x1920, 16.00 | HP Envy 16 h0112nr Samsung SDC4174, OLED, 3840x2400, 16.00 | |
|---|---|---|---|---|---|---|
| Display | 5% | 2% | 7% | -13% | 3% | |
| Display P3 Coverage | 95.1 | 97 2% | 98.5 4% | 99.7 5% | 70.8 -26% | 99.3 4% |
| sRGB Coverage | 99.9 | 99.8 0% | 99.9 0% | 100 0% | 99.5 0% | 100 0% |
| AdobeRGB 1998 Coverage | 84.6 | 95.1 12% | 86.1 2% | 97.2 15% | 73.2 -13% | 88 4% |
| Response Times | 0% | 50% | 19% | -188% | 23% | |
| Response Time Grey 50% / Grey 80% * | 14 ? | 14 ? -0% | 2 ? 86% | 2 ? 86% | 38 ? -171% | 2 ? 86% |
| Response Time Black / White * | 9.2 ? | 9.2 ? -0% | 8 ? 13% | 3 ? 67% | 28 ? -204% | 1.9 ? 79% |
| PWM Frequency | 5784 ? | 5800 ? 0% | 239 ? -96% | 240.4 ? -96% | ||
| Screen | 24% | 5% | 21% | 9% | 17% | |
| Brightness middle | 627.4 | 539 -14% | 504 -20% | 369 -41% | 288.9 -54% | 328.8 -48% |
| Brightness | 618 | 546 -12% | 465 -25% | 371 -40% | 276 -55% | 332 -46% |
| Brightness Distribution | 95 | 96 1% | 87 -8% | 97 2% | 92 -3% | 97 2% |
| Black Level * | 0.19 | 0.18 5% | 0.35 -84% | 0.26 -37% | ||
| Contrast | 3302 | 2994 -9% | 1440 -56% | 1111 -66% | ||
| Colorchecker dE 2000 * | 5.84 | 1.4 76% | 1.83 69% | 2.3 61% | 1.88 68% | 1.53 74% |
| Colorchecker dE 2000 max. * | 10.22 | 2.1 79% | 5.51 46% | 4.37 57% | 4.37 57% | 6.04 41% |
| Colorchecker dE 2000 calibrated * | 4.45 | 1.34 70% | 2.87 36% | 0.42 91% | ||
| Greyscale dE 2000 * | 6.7 | 2.2 67% | 3.02 55% | 1.83 73% | 1.4 79% | 1.3 81% |
| Gamma | 2.77 79% | 2.19 100% | 2.39 92% | 2.39 92% | 2.3 96% | 2.18 101% |
| CCT | 5795 112% | 6479 100% | 6688 97% | 6392 102% | 6634 98% | 6362 102% |
| Total Average (Program / Settings) | 10% /
15% | 19% /
11% | 16% /
17% | -64% /
-24% | 14% /
15% |
* ... smaller is better
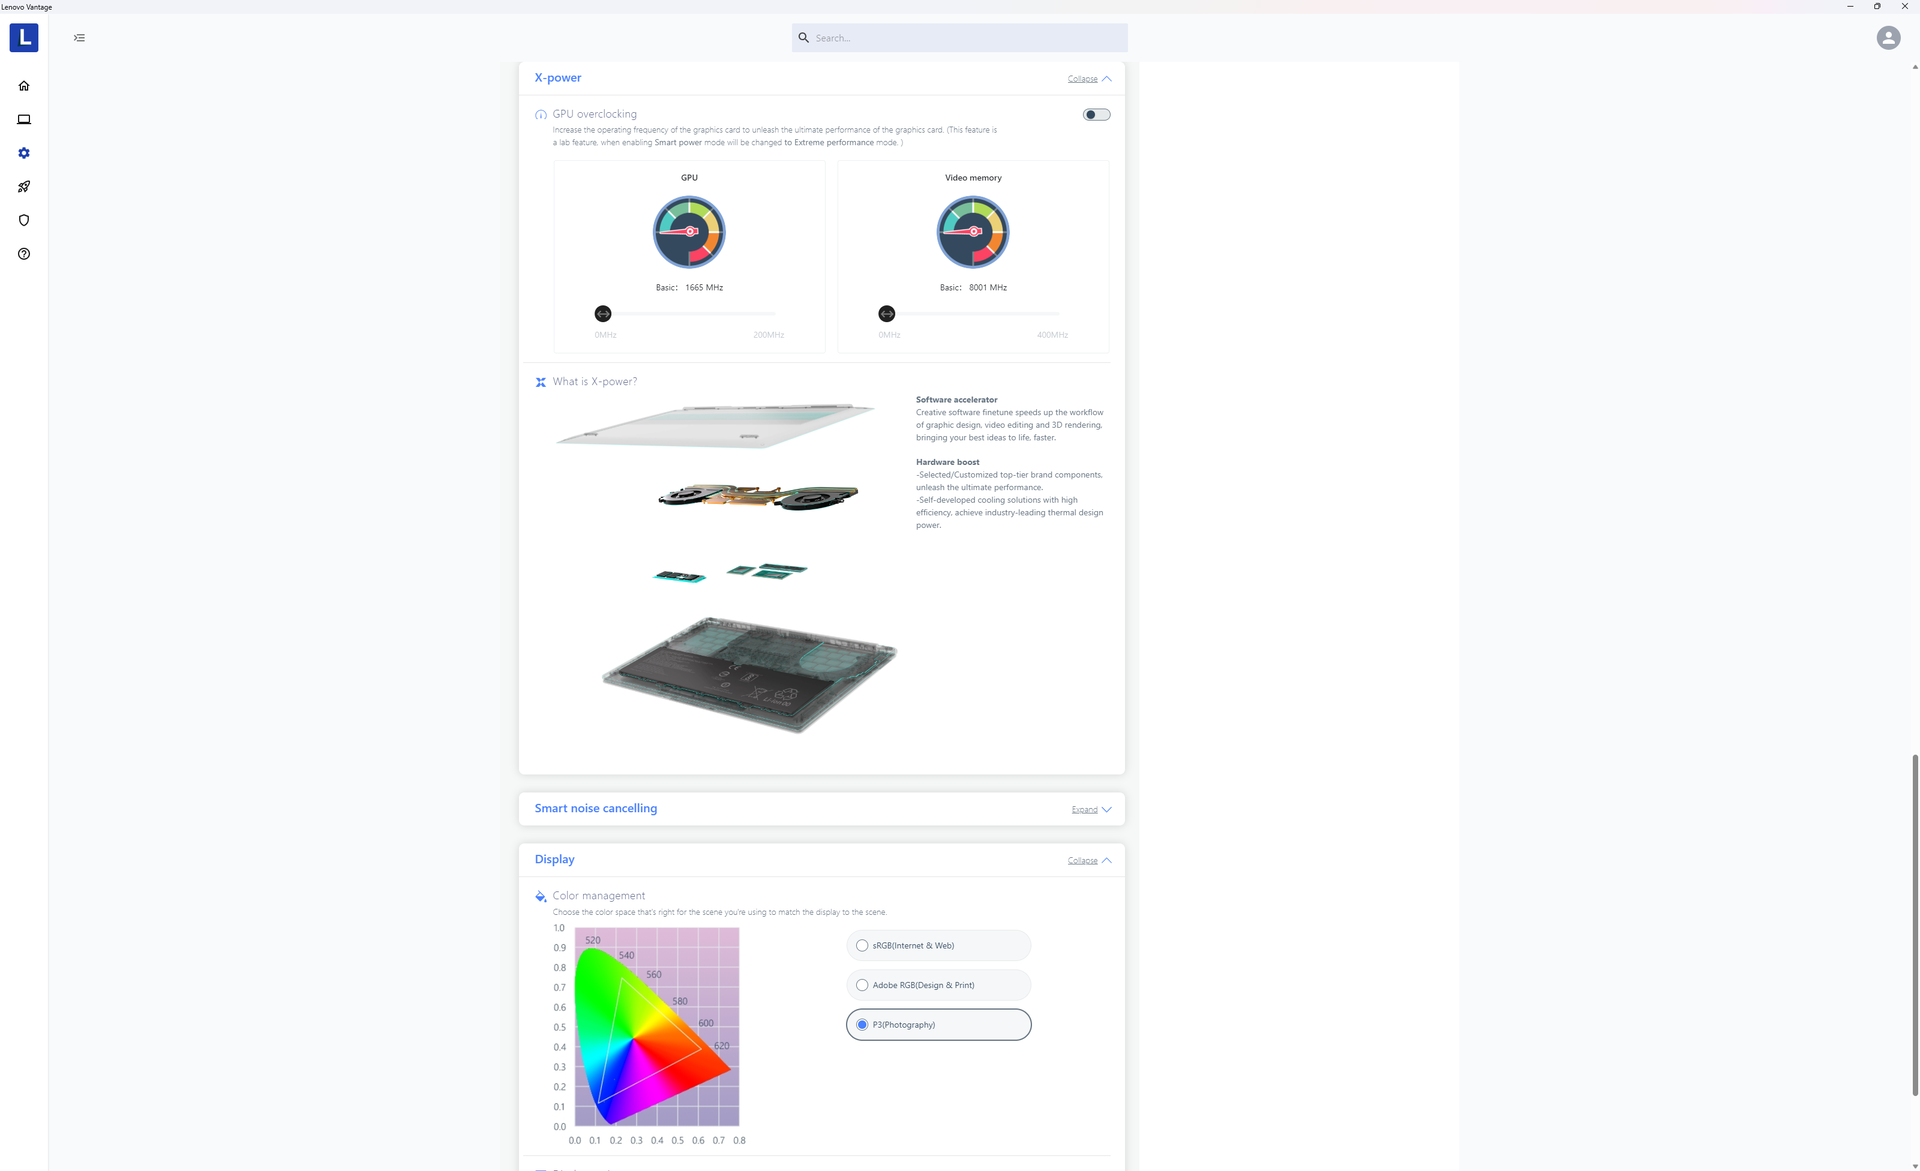
Color temperature is warmer than expected when set to P3 mode. Unlike on many MSI models, the Lenovo Vantage software does not have a slider for adjusting color temperature.
Display Response Times
| ↔ Response Time Black to White | ||
|---|---|---|
| 9.2 ms ... rise ↗ and fall ↘ combined | ↗ 2.2 ms rise | 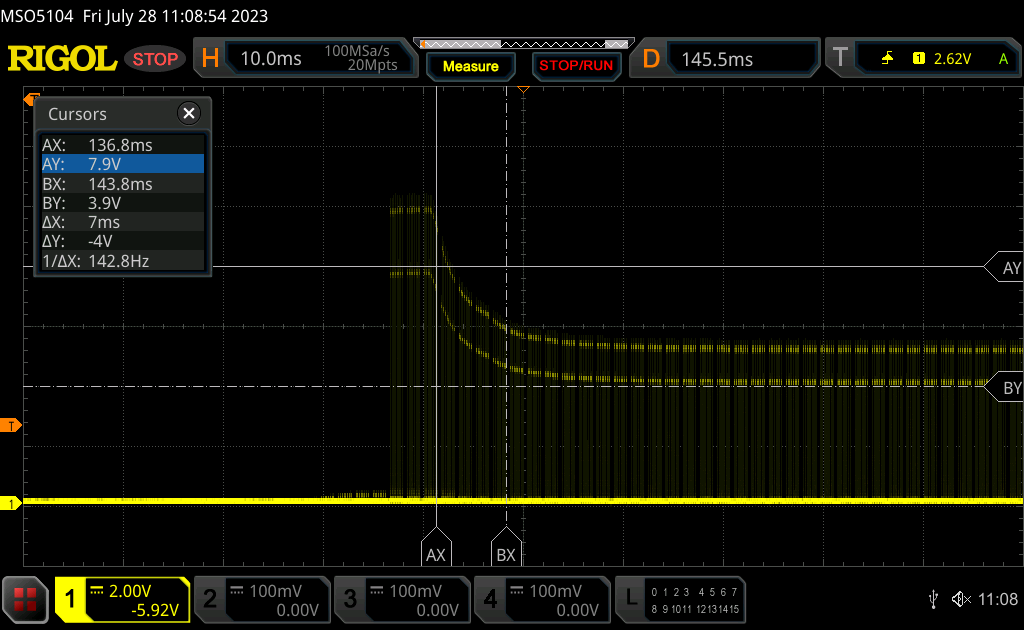 |
| ↘ 7 ms fall | ||
| The screen shows fast response rates in our tests and should be suited for gaming. In comparison, all tested devices range from 0.1 (minimum) to 240 (maximum) ms. » 19 % of all devices are better. This means that the measured response time is better than the average of all tested devices (21.8 ms). | ||
| ↔ Response Time 50% Grey to 80% Grey | ||
| 14 ms ... rise ↗ and fall ↘ combined | ↗ 7.4 ms rise | 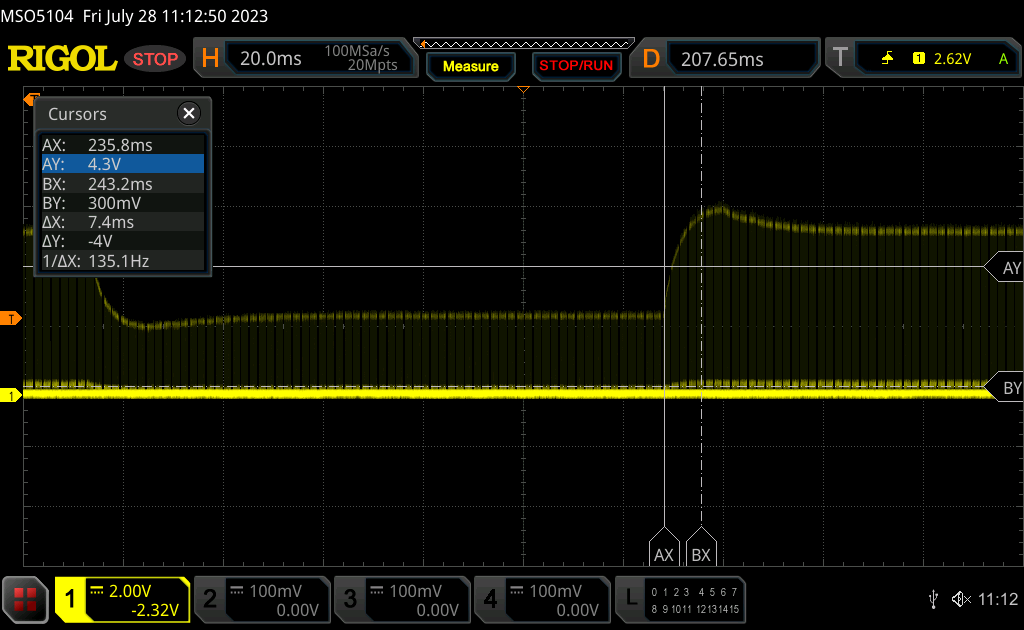 |
| ↘ 6.6 ms fall | ||
| The screen shows good response rates in our tests, but may be too slow for competitive gamers. In comparison, all tested devices range from 0.2 (minimum) to 636 (maximum) ms. » 20 % of all devices are better. This means that the measured response time is better than the average of all tested devices (34.3 ms). | ||
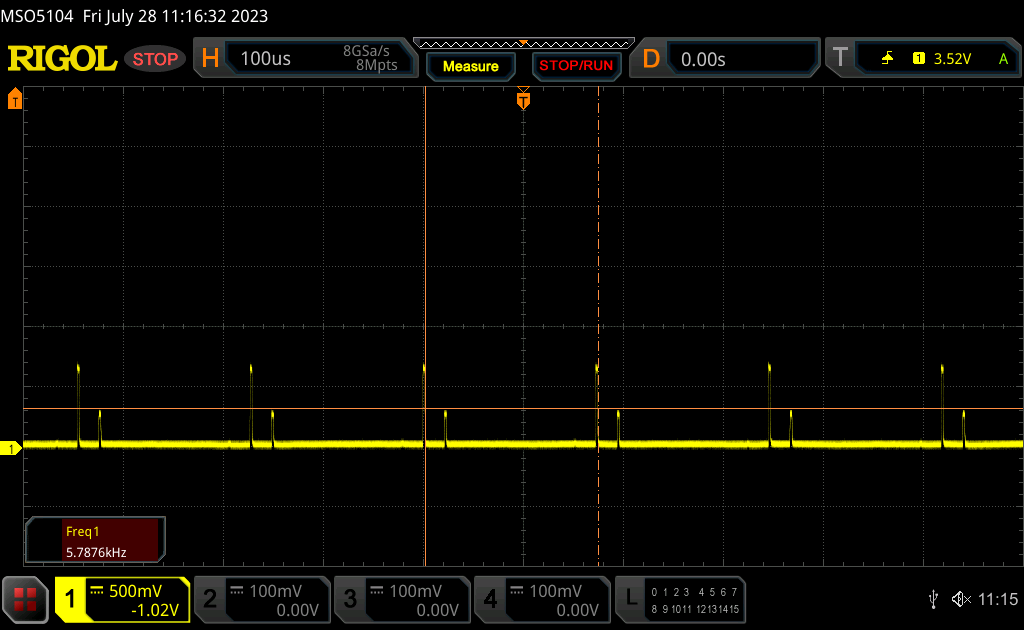
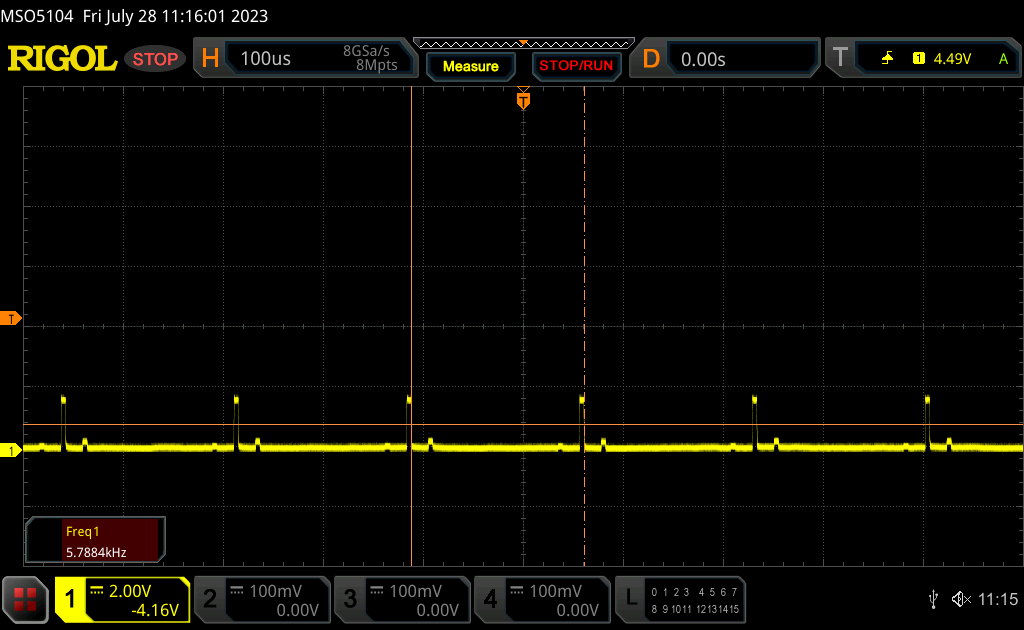
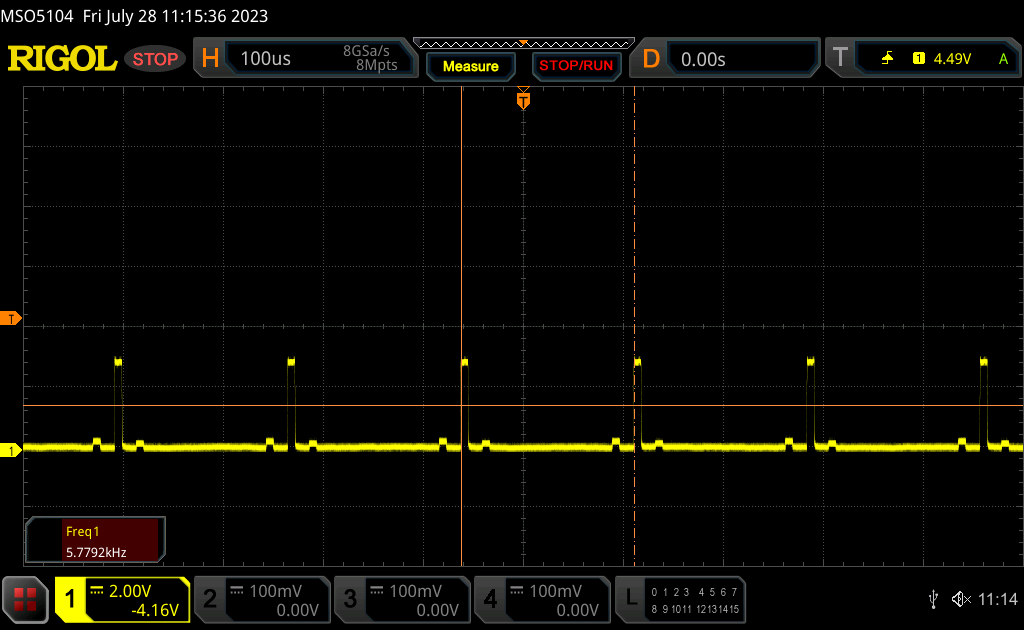
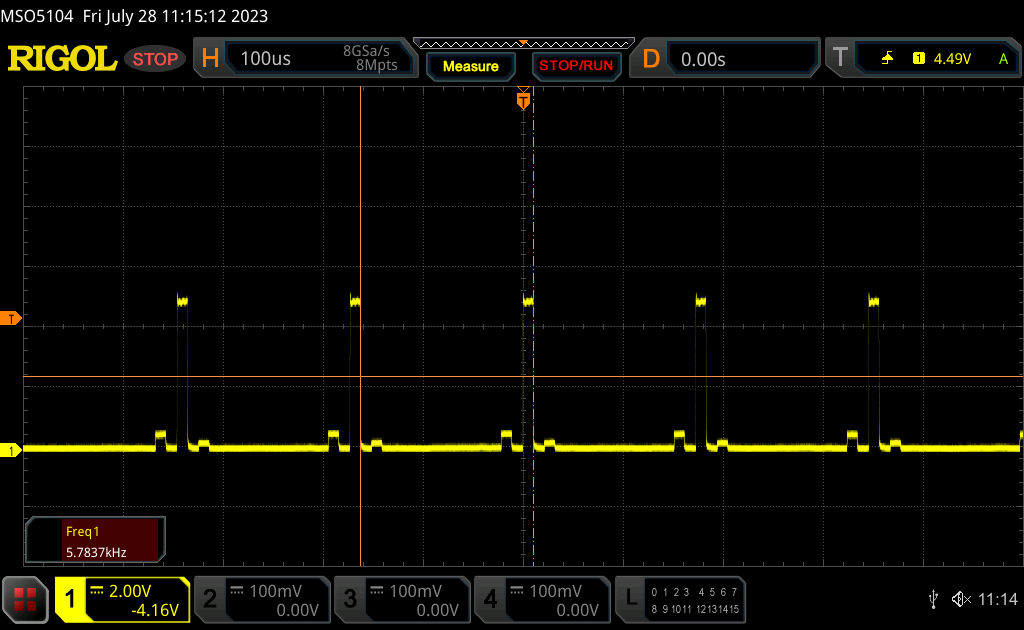
Screen Flickering / PWM (Pulse-Width Modulation)
| Screen flickering / PWM detected | 5784 Hz | ≤ 100 % brightness setting | 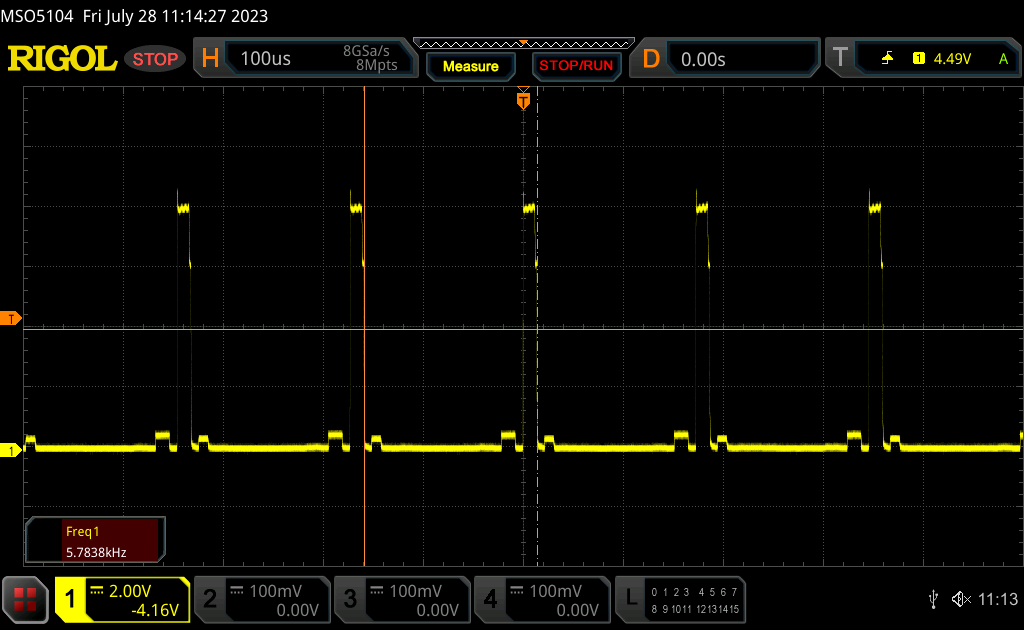 |
The display backlight flickers at 5784 Hz (Likely utilizing PWM) Flickering detected at a brightness setting of 100 % and below. There should be no flickering or PWM above this brightness setting. The frequency of 5784 Hz is quite high, so most users sensitive to PWM should not notice any flickering. In comparison: 53 % of all tested devices do not use PWM to dim the display. If PWM was detected, an average of 18752 (minimum: 5 - maximum: 3846000) Hz was measured. | |||
Flickering is present on all brightness levels when in SDR mode. However, its frequency is relatively high at 5784 Hz and so it should not be an issue for the vast majority of users.
Performance — 13th Gen Raptor Lake-H
Testing Conditions
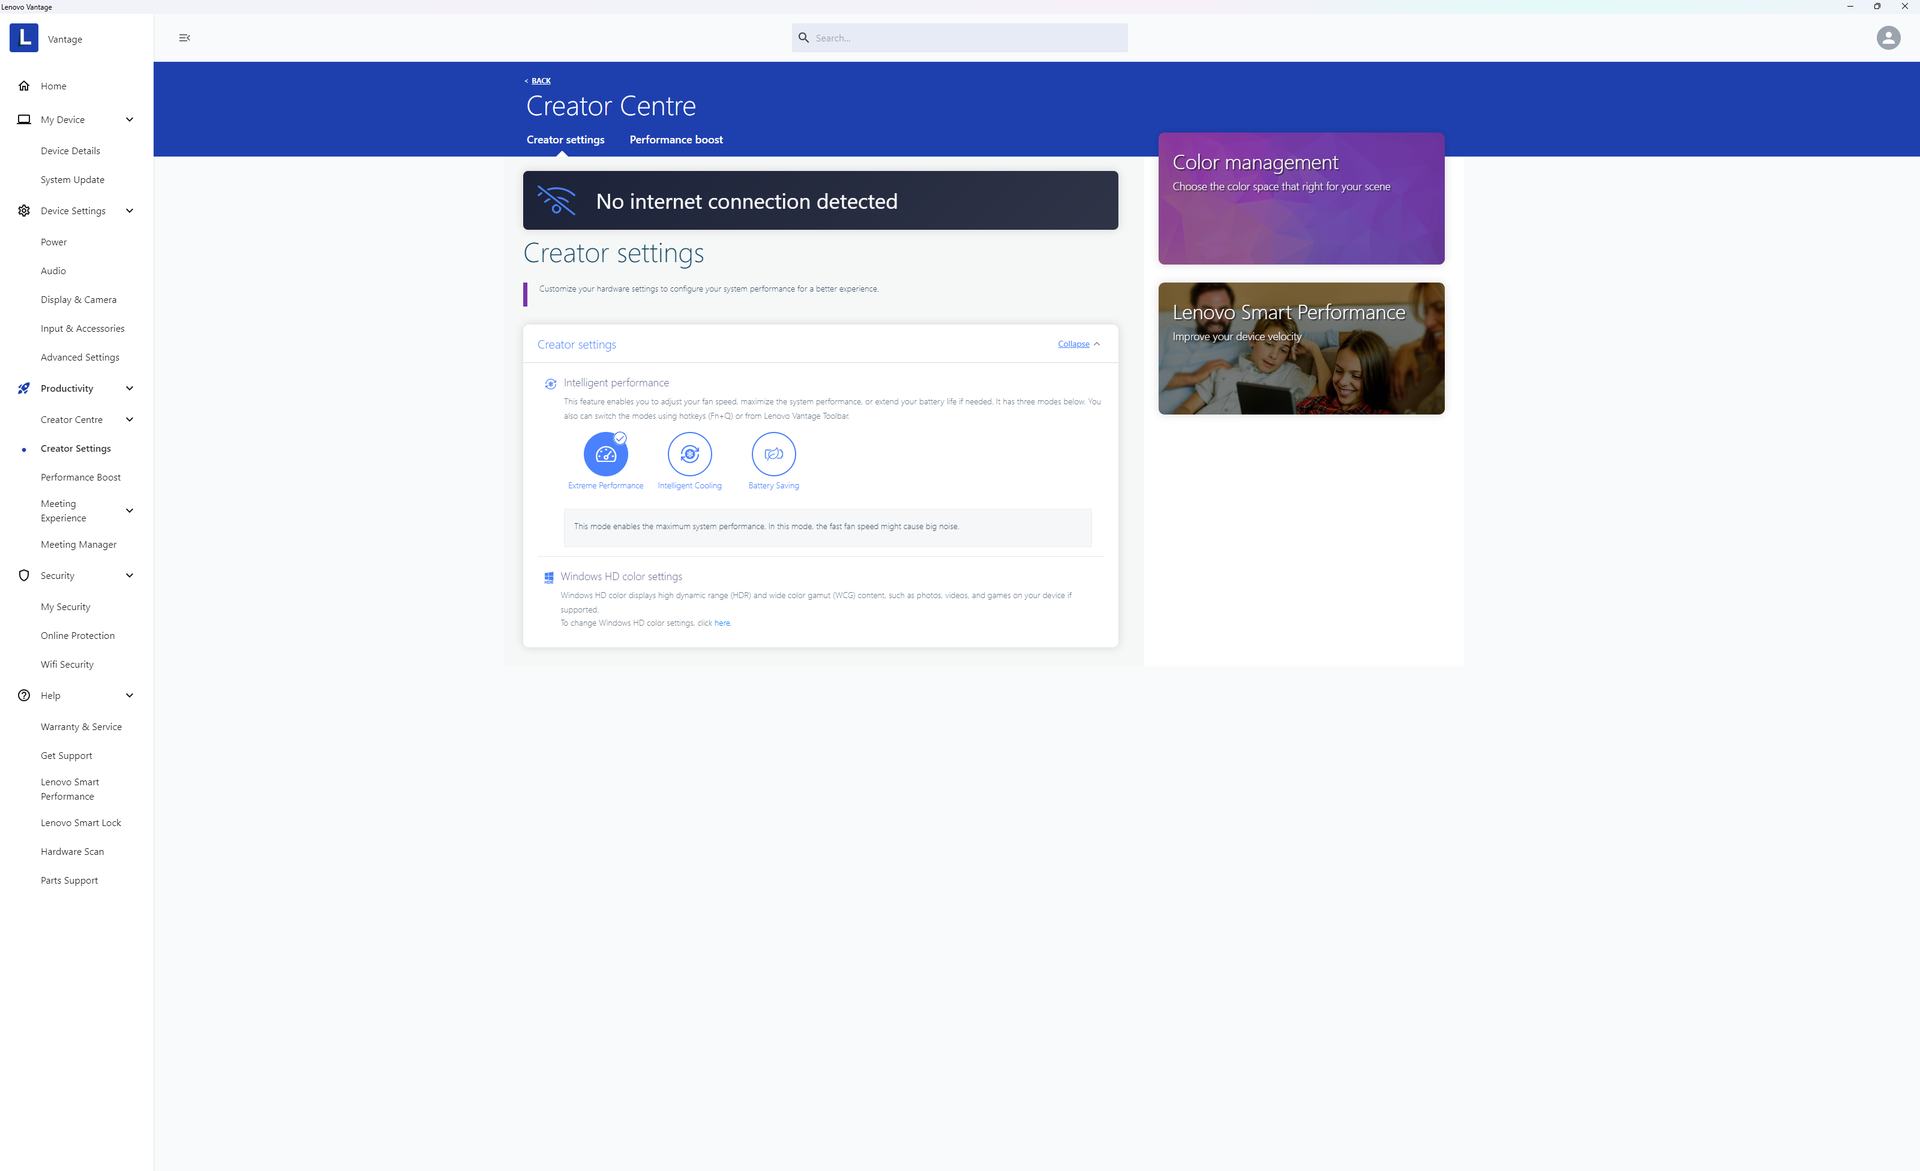
We set our unit to Performance mode via Windows and Extreme Performance mode via Lenovo Vantage prior to running the benchmarks below. Annoyingly, Lenovo redesigns its Vantage UI rather frequently and so all the settings are under different submenus when compared to the same software on other Lenovo laptops.
Processor
The Core i9-13905H may be faster than the Core i7-13705H on paper, but the advantages are minor at best. Multi-thread performance is almost identical between them while single-thread performance is only 5 to 10 percent faster with our Core i9.
Cinebench R15 Multi Loop
Cinebench R23: Multi Core | Single Core
Cinebench R20: CPU (Multi Core) | CPU (Single Core)
Cinebench R15: CPU Multi 64Bit | CPU Single 64Bit
Blender: v2.79 BMW27 CPU
7-Zip 18.03: 7z b 4 | 7z b 4 -mmt1
Geekbench 5.5: Multi-Core | Single-Core
HWBOT x265 Benchmark v2.2: 4k Preset
LibreOffice : 20 Documents To PDF
R Benchmark 2.5: Overall mean
* ... smaller is better
AIDA64: FP32 Ray-Trace | FPU Julia | CPU SHA3 | CPU Queen | FPU SinJulia | FPU Mandel | CPU AES | CPU ZLib | FP64 Ray-Trace | CPU PhotoWorxx
| Performance Rating | |
| Lenovo Slim Pro 9i 16IRP8 | |
| Average Intel Core i9-13905H | |
| Lenovo Yoga Pro 9 16-IRP G8 | |
| HP Envy 16 h0112nr | |
| Asus VivoBook Pro 16 | |
| Dell Inspiron 16 Plus 7620 | |
| Acer Swift Edge SFE16-42-R1GM | |
| AIDA64 / FP32 Ray-Trace | |
| Average Intel Core i9-13905H (17642 - 19900, n=3) | |
| Lenovo Slim Pro 9i 16IRP8 | |
| Lenovo Yoga Pro 9 16-IRP G8 | |
| Asus VivoBook Pro 16 | |
| Dell Inspiron 16 Plus 7620 | |
| HP Envy 16 h0112nr | |
| Acer Swift Edge SFE16-42-R1GM | |
| AIDA64 / CPU PhotoWorxx | |
| Average Intel Core i9-13905H (51720 - 60161, n=3) | |
| Lenovo Slim Pro 9i 16IRP8 | |
| Lenovo Yoga Pro 9 16-IRP G8 | |
| HP Envy 16 h0112nr | |
| Dell Inspiron 16 Plus 7620 | |
| Acer Swift Edge SFE16-42-R1GM | |
| Asus VivoBook Pro 16 | |
System Performance
We experienced wake-from-sleep issues and even a BSOD during testing. The screen would sometimes remain blank when attempting to wake from sleep and a hard reboot would then be required to return to Windows.
CrossMark: Overall | Productivity | Creativity | Responsiveness
| PCMark 10 / Score | |
| Lenovo Slim Pro 9i 16IRP8 | |
| HP Envy 16 h0112nr | |
| Lenovo Yoga Pro 9 16-IRP G8 | |
| Dell Inspiron 16 Plus 7620 | |
| Asus VivoBook Pro 16 | |
| Acer Swift Edge SFE16-42-R1GM | |
| PCMark 10 / Essentials | |
| HP Envy 16 h0112nr | |
| Lenovo Slim Pro 9i 16IRP8 | |
| Lenovo Yoga Pro 9 16-IRP G8 | |
| Dell Inspiron 16 Plus 7620 | |
| Asus VivoBook Pro 16 | |
| Acer Swift Edge SFE16-42-R1GM | |
| PCMark 10 / Productivity | |
| Lenovo Slim Pro 9i 16IRP8 | |
| HP Envy 16 h0112nr | |
| Acer Swift Edge SFE16-42-R1GM | |
| Dell Inspiron 16 Plus 7620 | |
| Asus VivoBook Pro 16 | |
| Lenovo Yoga Pro 9 16-IRP G8 | |
| PCMark 10 / Digital Content Creation | |
| Lenovo Slim Pro 9i 16IRP8 | |
| Lenovo Yoga Pro 9 16-IRP G8 | |
| HP Envy 16 h0112nr | |
| Dell Inspiron 16 Plus 7620 | |
| Asus VivoBook Pro 16 | |
| Acer Swift Edge SFE16-42-R1GM | |
| CrossMark / Overall | |
| Lenovo Yoga Pro 9 16-IRP G8 | |
| HP Envy 16 h0112nr | |
| Lenovo Slim Pro 9i 16IRP8 | |
| Dell Inspiron 16 Plus 7620 | |
| Asus VivoBook Pro 16 | |
| Acer Swift Edge SFE16-42-R1GM | |
| CrossMark / Productivity | |
| HP Envy 16 h0112nr | |
| Lenovo Yoga Pro 9 16-IRP G8 | |
| Asus VivoBook Pro 16 | |
| Dell Inspiron 16 Plus 7620 | |
| Lenovo Slim Pro 9i 16IRP8 | |
| Acer Swift Edge SFE16-42-R1GM | |
| CrossMark / Creativity | |
| Lenovo Yoga Pro 9 16-IRP G8 | |
| Lenovo Slim Pro 9i 16IRP8 | |
| HP Envy 16 h0112nr | |
| Dell Inspiron 16 Plus 7620 | |
| Asus VivoBook Pro 16 | |
| Acer Swift Edge SFE16-42-R1GM | |
| CrossMark / Responsiveness | |
| Asus VivoBook Pro 16 | |
| HP Envy 16 h0112nr | |
| Lenovo Yoga Pro 9 16-IRP G8 | |
| Dell Inspiron 16 Plus 7620 | |
| Lenovo Slim Pro 9i 16IRP8 | |
| Acer Swift Edge SFE16-42-R1GM | |
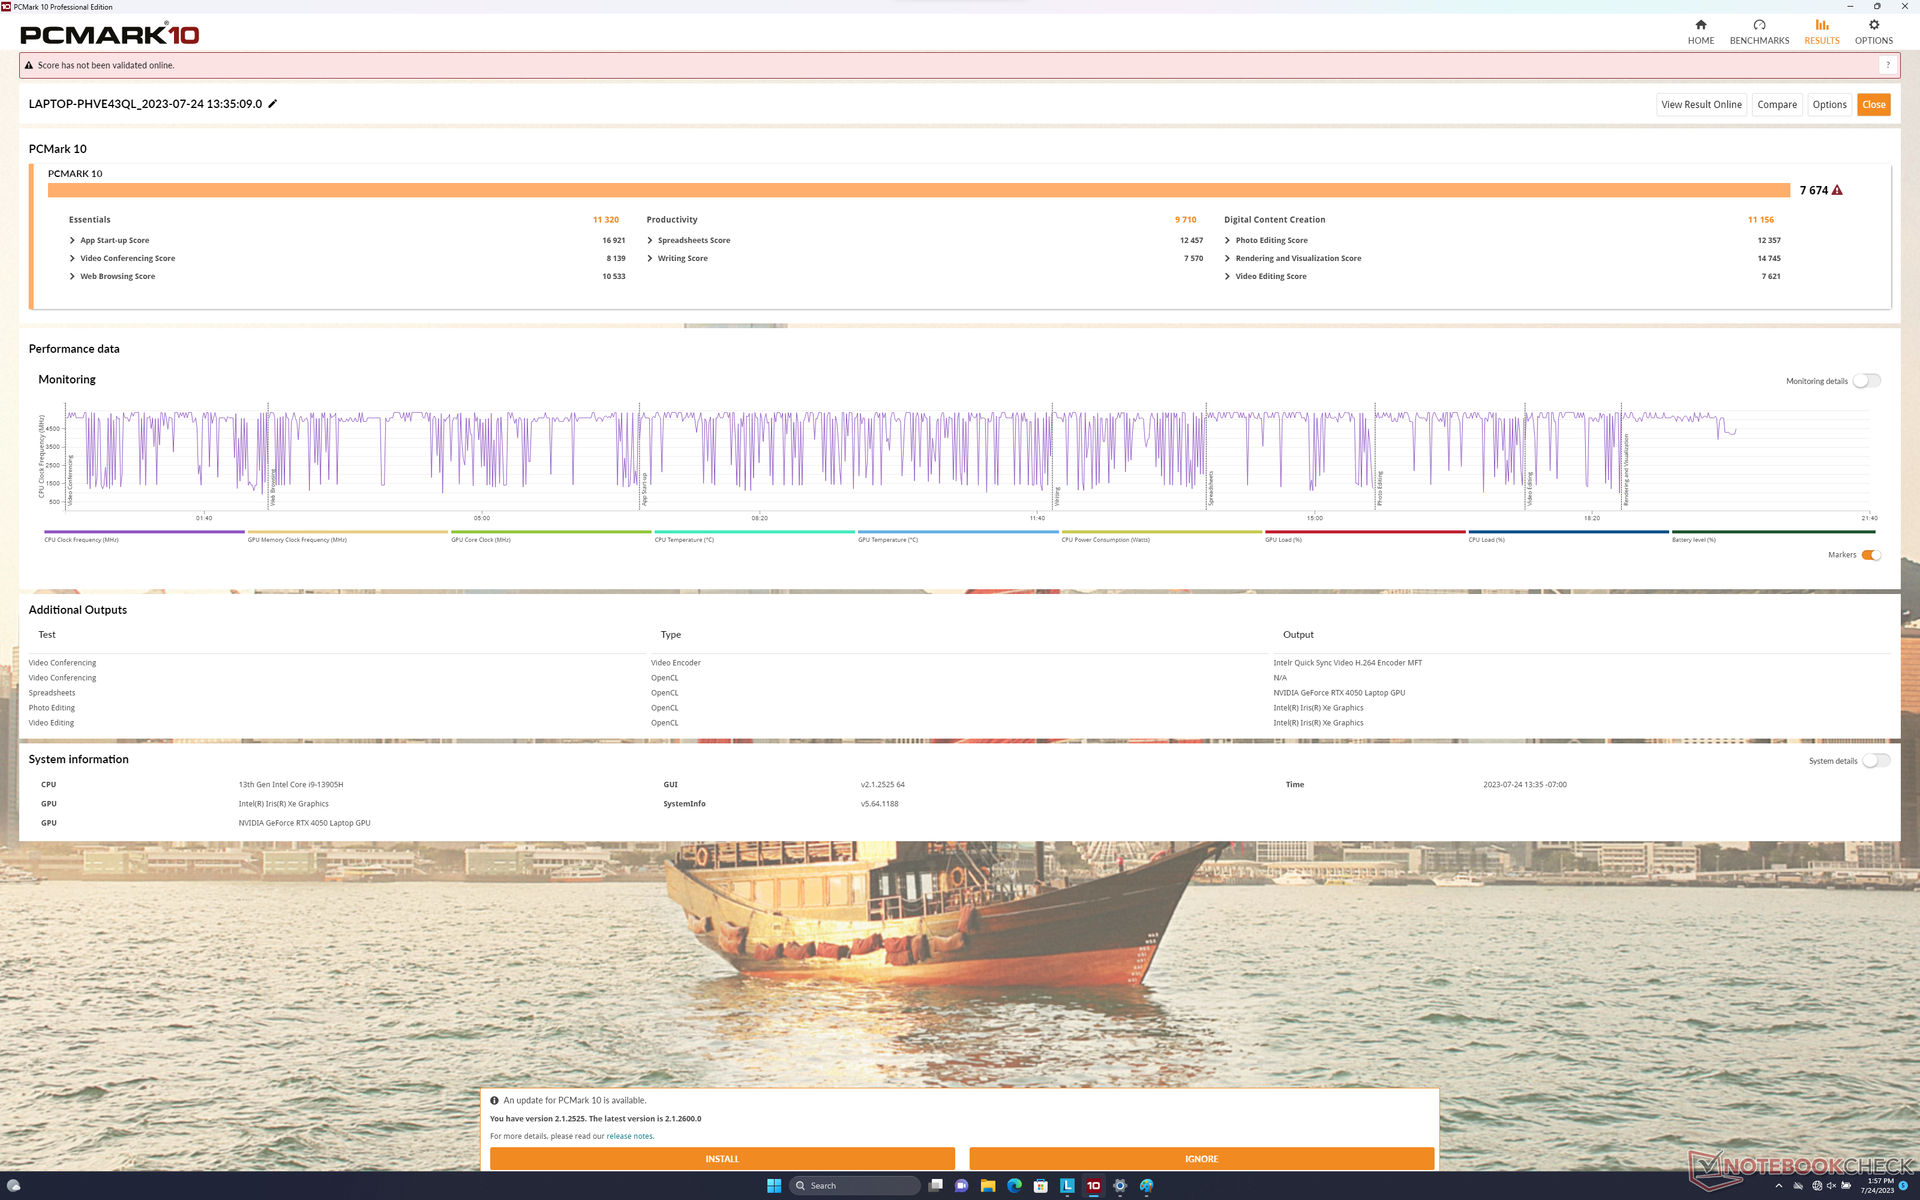
| PCMark 10 Score | 7674 points | |
Help | ||
| AIDA64 / Memory Latency | |
| Lenovo Yoga Pro 9 16-IRP G8 | |
| Average Intel Core i9-13905H (101.4 - 134.8, n=3) | |
| Lenovo Slim Pro 9i 16IRP8 | |
| Acer Swift Edge SFE16-42-R1GM | |
| Dell Inspiron 16 Plus 7620 | |
| HP Envy 16 h0112nr | |
| Asus VivoBook Pro 16 | |
* ... smaller is better
DPC Latency
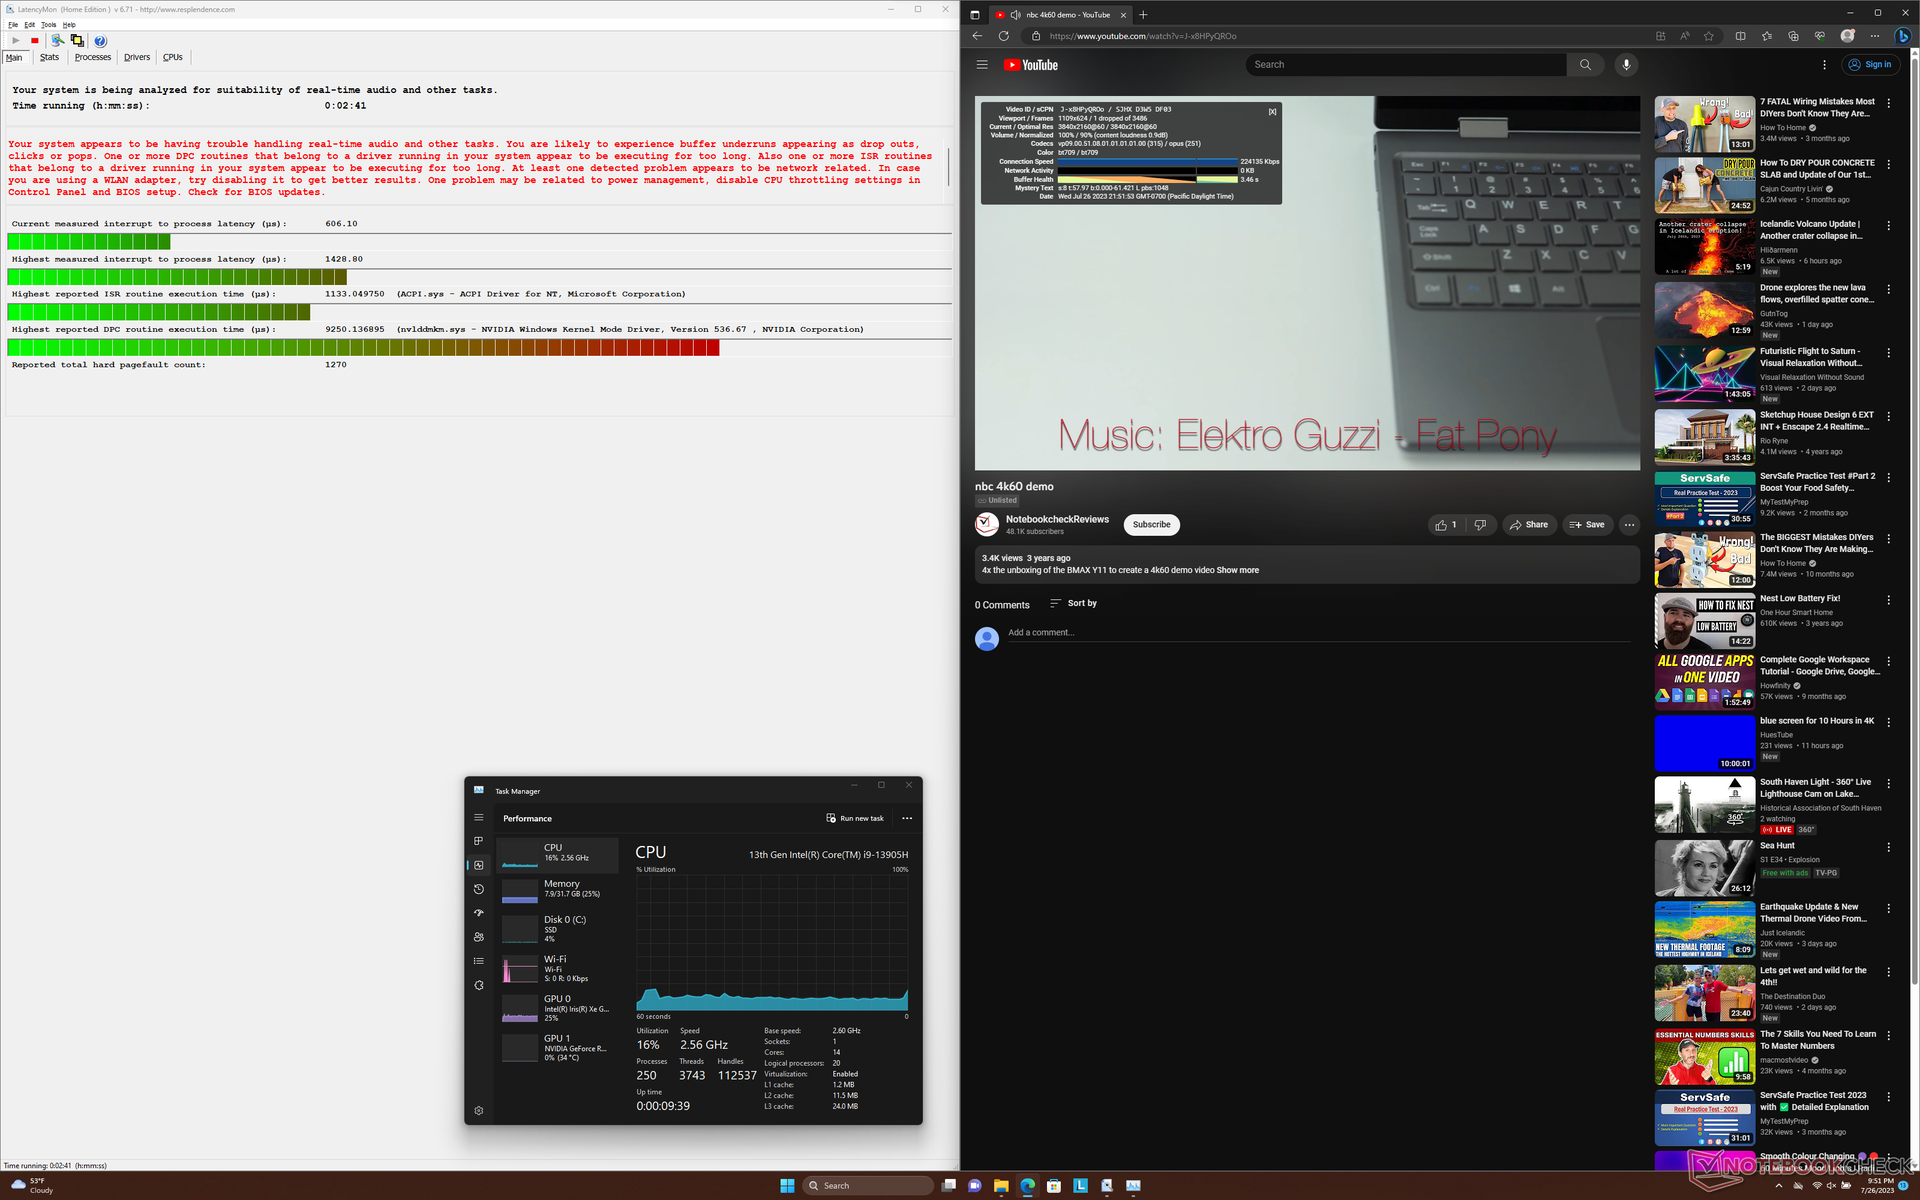
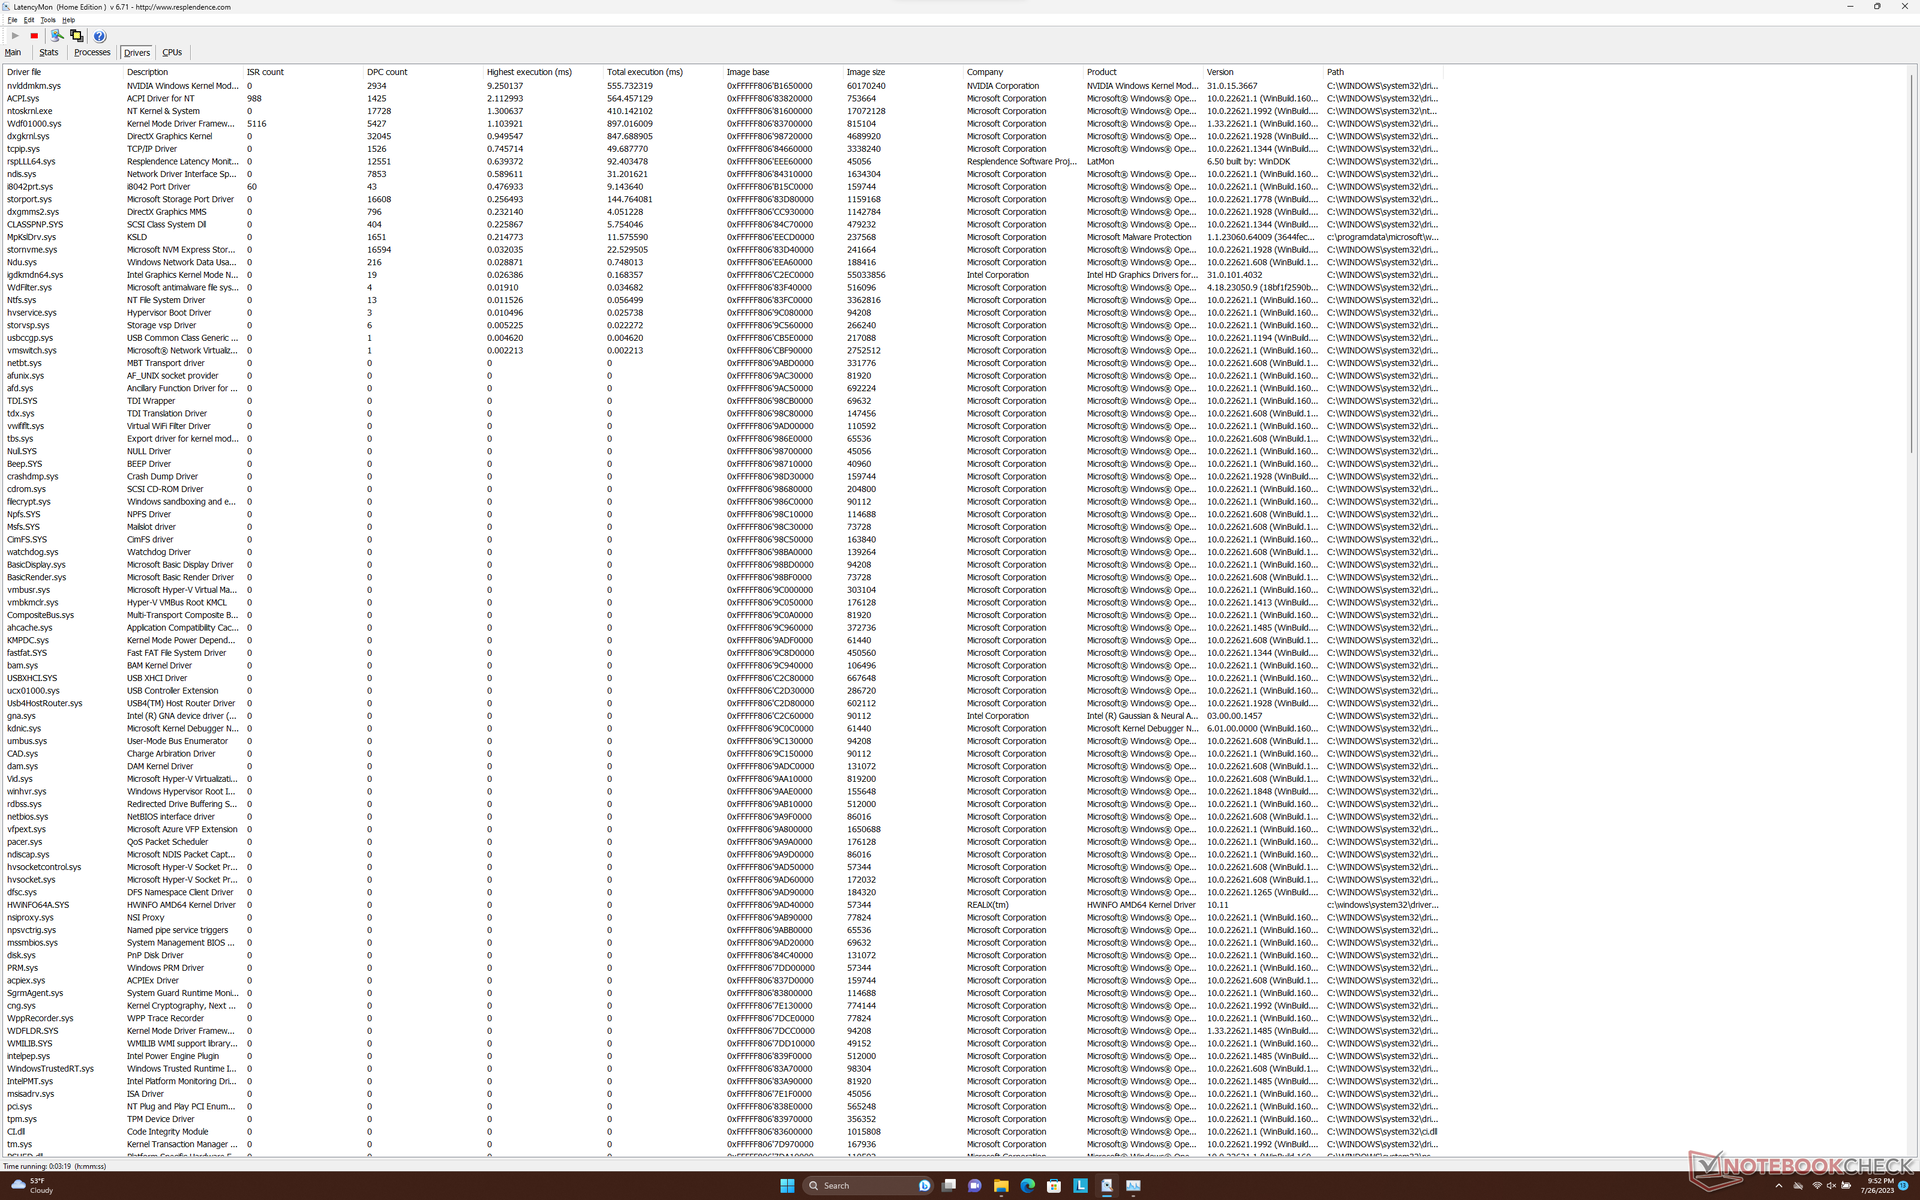
LatencyMon reveals DPC issues when opening multiple browser tabs of our homepage. 4K video playback at 60 FPS is otherwise excellent with just one dropped frame during a 60-second timeframe.
| DPC Latencies / LatencyMon - interrupt to process latency (max), Web, Youtube, Prime95 | |
| Lenovo Yoga Pro 9 16-IRP G8 | |
| Acer Swift Edge SFE16-42-R1GM | |
| Asus VivoBook Pro 16 | |
| Lenovo Slim Pro 9i 16IRP8 | |
| Dell Inspiron 16 Plus 7620 | |
| HP Envy 16 h0112nr | |
* ... smaller is better
Storage Devices
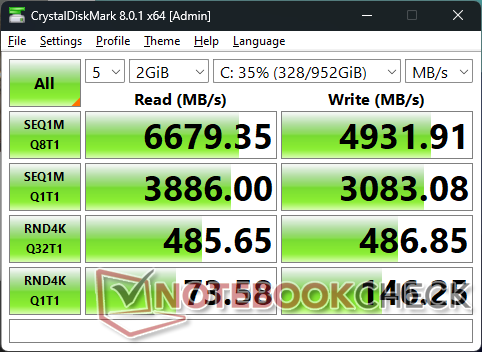
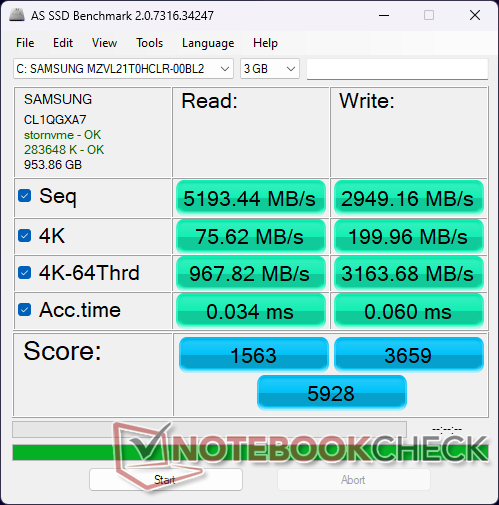

| Drive Performance Rating - Percent | |
| Acer Swift Edge SFE16-42-R1GM | |
| Lenovo Yoga Pro 9 16-IRP G8 | |
| Lenovo Slim Pro 9i 16IRP8 | |
| HP Envy 16 h0112nr | |
| Asus VivoBook Pro 16 | |
| Dell Inspiron 16 Plus 7620 | |
* ... smaller is better
Disk Throttling: DiskSpd Read Loop, Queue Depth 8
GPU Performance
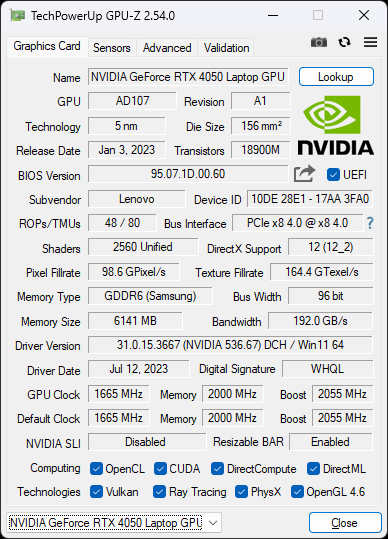
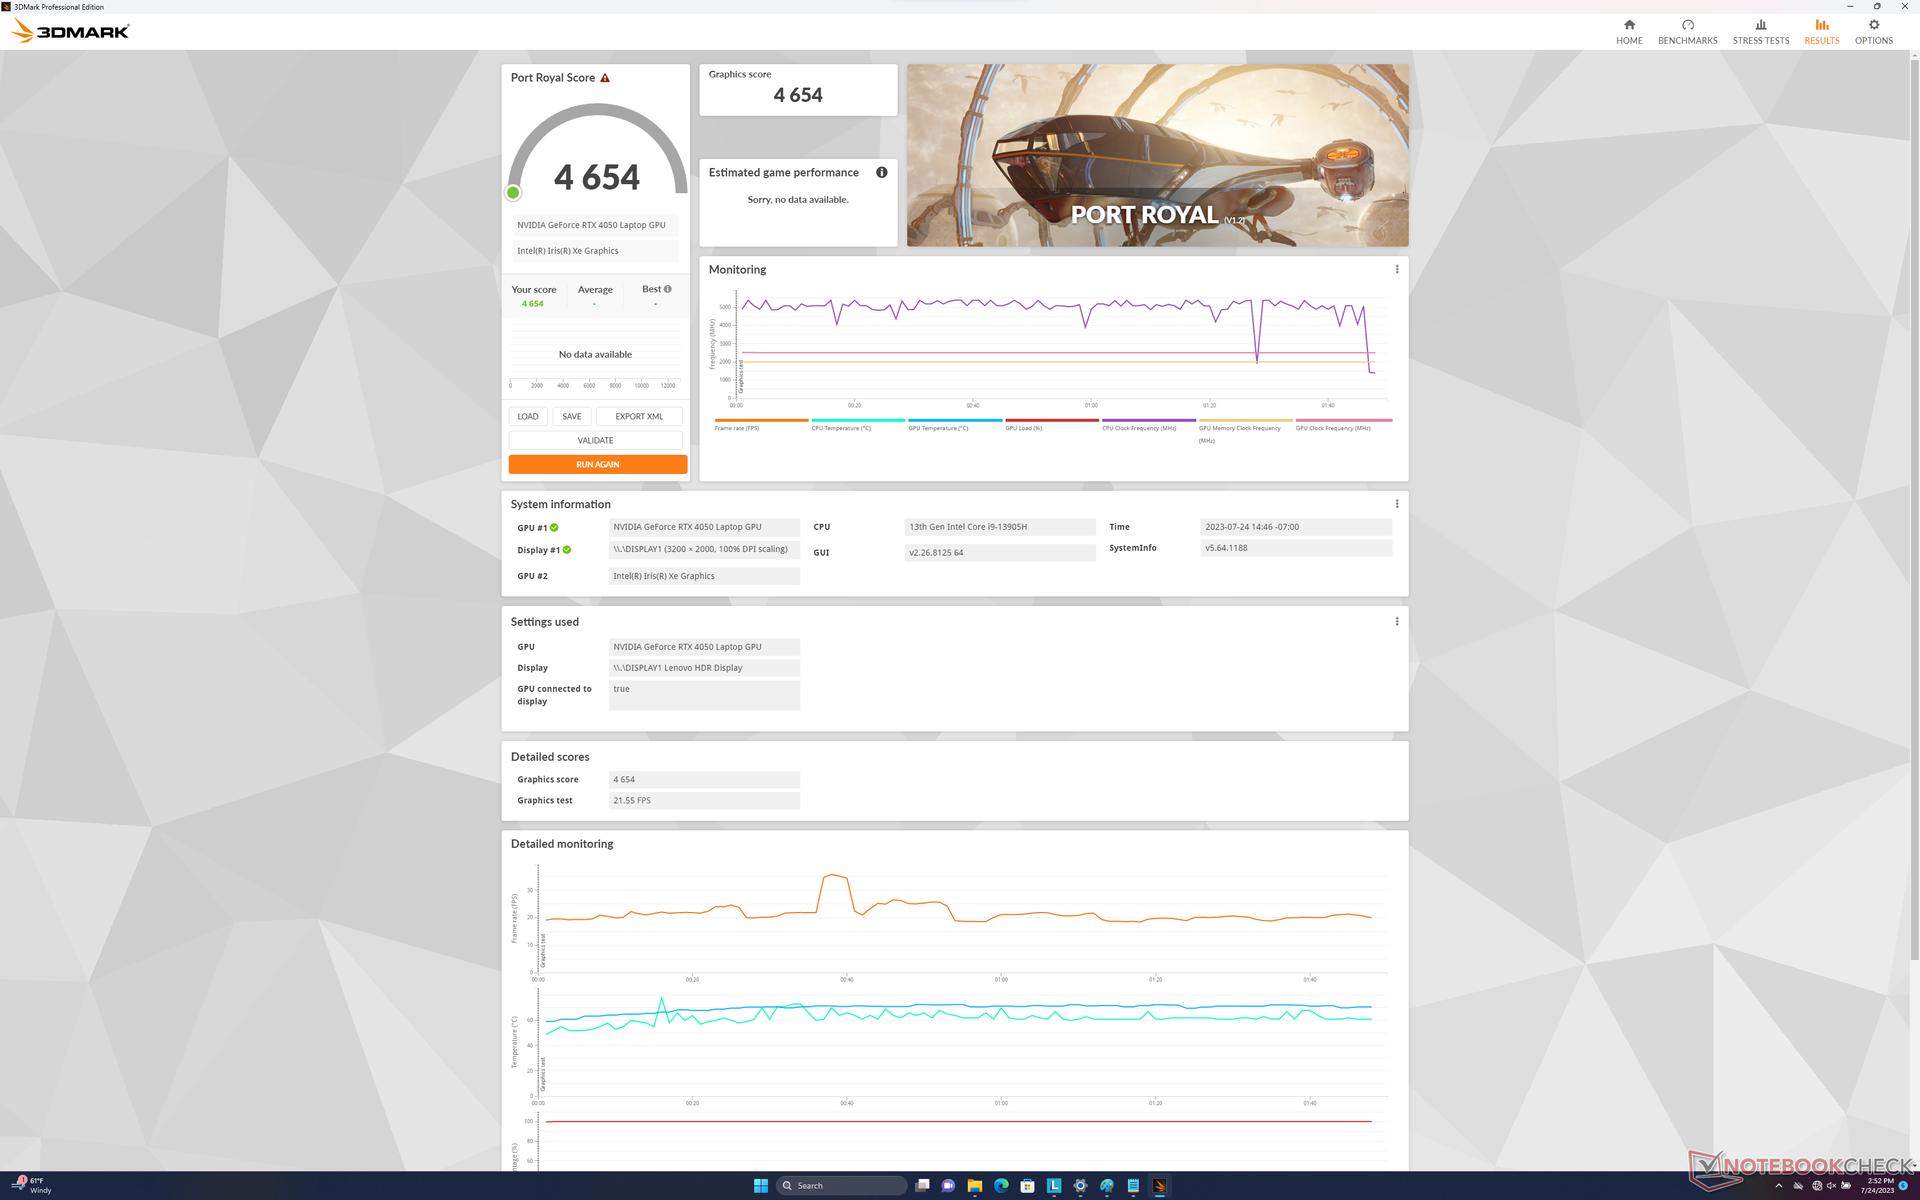
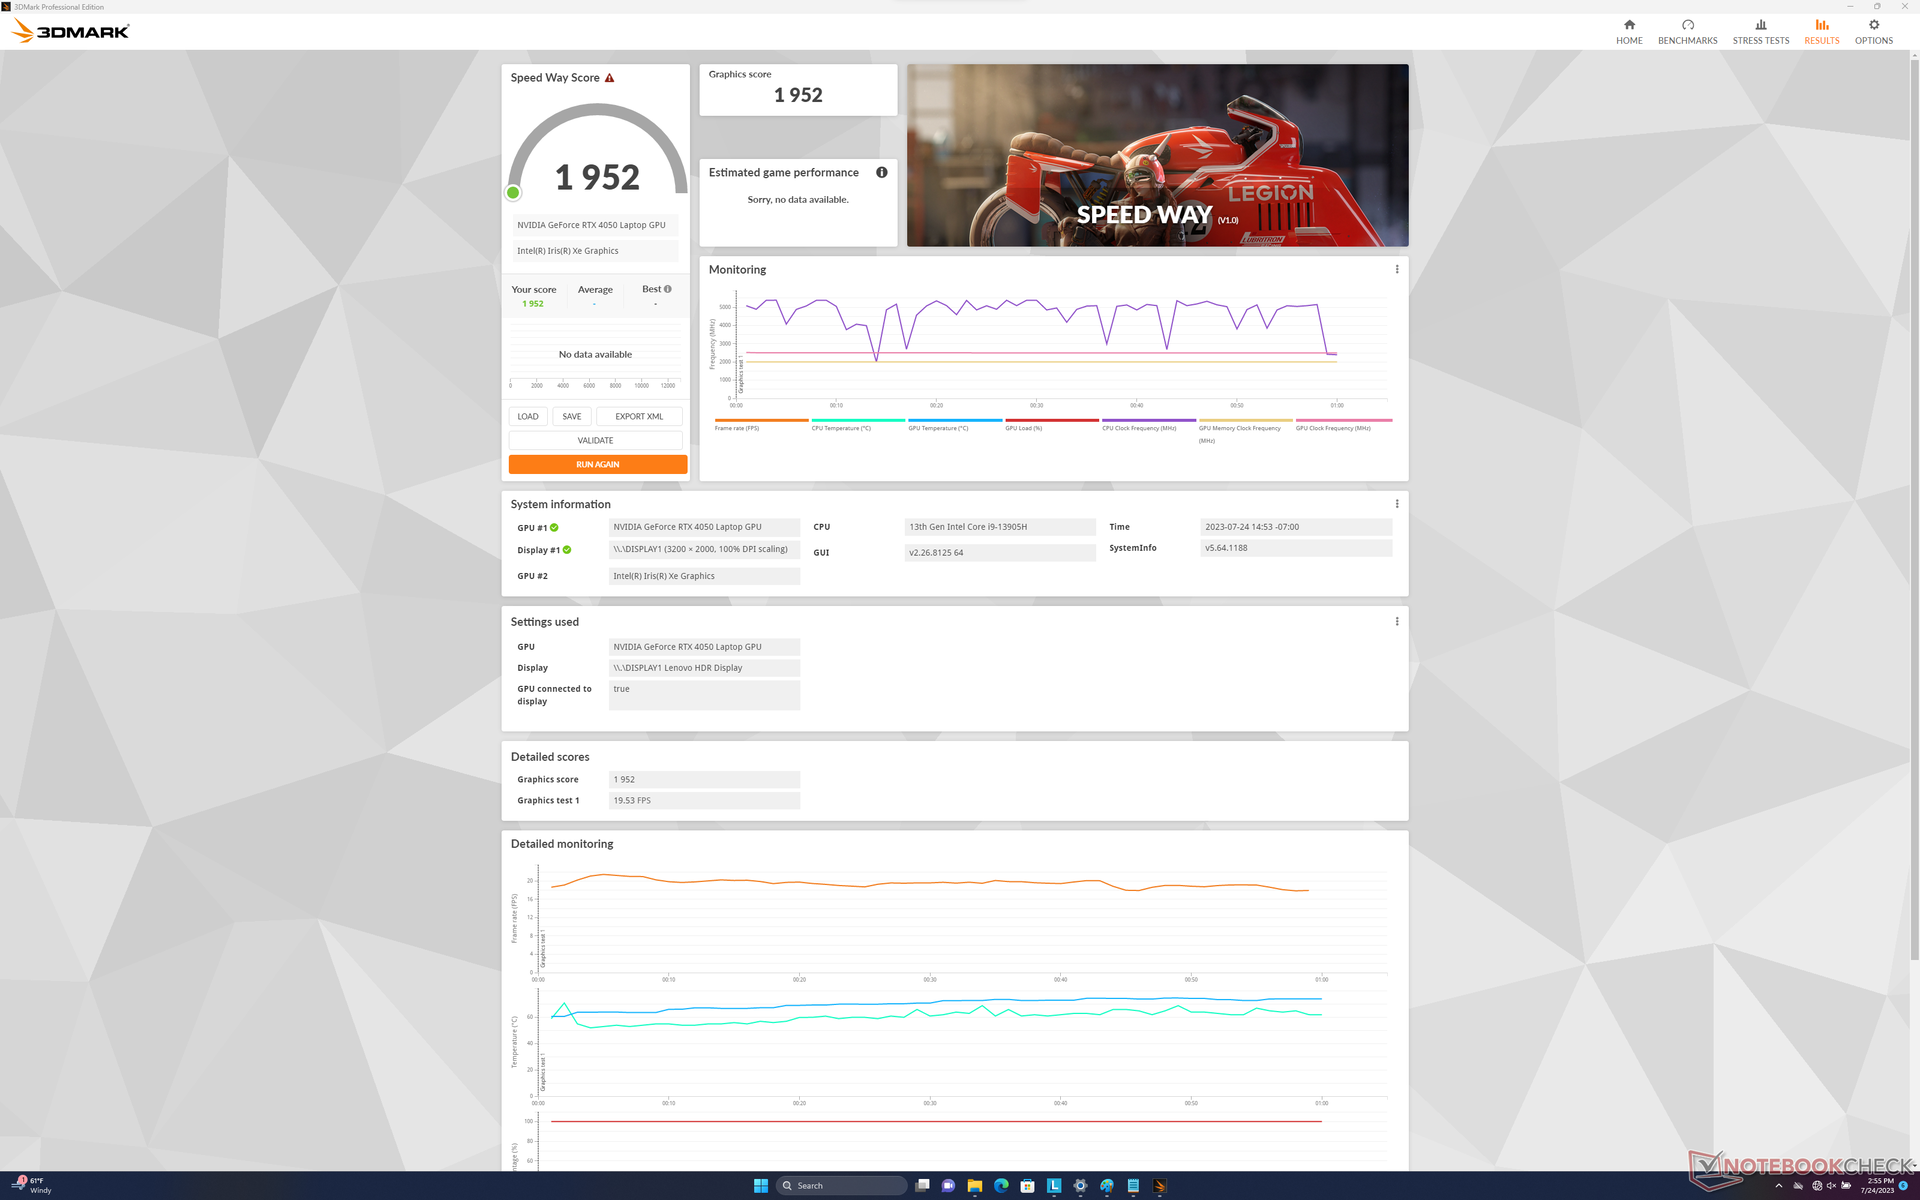
The mobile GeForce RTX 4050 is a significant upgrade over last year's disappointing mobile RTX 3050 series. Raw graphics performance is about 50 to 60 percent faster than the RTX 3050 Ti to be on par with the mobile RTX 3060.
Upgrading to the RTX 4060 configuration is expected to boost performance by about 20 percent.
Running on Balanced mode instead of Performance mode impacts performance slightly as shown by our Fire Strike results in the table below.
| Power Profile | Fire Strike Physics Score | Graphics Score | Combined Score |
| Battery | 30199 (-4%) | 12900 (-39%) | 5642 (-43%) |
| Balanced | 28925 (-8%) | 20047 (-6%) | 7581 (-24%) |
| Performance | 31606 | 21212 | 9969 |
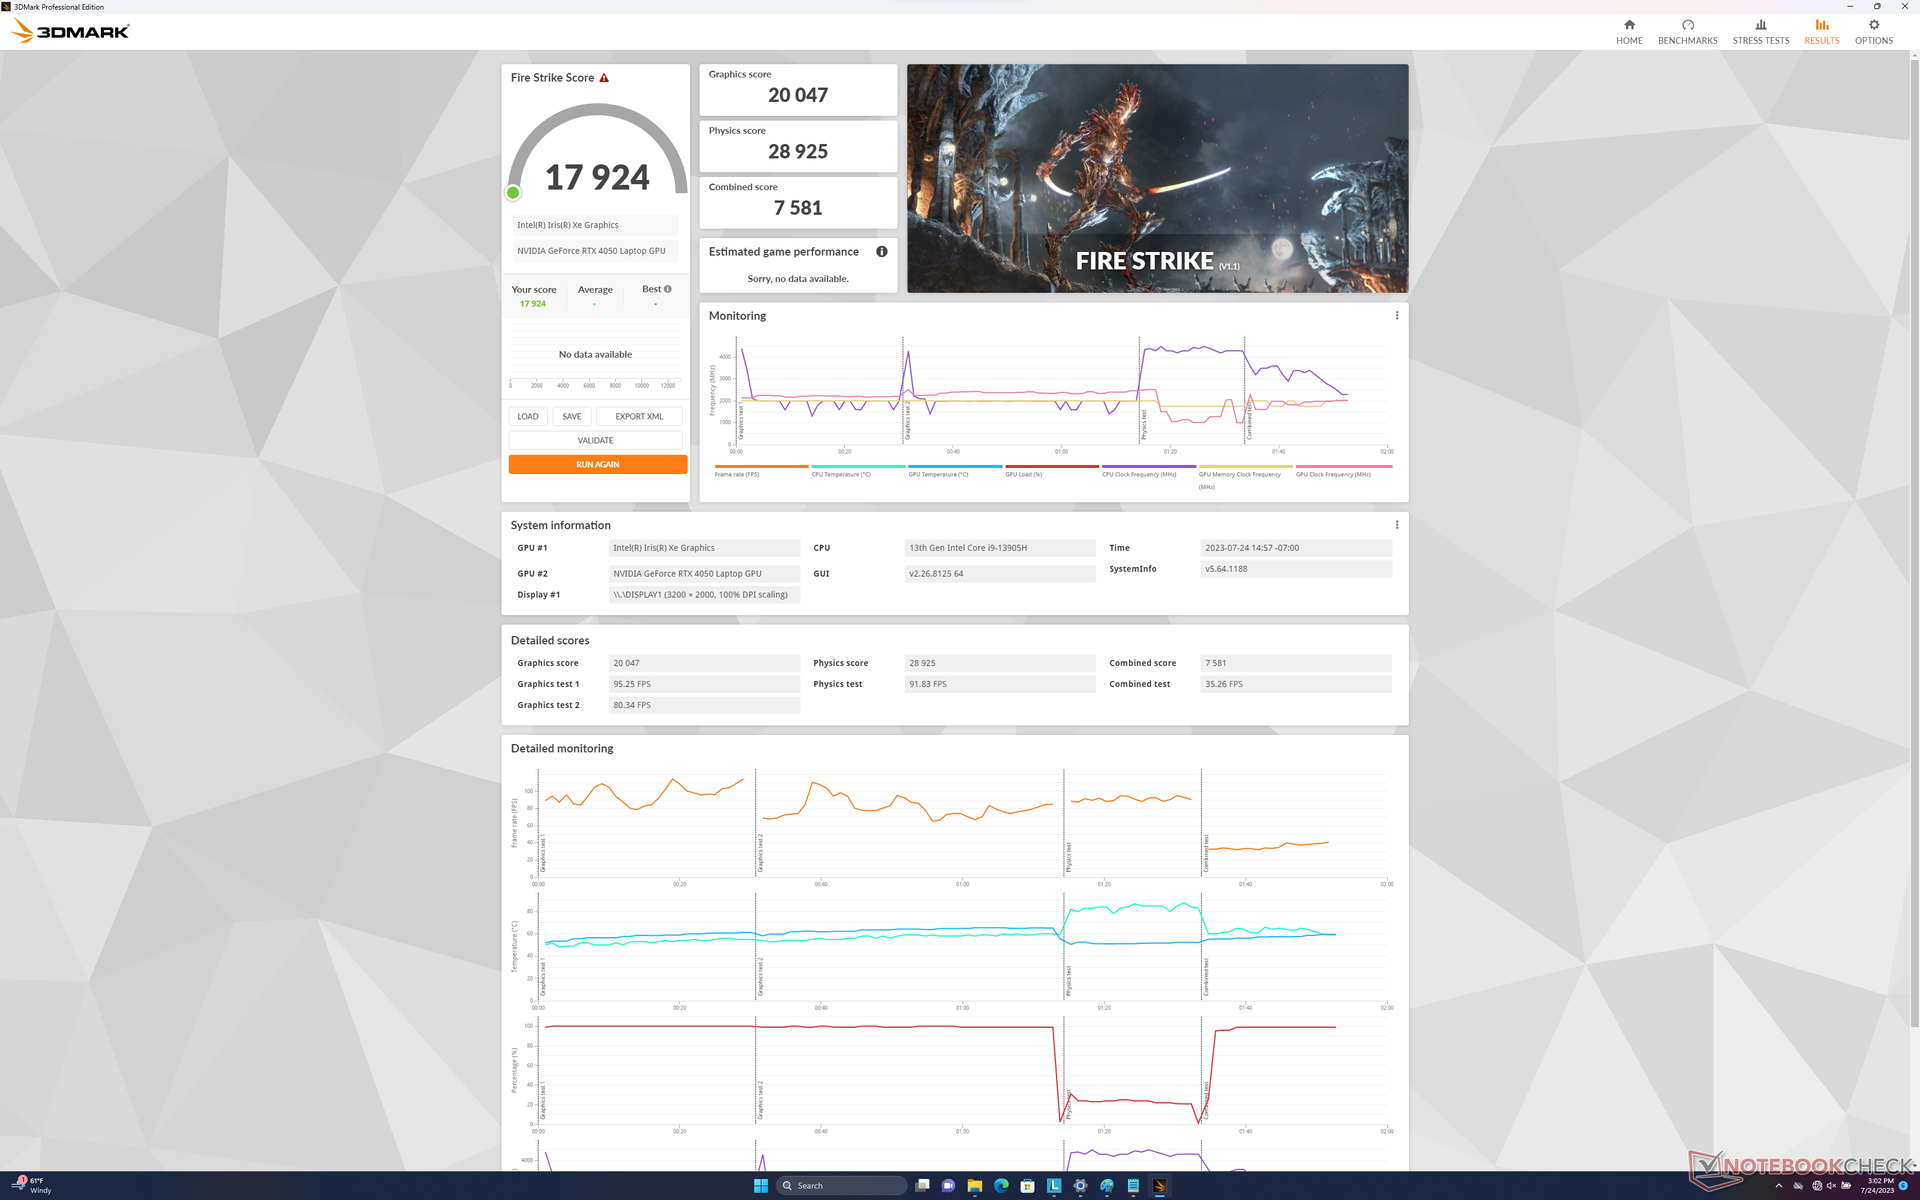


| 3DMark 11 Performance | 28168 points | |
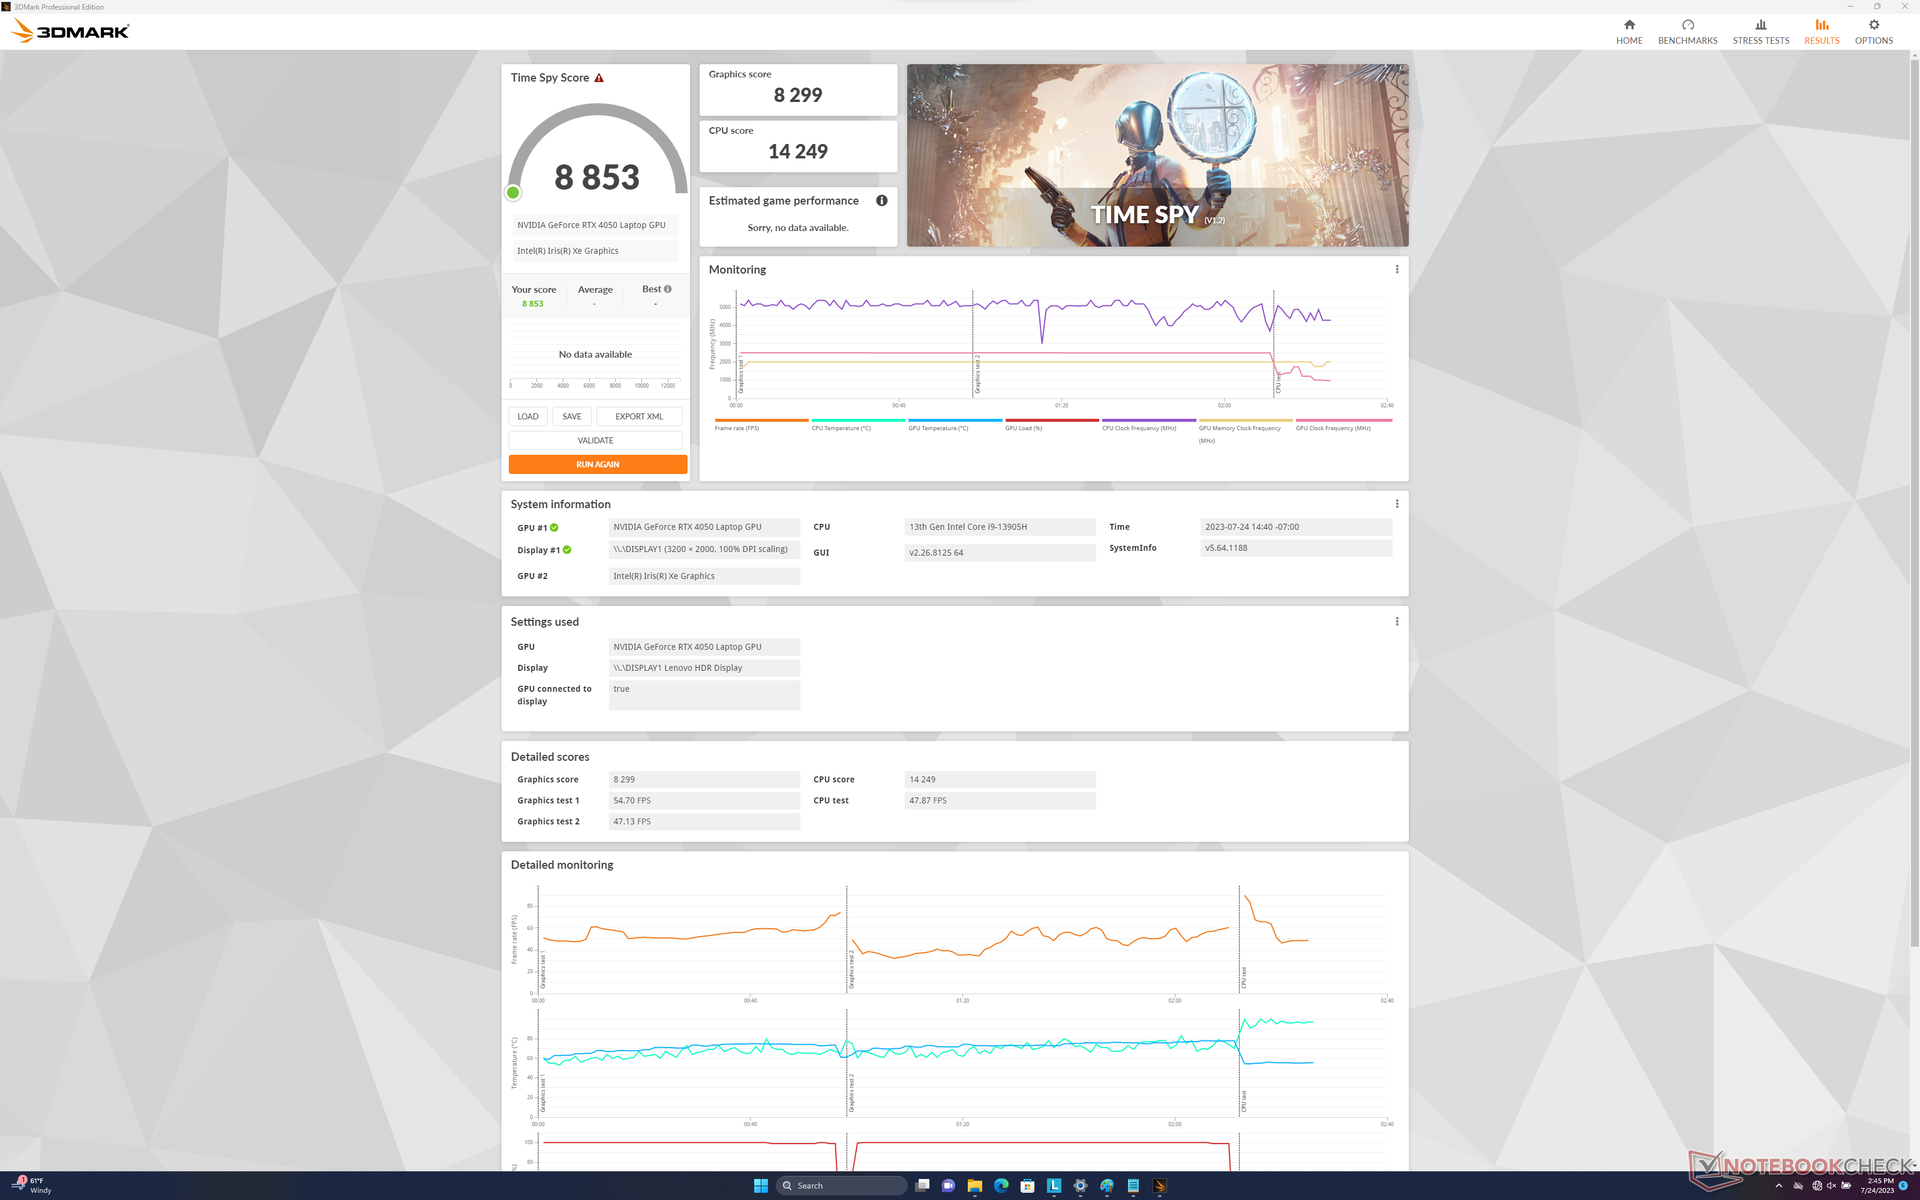
| 3DMark Fire Strike Score | 19946 points | |
| 3DMark Time Spy Score | 8853 points | |
Help | ||
* ... smaller is better
Gaming Performance
Though not technically a gaming machine, the system is more than capable of playing the latest titles even at the native QHD+ resolution. Newer and more demanding titles like Returnal can run on maximum settings, but DLSS is recommended for more tolerable frame rates.
G-Sync is unfortunately not supported on the internal display.
| Returnal | |
| 1920x1080 Low Preset | |
| MSI GeForce RTX 4060 Ti Gaming X Trio 8G | |
| Lenovo Legion Pro 5 16ARX8 | |
| Lenovo Slim Pro 9i 16IRP8 | |
| Average NVIDIA GeForce RTX 4050 Laptop GPU (59 - 66, n=3) | |
| 1920x1080 Medium Preset | |
| MSI GeForce RTX 4060 Ti Gaming X Trio 8G | |
| Lenovo Legion Pro 5 16ARX8 | |
| Average NVIDIA GeForce RTX 4050 Laptop GPU (57 - 87, n=4) | |
| Lenovo Slim Pro 9i 16IRP8 | |
| 1920x1080 High Preset | |
| MSI GeForce RTX 4060 Ti Gaming X Trio 8G | |
| Lenovo Legion Pro 5 16ARX8 | |
| Average NVIDIA GeForce RTX 4050 Laptop GPU (52 - 79, n=4) | |
| Lenovo Slim Pro 9i 16IRP8 | |
| 1920x1080 Epic Preset | |
| MSI GeForce RTX 4060 Ti Gaming X Trio 8G | |
| Lenovo Legion Pro 5 16ARX8 | |
| Average NVIDIA GeForce RTX 4050 Laptop GPU (44 - 68, n=4) | |
| Lenovo Slim Pro 9i 16IRP8 | |
| 2560x1440 Epic Preset | |
| MSI GeForce RTX 4060 Ti Gaming X Trio 8G | |
| Lenovo Legion Pro 5 16ARX8 | |
| Average NVIDIA GeForce RTX 4050 Laptop GPU (34 - 49, n=2) | |
| Lenovo Slim Pro 9i 16IRP8 | |
Witcher 3 FPS Chart
| low | med. | high | ultra | QHD | |
| GTA V (2015) | 183.7 | 180.6 | 167.8 | 96.8 | 67.5 |
| The Witcher 3 (2015) | 410.2 | 271.1 | 164.7 | 84.9 | 59.2 |
| Dota 2 Reborn (2015) | 180 | 162.5 | 155 | 138.6 | |
| Final Fantasy XV Benchmark (2018) | 186.9 | 118.6 | 83.5 | 60 | |
| X-Plane 11.11 (2018) | 153 | 130.6 | 103.2 | ||
| Strange Brigade (2018) | 429 | 202 | 164.7 | 144.1 | 96.3 |
| Cyberpunk 2077 1.6 (2022) | 121.3 | 105.9 | 78.7 | 64.1 | 38.5 |
| Tiny Tina's Wonderlands (2022) | 183.3 | 142.8 | 91.5 | 70.2 | 47.7 |
| F1 22 (2022) | 214 | 199.8 | 150.8 | 52.6 | 32.3 |
| Returnal (2023) | 64 | 63 | 59 | 52 | 34 |
Emissions
System Noise
Fan noise tends to settle in the quiet 25 to 27 dB(A) range against a silent background of 22.7 dB(A) when running undemanding loads like browsers or video streams. When higher loads like games are introduced, however, the fans would steadily increase until reaching a maximum of 52.6 dB(A) to be as loud as many gaming laptops.
It's worth noting that fan noise would drop considerably to just 44.2 dB(A) when running games on Balanced mode instead of Performance mode. The lower fan noise may therefore be worth the slight decrease in performance depending on user preferences.
Noise Level
| Idle |
| 22.7 / 22.7 / 27.5 dB(A) |
| Load |
| 28.9 / 52.5 dB(A) |
 | ||
30 dB silent 40 dB(A) audible 50 dB(A) loud |
||
min: | ||
| Lenovo Slim Pro 9i 16IRP8 NVIDIA GeForce RTX 4050 Laptop GPU, i9-13905H, Samsung PM9A1 MZVL21T0HCLR | Lenovo Yoga Pro 9 16-IRP G8 NVIDIA GeForce RTX 4060 Laptop GPU, i7-13705H, Samsung PM9A1 MZVL21T0HCLR | Asus VivoBook Pro 16 GeForce RTX 3050 Ti Laptop GPU, i7-12700H, Intel SSD 670p SSDPEKNU010TZ | Acer Swift Edge SFE16-42-R1GM Radeon 680M, R7 7735U, Micron 3400 1TB MTFDKBA1T0TFH | Dell Inspiron 16 Plus 7620 GeForce RTX 3050 Ti Laptop GPU, i7-12700H, Kioxia BG5 KBG50ZNS512G | HP Envy 16 h0112nr GeForce RTX 3060 Laptop GPU, i7-12700H, Micron 3400 1TB MTFDKBA1T0TFH | |
|---|---|---|---|---|---|---|
| Noise | -10% | -22% | -13% | -13% | -7% | |
| off / environment * | 22.7 | 24.7 -9% | 25.2 -11% | 25.7 -13% | 23.3 -3% | 22.8 -0% |
| Idle Minimum * | 22.7 | 24.7 -9% | 25.2 -11% | 25.7 -13% | 25.7 -13% | 22.9 -1% |
| Idle Average * | 22.7 | 26.2 -15% | 25.2 -11% | 27 -19% | 26.1 -15% | 22.9 -1% |
| Idle Maximum * | 27.5 | 26.2 5% | 25.2 8% | 29.3 -7% | 30.6 -11% | 30.5 -11% |
| Load Average * | 28.9 | 39.7 -37% | 55.1 -91% | 42.3 -46% | 46.2 -60% | 41.4 -43% |
| Witcher 3 ultra * | 52.6 | 53.2 -1% | 49.2 6% | 51.1 3% | ||
| Load Maximum * | 52.5 | 53.2 -1% | 61.5 -17% | 42.7 19% | 49.4 6% | 51.4 2% |
* ... smaller is better
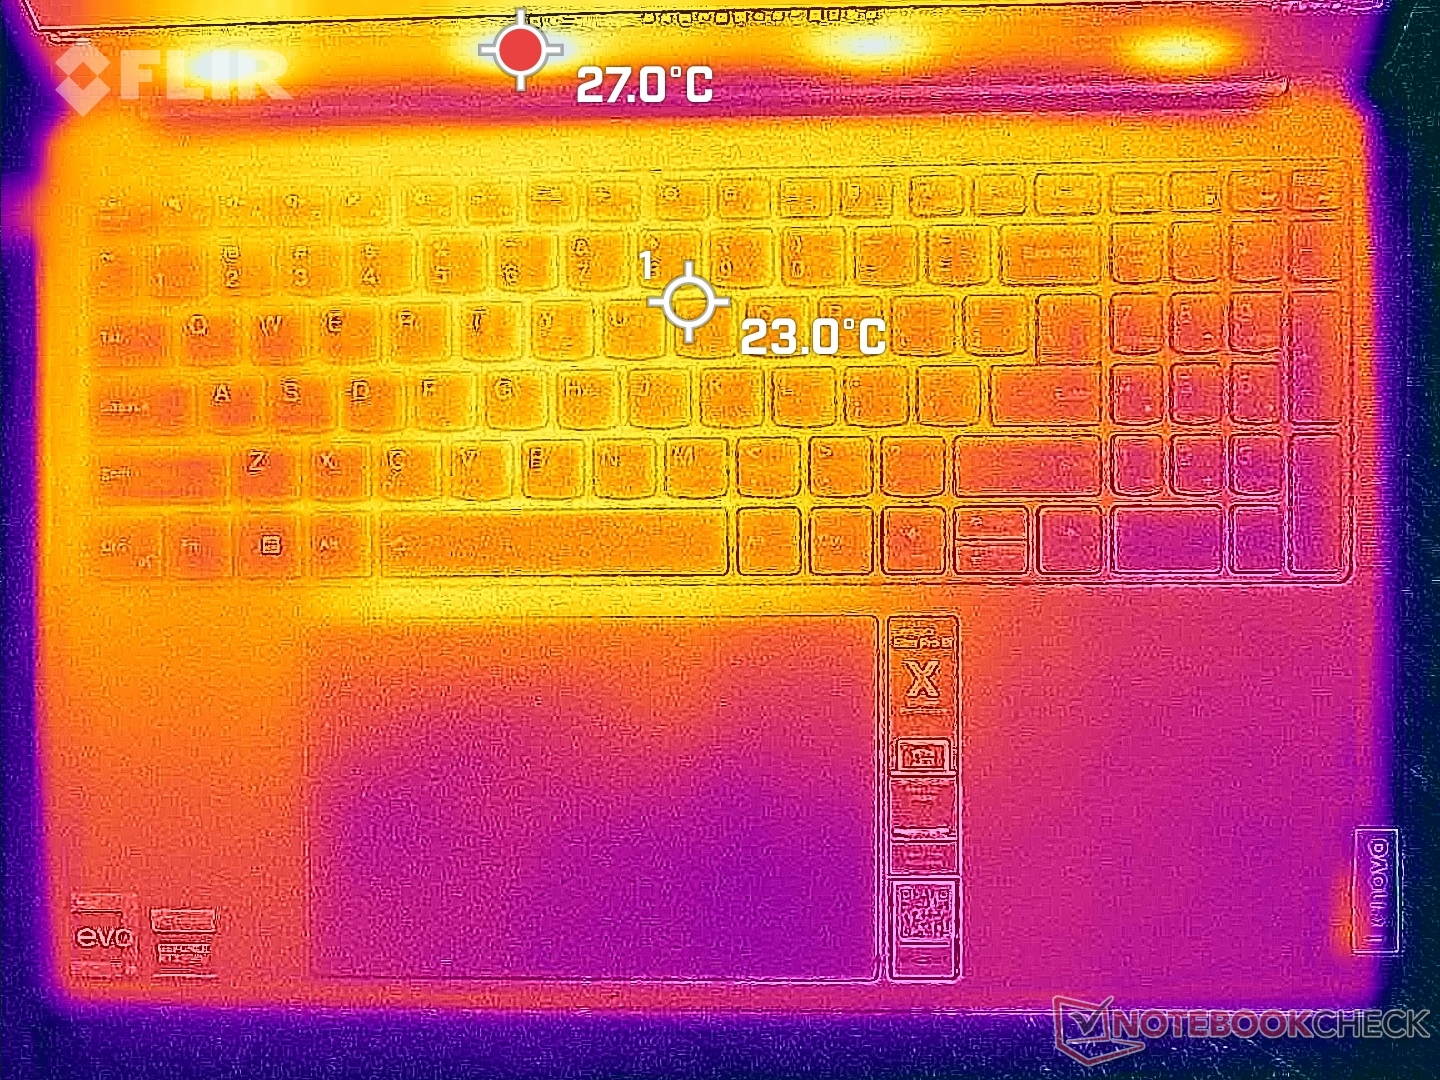
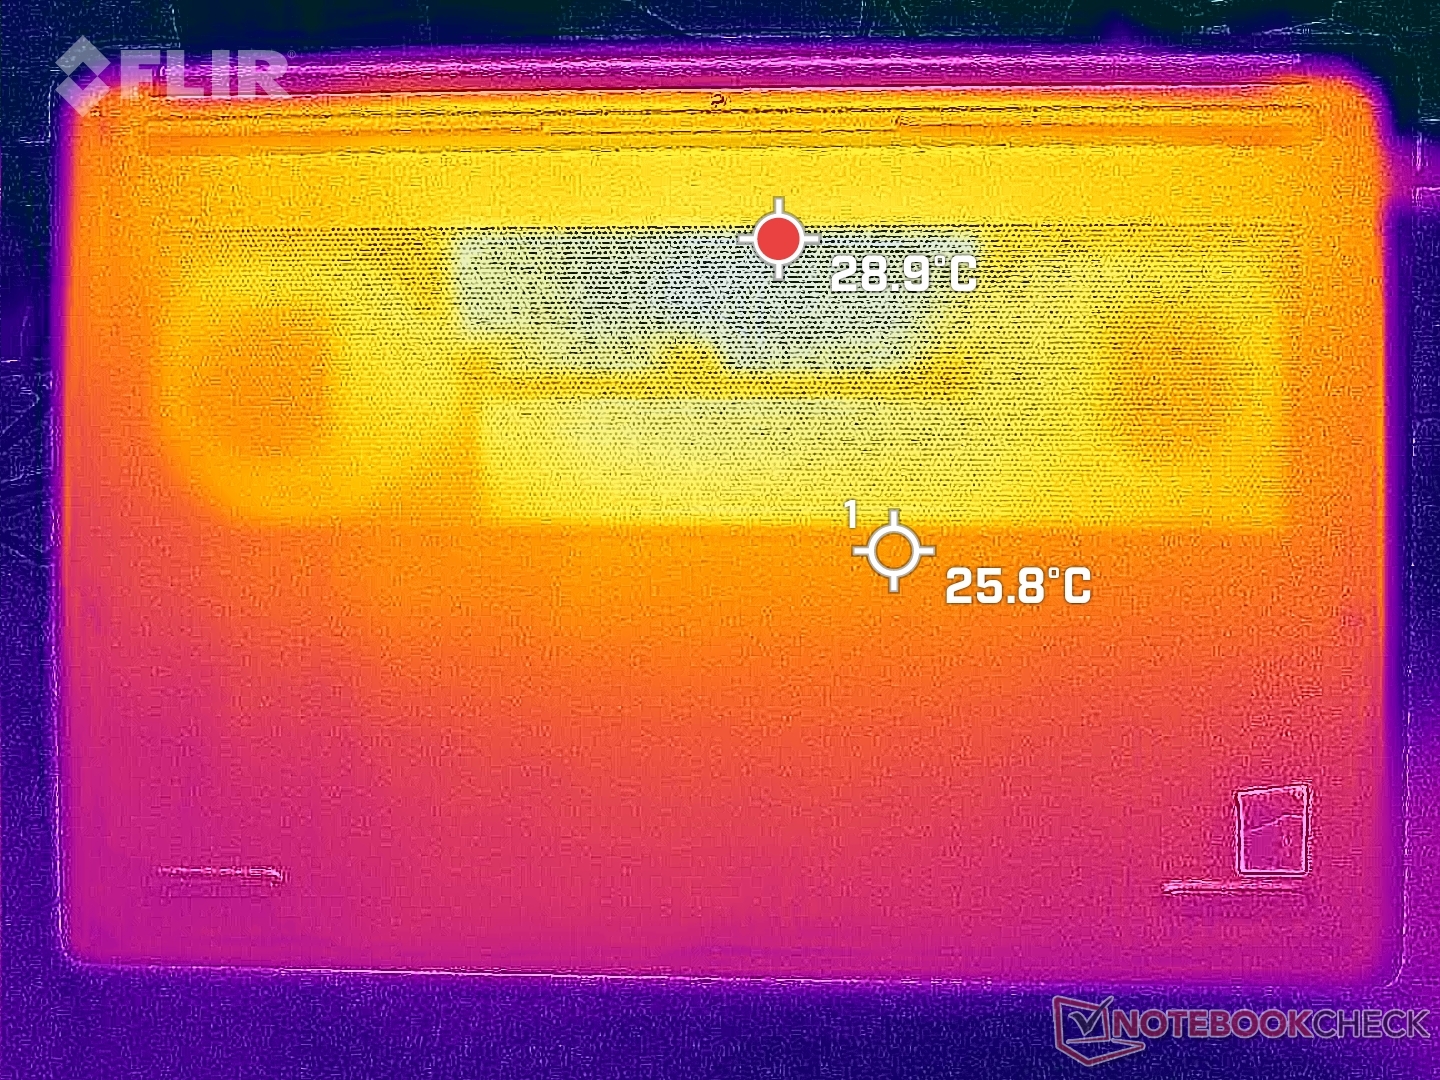
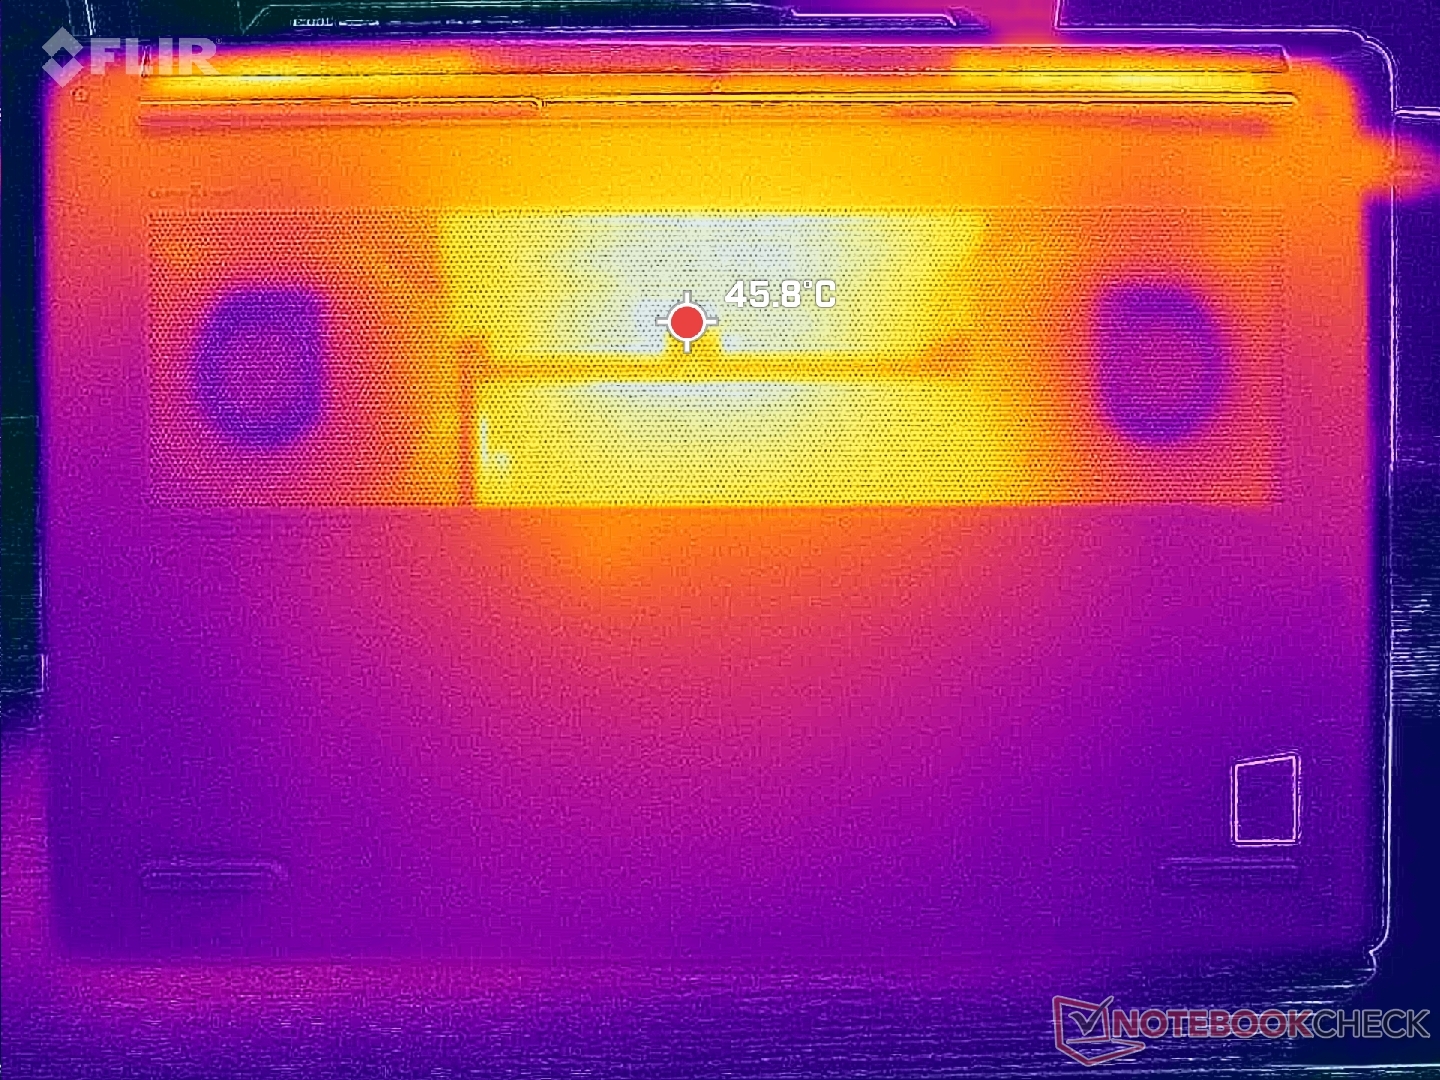
Temperature
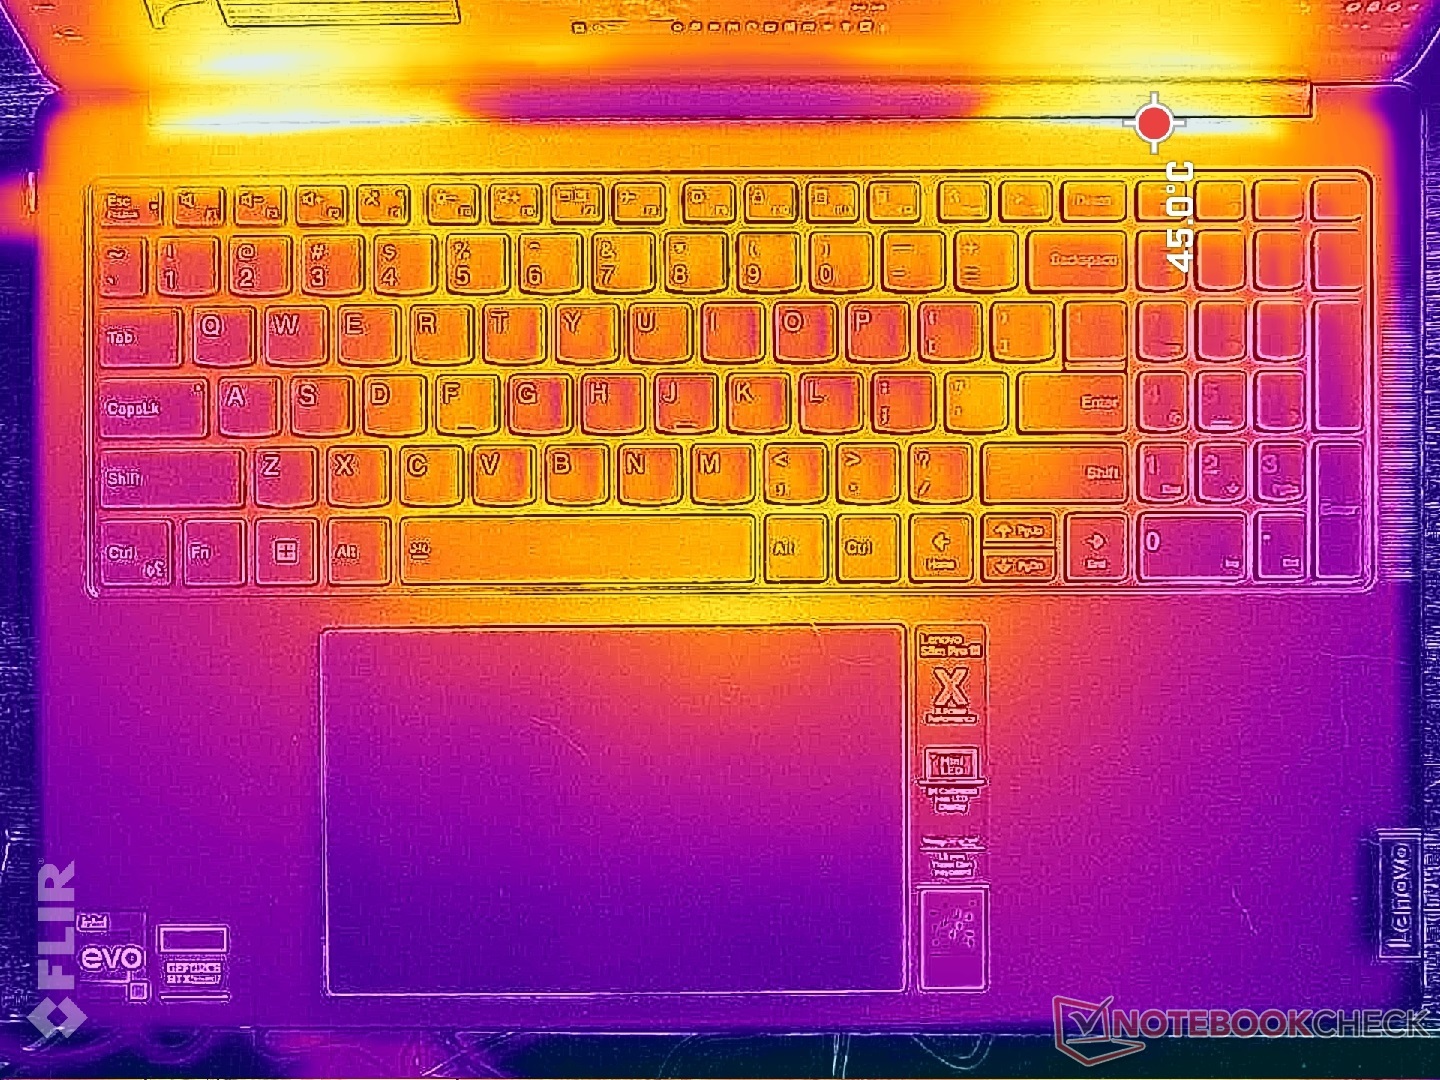
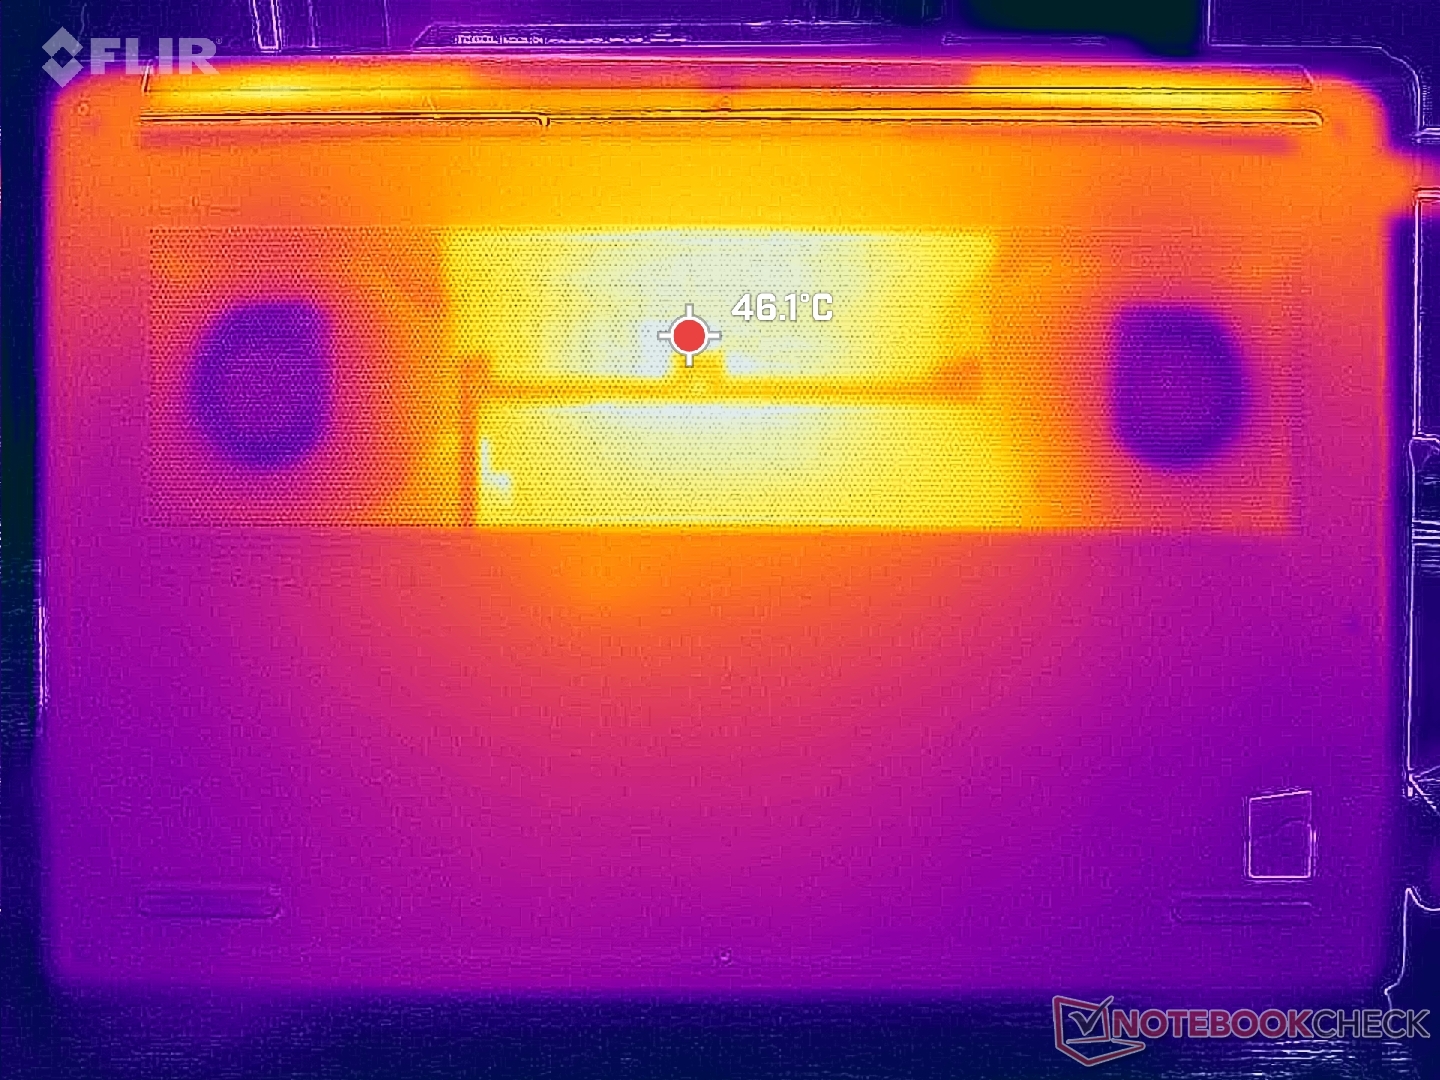
Surface temperatures are warmest near the center regions where hot spots can reach over 38 C and 44 C on the top and bottom, respectively. The keyboard on the Lenovo isn't as warm as on the Inspiron 16 Plus 7620 where the center can reach 50 C when under load.
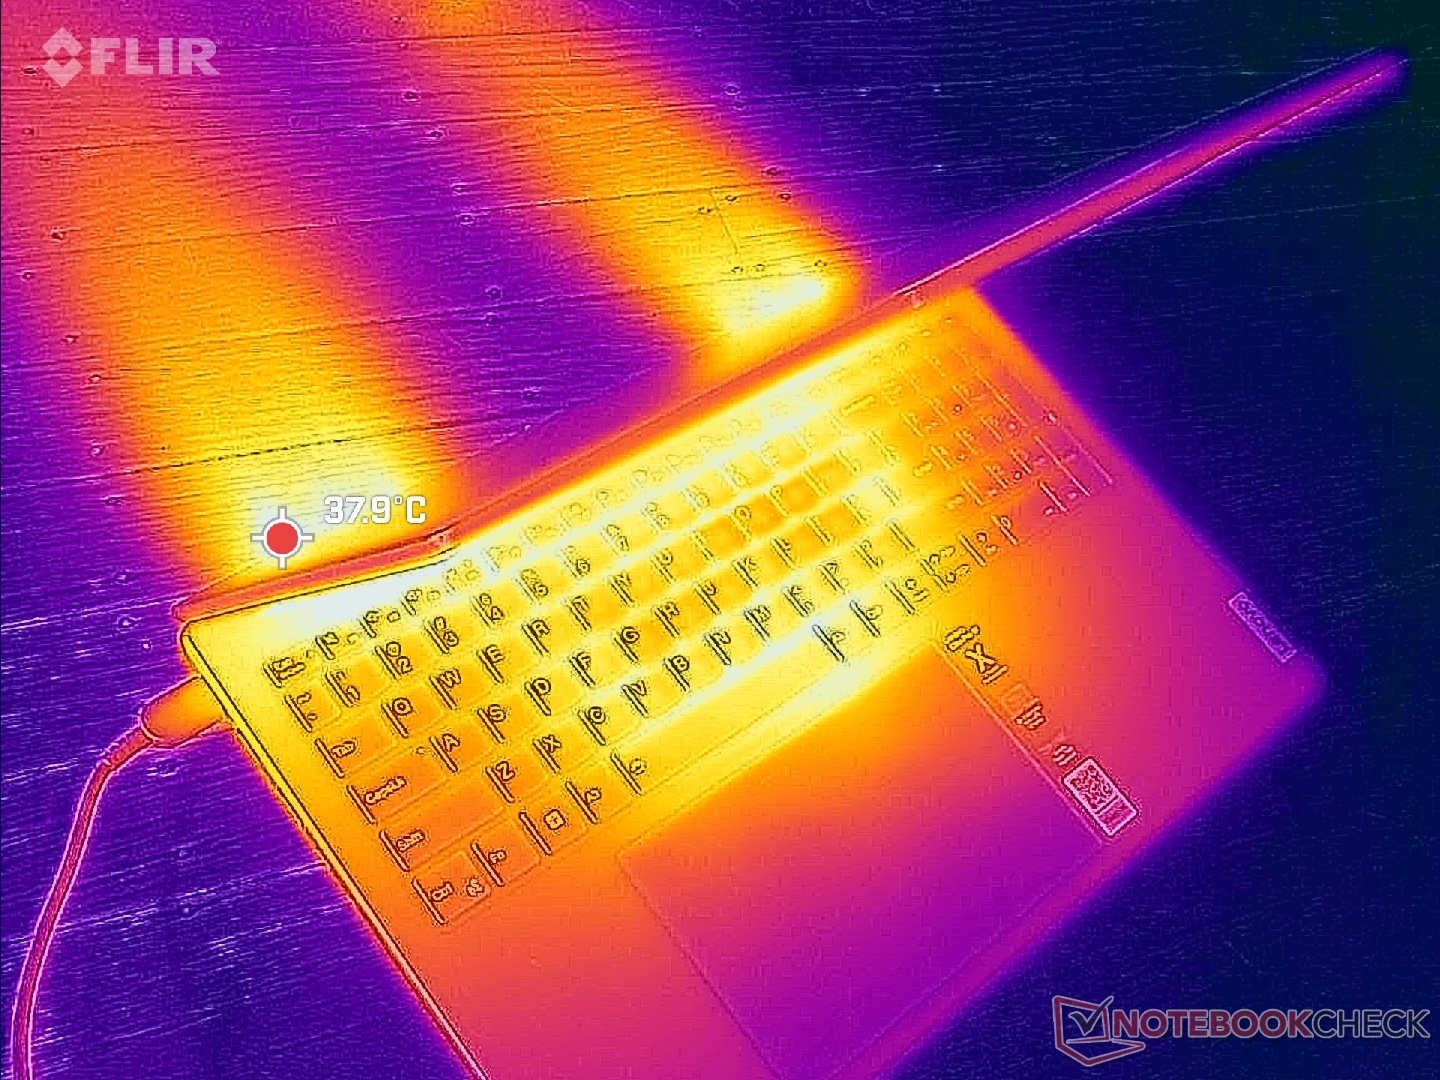
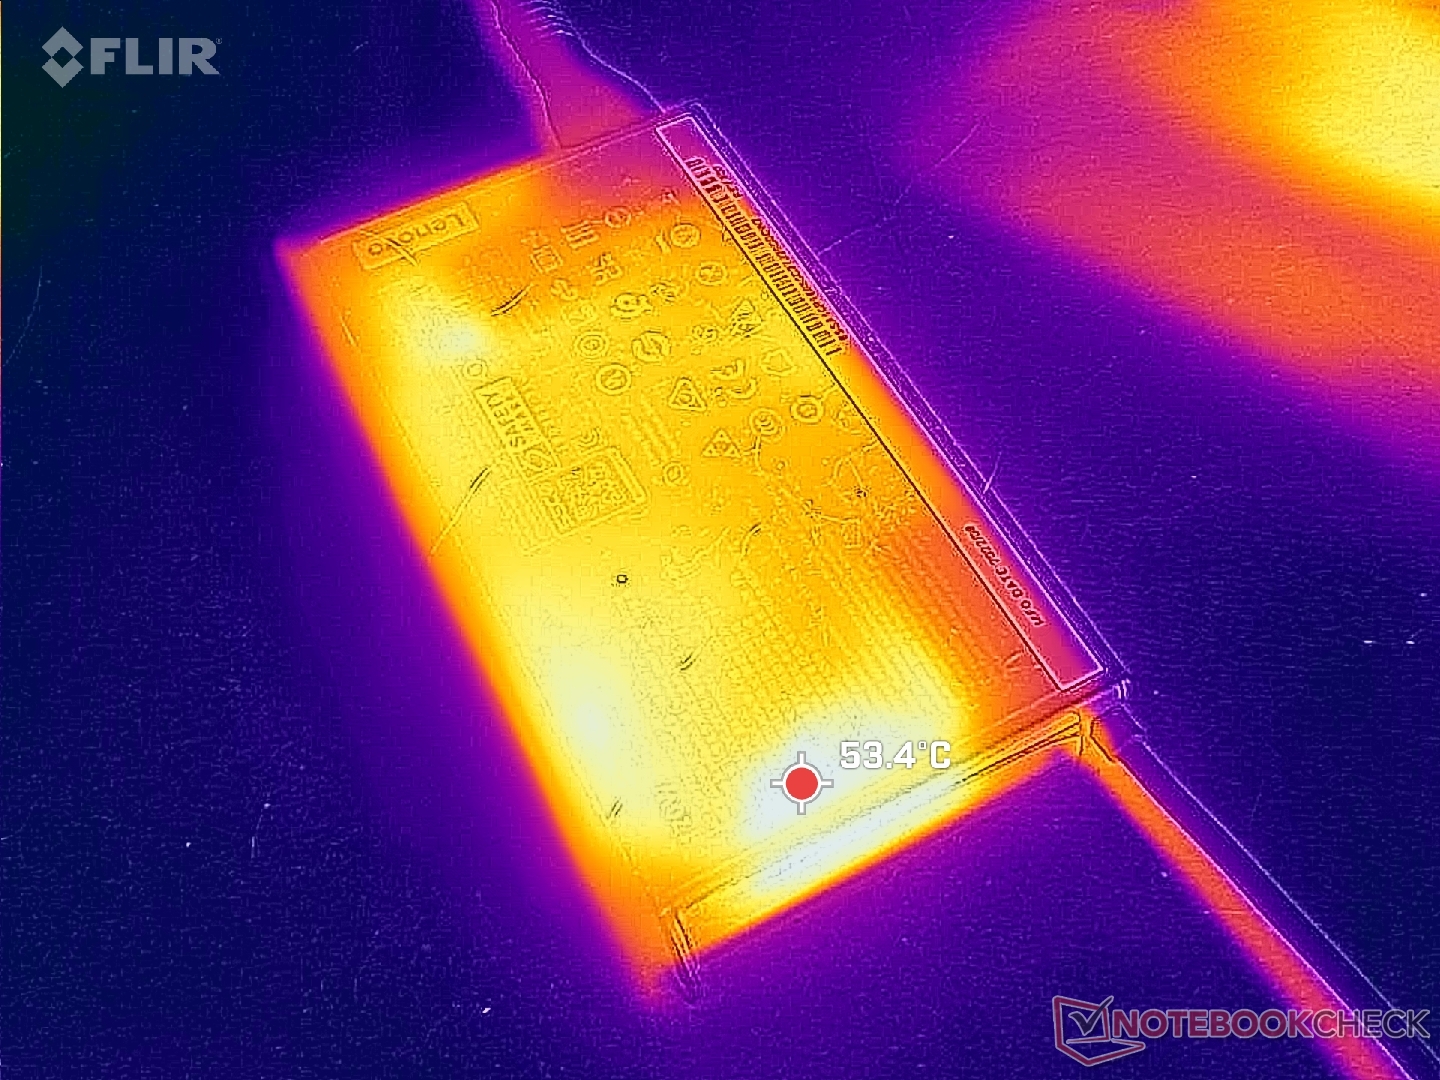
(+) The maximum temperature on the upper side is 37.8 °C / 100 F, compared to the average of 36.9 °C / 98 F, ranging from 21.1 to 71 °C for the class Multimedia.
(±) The bottom heats up to a maximum of 44.8 °C / 113 F, compared to the average of 39.2 °C / 103 F
(+) In idle usage, the average temperature for the upper side is 28.8 °C / 84 F, compared to the device average of 31.2 °C / 88 F.
(±) Playing The Witcher 3, the average temperature for the upper side is 35.4 °C / 96 F, compared to the device average of 31.2 °C / 88 F.
(+) The palmrests and touchpad are reaching skin temperature as a maximum (32 °C / 89.6 F) and are therefore not hot.
(-) The average temperature of the palmrest area of similar devices was 28.9 °C / 84 F (-3.1 °C / -5.6 F).

| Lenovo Slim Pro 9i 16IRP8 Intel Core i9-13905H, NVIDIA GeForce RTX 4050 Laptop GPU | Lenovo Yoga Pro 9 16-IRP G8 Intel Core i7-13705H, NVIDIA GeForce RTX 4060 Laptop GPU | Asus VivoBook Pro 16 Intel Core i7-12700H, NVIDIA GeForce RTX 3050 Ti Laptop GPU | Acer Swift Edge SFE16-42-R1GM AMD Ryzen 7 7735U, AMD Radeon 680M | Dell Inspiron 16 Plus 7620 Intel Core i7-12700H, NVIDIA GeForce RTX 3050 Ti Laptop GPU | HP Envy 16 h0112nr Intel Core i7-12700H, NVIDIA GeForce RTX 3060 Laptop GPU | |
|---|---|---|---|---|---|---|
| Heat | 0% | -16% | -11% | -5% | -8% | |
| Maximum Upper Side * | 37.8 | 41.6 -10% | 44.2 -17% | 49.4 -31% | 46 -22% | 45.2 -20% |
| Maximum Bottom * | 44.8 | 50 -12% | 53 -18% | 44.7 -0% | 45.8 -2% | 44 2% |
| Idle Upper Side * | 30.6 | 26.8 12% | 32.1 -5% | 34 -11% | 29.2 5% | 33.6 -10% |
| Idle Bottom * | 31 | 27.9 10% | 38.4 -24% | 31.6 -2% | 31 -0% | 32.6 -5% |
* ... smaller is better
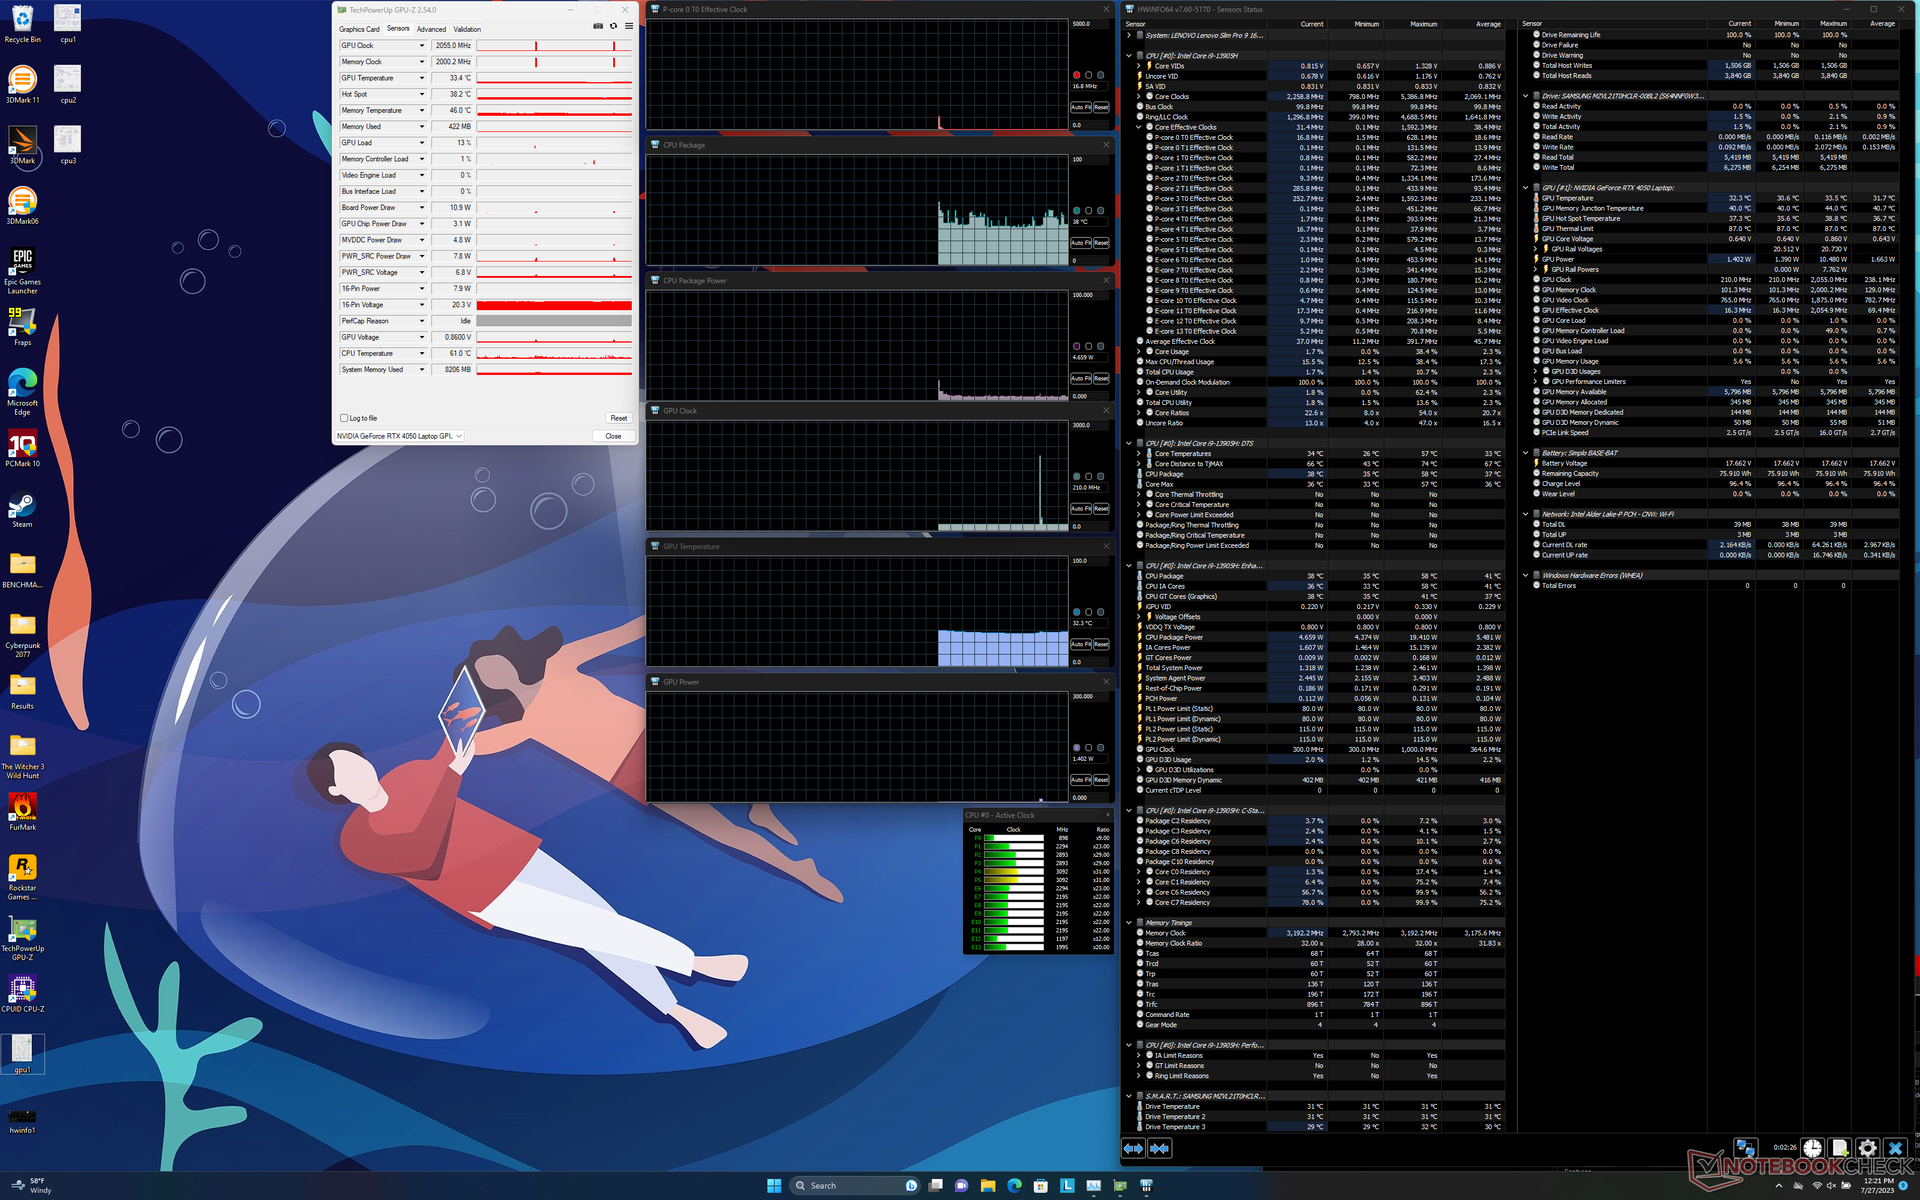
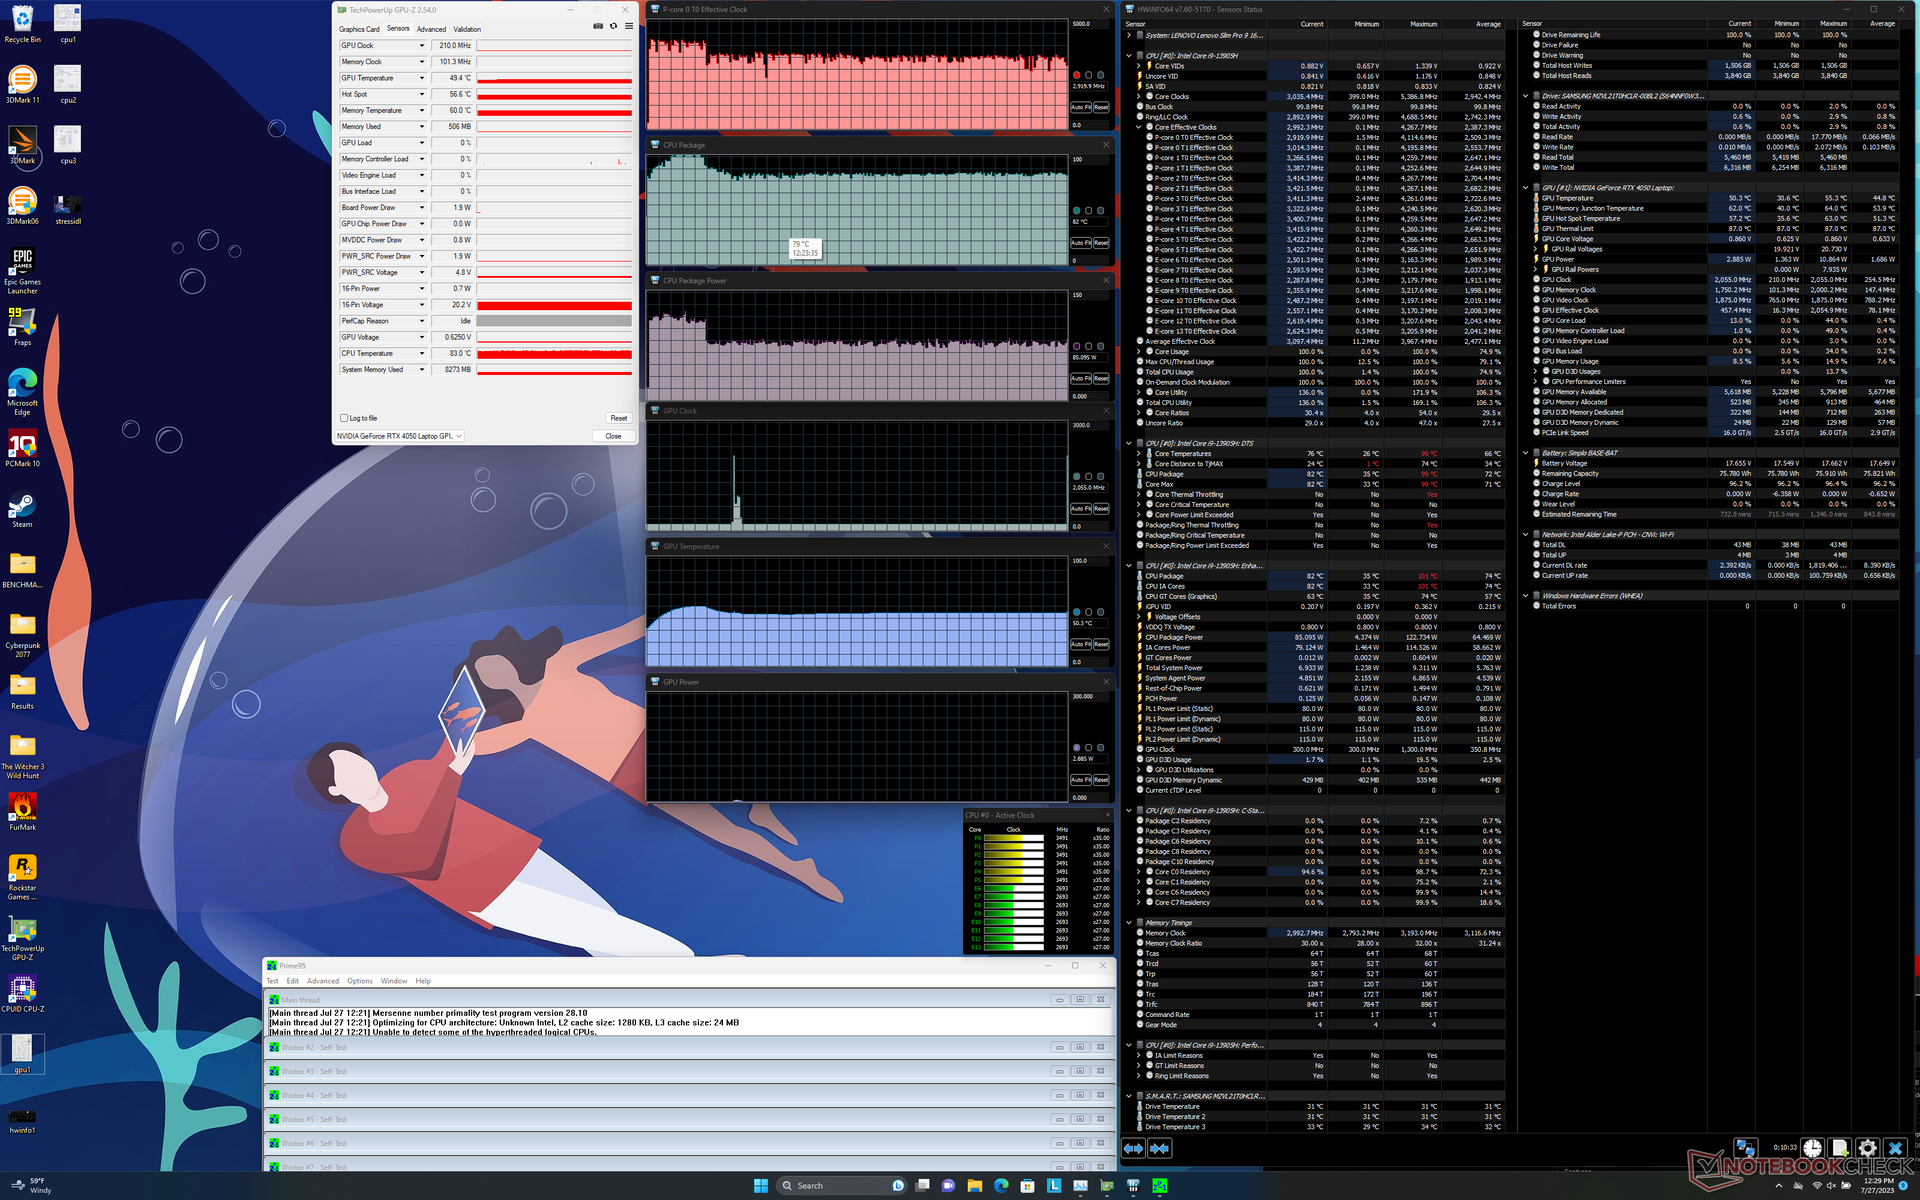
Stress Test
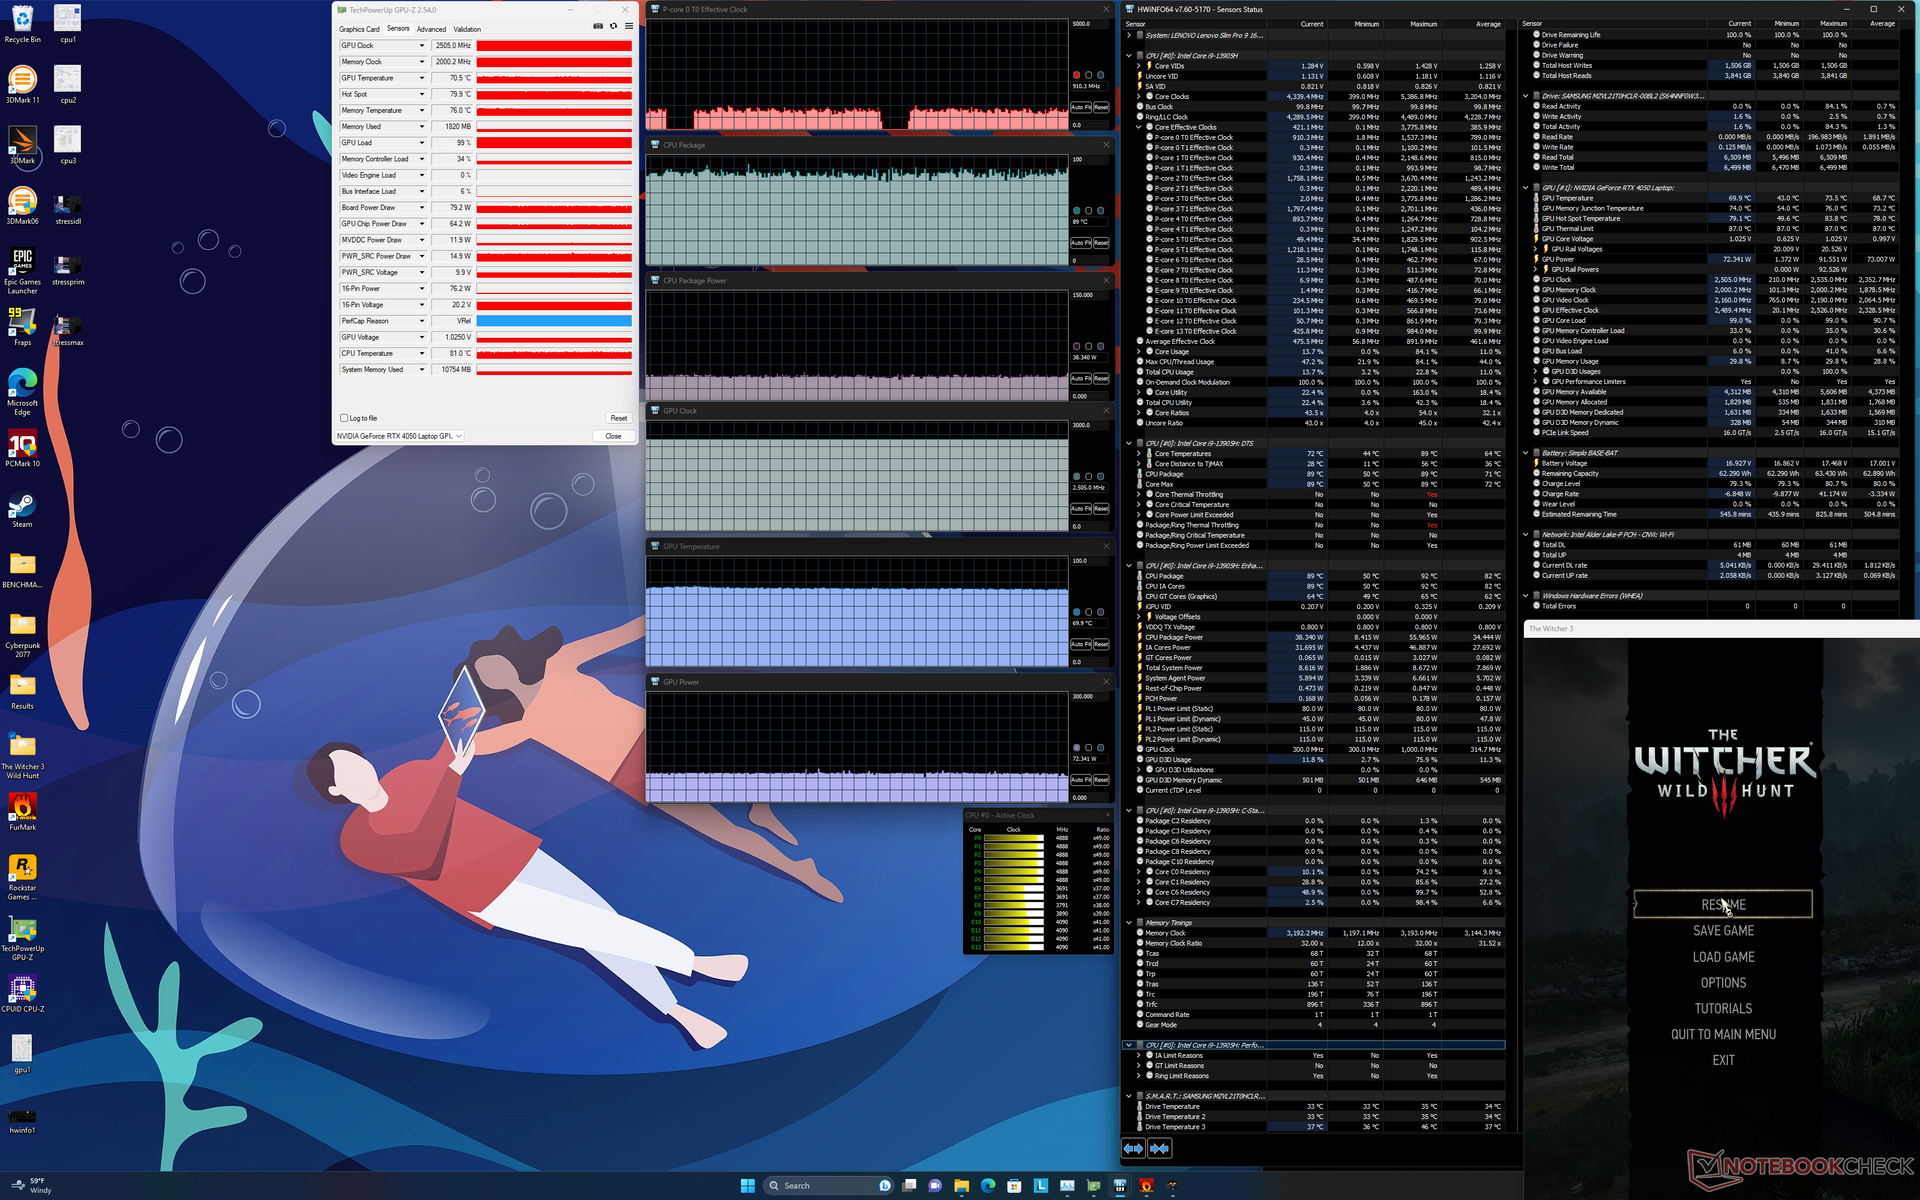
The CPU would boost to 4 GHz, 120 W, and 100 C for the first 40 seconds when initiating Prime95 stress. Since 100 C isn't ideal, clock rates and board power draw would quickly fall to just 3.0 to 3.2 GHz and 85 W, respectively, in order to maintain a more reasonable core temperature of 82 C. The high Turbo Boost clock rates of the Core i9-13905H are therefore unsustainable on the Slim Pro 9i due to cooling limitations.
The Nvidia GPU would stabilize at 2505 MHz, 70 C, and 72 W when running Witcher 3 on Performance mode compared to 2460 MHz, 62 C, and 56 W on Balanced mode. GPU power draw can approach 92 W at its peak against its TGP target of 100 W.

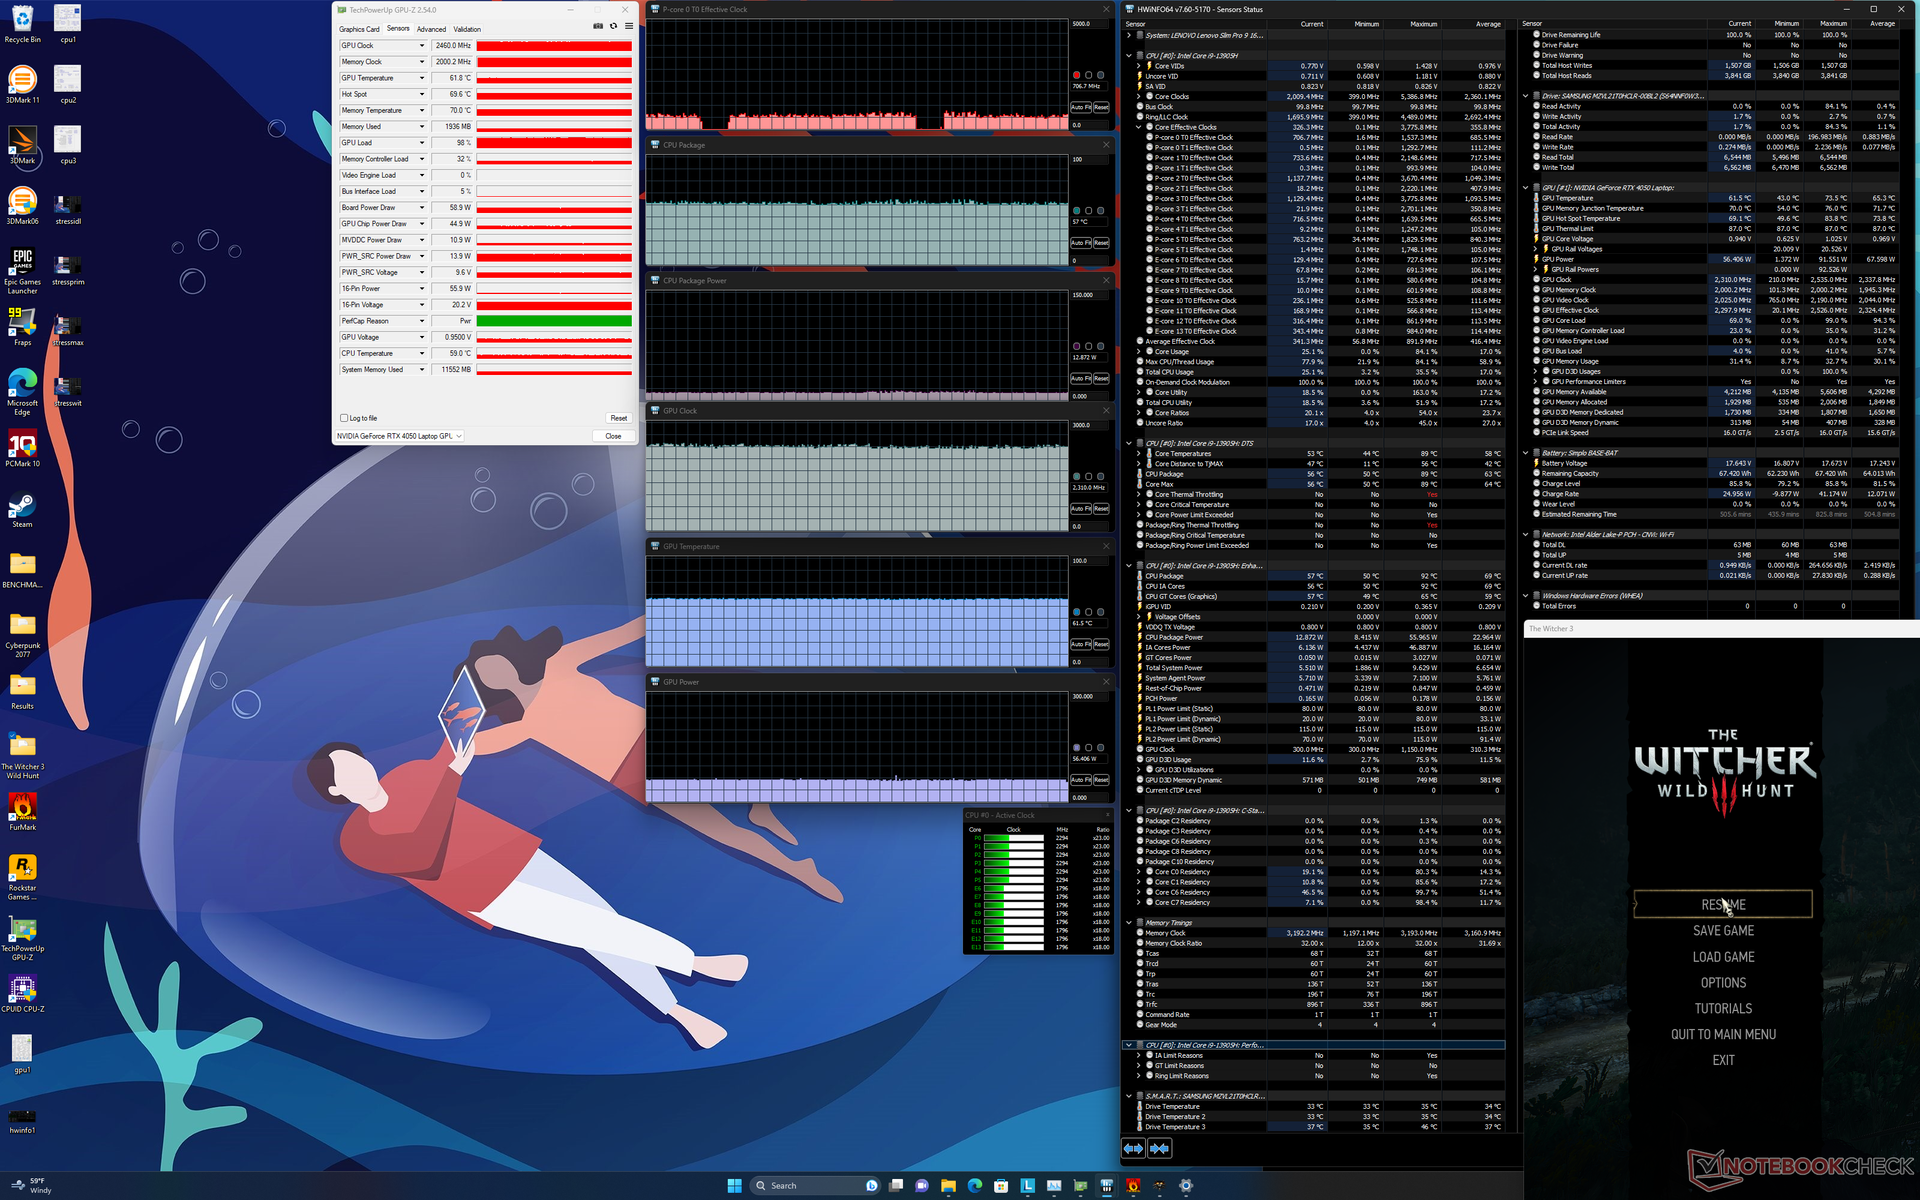
| CPU Clock (GHz) | GPU Clock (MHz) | Average CPU Temperature (°C) | Average GPU Temperature (°C) | |
| System Idle | -- | -- | 38 | 32 |
| Prime95 Stress | ~3.0 | -- | 82 | 50 |
| Prime95 + FurMark Stress | ~2.4 | 2265 | 77 | 77 |
| Witcher 3 Stress (Performance mode) | ~0.9 | 2505 | 89 | 70 |
| Witcher 3 Stress (Balanced mode) | ~0.7 | 2460 | 57 | 62 |
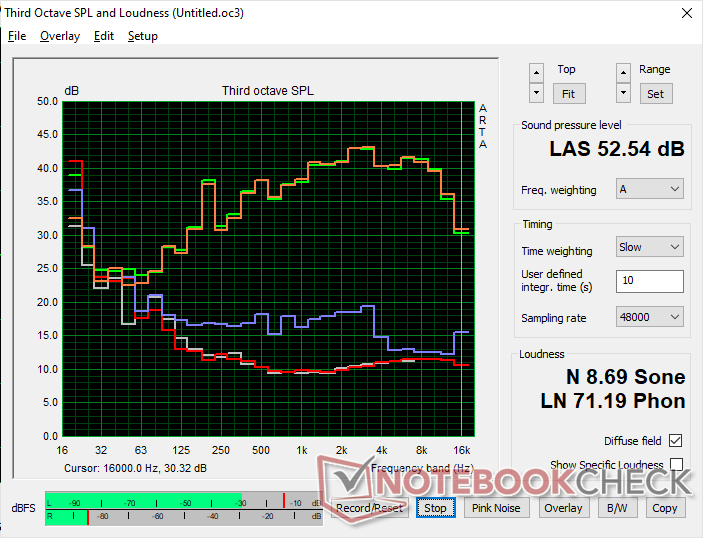
Speakers
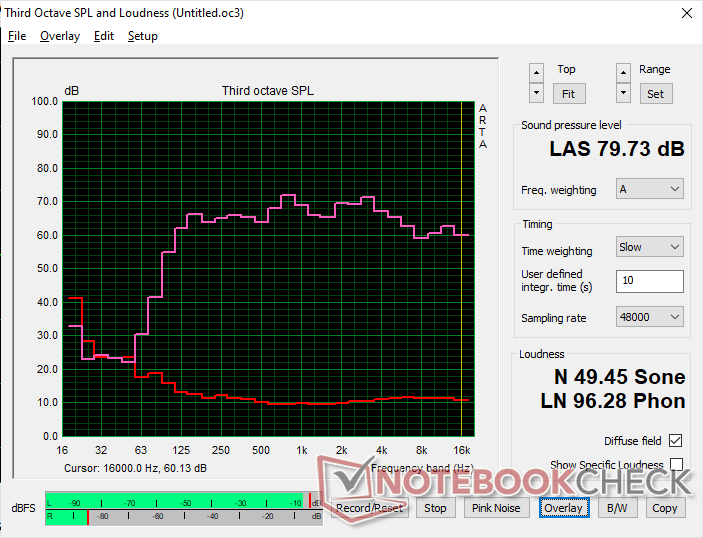
Lenovo Slim Pro 9i 16IRP8 audio analysis
(±) | speaker loudness is average but good (79.7 dB)
Bass 100 - 315 Hz
(+) | good bass - only 2.8% away from median
(±) | linearity of bass is average (8.9% delta to prev. frequency)
Mids 400 - 2000 Hz
(+) | balanced mids - only 2.4% away from median
(+) | mids are linear (4.9% delta to prev. frequency)
Highs 2 - 16 kHz
(+) | balanced highs - only 3.6% away from median
(+) | highs are linear (4.3% delta to prev. frequency)
Overall 100 - 16.000 Hz
(+) | overall sound is linear (7.3% difference to median)
Compared to same class
» 3% of all tested devices in this class were better, 1% similar, 97% worse
» The best had a delta of 5%, average was 18%, worst was 45%
Compared to all devices tested
» 1% of all tested devices were better, 0% similar, 99% worse
» The best had a delta of 4%, average was 26%, worst was 134%
Apple MacBook Pro 16 2021 M1 Pro audio analysis
(+) | speakers can play relatively loud (84.7 dB)
Bass 100 - 315 Hz
(+) | good bass - only 3.8% away from median
(+) | bass is linear (5.2% delta to prev. frequency)
Mids 400 - 2000 Hz
(+) | balanced mids - only 1.3% away from median
(+) | mids are linear (2.1% delta to prev. frequency)
Highs 2 - 16 kHz
(+) | balanced highs - only 1.9% away from median
(+) | highs are linear (2.7% delta to prev. frequency)
Overall 100 - 16.000 Hz
(+) | overall sound is linear (4.6% difference to median)
Compared to same class
» 0% of all tested devices in this class were better, 0% similar, 100% worse
» The best had a delta of 5%, average was 18%, worst was 45%
Compared to all devices tested
» 0% of all tested devices were better, 0% similar, 100% worse
» The best had a delta of 4%, average was 26%, worst was 134%
Energy Management
Power Consumption
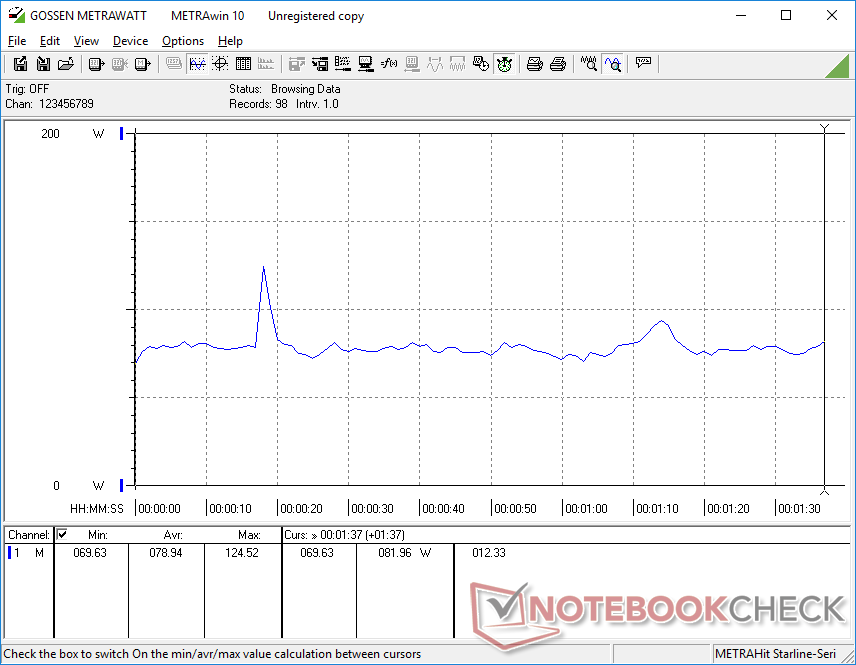
Power consumption can range from 16 W when on the minimum brightness setting with the iGPU active up to 30 W when displaying an all-white image on the maximum brightness setting with the dGPU active. It's therefore recommended to be more mindful of the brightness settings and colors if battery life is a concern much like on OLED panels.
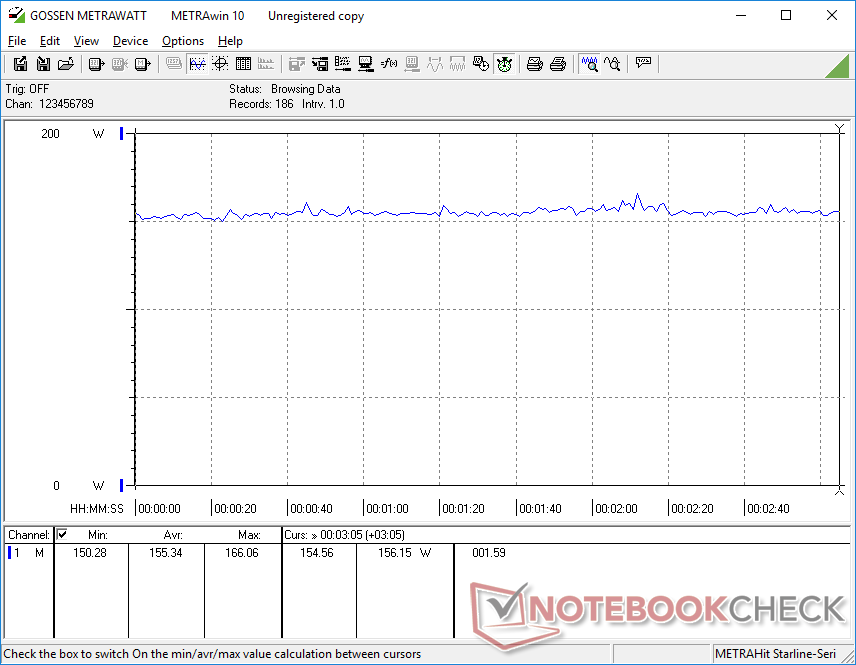
Power consumption when gaming is almost identical to what we recorded on the Yoga Pro 9i even though the latter offers up to 20 percent faster graphics performance. Both the RTX 4050 and RTX 4060 configurations target 100 W TGP each which would explain their similar consumption levels when the GPU is under load.
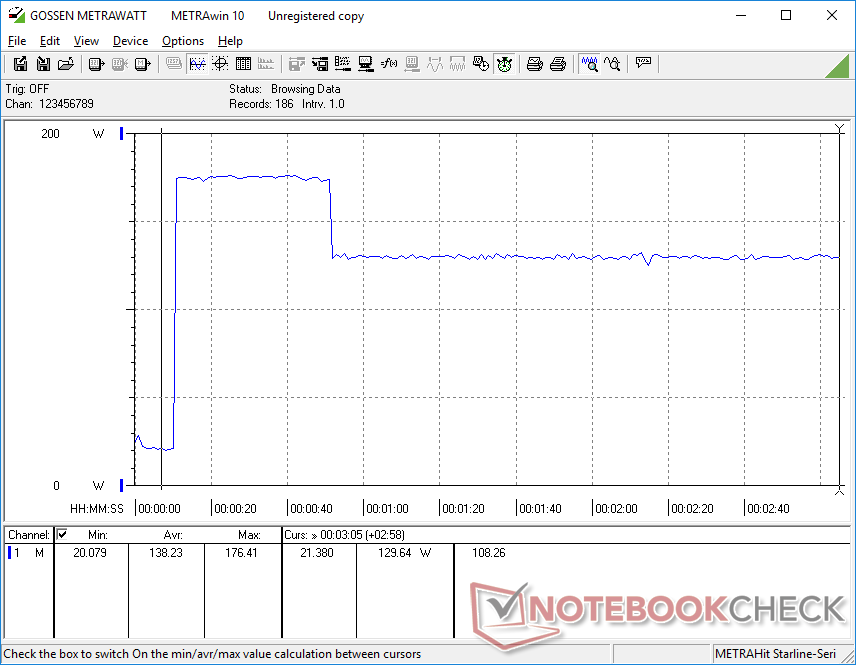
Our Core i9-13905H peaks slightly higher than the Core i7-13705H when launching Prime95 before eventually settling at similar levels.

| Off / Standby | |
| Idle | |
| Load |
|
| Lenovo Slim Pro 9i 16IRP8 i9-13905H, NVIDIA GeForce RTX 4050 Laptop GPU, Samsung PM9A1 MZVL21T0HCLR, Mini-LED, 3200x2000, 16.00 | Lenovo Yoga Pro 9 16-IRP G8 i7-13705H, NVIDIA GeForce RTX 4060 Laptop GPU, Samsung PM9A1 MZVL21T0HCLR, Mini-LED, 3200x2000, 16.00 | Asus VivoBook Pro 16 i7-12700H, GeForce RTX 3050 Ti Laptop GPU, Intel SSD 670p SSDPEKNU010TZ, IPS, 2560x1600, 16.00 | Acer Swift Edge SFE16-42-R1GM R7 7735U, Radeon 680M, Micron 3400 1TB MTFDKBA1T0TFH, OLED, 3840x2400, 16.00 | Dell Inspiron 16 Plus 7620 i7-12700H, GeForce RTX 3050 Ti Laptop GPU, Kioxia BG5 KBG50ZNS512G, IPS, 3072x1920, 16.00 | HP Envy 16 h0112nr i7-12700H, GeForce RTX 3060 Laptop GPU, Micron 3400 1TB MTFDKBA1T0TFH, OLED, 3840x2400, 16.00 | |
|---|---|---|---|---|---|---|
| Power Consumption | 12% | 22% | 61% | 29% | 10% | |
| Idle Minimum * | 16 | 10.9 32% | 8.7 46% | 8.6 46% | 6.8 57% | 10 37% |
| Idle Average * | 30 | 22.6 25% | 13.1 56% | 7.7 74% | 9.6 68% | 10.9 64% |
| Idle Maximum * | 30.4 | 23.5 23% | 18.3 40% | 9.3 69% | 17 44% | 27.8 9% |
| Load Average * | 78.9 | 84.6 -7% | 116 -47% | 47.9 39% | 117.5 -49% | 116.4 -48% |
| Witcher 3 ultra * | 155.3 | 159.5 -3% | 117.6 24% | 46.3 70% | 113.1 27% | 133.7 14% |
| Load Maximum * | 180.4 | 177.3 2% | 162 10% | 56 69% | 137.4 24% | 209.8 -16% |
* ... smaller is better
Power Consumption Witcher 3 / Stresstest
Power Consumption external Monitor
Battery Life
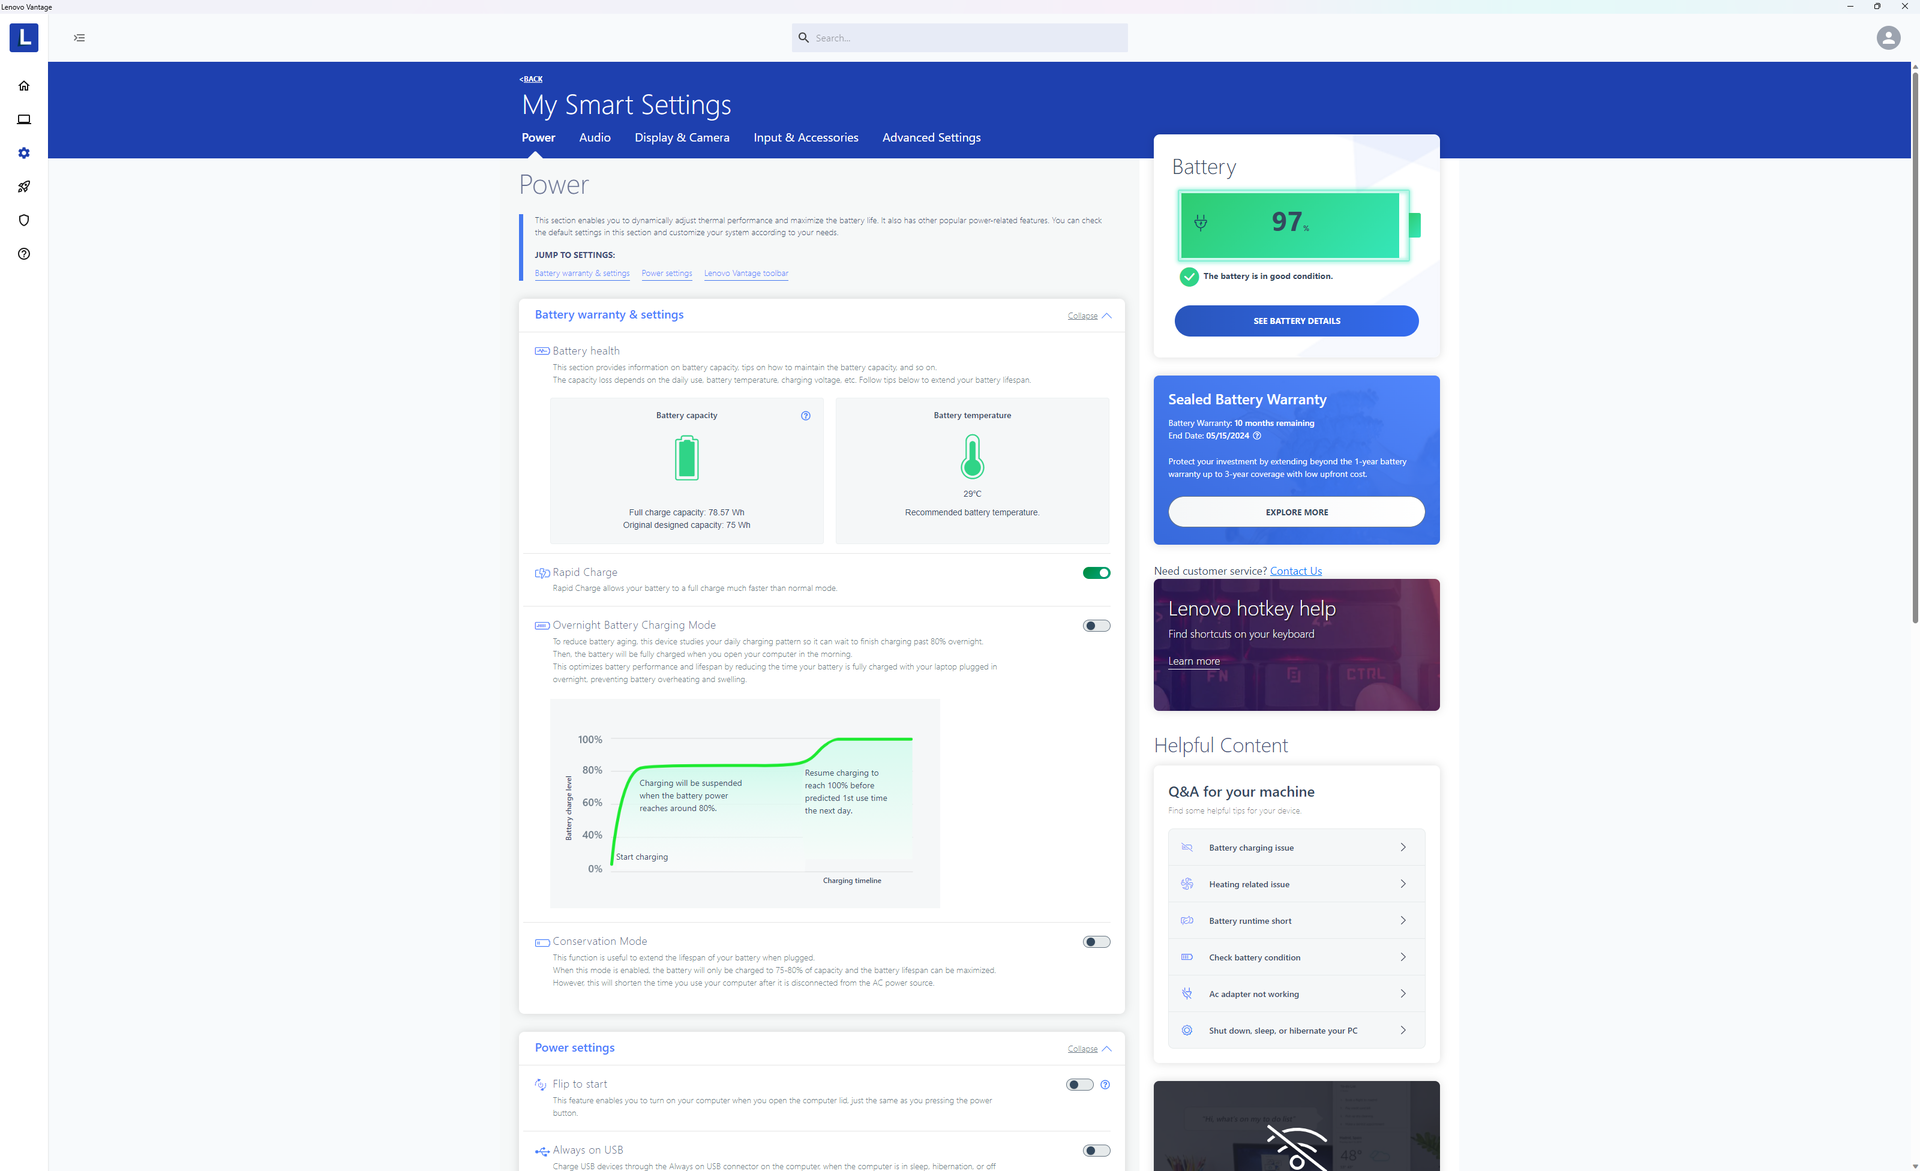
Runtimes are essentially identical to what we recorded on the Yoga Pro 9 16 at about 6.5 hours of real-world browsing. Charging from empty to full takes about 90 minutes even with Rapid Charge enabled.
Battery charge may drop if running demanding loads even when connected to mains. During our hour-long Prime95 and FurMark test, for example, our battery charge would actually drop from 100 percent to 79 percent indicating that the model could have benefited from a higher capacity AC adapter.
Certain USB-C adapters may charge the system. Our 130 W Dell XPS 15 USB-C adapter, for example, appears to be incompatible while the 140 W Lenovo USB-C adapter would work without any issues.
| Lenovo Slim Pro 9i 16IRP8 i9-13905H, NVIDIA GeForce RTX 4050 Laptop GPU, 75 Wh | Lenovo Yoga Pro 9 16-IRP G8 i7-13705H, NVIDIA GeForce RTX 4060 Laptop GPU, 75 Wh | Asus VivoBook Pro 16 i7-12700H, GeForce RTX 3050 Ti Laptop GPU, 70 Wh | Acer Swift Edge SFE16-42-R1GM R7 7735U, Radeon 680M, 54 Wh | Dell Inspiron 16 Plus 7620 i7-12700H, GeForce RTX 3050 Ti Laptop GPU, 86 Wh | HP Envy 16 h0112nr i7-12700H, GeForce RTX 3060 Laptop GPU, 83 Wh | |
|---|---|---|---|---|---|---|
| Battery Runtime | -3% | 10% | 11% | 46% | 19% | |
| WiFi v1.3 | 395 | 385 -3% | 435 10% | 437 11% | 575 46% | 472 19% |
| H.264 | 449 | 518 | ||||
| Load | 44 | 89 | 69 | 94 | ||
| Reader / Idle | 653 | 1114 | 1068 |
Pros
Cons
Verdict — Core i7 With GeForce RTX 4060 Is The Better Deal

There are at least two configurations of the Slim Pro 9i 16 available at the moment: one with the Core i7-13705H and GeForce RTX 4060 and one with the Core i9-13905H and GeForce RTX 4050. Since the prices of both are so similar, the Core i7 with RTX 4060 option is highly recommended over the Core i9 with RTX 4050 option since the Core i7 performs almost identically to the Core i9. Meanwhile, jumping from the RTX 4050 to the RTX 4060 provides a greater and more noticeable boost in graphics performance.
The Core i7 and GeForce RTX 4060 configuration is the sweet spot for those considering the Lenovo Slim Pro 9i 16.
Other aspects of the model are comparable to alternatives like the HP Envy 16 or MacBook Pro 16 ranging from the wide port options to the overall fast performance, dense weight, and reasonable dimensions. However, you won't get the user-expandable RAM of the Envy 16 or the pre-calibrated display and longer battery life of the MacBook Pro.
Price and Availability
Lenovo is now shipping its Slim Pro 9i 16 for $2200 USD with the higher-end GeForce RTX 4060. The model is also available at Best Buy.
Lenovo Slim Pro 9i 16IRP8
-
08/10/2023 v7
Allen Ngo


Transparency
The present review sample was made available to the author as a loan by the manufacturer or a shop for the purposes of review. The lender had no influence on this review, nor did the manufacturer receive a copy of this review before publication. There was no obligation to publish this review.
Pricecompare
