 Deutsch
 English
 Español
 Français
 Italiano
 Nederlands
 Polski
 Português
 Русский
 Türkçe
 Svenska
 Chinese
 Magyar
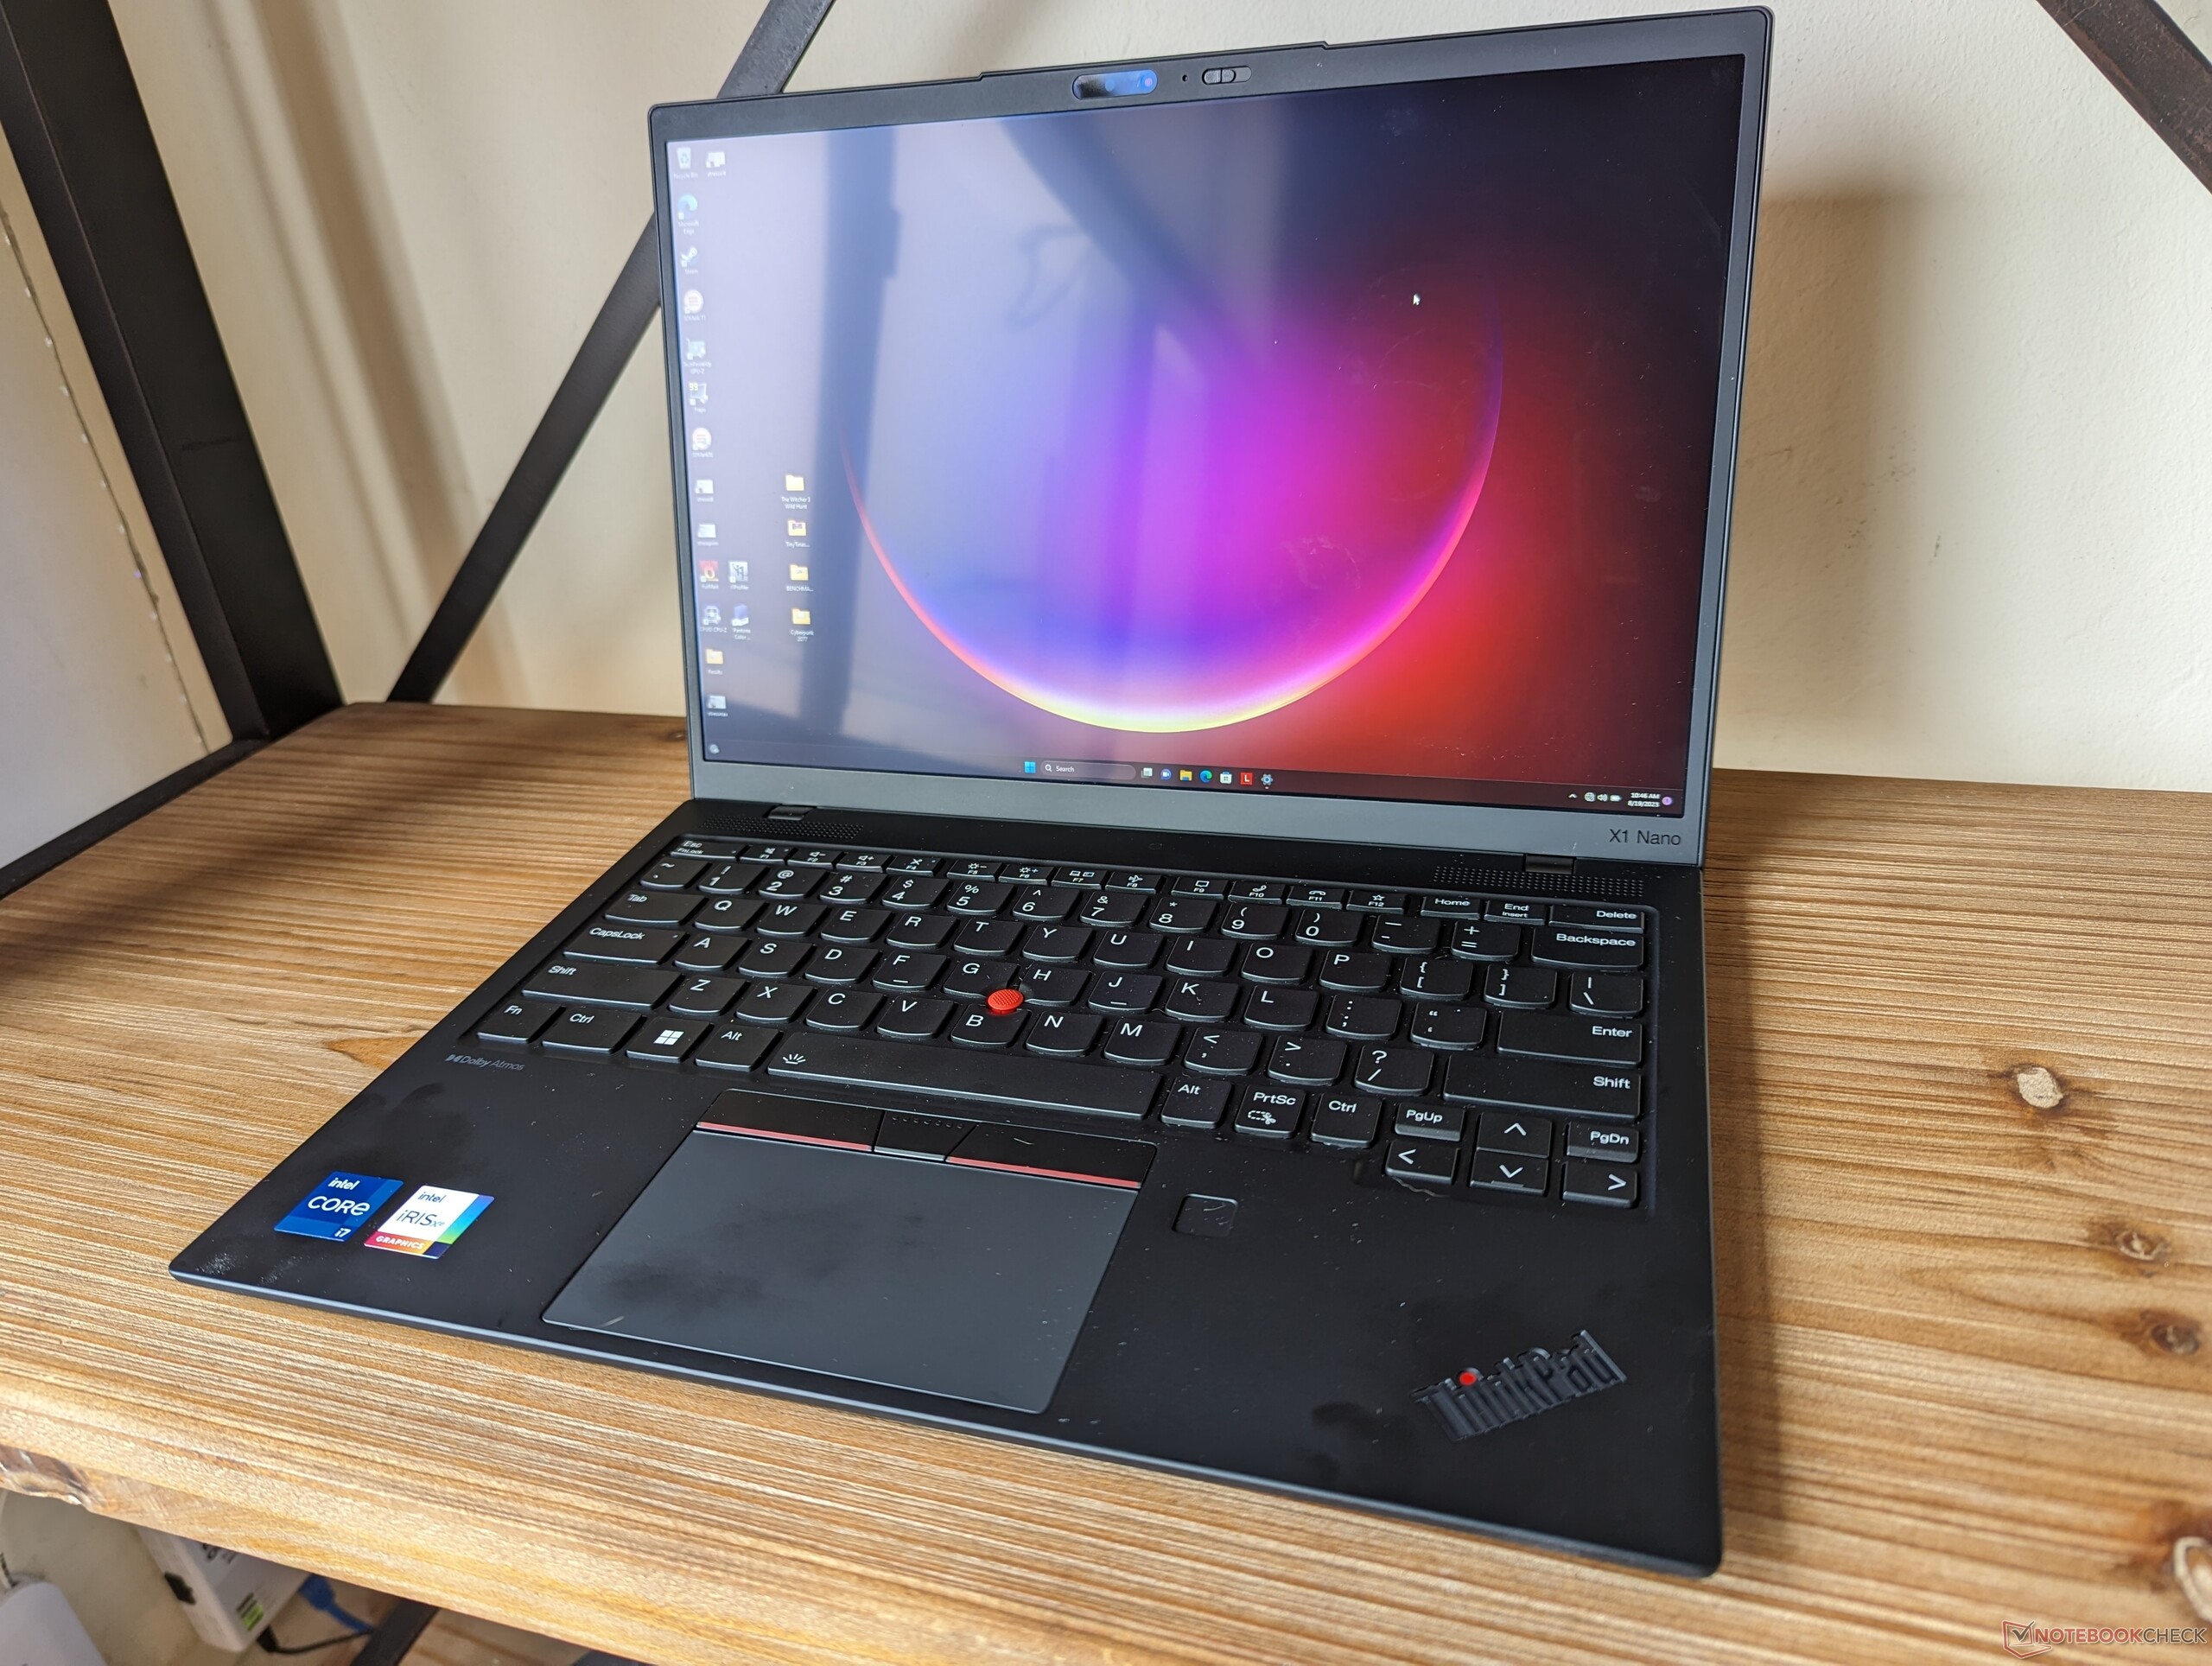
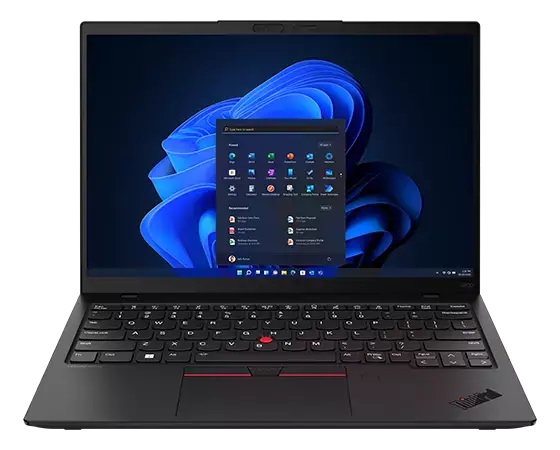
Lenovo ThinkPad X1 Nano Gen 3 laptop review: Intel Core-P at under 1 kg

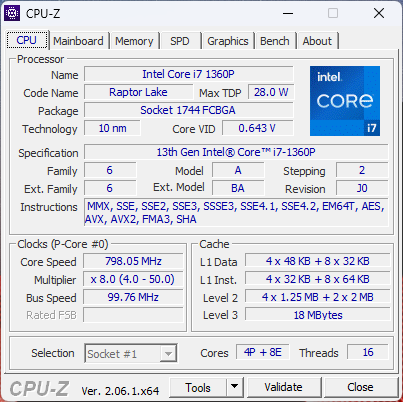
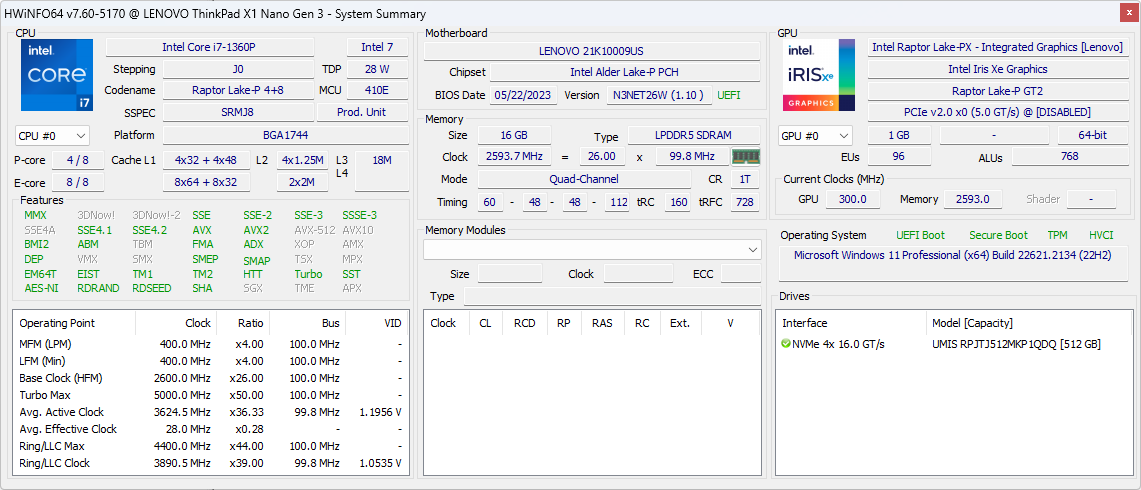
The ThinkPad X1 Nano Gen 3 succeeds last year's ThinkPad X1 Nano Gen 2 by replacing the 12th gen Alder Lake CPUs with newer 13th gen Raptor Lake options. Other than the CPU swap, the super-light chassis remains identical and so our existing comments on the ports and other physical aspects of the X1 Nano Gen 2 still apply here on the X1 Nano Gen 3. This page will instead focus on the performance differences between the two models as well as any other notable changes.
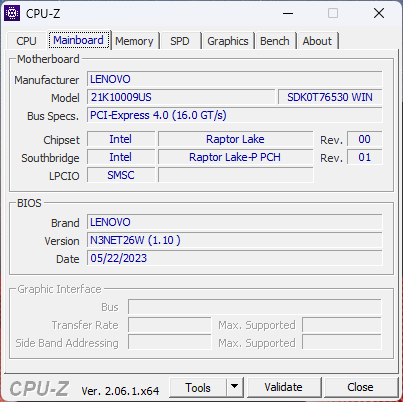
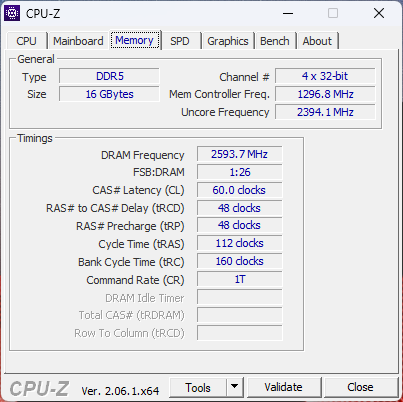
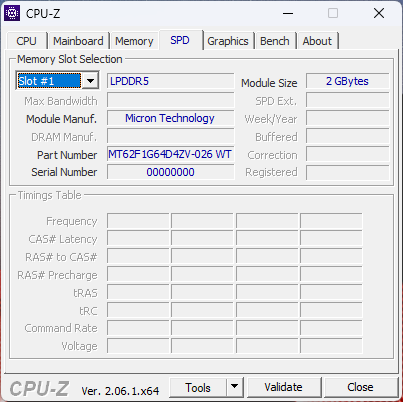
Our test unit has been configured with the Core i7-1360P for approximately $1400 USD retail. Other SKUs include the Core i5-1340P with vPro and non-vPro options up to the i7-1370P, but all configurations at the moment include the same 16 GB of soldered RAM and 13-inch 2K (2160 x 1350) IPS display with optional touch.
Alternatives to the ThinkPad X1 Nano Gen 3 include other ultralight subnotebooks like the LG Gram 13, Dynabook Portege X30L, Dell Latitude 9330, or HP Dragonfly G4.
More Lenovo reviews:
Potential Competitors in Comparison
Rating | Date | Model | Weight | Height | Size | Resolution | Best Price |
|---|---|---|---|---|---|---|---|
| 89.5 % | 08/2023 | Lenovo ThinkPad X1 Nano Gen 3 i7-1360P, Iris Xe G7 96EUs | 989 g | 14.8 mm | 13.00" | 2160x1350 | |
| 88.9 % | 09/2022 | Lenovo ThinkPad X1 Nano Gen 2 Core i7-1280P i7-1280P, Iris Xe G7 96EUs | 958 g | 14.4 mm | 13.00" | 2160x1350 | |
| 91.9 % | 07/2023 | HP Dragonfly G4 i7-1365U, Iris Xe G7 96EUs | 1.1 kg | 16.3 mm | 13.50" | 1920x1280 | |
| 86.2 % | 05/2023 | Framework Laptop 13.5 13th Gen Intel i7-1370P, Iris Xe G7 96EUs | 1.3 kg | 15.85 mm | 13.50" | 2256x1504 | |
| 89 % | 11/2022 | Dell Latitude 9330 i7-1260U, Iris Xe G7 96EUs | 1.2 kg | 14.1 mm | 13.30" | 2560x1600 | |
| 92 % | 08/2022 | Apple MacBook Air M2 10C GPU M2, M2 10-Core GPU | 1.2 kg | 11.3 mm | 13.60" | 2560x1664 | |
| 86.6 % | 10/2022 | LG Gram 14Z90Q i5-1240P, Iris Xe G7 80EUs | 980 g | 16.8 mm | 14.00" | 1920x1200 |
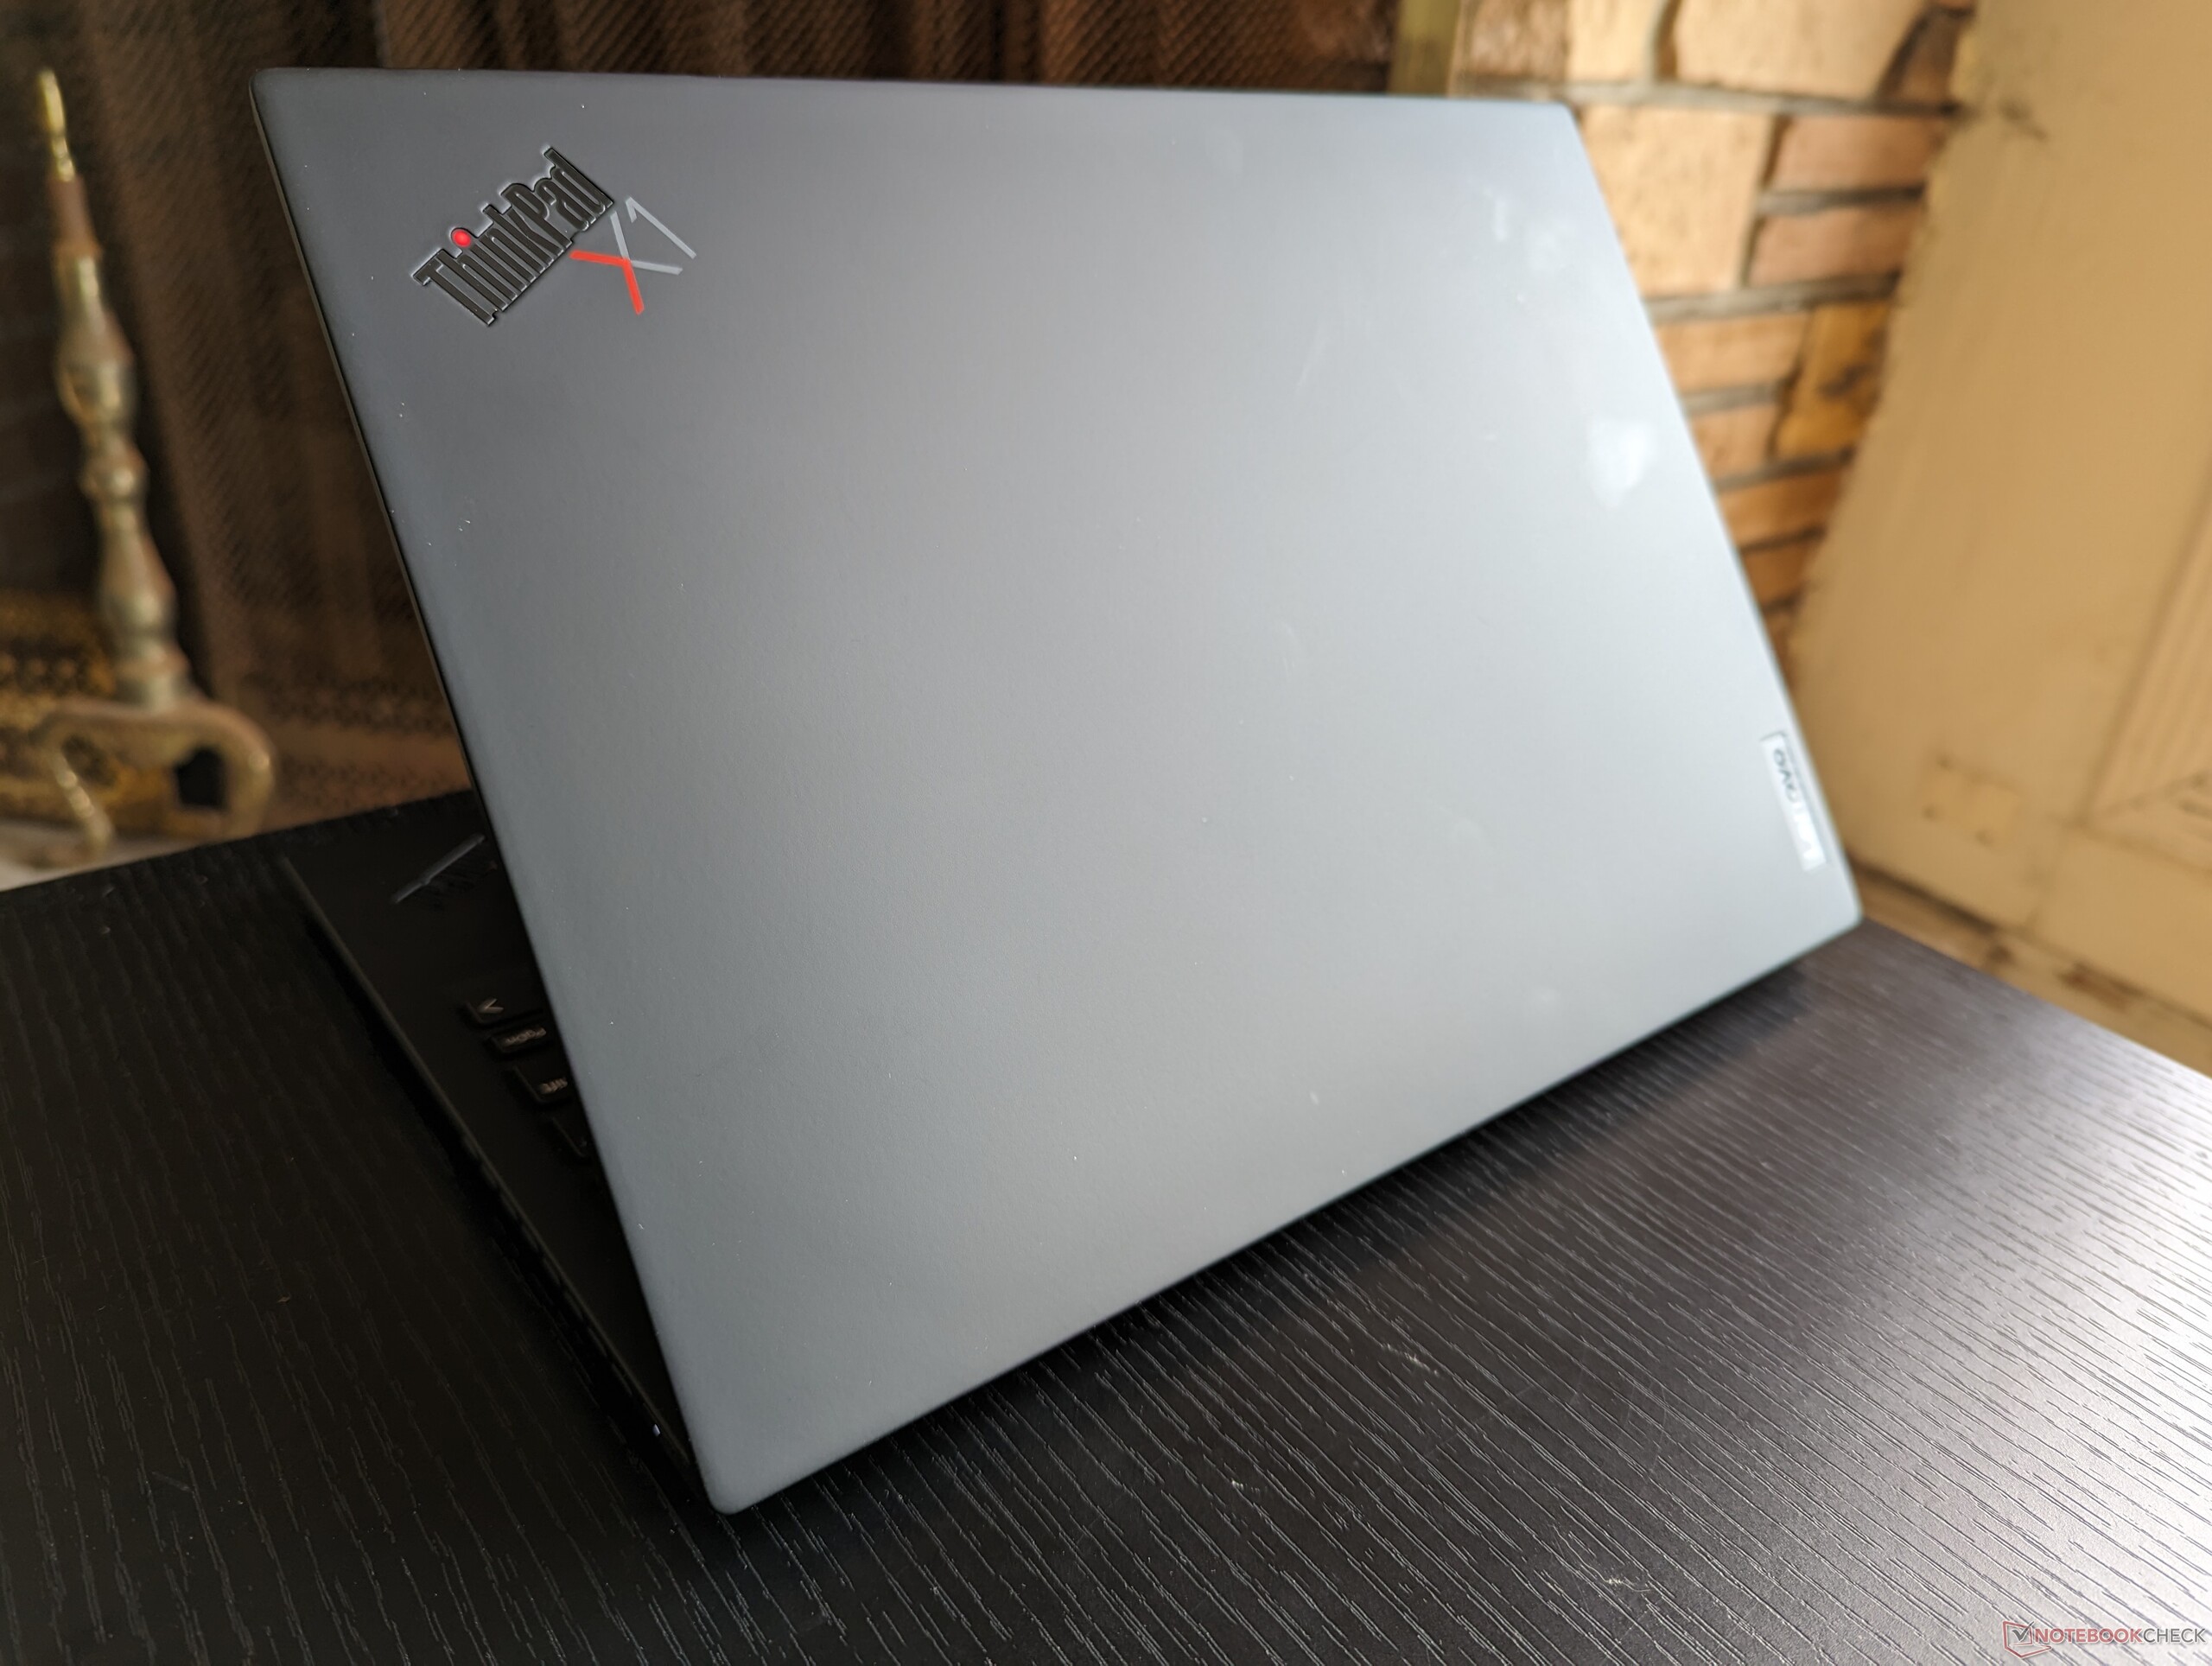
Case — Still One Of The Lightest
While there are no major exterior changes from the previous year, keep in mind that the touchscreen version is slightly larger than the non-touch version. The extra thickness and weight are hardly noticeable in practice.
| Touchscreen Configuration | 208.1 mm (L) | 293.3 mm (W) | 14.8 mm (H) |
| Non-touch Configuration | 208.0 mm (L) | 293.2 mm (W) | 14.4 mm (H) |
Communication
Webcam


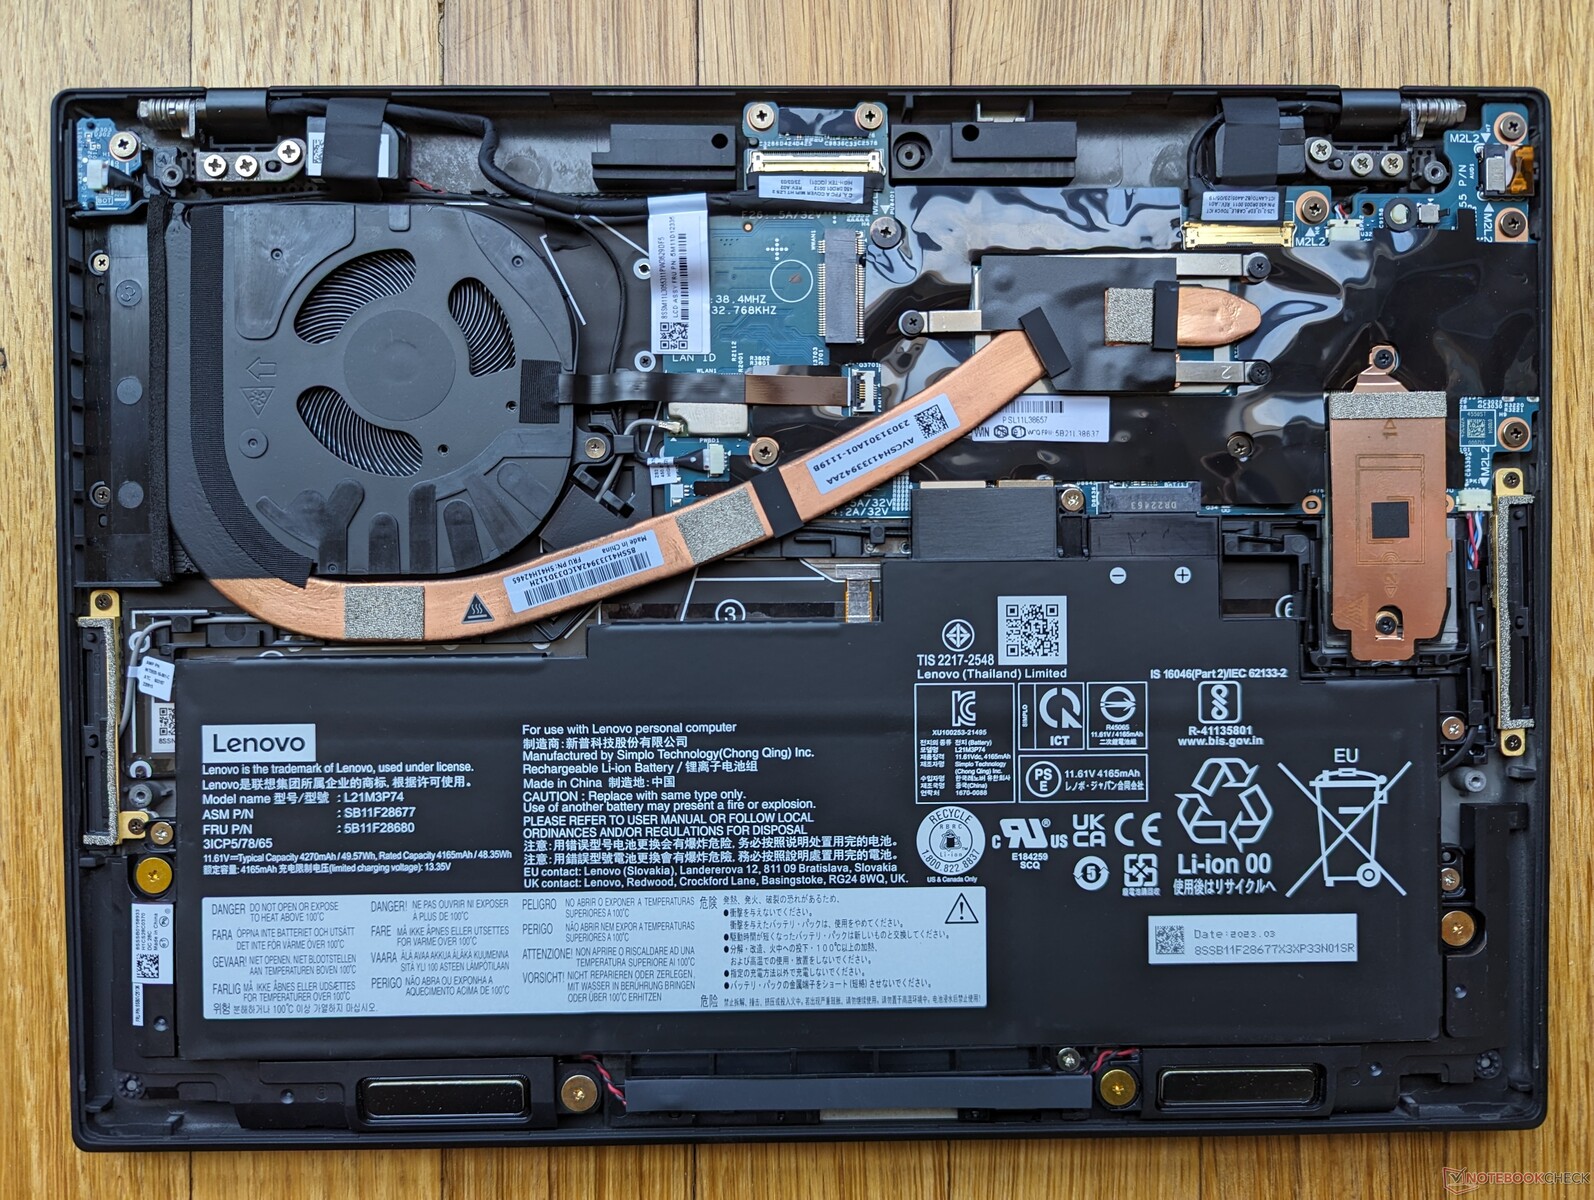
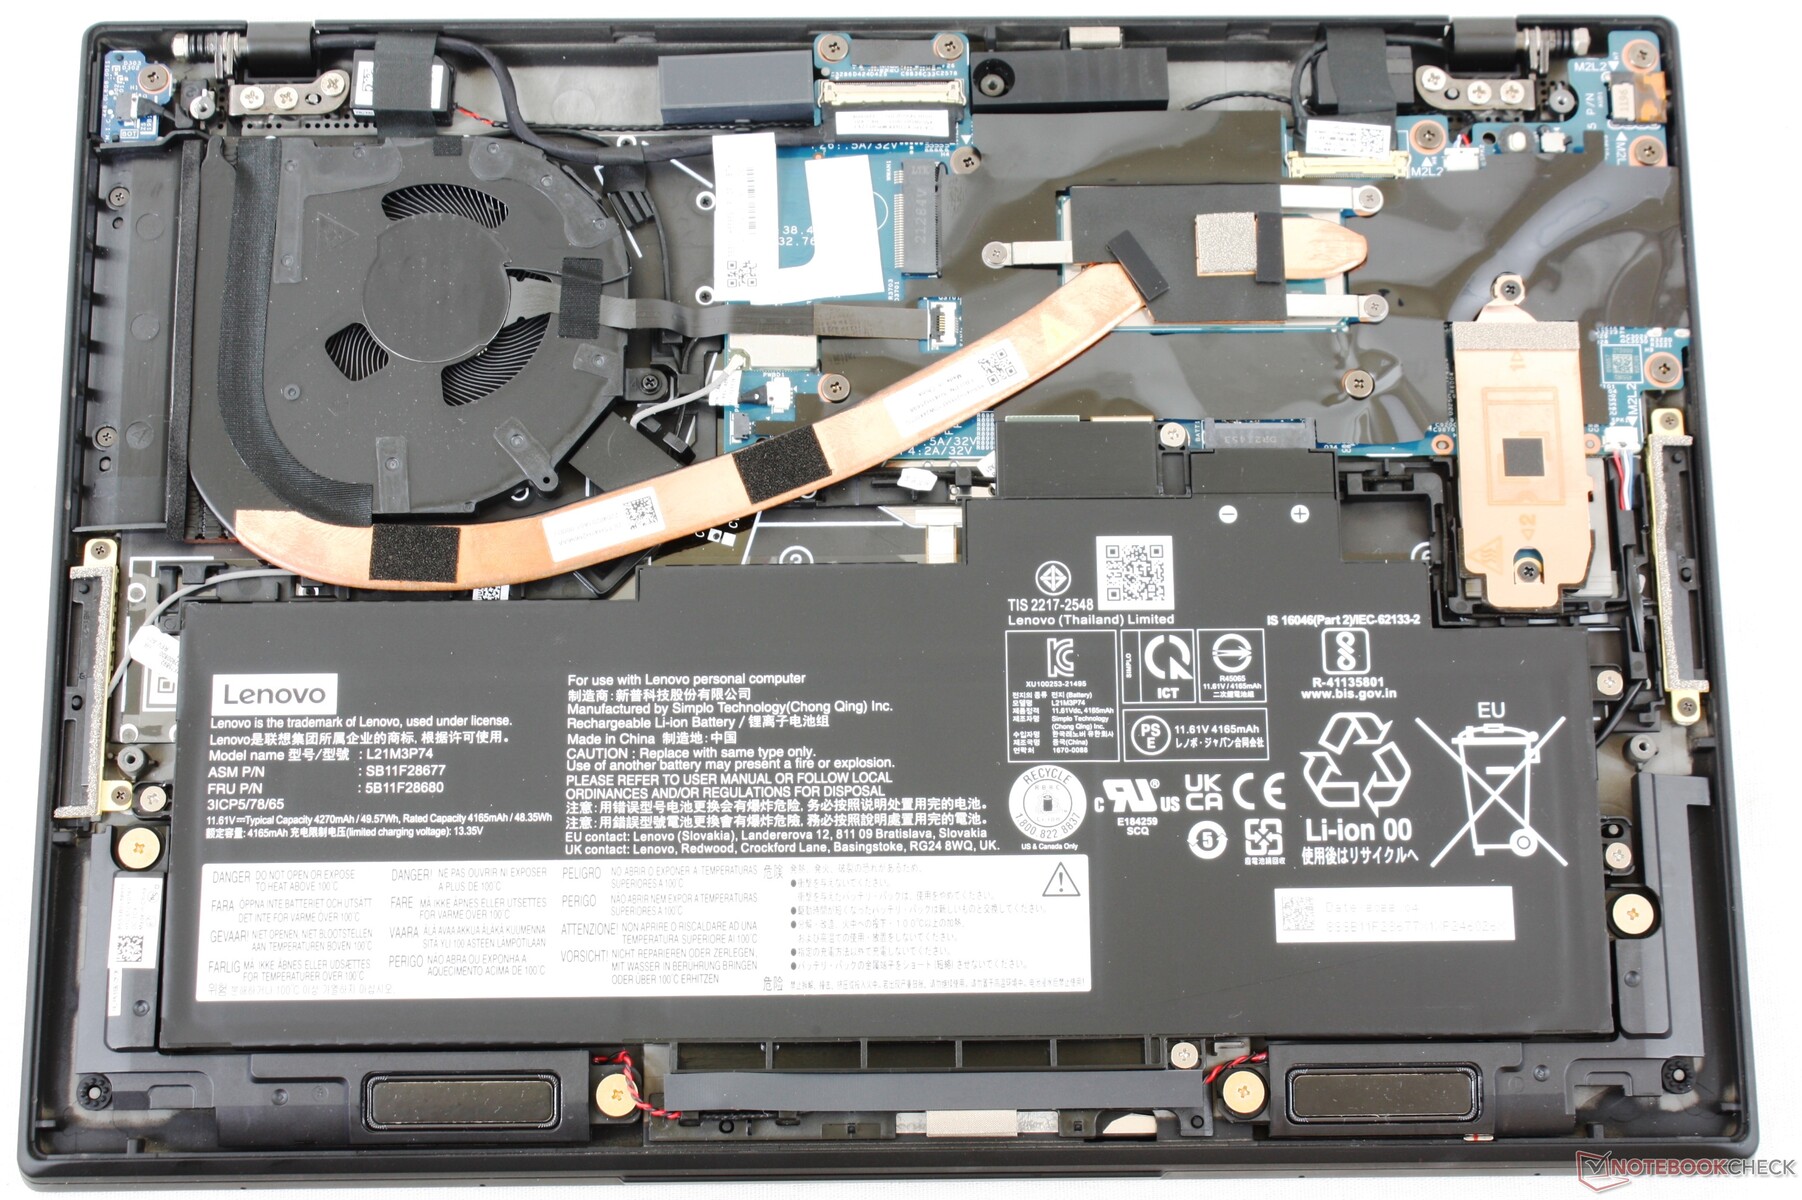
Maintenance
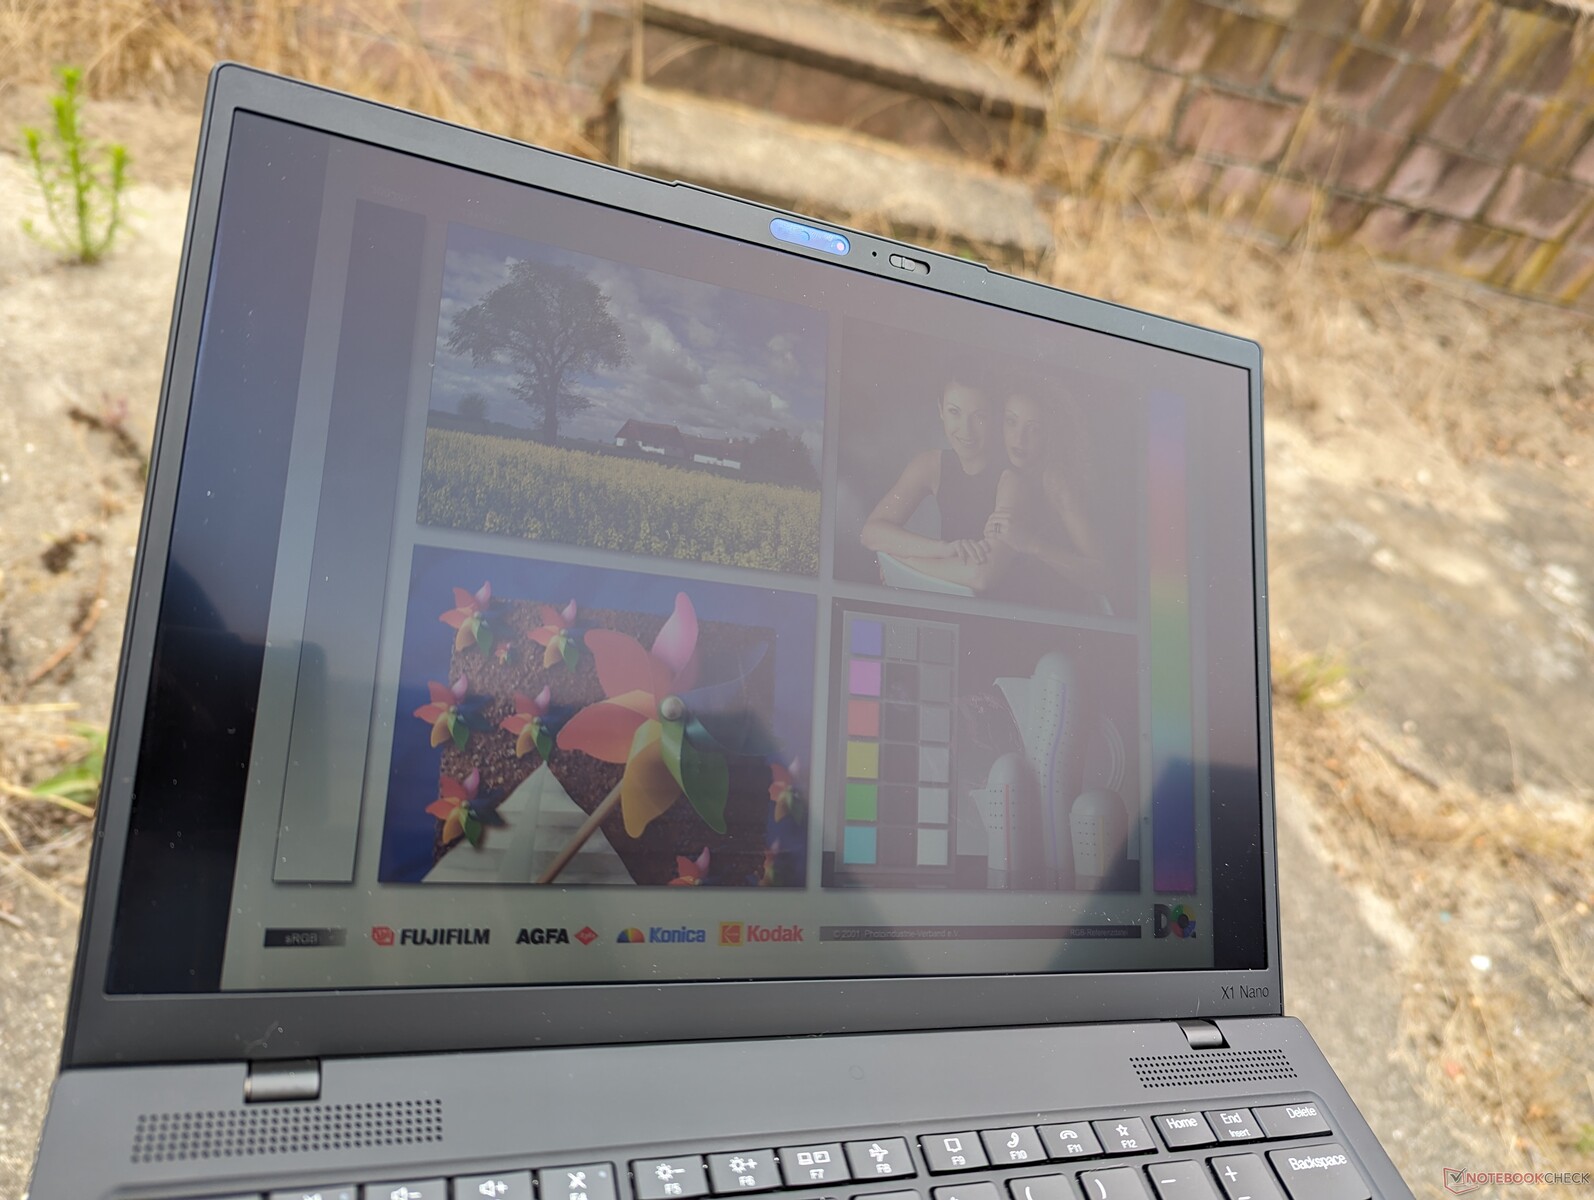
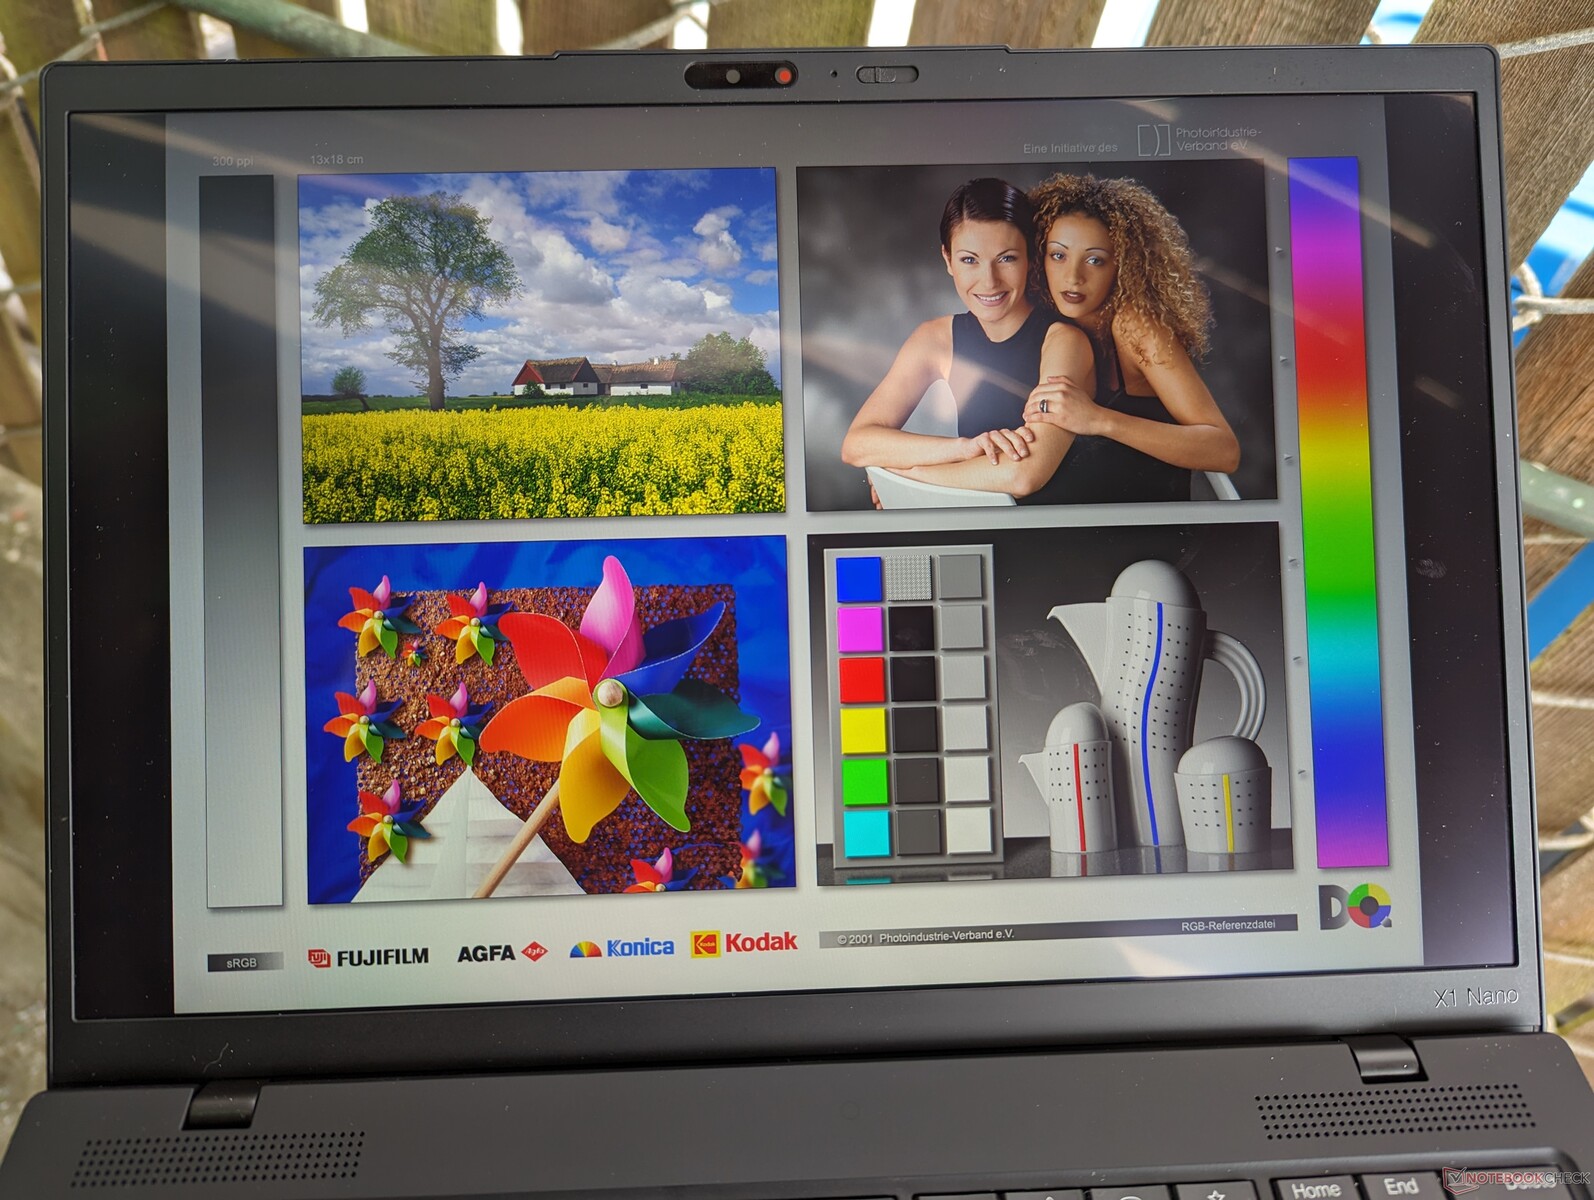
Display — No Other Options
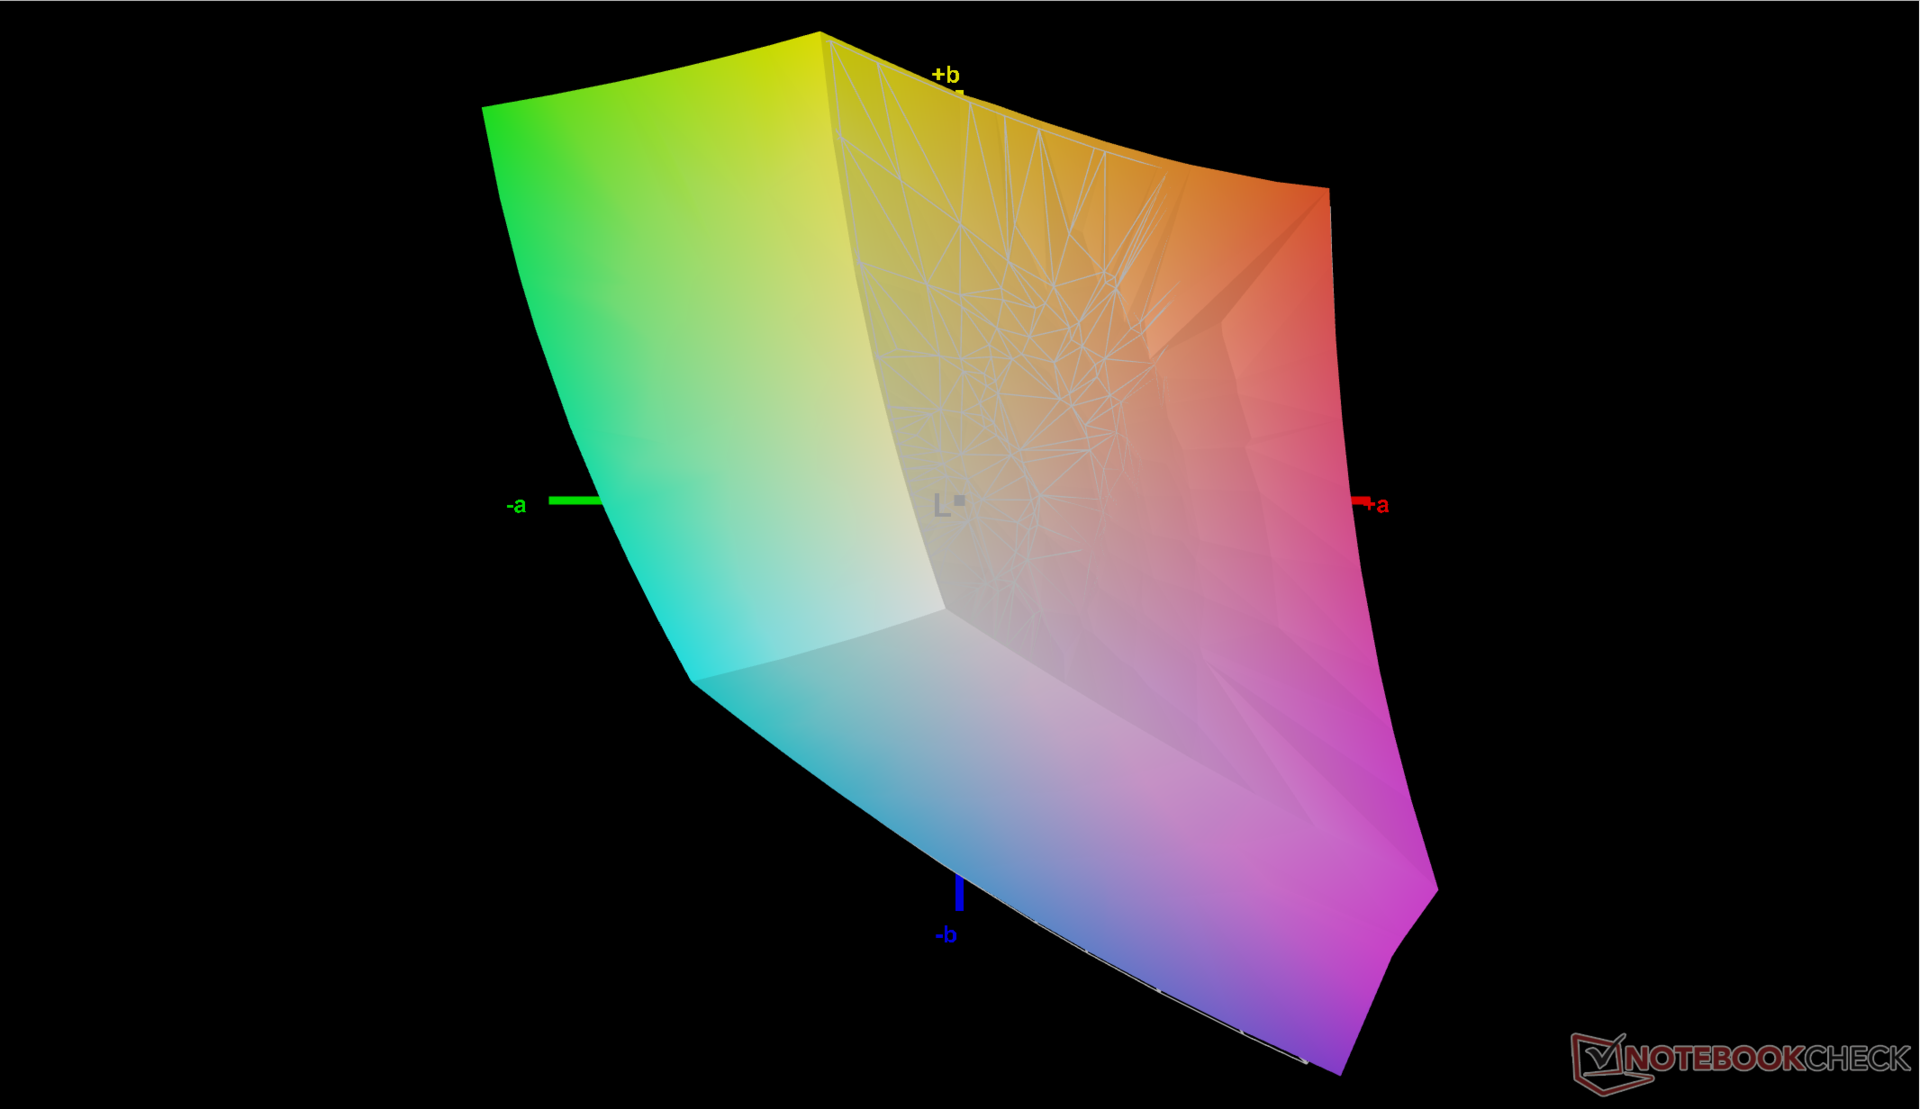
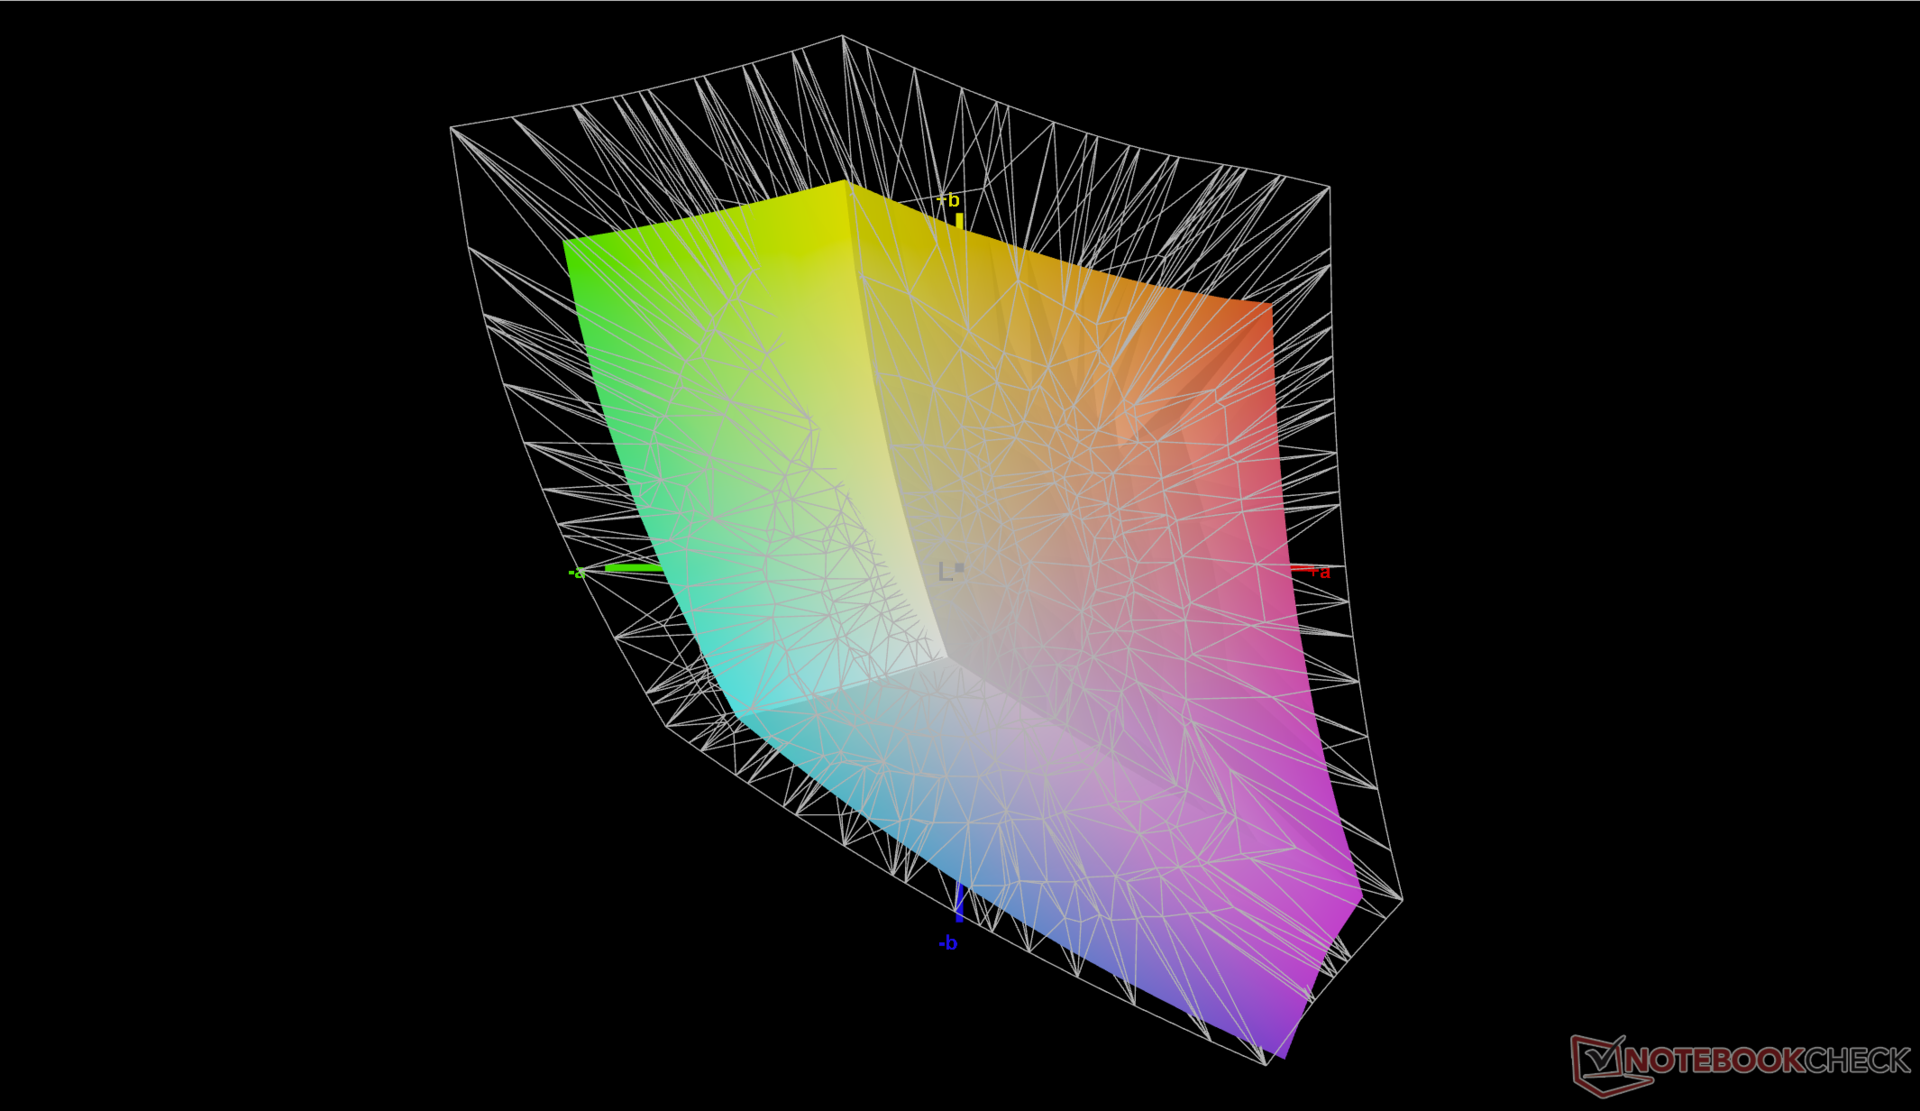
Interestingly, the IPS panel on this year's model is different than the panel on last year's model (MND007ZA1-3 vs. P101ZFZ-BH2). Other than the name change, however, both displays share similar color ranges, response times, brightness levels, and contrast ratios for a similar viewing experience.


| |||||||||||||||||||||||||
Brightness Distribution: 86 %
Center on Battery: 461.2 cd/m²
Contrast: 1590:1 (Black: 0.29 cd/m²)
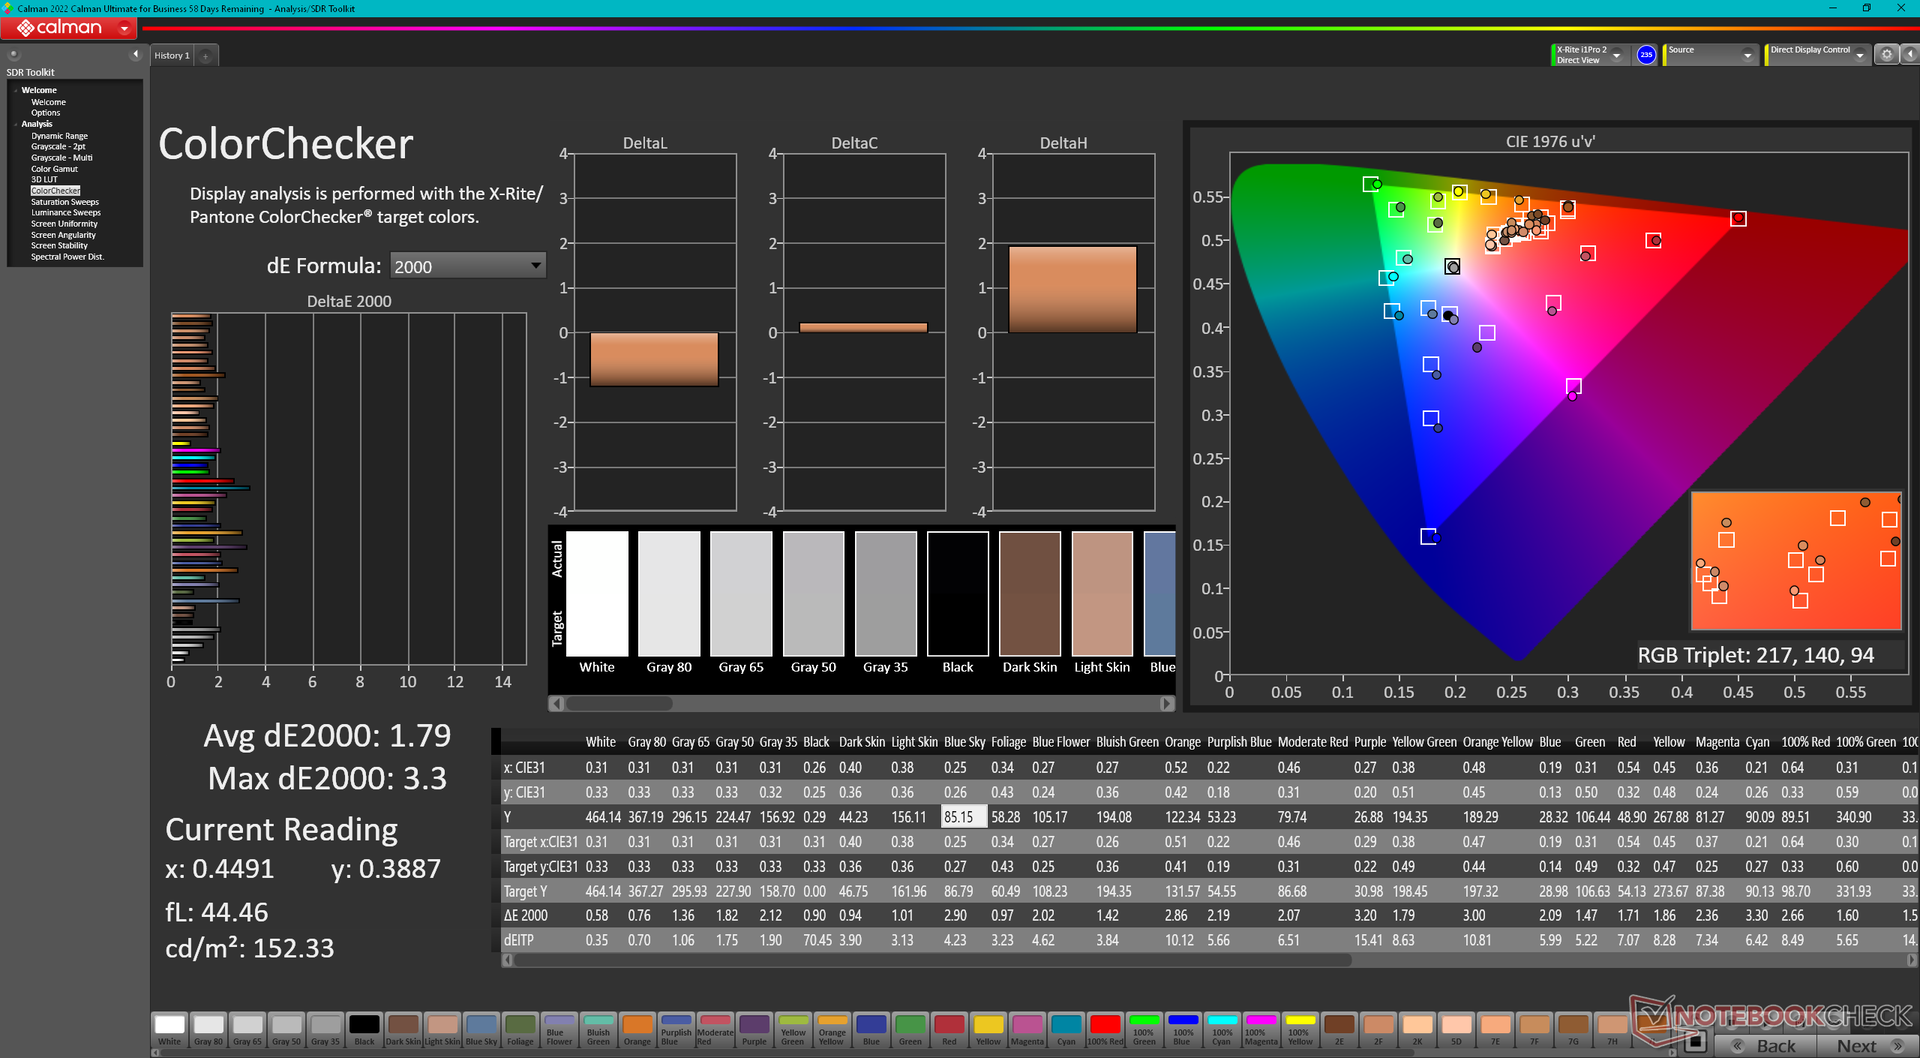
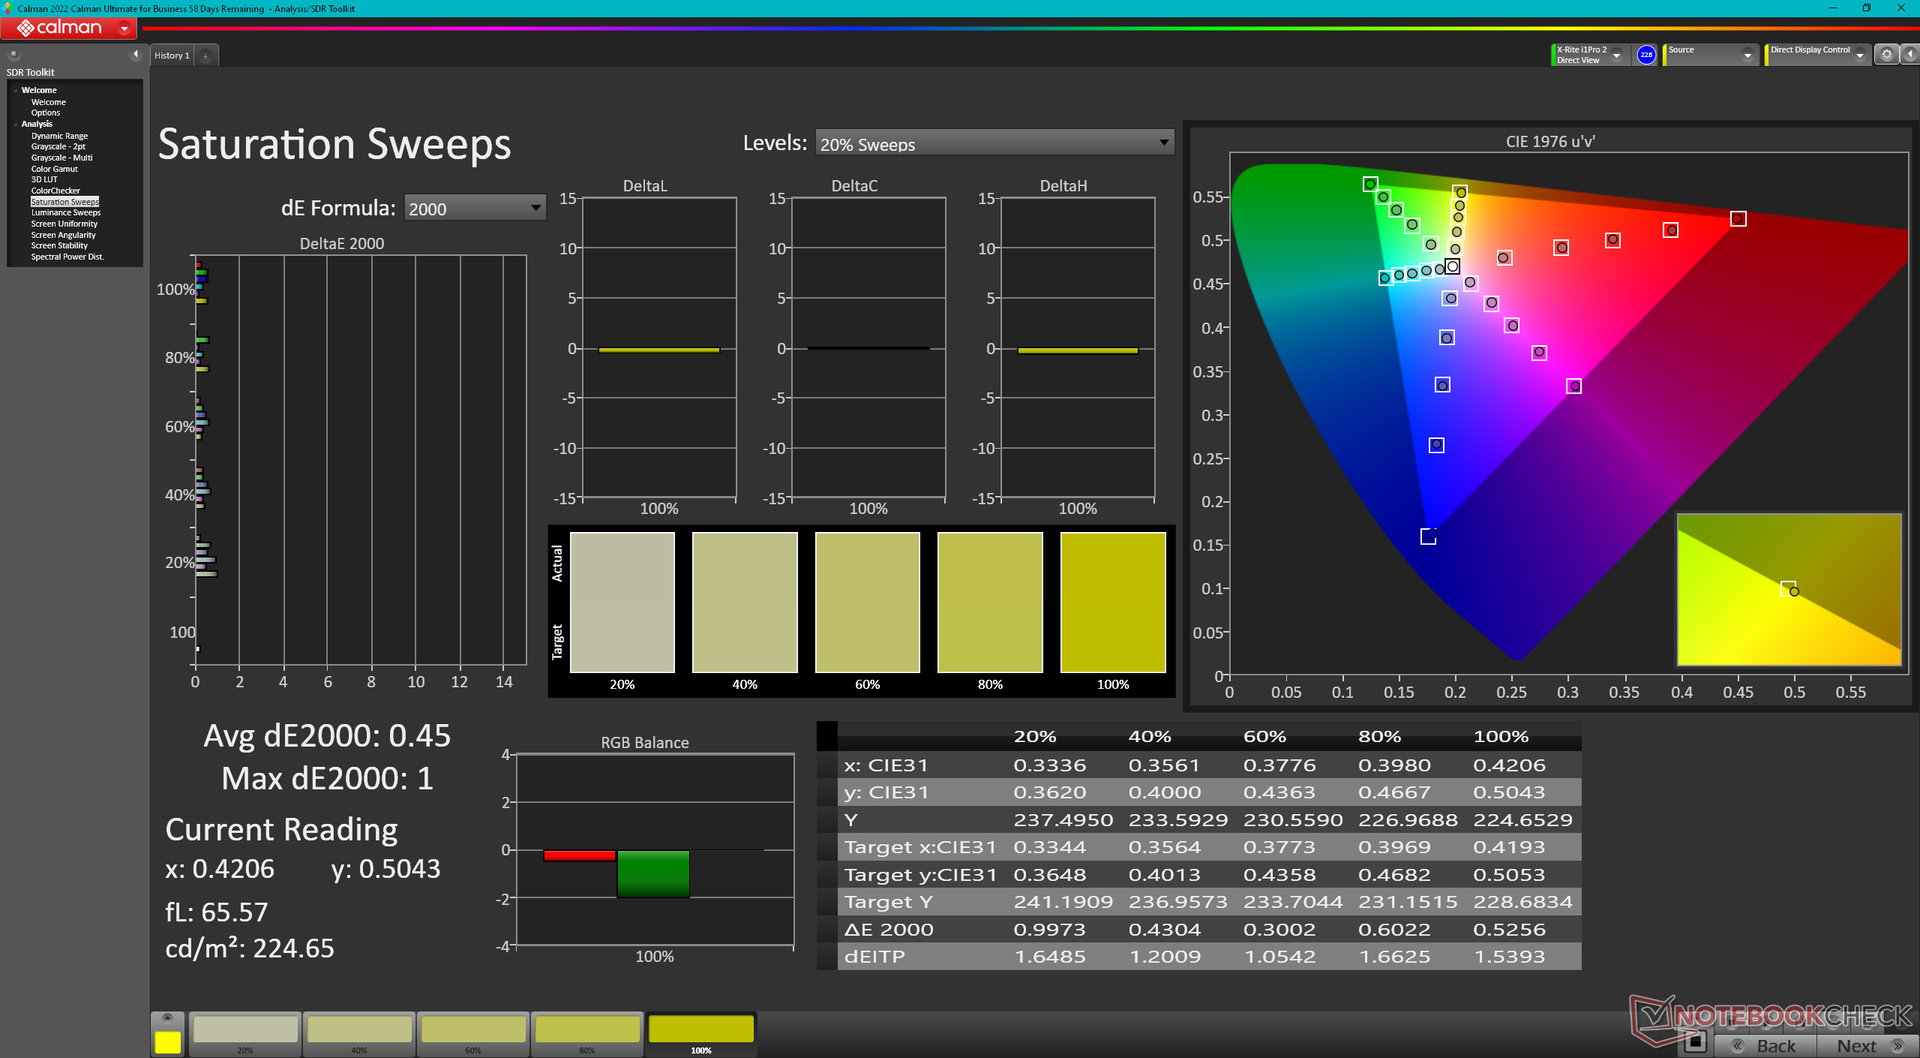
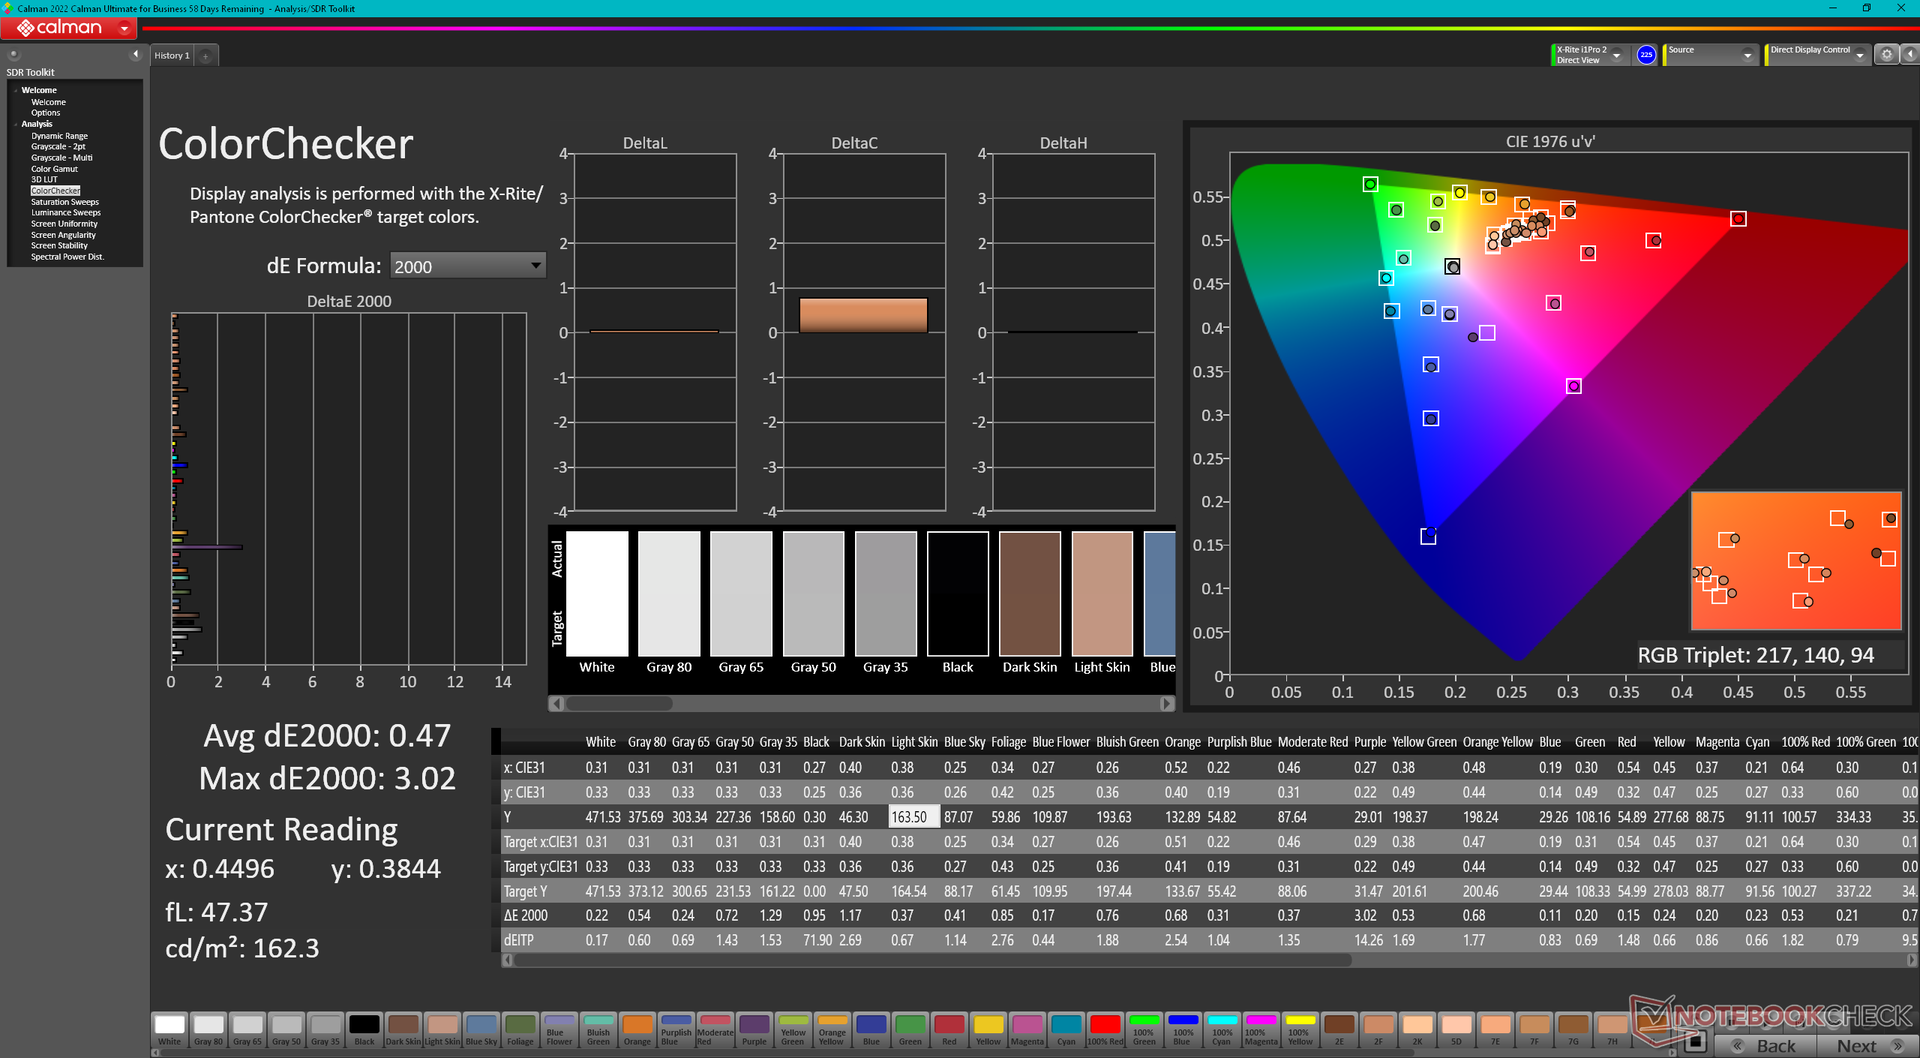
ΔE Color 1.79 | 0.5-29.43 Ø5.1, calibrated: 0.47
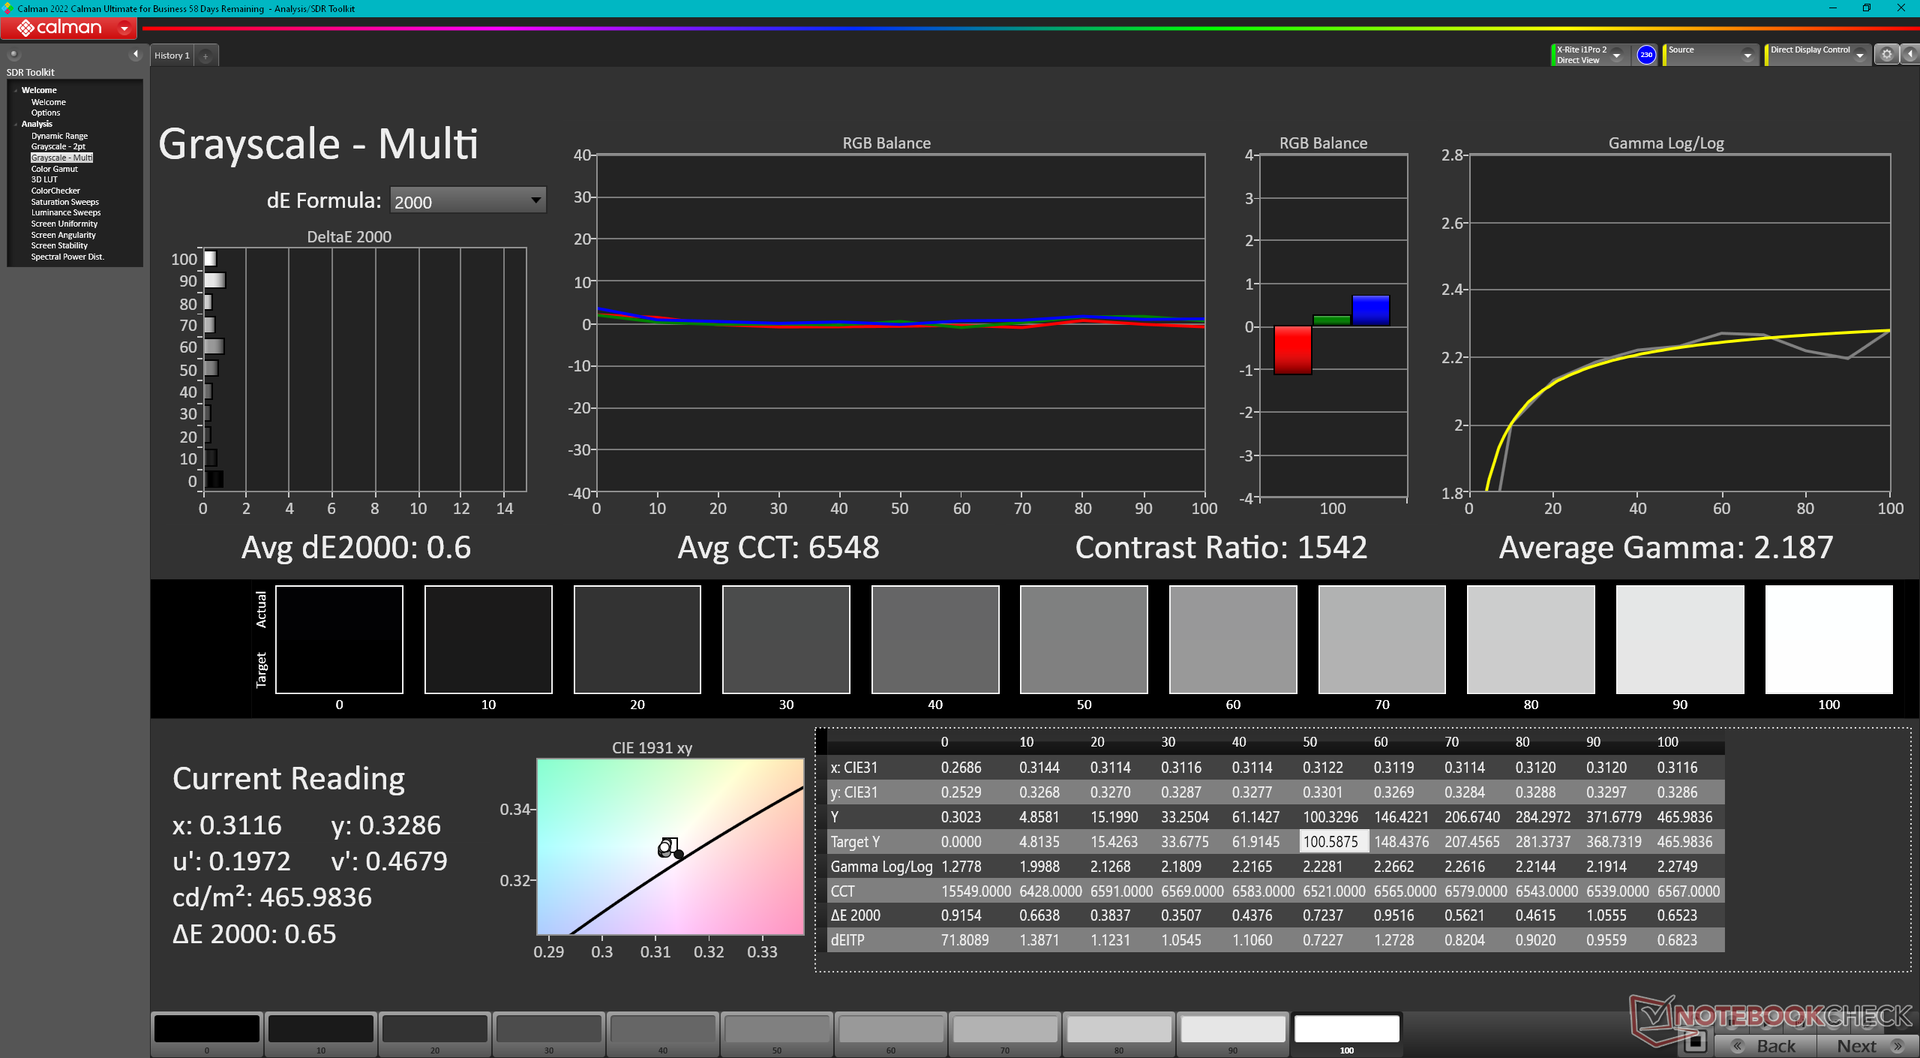
ΔE Greyscale 1.8 | 0.57-98 Ø5.3
69.7% AdobeRGB 1998 (Argyll 2.2.0 3D)
99.5% sRGB (Argyll 2.2.0 3D)
68.5% Display P3 (Argyll 2.2.0 3D)
Gamma: 2.24
| Lenovo ThinkPad X1 Nano Gen 3 MND007ZA1-3, IPS, 2160x1350, 13.00 | Lenovo ThinkPad X1 Nano Gen 2 Core i7-1280P P101ZFZ-BH2, IPS, 2160x1350, 13.00 | HP Dragonfly G4 Chi Mei CMN13C0, IPS, 1920x1280, 13.50 | Framework Laptop 13.5 13th Gen Intel BOE CQ NE135FBM-N41, IPS, 2256x1504, 13.50 | Dell Latitude 9330 AU Optronics B133QAA, IPS, 2560x1600, 13.30 | LG Gram 14Z90Q LG LP140WU1-SPF1, IPS, 1920x1200, 14.00 | |
|---|---|---|---|---|---|---|
| Display | -3% | 0% | 0% | 8% | 22% | |
| Display P3 Coverage | 68.5 | 66.2 -3% | 68.4 0% | 68.9 1% | 77.8 14% | 98.4 44% |
| sRGB Coverage | 99.5 | 96.1 -3% | 98.3 -1% | 97.5 -2% | 99.9 0% | 99.9 0% |
| AdobeRGB 1998 Coverage | 69.7 | 68.3 -2% | 70.4 1% | 71.1 2% | 77.5 11% | 85.9 23% |
| Response Times | -4% | -22% | -34% | -82% | -7% | |
| Response Time Grey 50% / Grey 80% * | 39.9 ? | 43.6 ? -9% | 48.8 ? -22% | 54.9 ? -38% | 67.6 ? -69% | 47.5 ? -19% |
| Response Time Black / White * | 25.8 ? | 25.6 ? 1% | 31.3 ? -21% | 33.5 ? -30% | 50.4 ? -95% | 24.5 ? 5% |
| PWM Frequency | ||||||
| Screen | -79% | -14% | -60% | -31% | -62% | |
| Brightness middle | 461.2 | 469.6 2% | 408.8 -11% | 503 9% | 542.3 18% | 341 -26% |
| Brightness | 428 | 460 7% | 399 -7% | 472 10% | 516 21% | 305 -29% |
| Brightness Distribution | 86 | 94 9% | 90 5% | 87 1% | 85 -1% | 87 1% |
| Black Level * | 0.29 | 0.37 -28% | 0.32 -10% | 0.36 -24% | 0.38 -31% | 0.26 10% |
| Contrast | 1590 | 1269 -20% | 1278 -20% | 1397 -12% | 1427 -10% | 1312 -17% |
| Colorchecker dE 2000 * | 1.79 | 4.85 -171% | 2.02 -13% | 3.38 -89% | 3.18 -78% | 3.11 -74% |
| Colorchecker dE 2000 max. * | 3.3 | 7.62 -131% | 3.84 -16% | 7.08 -115% | 6.05 -83% | 8.29 -151% |
| Colorchecker dE 2000 calibrated * | 0.47 | 1.22 -160% | 0.61 -30% | 1.21 -157% | 0.67 -43% | 0.83 -77% |
| Greyscale dE 2000 * | 1.8 | 5.7 -217% | 2.3 -28% | 4.8 -167% | 3.1 -72% | 5.3 -194% |
| Gamma | 2.24 98% | 2.13 103% | 2.2 100% | 2.13 103% | 2.08 106% | 2.037 108% |
| CCT | 6588 99% | 6931 94% | 6203 105% | 6235 104% | 6140 106% | 7571 86% |
| Total Average (Program / Settings) | -29% /
-52% | -12% /
-12% | -31% /
-44% | -35% /
-30% | -16% /
-36% |
* ... smaller is better
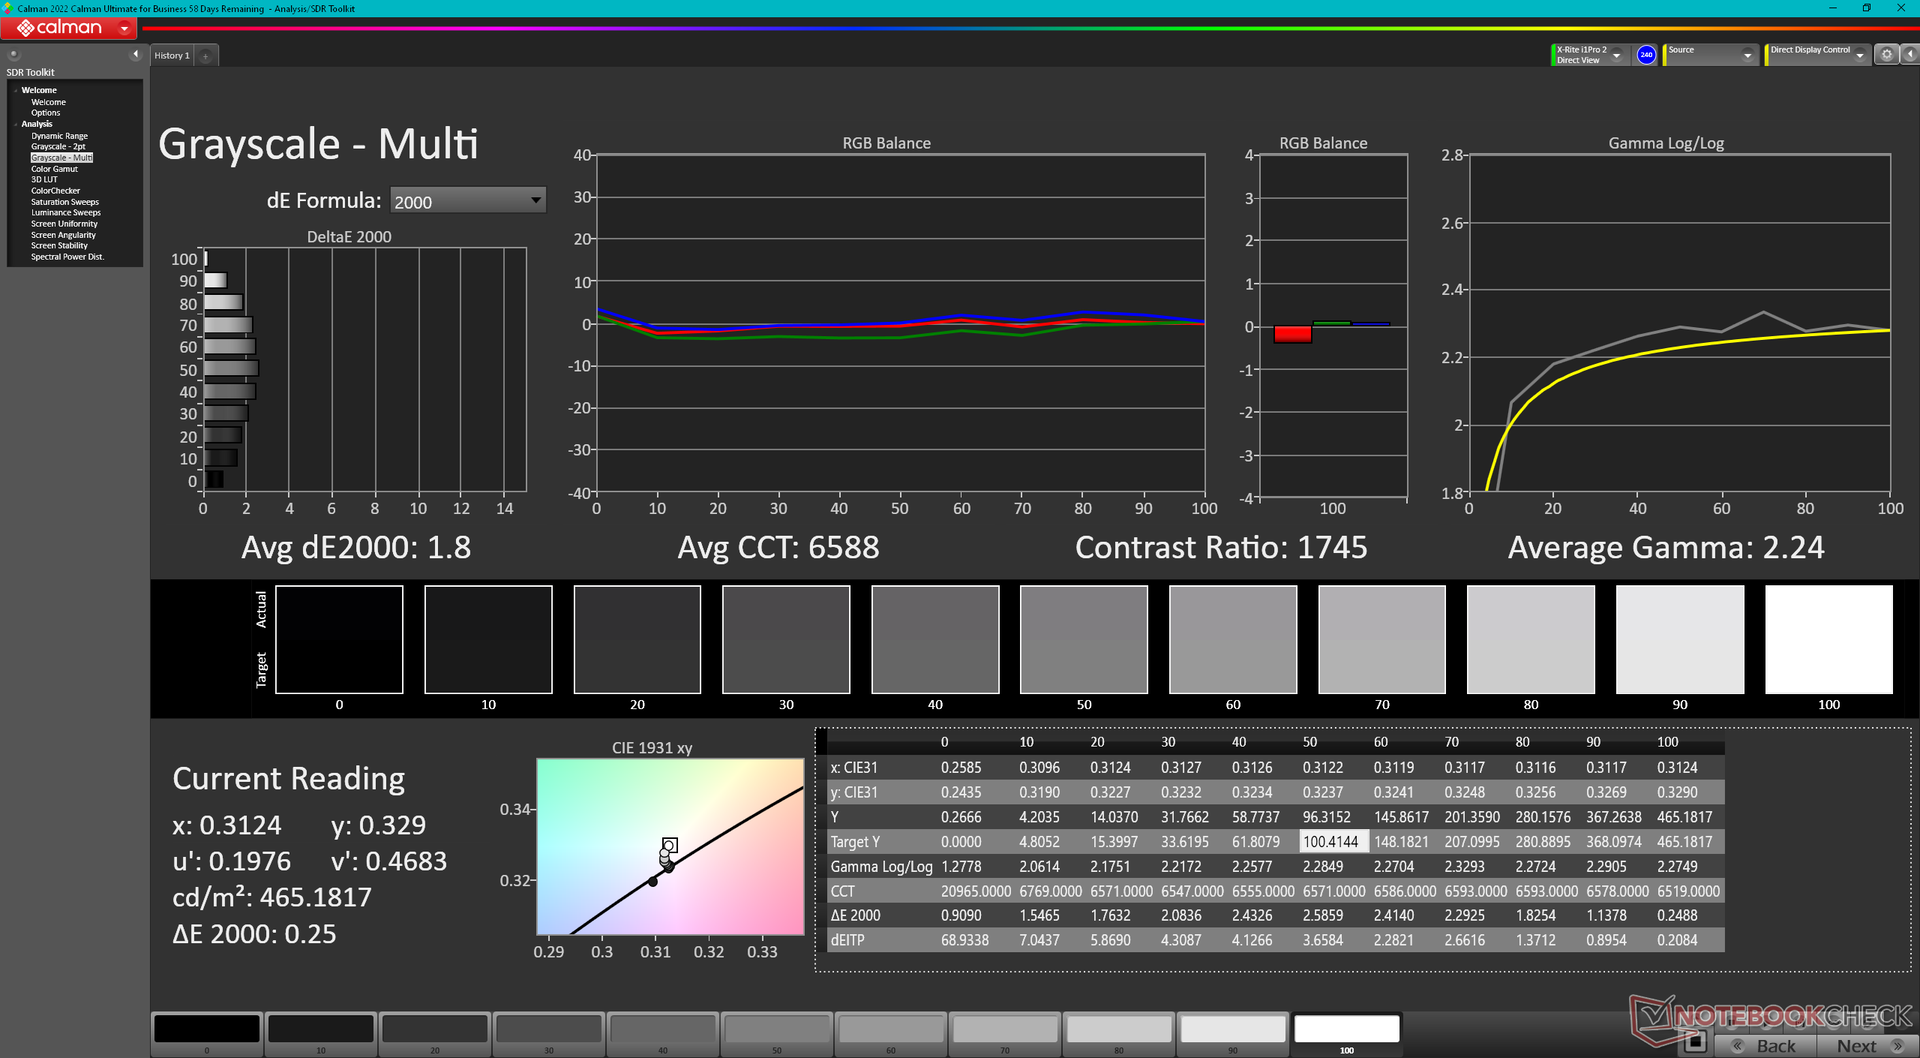
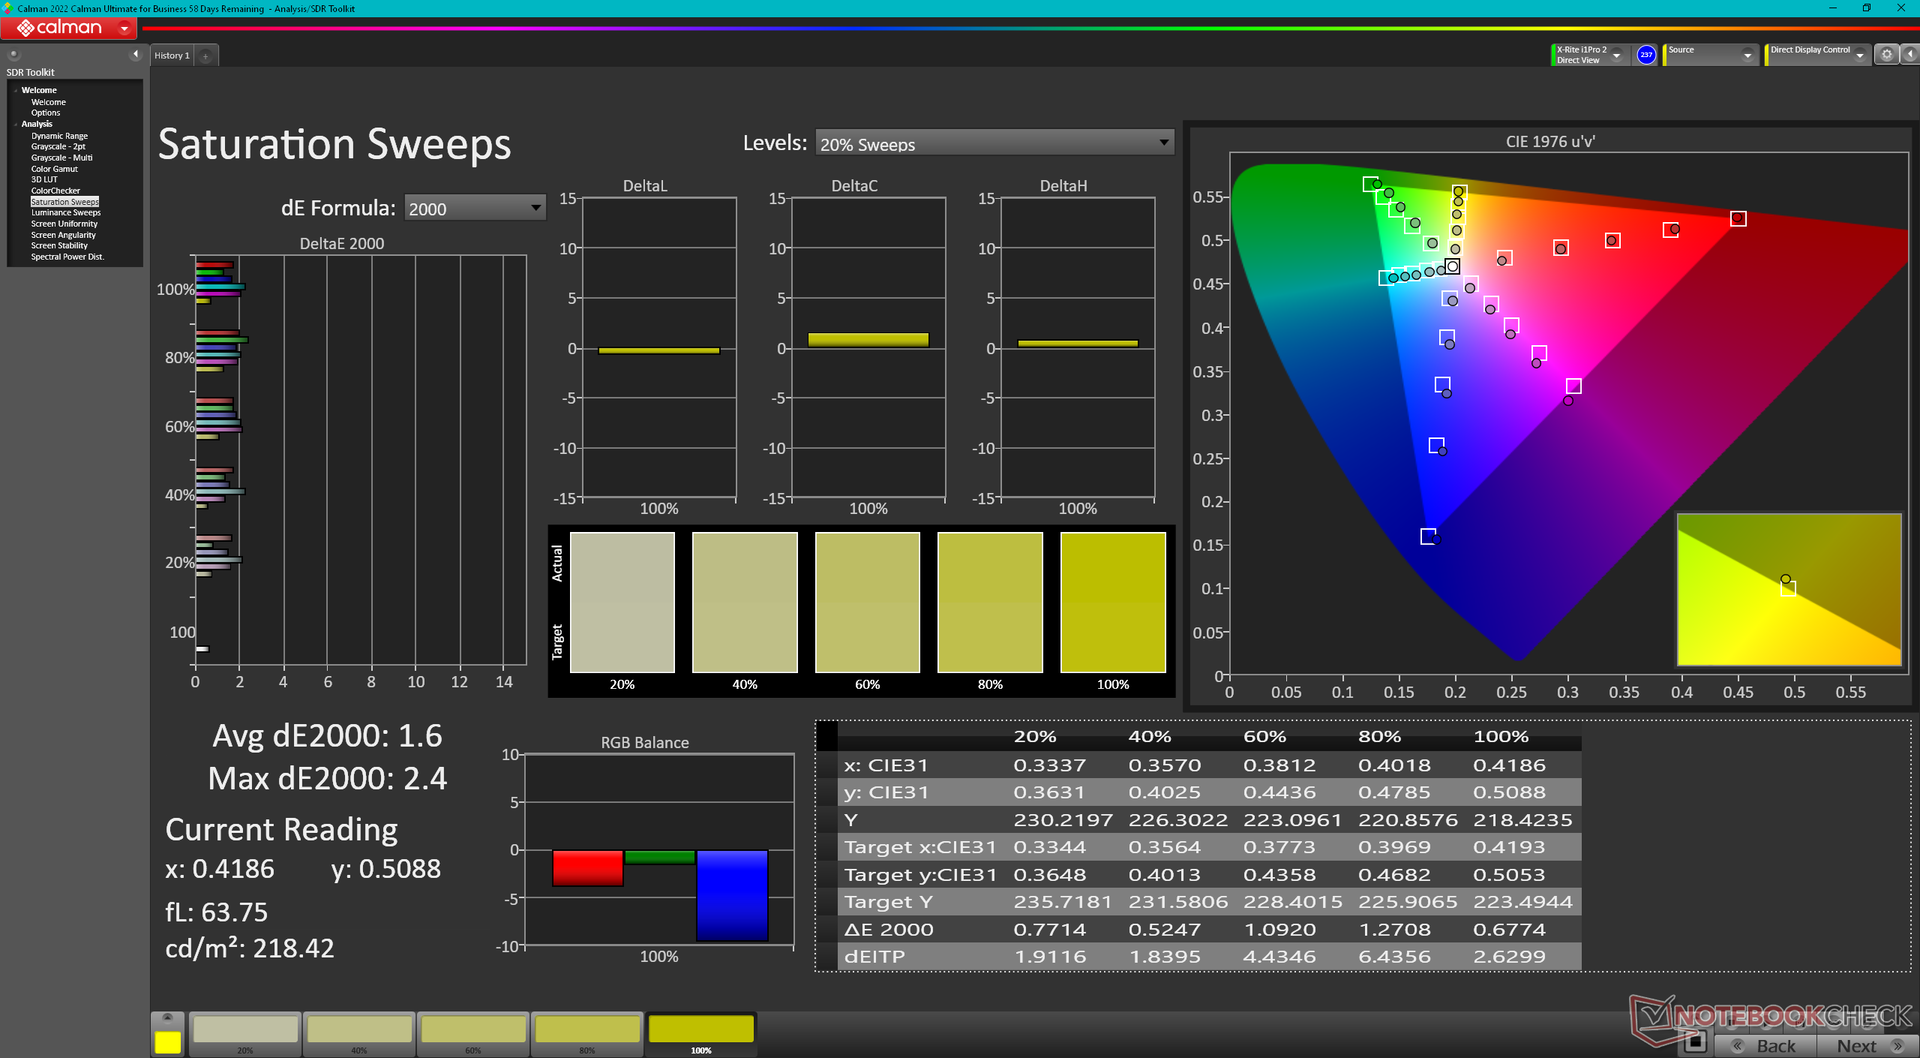
The display is better calibrated out-of-the-box for improved color accuracy over last year's model. Average grayscale and color deltaE values would be just 1.8 and 1.79, respectively, compared to 5.7 and 4.85 on the X1 Nano Gen 2. This means that an end-user calibration is not as necessary this time around.
Display Response Times
| ↔ Response Time Black to White | ||
|---|---|---|
| 25.8 ms ... rise ↗ and fall ↘ combined | ↗ 11.8 ms rise | 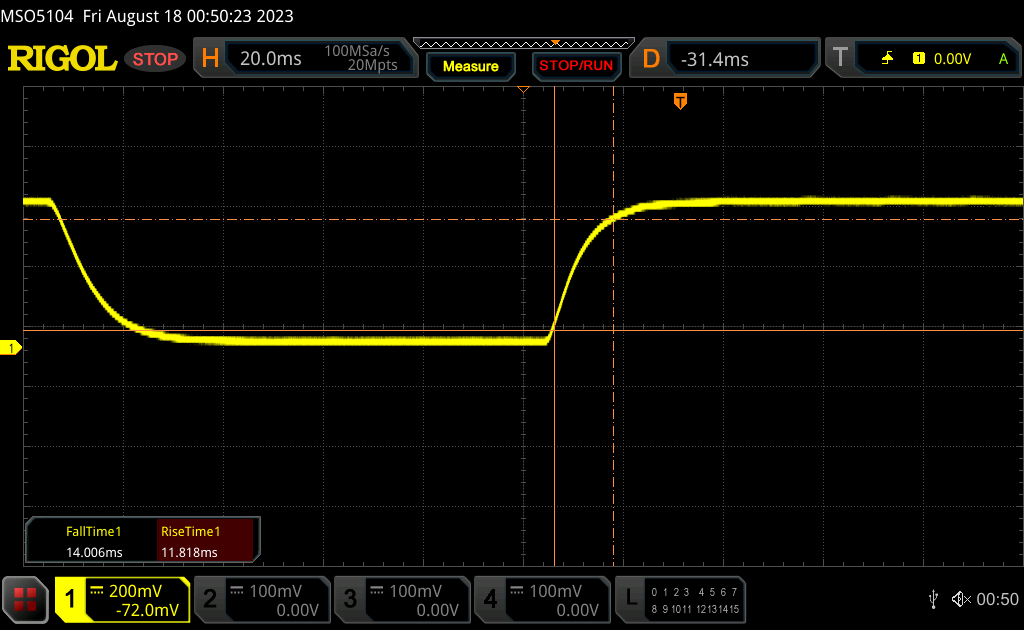 |
| ↘ 14 ms fall | ||
| The screen shows relatively slow response rates in our tests and may be too slow for gamers. In comparison, all tested devices range from 0.1 (minimum) to 240 (maximum) ms. » 56 % of all devices are better. This means that the measured response time is worse than the average of all tested devices (21.8 ms). | ||
| ↔ Response Time 50% Grey to 80% Grey | ||
| 39.9 ms ... rise ↗ and fall ↘ combined | ↗ 18.7 ms rise | 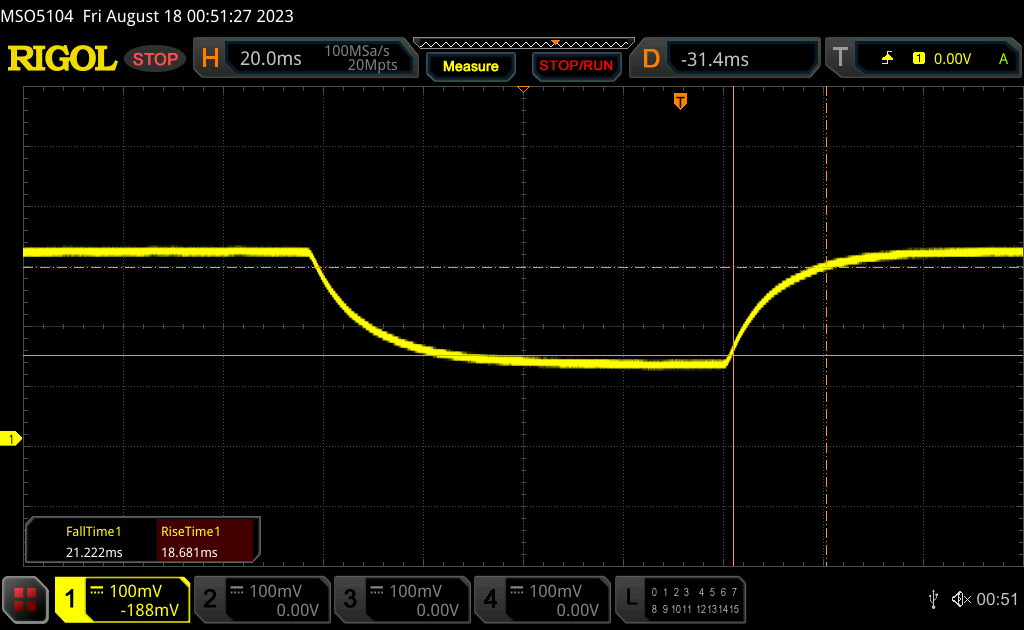 |
| ↘ 21.2 ms fall | ||
| The screen shows slow response rates in our tests and will be unsatisfactory for gamers. In comparison, all tested devices range from 0.2 (minimum) to 636 (maximum) ms. » 54 % of all devices are better. This means that the measured response time is worse than the average of all tested devices (34.3 ms). | ||
Screen Flickering / PWM (Pulse-Width Modulation)
| Screen flickering / PWM not detected | 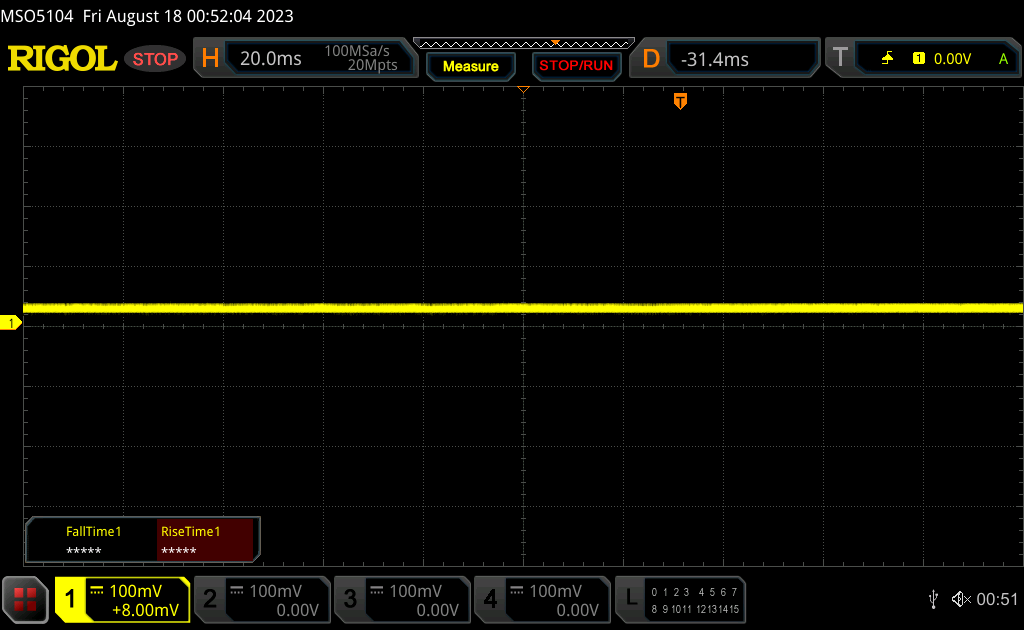 | ||
In comparison: 53 % of all tested devices do not use PWM to dim the display. If PWM was detected, an average of 18722 (minimum: 5 - maximum: 3846000) Hz was measured. | |||

Performance — Intel Raptor Lake Upgrade
Testing Conditions
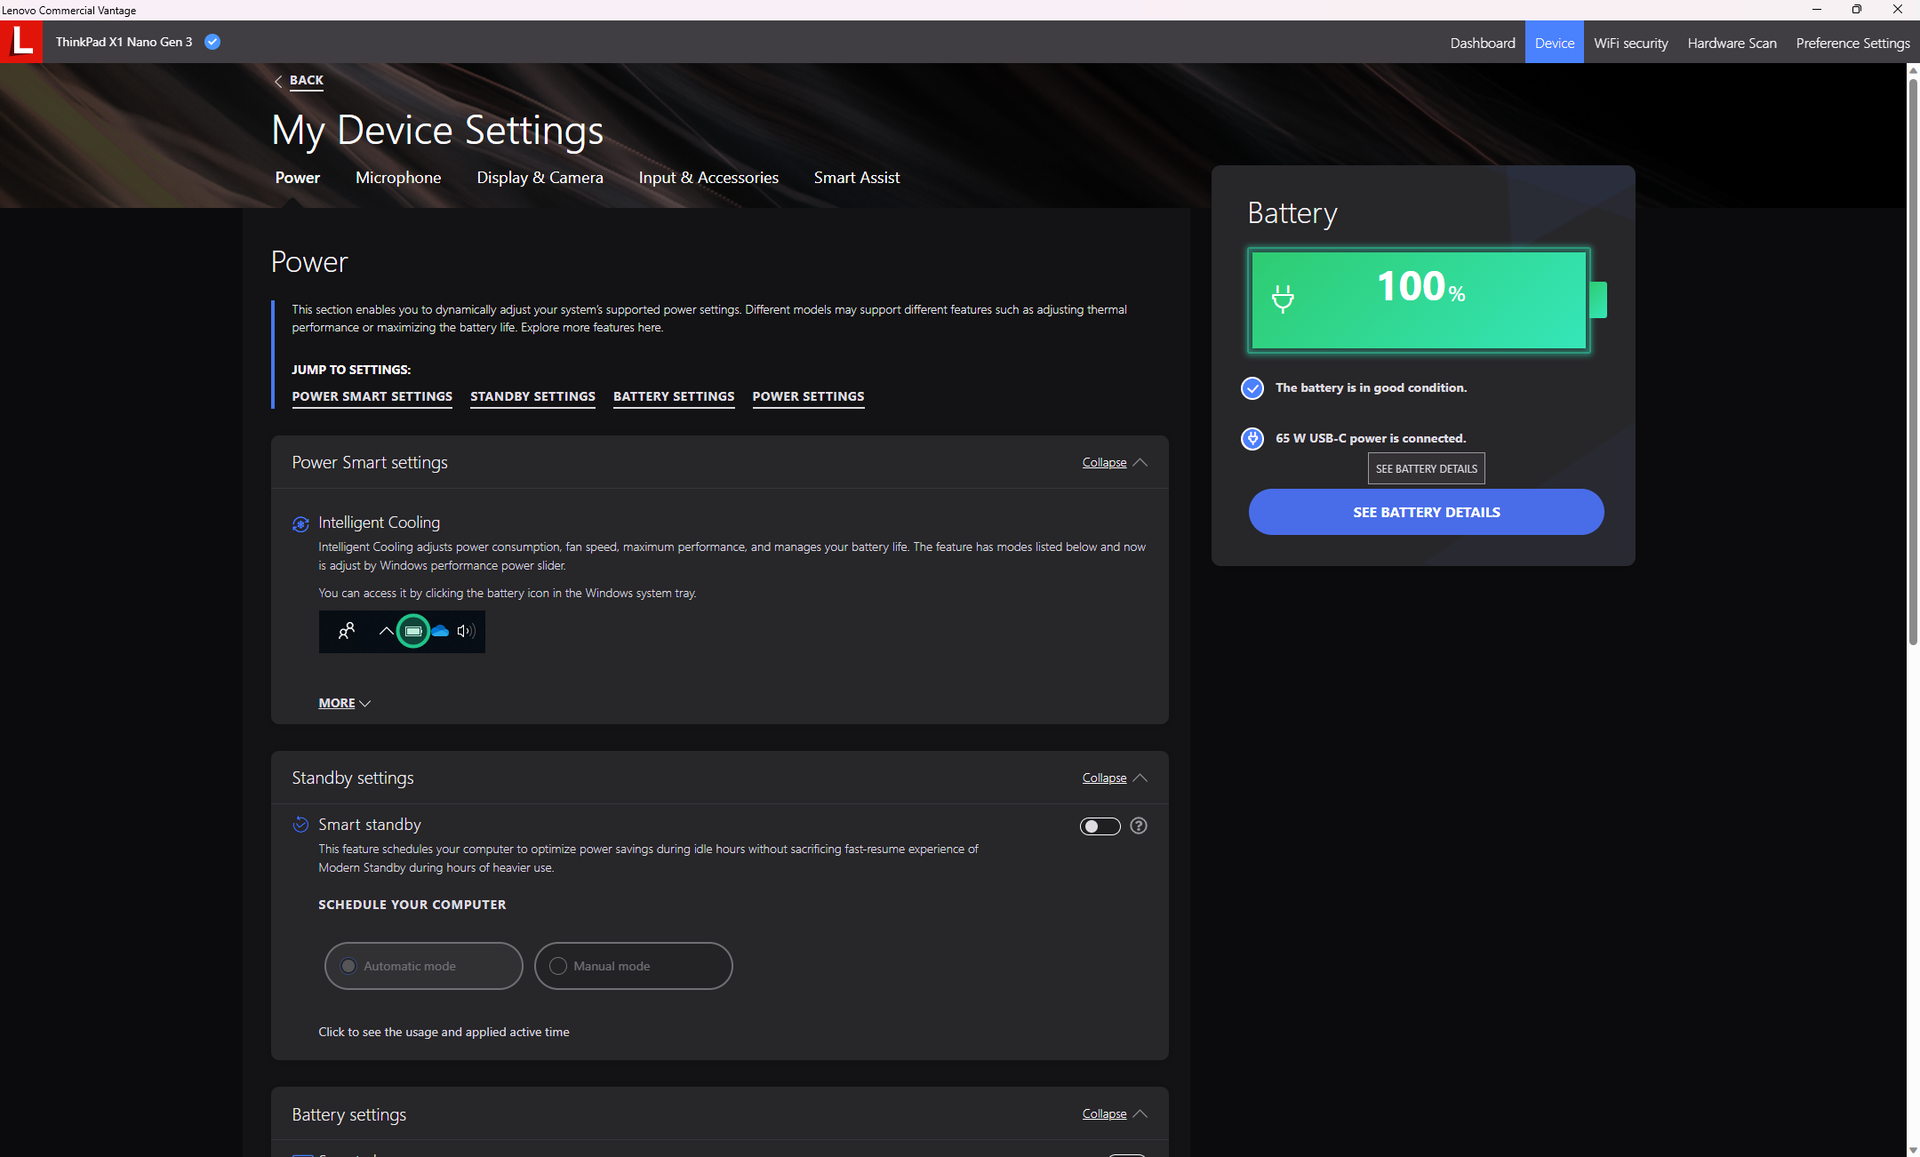
We set Windows to Performance mode prior to running the benchmarks below. On most other Lenovo laptops, the Vantage software would have special power settings in addition to the usual Windows power settings. On the ThinkPad X1 Nano, however, Vantage would have no special power settings to reduce confusion.

Processor
Our 13th gen Core i7-1360P would perform almost identically to the 12th gen Core i7-1280P on last year's model. It would sometimes even fall behind the older processor due to steeper throttling as shown by our CineBench R15 xT loop results below. Nonetheless, it's still faster relative to competing subnotebooks powered by Core U-series CPUs like the HP Dragonfly G4 or Dell Latitude 9330 by up to 20 percent.
Cinebench R15 Multi Loop
Cinebench R23: Multi Core | Single Core
Cinebench R20: CPU (Multi Core) | CPU (Single Core)
Cinebench R15: CPU Multi 64Bit | CPU Single 64Bit
Blender: v2.79 BMW27 CPU
7-Zip 18.03: 7z b 4 | 7z b 4 -mmt1
Geekbench 5.5: Multi-Core | Single-Core
HWBOT x265 Benchmark v2.2: 4k Preset
LibreOffice : 20 Documents To PDF
R Benchmark 2.5: Overall mean
* ... smaller is better
* ... smaller is better
AIDA64: FP32 Ray-Trace | FPU Julia | CPU SHA3 | CPU Queen | FPU SinJulia | FPU Mandel | CPU AES | CPU ZLib | FP64 Ray-Trace | CPU PhotoWorxx
System Performance
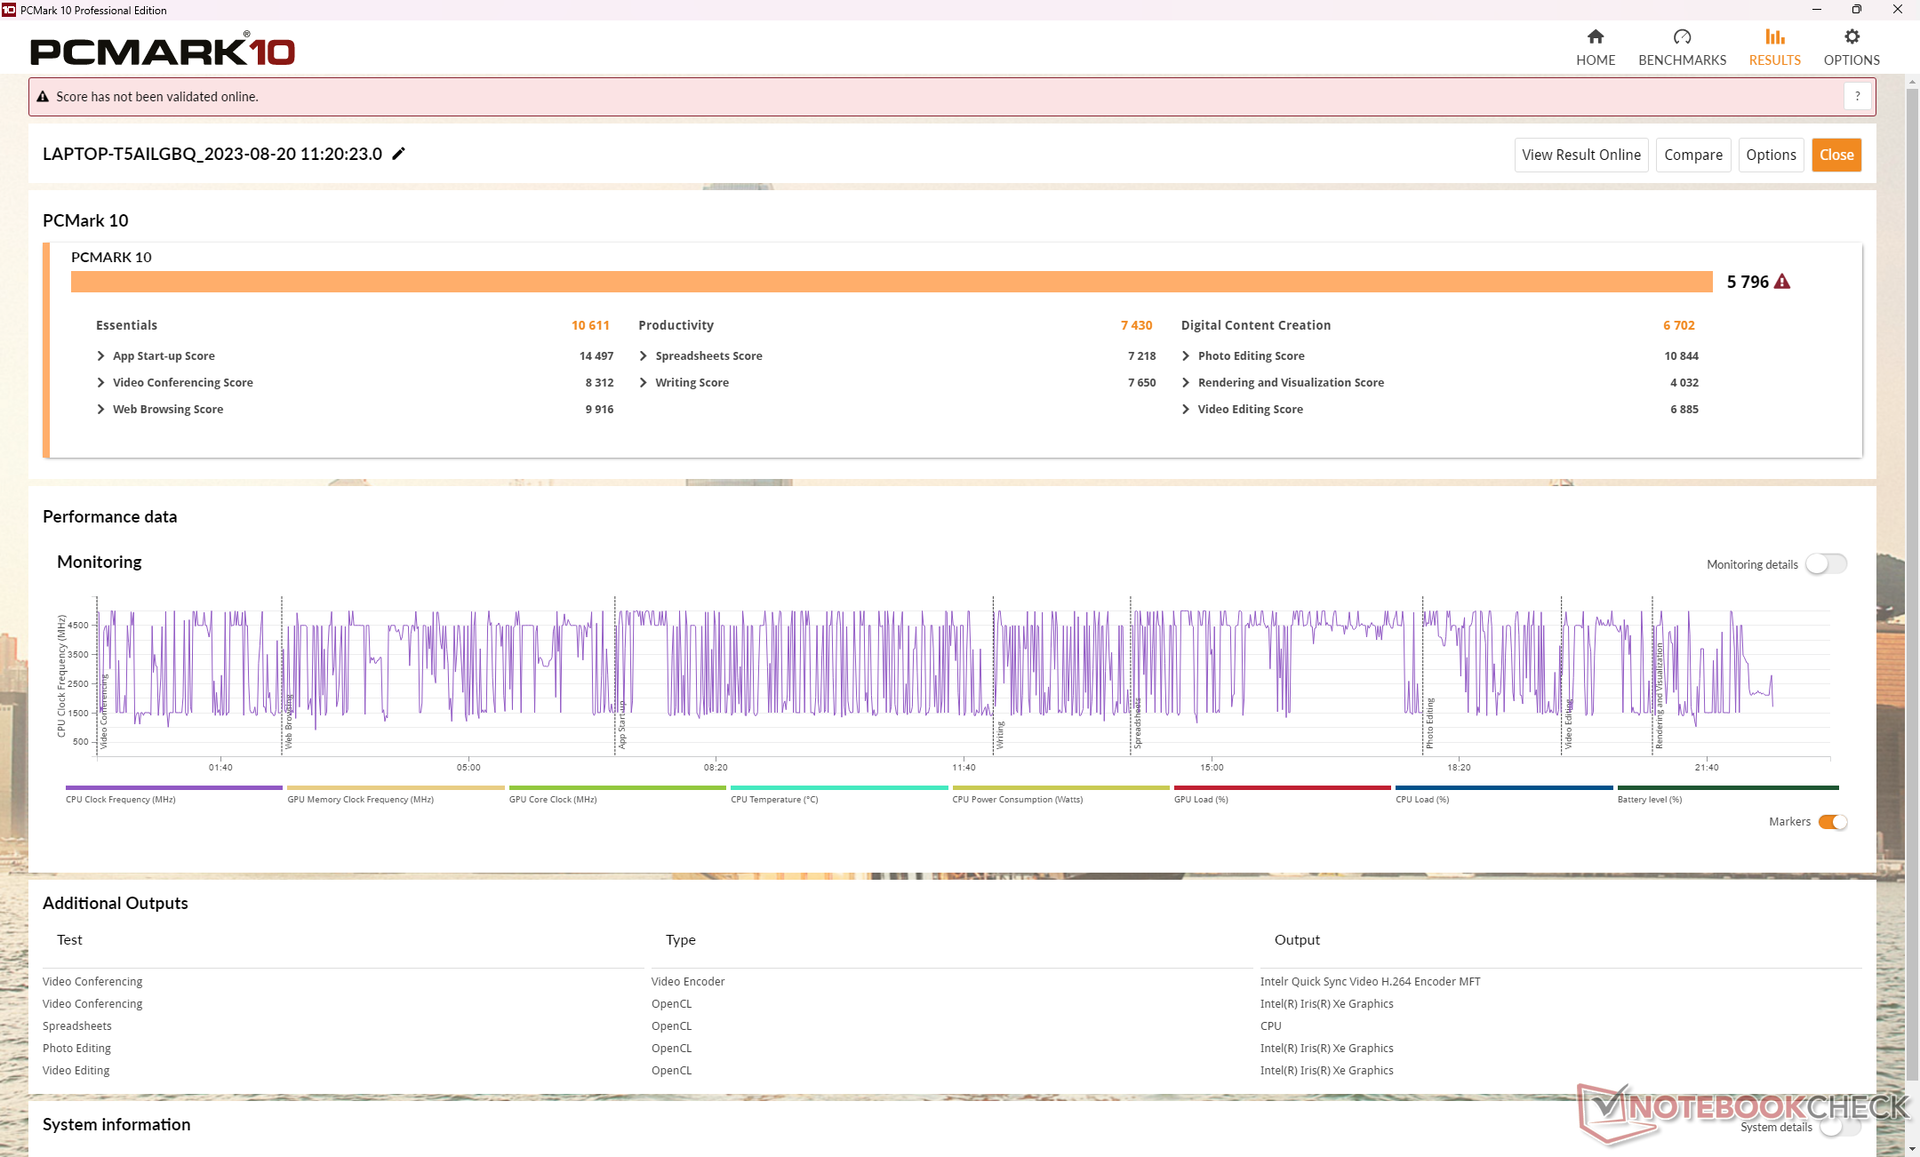
PCMark scores are slightly ahead of last year's model despite the throttle-prone CPU and integrated GPU. This may be attributed to the SSD in our 2023 model which is faster than the one that shipped on the 2022 model as demonstrated in our Storage Devices section below.
CrossMark: Overall | Productivity | Creativity | Responsiveness
| PCMark 10 / Digital Content Creation | |
| Framework Laptop 13.5 13th Gen Intel | |
| Average Intel Core i7-1360P, Intel Iris Xe Graphics G7 96EUs (6259 - 7612, n=11) | |
| Lenovo ThinkPad X1 Nano Gen 3 | |
| Lenovo ThinkPad X1 Nano Gen 2 Core i7-1280P | |
| HP Dragonfly G4 | |
| LG Gram 14Z90Q | |
| Dell Latitude 9330 | |
| PCMark 10 Score | 5796 points | |
Help | ||
* ... smaller is better
DPC Latency
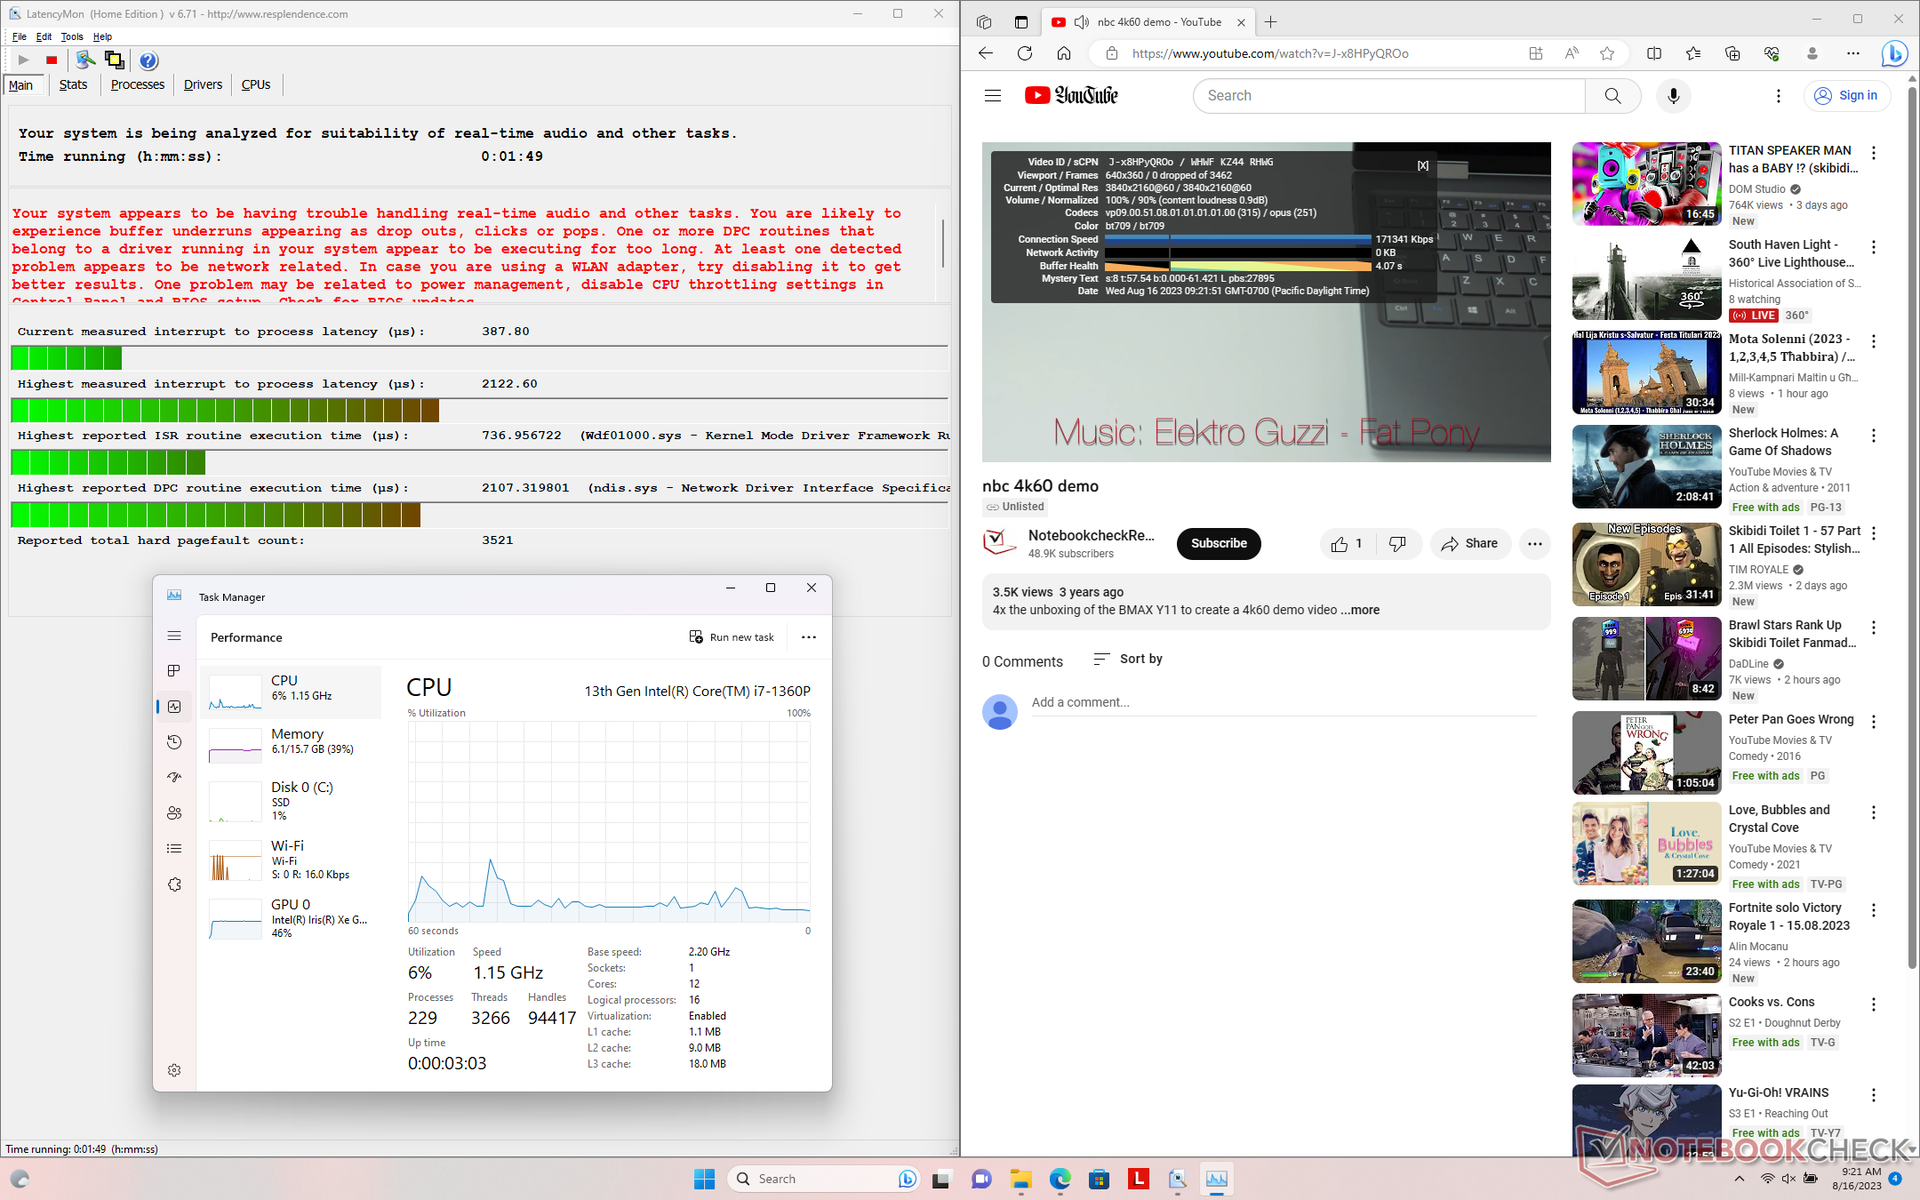
LatencyMon reveals minor DPC issues when opening multiple browser tabs of our homepage. 4K video playback at 60 FPS is otherwise smooth and with no dropped frames recorded.

| DPC Latencies / LatencyMon - interrupt to process latency (max), Web, Youtube, Prime95 | |
| Dell Latitude 9330 | |
| Lenovo ThinkPad X1 Nano Gen 3 | |
| HP Dragonfly G4 | |
| LG Gram 14Z90Q | |
| Lenovo ThinkPad X1 Nano Gen 2 Core i7-1280P | |
| Framework Laptop 13.5 13th Gen Intel | |
* ... smaller is better
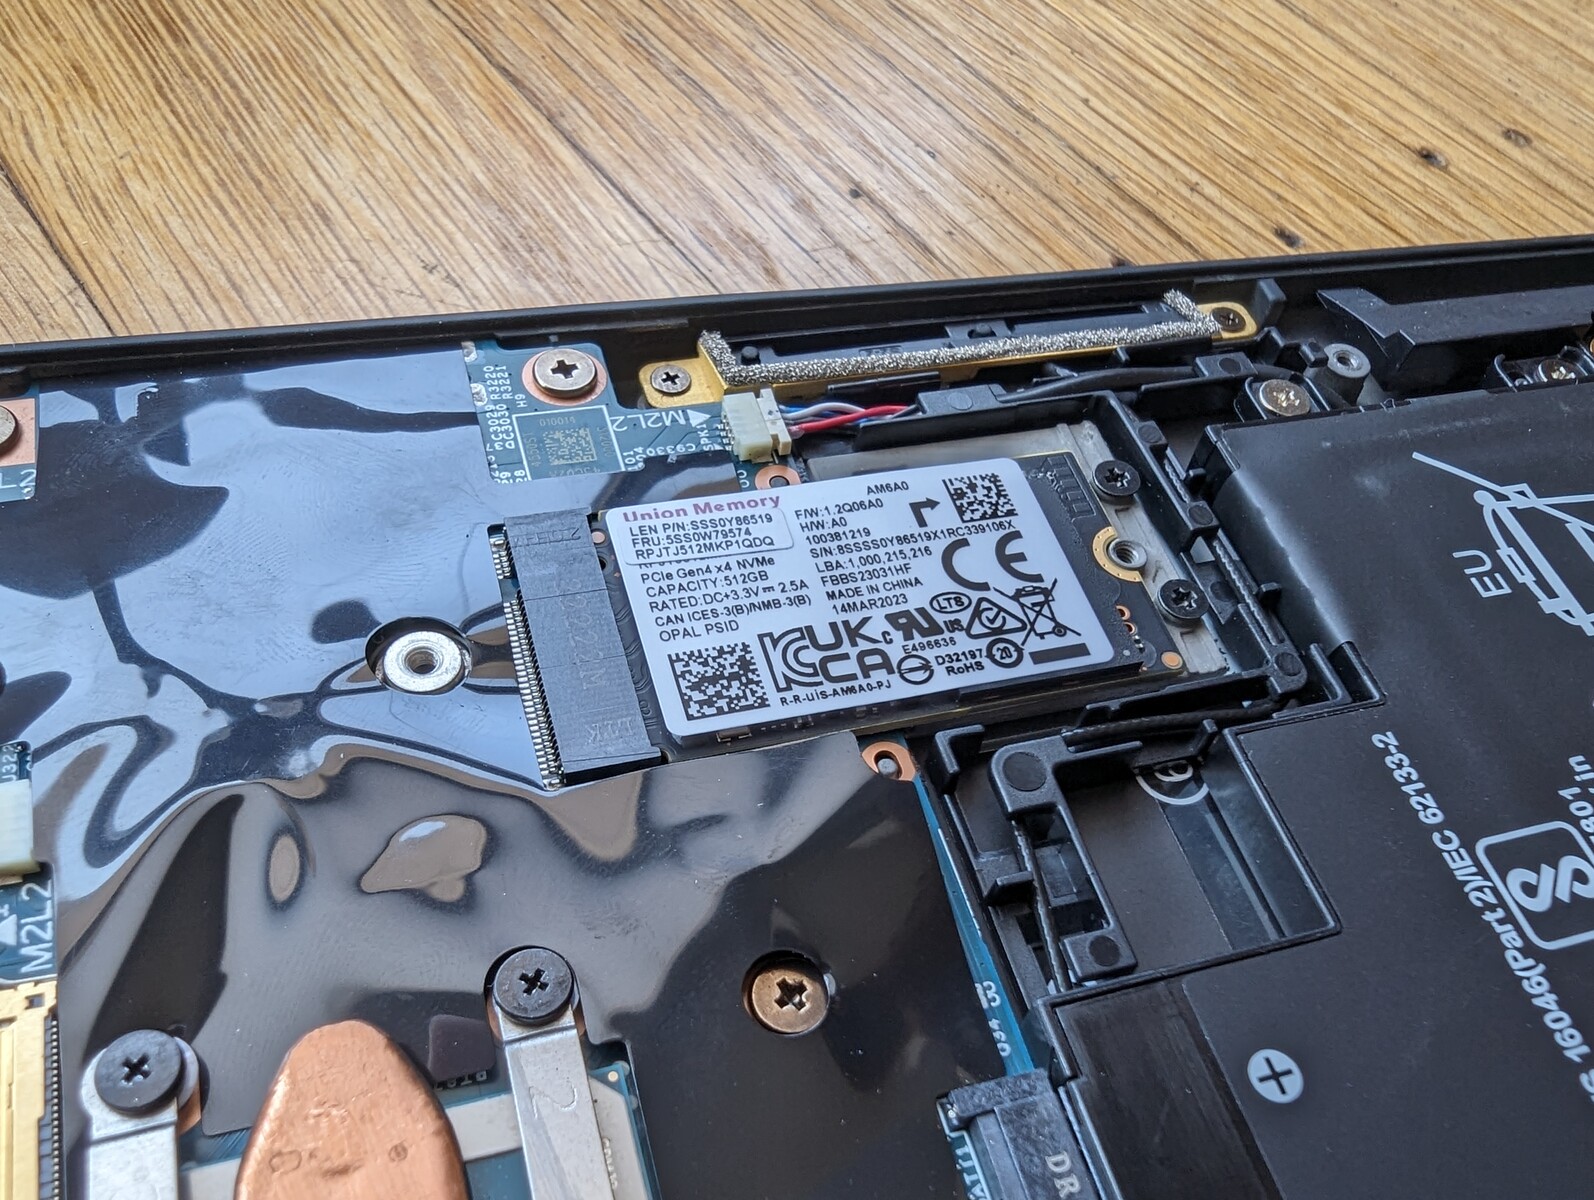
Storage Devices — Supports Up To One SSD Only
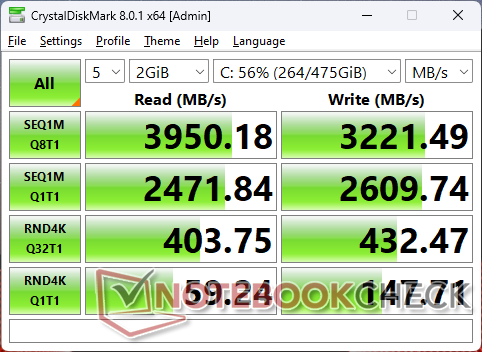
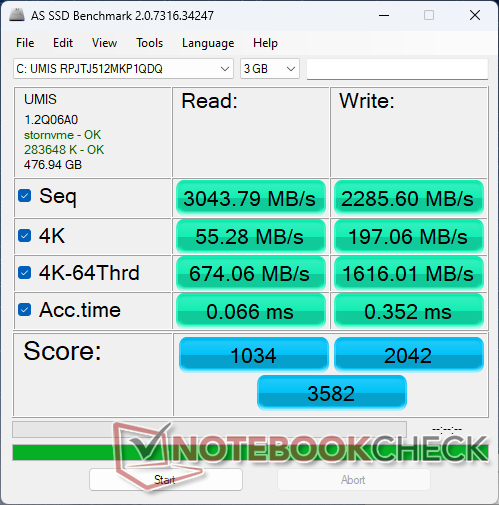
Lenovo has changed the SSD from the 1 TB Kioxia KBG5AZNT1T02 on last year's model to the 1 TB Kioxia KXG80ZNV1T02 on our 2023 model. The new drive can reach up to 4000 MB/s compared to 3000 MB/s on the older drive, but performance eventually throttles after a minute or so of heavy use.

| Drive Performance Rating - Percent | |
| LG Gram 14Z90Q | |
| Framework Laptop 13.5 13th Gen Intel | |
| HP Dragonfly G4 | |
| Dell Latitude 9330 | |
| Lenovo ThinkPad X1 Nano Gen 3 | |
| Lenovo ThinkPad X1 Nano Gen 2 Core i7-1280P | |
* ... smaller is better
Disk Throttling: DiskSpd Read Loop, Queue Depth 8
GPU Performance
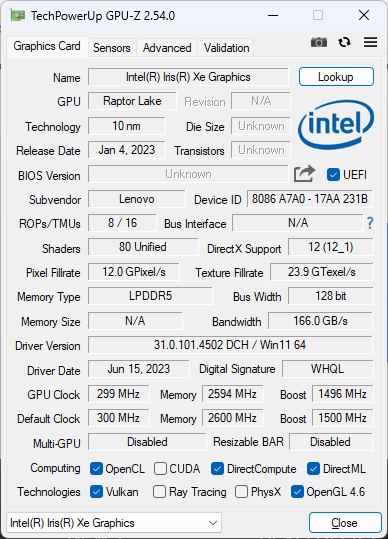
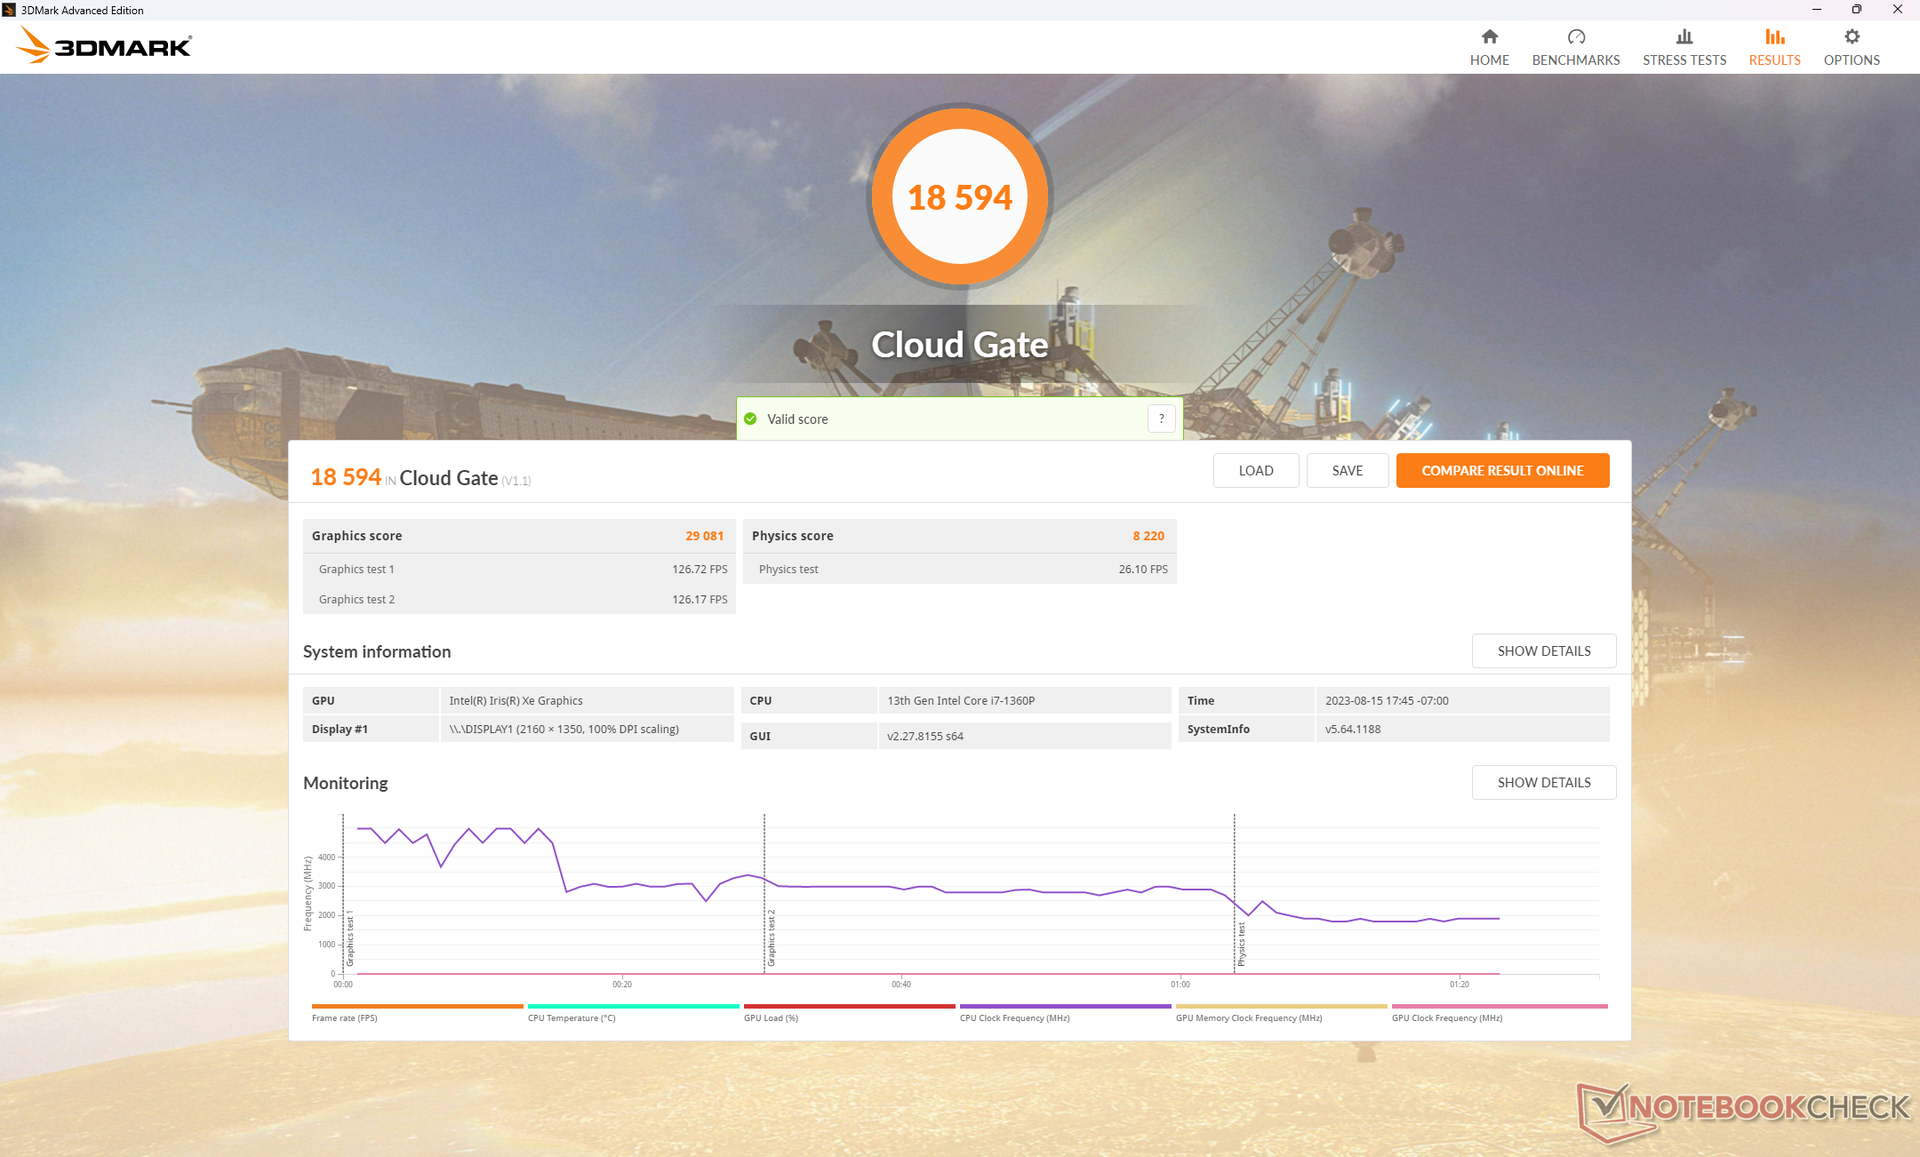
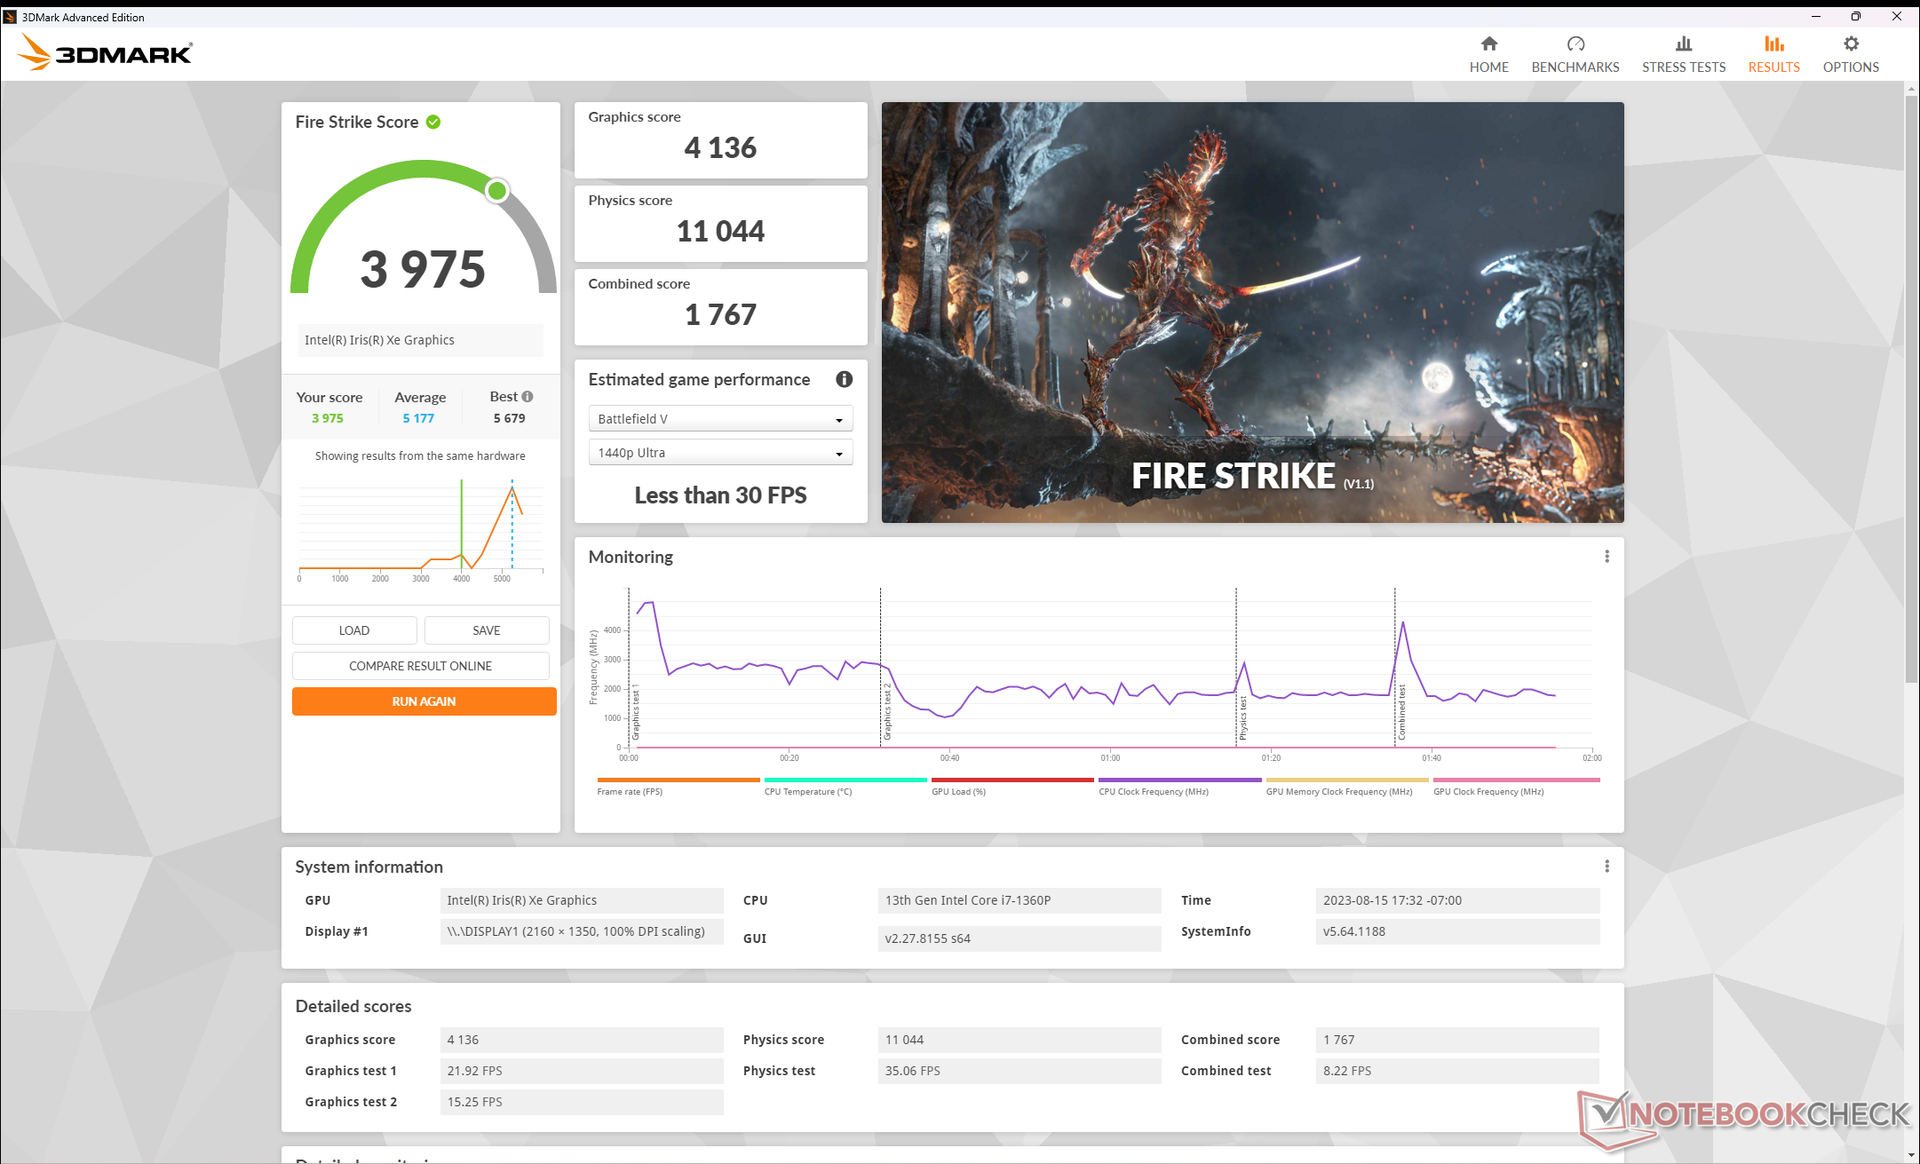
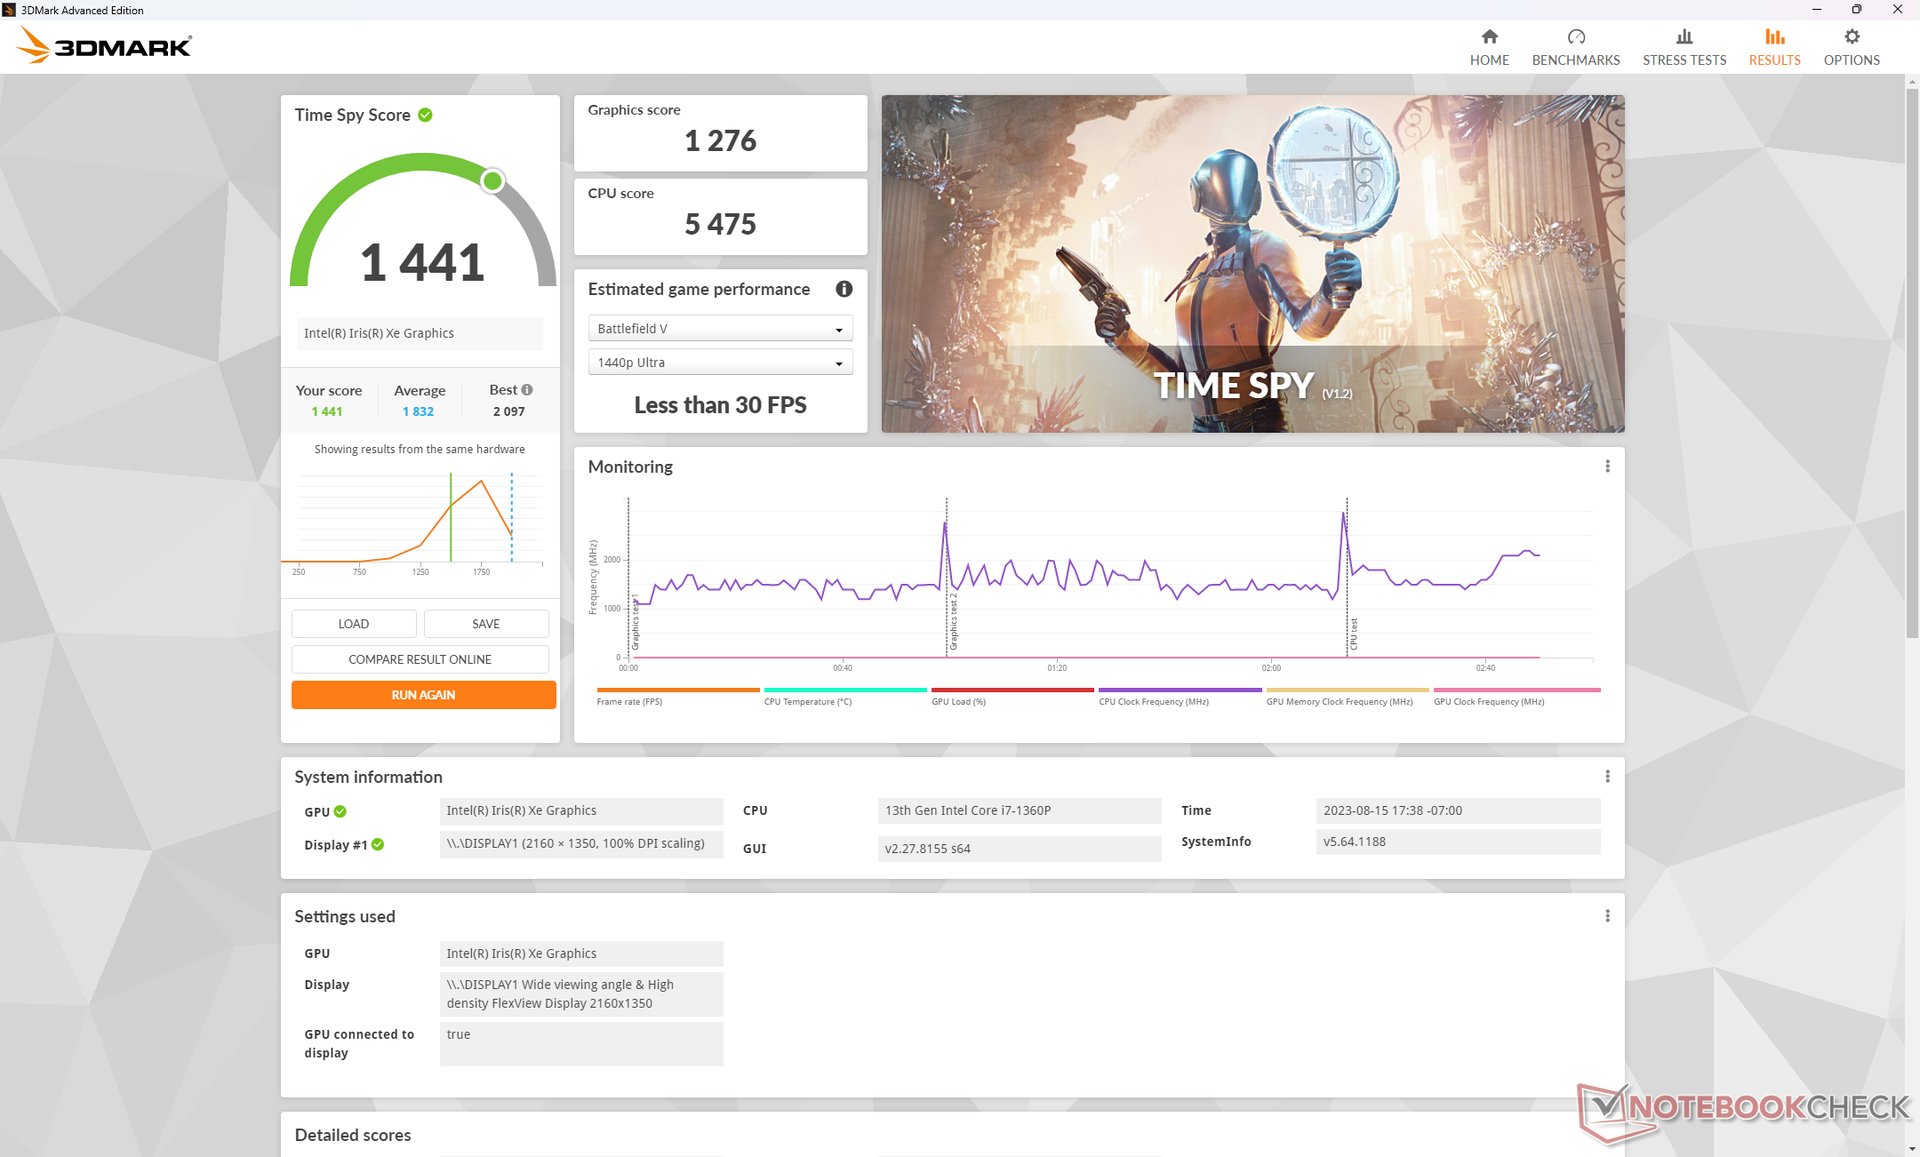
3DMark Fire Strike and Time Spy results are roughly 25 percent slower than on last year's model even though both models come with the same integrated Iris Xe 96 EUs GPU. The discrepancy can be attributed to an increase in throttling behavior on our Gen 3 unit.
Interestingly, 3DMark 11 scores are more similar year-over-year. This may suggest that there is a short period of stable GPU performance on the Gen 3 model when at a cooler state before throttling inevitably kicks in.
It's unfortunate that Lenovo doesn't offer any AMD options for its X1 Nano series as the latest Radeon 680M or 780M integrated GPUs are significantly ahead of the aging Iris Xe series.
| Power Profile | Graphics Score | Physics Score | Combined Score |
| Battery Power | 6525 (-0%) | 13950 (+25%) | 6222 (+7%) |
| Balanced Mode | 5316 (-19%) | 8919 (-20%) | 4336 (-25%) |
| Performance Mode | 6568 | 11143 | 5799 |
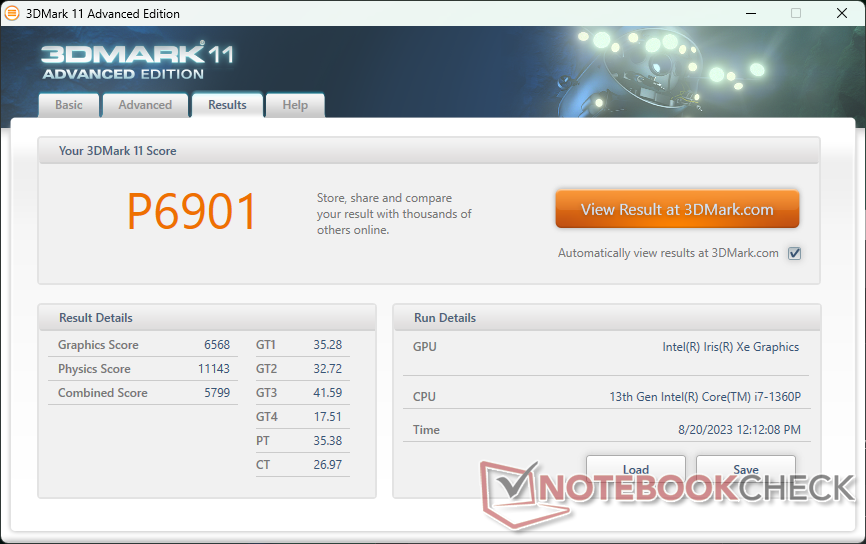
| 3DMark 11 Performance | 6901 points | |
| 3DMark Cloud Gate Standard Score | 18594 points | |
| 3DMark Fire Strike Score | 3975 points | |
| 3DMark Time Spy Score | 1441 points | |
Help | ||
| Far Cry 5 | |
| 1280x720 Low Preset AA:T | |
| Asus Zenbook S 13 OLED | |
| Average Intel Iris Xe Graphics G7 96EUs (24 - 67, n=77) | |
| Lenovo ThinkPad X1 Nano Gen 3 | |
| Dell Inspiron 13 7306-6TYH5 | |
| LG Gram 14Z90Q | |
| 1920x1080 Medium Preset AA:T | |
| Asus Zenbook S 13 OLED | |
| Average Intel Iris Xe Graphics G7 96EUs (14 - 34, n=75) | |
| Lenovo ThinkPad X1 Nano Gen 3 | |
| Dell Inspiron 13 7306-6TYH5 | |
| LG Gram 14Z90Q | |
| 1920x1080 High Preset AA:T | |
| Asus Zenbook S 13 OLED | |
| Average Intel Iris Xe Graphics G7 96EUs (10 - 31, n=72) | |
| Lenovo ThinkPad X1 Nano Gen 3 | |
| Dell Inspiron 13 7306-6TYH5 | |
| LG Gram 14Z90Q | |
| 1920x1080 Ultra Preset AA:T | |
| Asus Zenbook S 13 OLED | |
| Average Intel Iris Xe Graphics G7 96EUs (11 - 29, n=58) | |
| Lenovo ThinkPad X1 Nano Gen 3 | |
| Cyberpunk 2077 1.6 | |
| 1280x720 Low Preset | |
| Asus Zenbook S 13 OLED | |
| HP Dragonfly G4 | |
| Average Intel Iris Xe Graphics G7 96EUs (20.6 - 44.7, n=15) | |
| Lenovo ThinkPad X1 Nano Gen 3 | |
| 1920x1080 Low Preset | |
| Asus Zenbook S 13 OLED | |
| HP Dragonfly G4 | |
| Average Intel Iris Xe Graphics G7 96EUs (13 - 25.9, n=40) | |
| Lenovo ThinkPad X1 Nano Gen 2 Core i7-1280P | |
| Dell Latitude 9330 | |
| Lenovo ThinkPad X1 Nano Gen 3 | |
| 1920x1080 Medium Preset | |
| Asus Zenbook S 13 OLED | |
| HP Dragonfly G4 | |
| Lenovo ThinkPad X1 Nano Gen 2 Core i7-1280P | |
| Average Intel Iris Xe Graphics G7 96EUs (10.8 - 21.7, n=37) | |
| Dell Latitude 9330 | |
| Lenovo ThinkPad X1 Nano Gen 3 | |
| Tiny Tina's Wonderlands | |
| 1280x720 Lowest Preset (DX12) | |
| HP Dragonfly G4 | |
| Average Intel Iris Xe Graphics G7 96EUs (35.9 - 59.8, n=21) | |
| Lenovo ThinkPad X1 Nano Gen 3 | |
| 1920x1080 Low Preset (DX12) | |
| Framework Laptop 13.5 13th Gen Intel | |
| Average Intel Iris Xe Graphics G7 96EUs (22.3 - 33.1, n=22) | |
| HP Dragonfly G4 | |
| Lenovo ThinkPad X1 Nano Gen 3 | |
| 1920x1080 Medium Preset (DX12) | |
| Framework Laptop 13.5 13th Gen Intel | |
| Average Intel Iris Xe Graphics G7 96EUs (17 - 28.2, n=22) | |
| HP Dragonfly G4 | |
| Lenovo ThinkPad X1 Nano Gen 3 | |
| 1920x1080 High Preset (DX12) | |
| Framework Laptop 13.5 13th Gen Intel | |
| Average Intel Iris Xe Graphics G7 96EUs (10.6 - 18.1, n=21) | |
| HP Dragonfly G4 | |
| Lenovo ThinkPad X1 Nano Gen 3 | |
| 1920x1080 Badass Preset (DX12) | |
| Framework Laptop 13.5 13th Gen Intel | |
| Average Intel Iris Xe Graphics G7 96EUs (8.4 - 14.3, n=18) | |
| HP Dragonfly G4 | |
| Lenovo ThinkPad X1 Nano Gen 3 | |
Frame rates when idling on Witcher 3 would cycle between 62 and 88 FPS whereas frame rates on last year's ThinkPad X1 Nano Gen 2 would be much more stable as shown by the graph below. The unstable frame rates aren't a huge issue since the ThinkPad X1 Nano series isn't designed for gaming and users can still stream games smoothly via cloud, but steady GPU performance is always preferable.
Witcher 3 FPS Chart
| low | med. | high | ultra | |
| The Witcher 3 (2015) | 90.7 | 60.9 | 32.4 | 12.6 |
| Dota 2 Reborn (2015) | 103.2 | 65.1 | 59 | 45.7 |
| Final Fantasy XV Benchmark (2018) | 35.2 | 20.6 | 14.6 | |
| X-Plane 11.11 (2018) | 40.1 | 32.6 | 30.2 | |
| Far Cry 5 (2018) | 41 | 24 | 22 | 22 |
| Strange Brigade (2018) | 78.5 | 35.1 | 27.3 | 21 |
| Cyberpunk 2077 1.6 (2022) | 13 | 10.8 | ||
| Tiny Tina's Wonderlands (2022) | 23.1 | 18.3 | 11.9 | 8.9 |
| F1 22 (2022) | 41.2 | 36.6 | 27.1 | 18.5 |
Emissions — A Bit Quieter
System Noise
Fan noise is silent when at a cool state, but it typically hovers around 25.6 dB(A) in realistic browsing or video streaming scenarios which is still essentially inaudible in office space or classroom environments. Interestingly, the newer model is quieter than the older one when running higher loads (37 dB(A) vs. 41 dB(A)) which correlates with the slower performance mentioned above.
Noise Level
| Idle |
| 23 / 23 / 23 dB(A) |
| Load |
| 32.8 / 36.9 dB(A) |
 | ||
30 dB silent 40 dB(A) audible 50 dB(A) loud |
||
min: | ||
| Lenovo ThinkPad X1 Nano Gen 3 Iris Xe G7 96EUs, i7-1360P, Lenovo UMIS AM6A0 RPJTJ512MKP1QDQ | Lenovo ThinkPad X1 Nano Gen 2 Core i7-1280P Iris Xe G7 96EUs, i7-1280P, Kioxia BG5 KBG5AZNT1T02 | HP Dragonfly G4 Iris Xe G7 96EUs, i7-1365U, Micron 3400 MTFDKBA512TFH 512GB | Framework Laptop 13.5 13th Gen Intel Iris Xe G7 96EUs, i7-1370P, WD PC SN740 SDDPNQD-1T00 | Dell Latitude 9330 Iris Xe G7 96EUs, i7-1260U | Apple MacBook Air M2 10C GPU M2 10-Core GPU, M2, Apple SSD AP1024Z | LG Gram 14Z90Q Iris Xe G7 80EUs, i5-1240P, Samsung PM9A1 MZVL2512HCJQ | |
|---|---|---|---|---|---|---|---|
| Noise | -1% | 1% | -15% | -5% | -9% | ||
| off / environment * | 22.9 | 23.3 -2% | 23.3 -2% | 23.2 -1% | 23 -0% | 25 -9% | |
| Idle Minimum * | 23 | 23.9 -4% | 23.5 -2% | 23.2 -1% | 23 -0% | 26 -13% | |
| Idle Average * | 23 | 23.9 -4% | 23.5 -2% | 23.2 -1% | 23.1 -0% | 27 -17% | |
| Idle Maximum * | 23 | 23.9 -4% | 26.8 -17% | 23.2 -1% | 23.1 -0% | 28 -22% | |
| Load Average * | 32.8 | 23.3 29% | 27.2 17% | 45.3 -38% | 37.1 -13% | 35 -7% | |
| Witcher 3 ultra * | 36.9 | 40.9 -11% | 32.7 11% | 47.9 -30% | 40.6 -10% | 36 2% | |
| Load Maximum * | 36.9 | 40.9 -11% | 35 5% | 49.2 -33% | 40.5 -10% | 36 2% |
* ... smaller is better
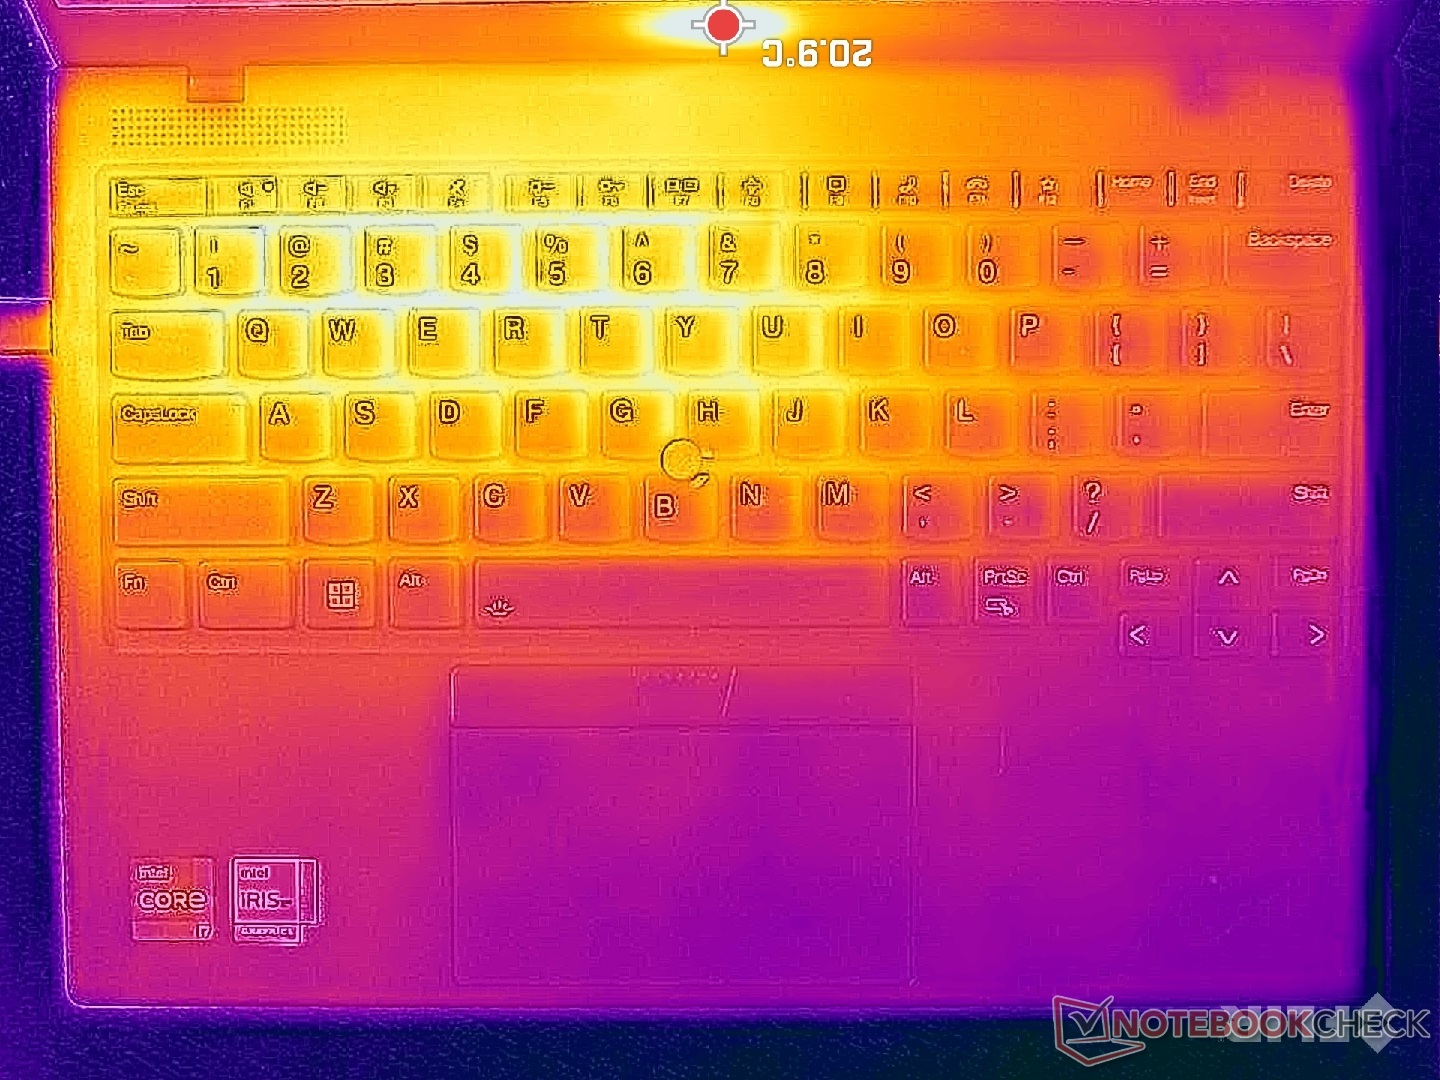
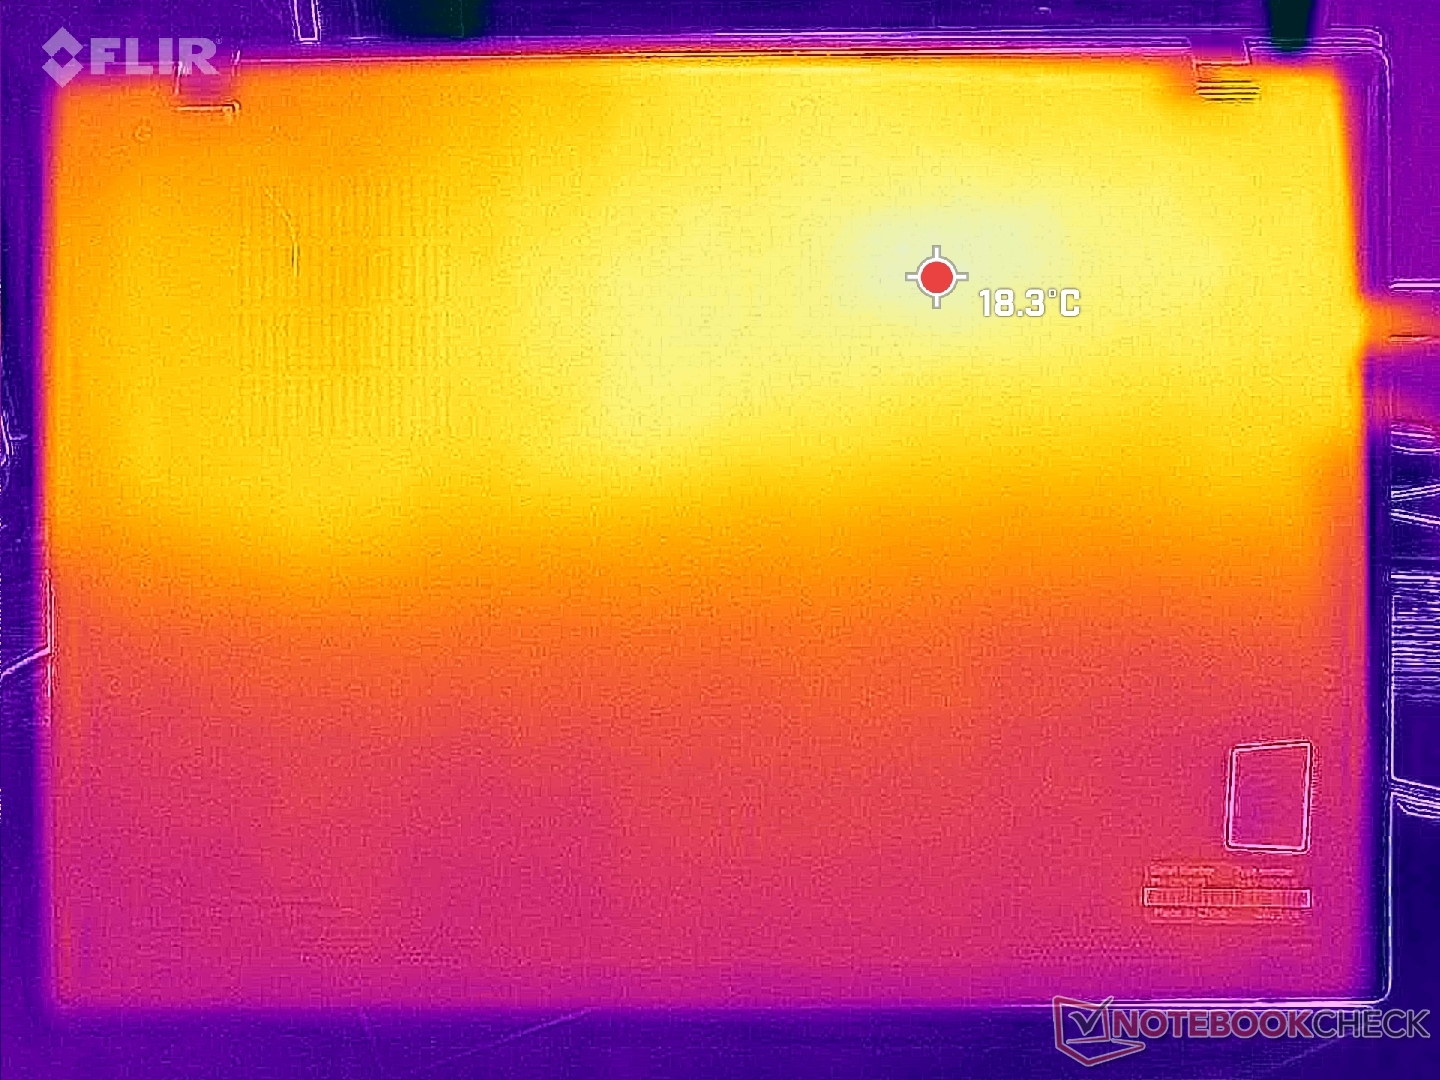
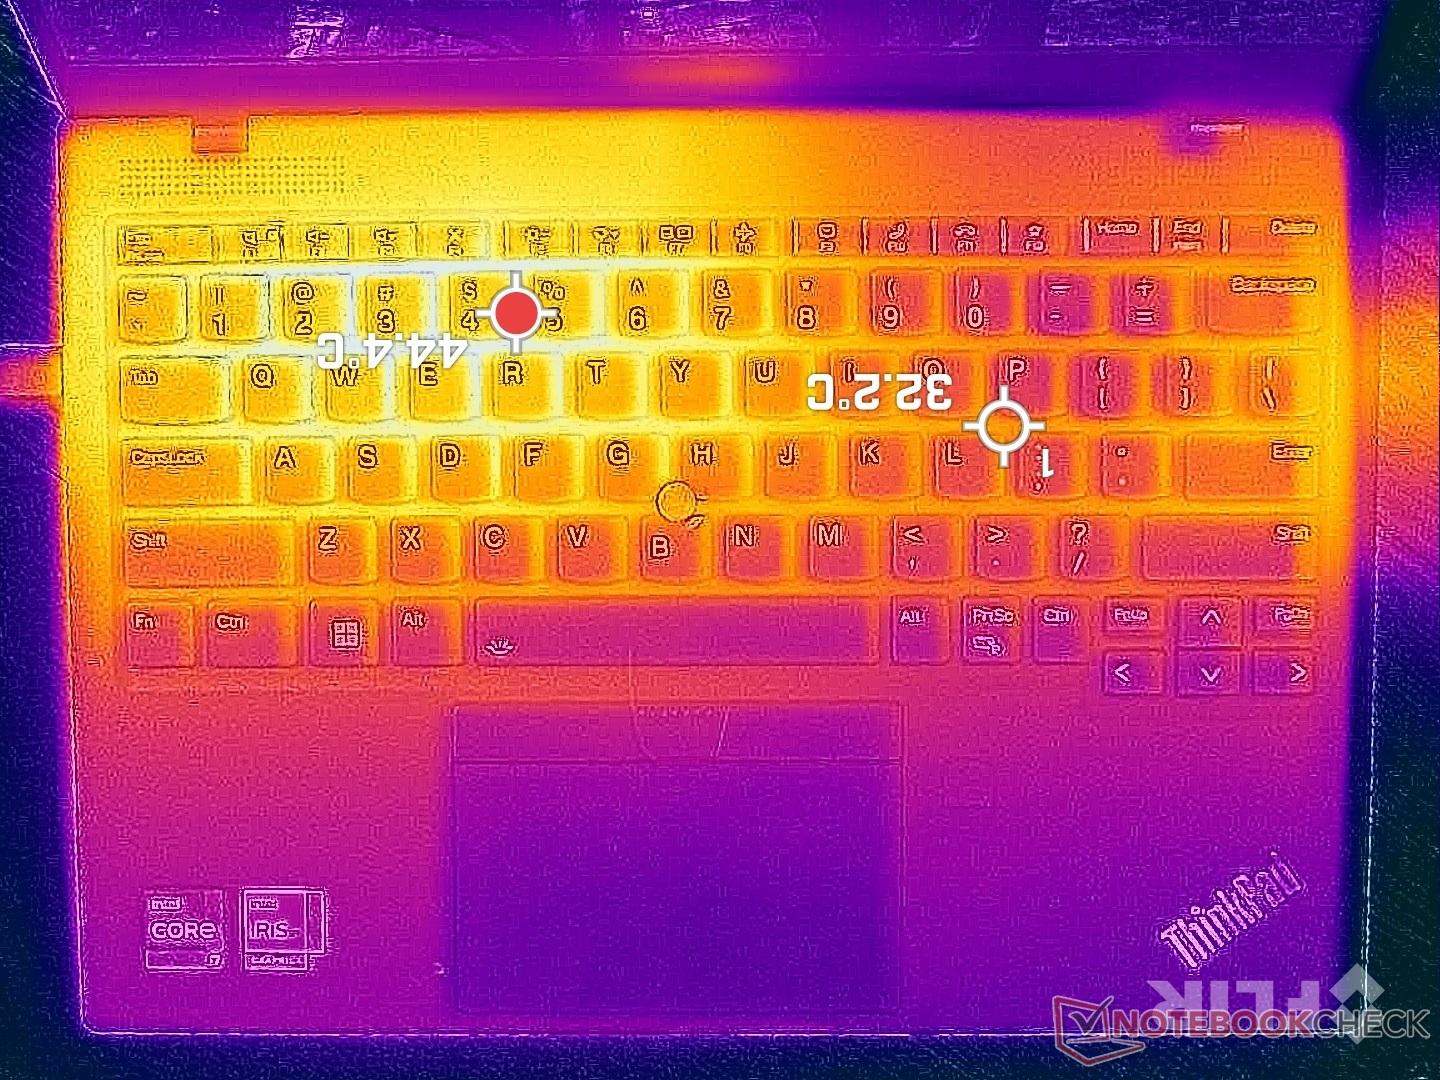
Temperature
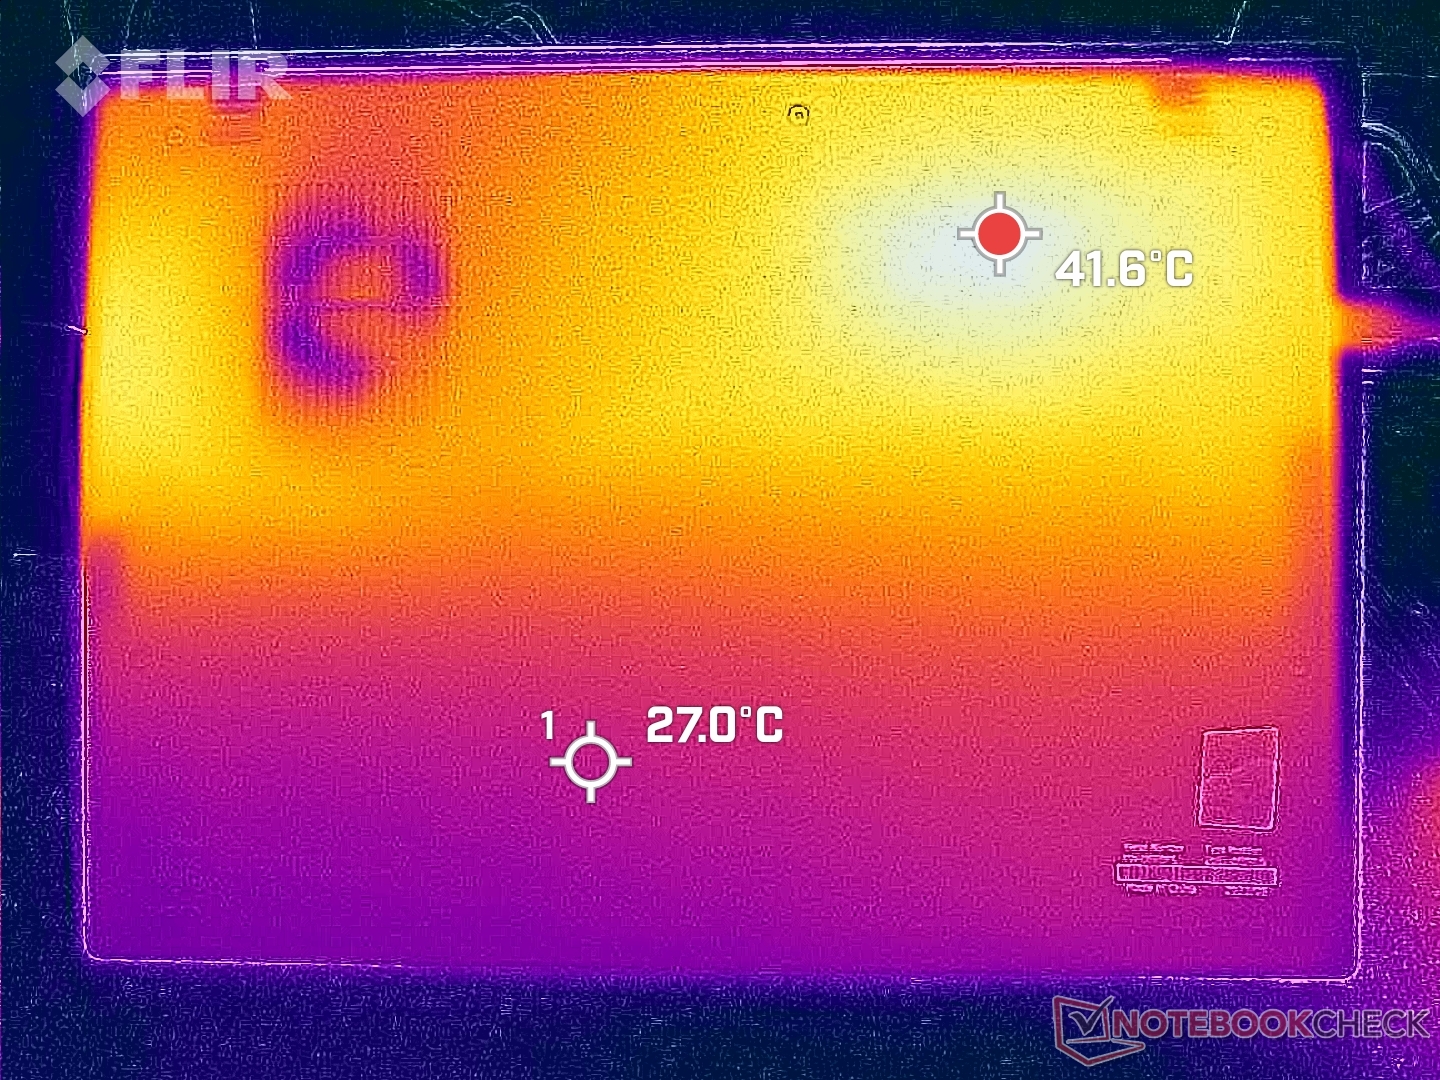
Surface temperatures are warmer than on most other subnotebooks since the cooling solution for the ThinkPad X1 Nano is so small. The keyboard and bottom surface can be as warm as 38 to 43 C which is several degrees warmer than on the HP Dragonfly G4 when under similar heavy loads.
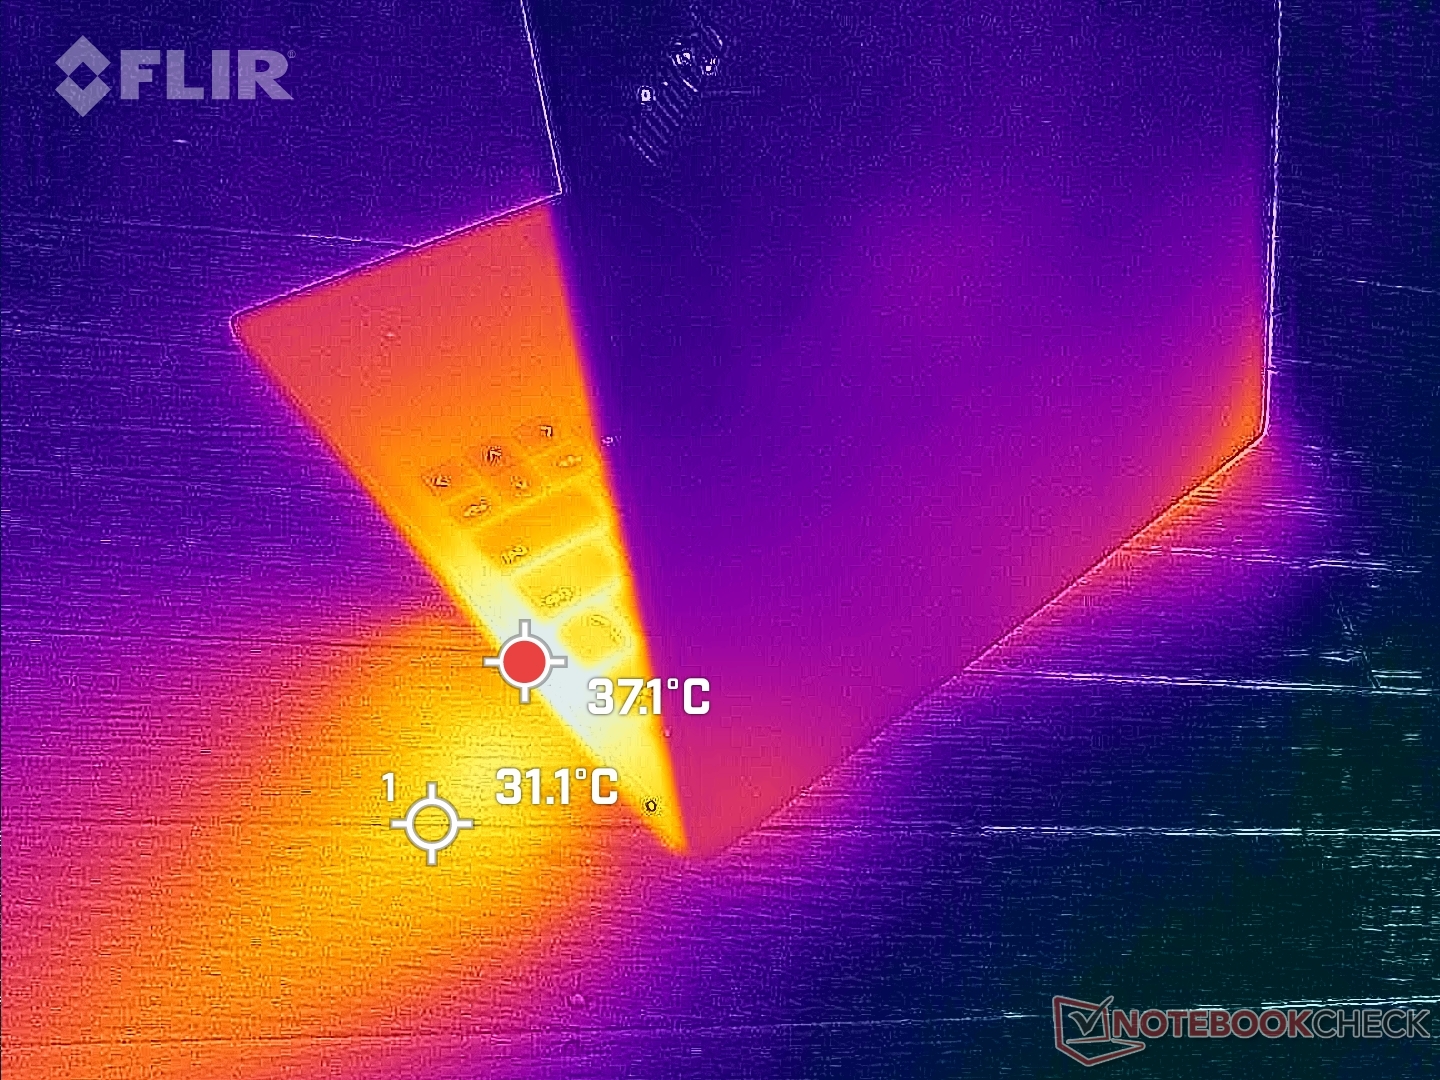
(±) The maximum temperature on the upper side is 44 °C / 111 F, compared to the average of 35.9 °C / 97 F, ranging from 21.4 to 59 °C for the class Subnotebook.
(±) The bottom heats up to a maximum of 43.2 °C / 110 F, compared to the average of 39.4 °C / 103 F
(+) In idle usage, the average temperature for the upper side is 24 °C / 75 F, compared to the device average of 30.7 °C / 87 F.
(+) The palmrests and touchpad are reaching skin temperature as a maximum (32 °C / 89.6 F) and are therefore not hot.
(-) The average temperature of the palmrest area of similar devices was 28.3 °C / 82.9 F (-3.7 °C / -6.7 F).
| Lenovo ThinkPad X1 Nano Gen 3 Intel Core i7-1360P, Intel Iris Xe Graphics G7 96EUs | Lenovo ThinkPad X1 Nano Gen 2 Core i7-1280P Intel Core i7-1280P, Intel Iris Xe Graphics G7 96EUs | HP Dragonfly G4 Intel Core i7-1365U, Intel Iris Xe Graphics G7 96EUs | Framework Laptop 13.5 13th Gen Intel Intel Core i7-1370P, Intel Iris Xe Graphics G7 96EUs | Dell Latitude 9330 Intel Core i7-1260U, Intel Iris Xe Graphics G7 96EUs | Apple MacBook Air M2 10C GPU Apple M2, Apple M2 10-Core GPU | LG Gram 14Z90Q Intel Core i5-1240P, Intel Iris Xe Graphics G7 80EUs | |
|---|---|---|---|---|---|---|---|
| Heat | -2% | -1% | 2% | -4% | -1% | -4% | |
| Maximum Upper Side * | 44 | 42.4 4% | 38.6 12% | 38.2 13% | 40.6 8% | 44.7 -2% | 43 2% |
| Maximum Bottom * | 43.2 | 40.2 7% | 40.4 6% | 41.4 4% | 50.2 -16% | 44.6 -3% | 45 -4% |
| Idle Upper Side * | 25.6 | 27.8 -9% | 28.2 -10% | 25.8 -1% | 25 2% | 25.1 2% | 27 -5% |
| Idle Bottom * | 25.6 | 27.8 -9% | 29 -13% | 27.6 -8% | 27.6 -8% | 25.3 1% | 28 -9% |
* ... smaller is better
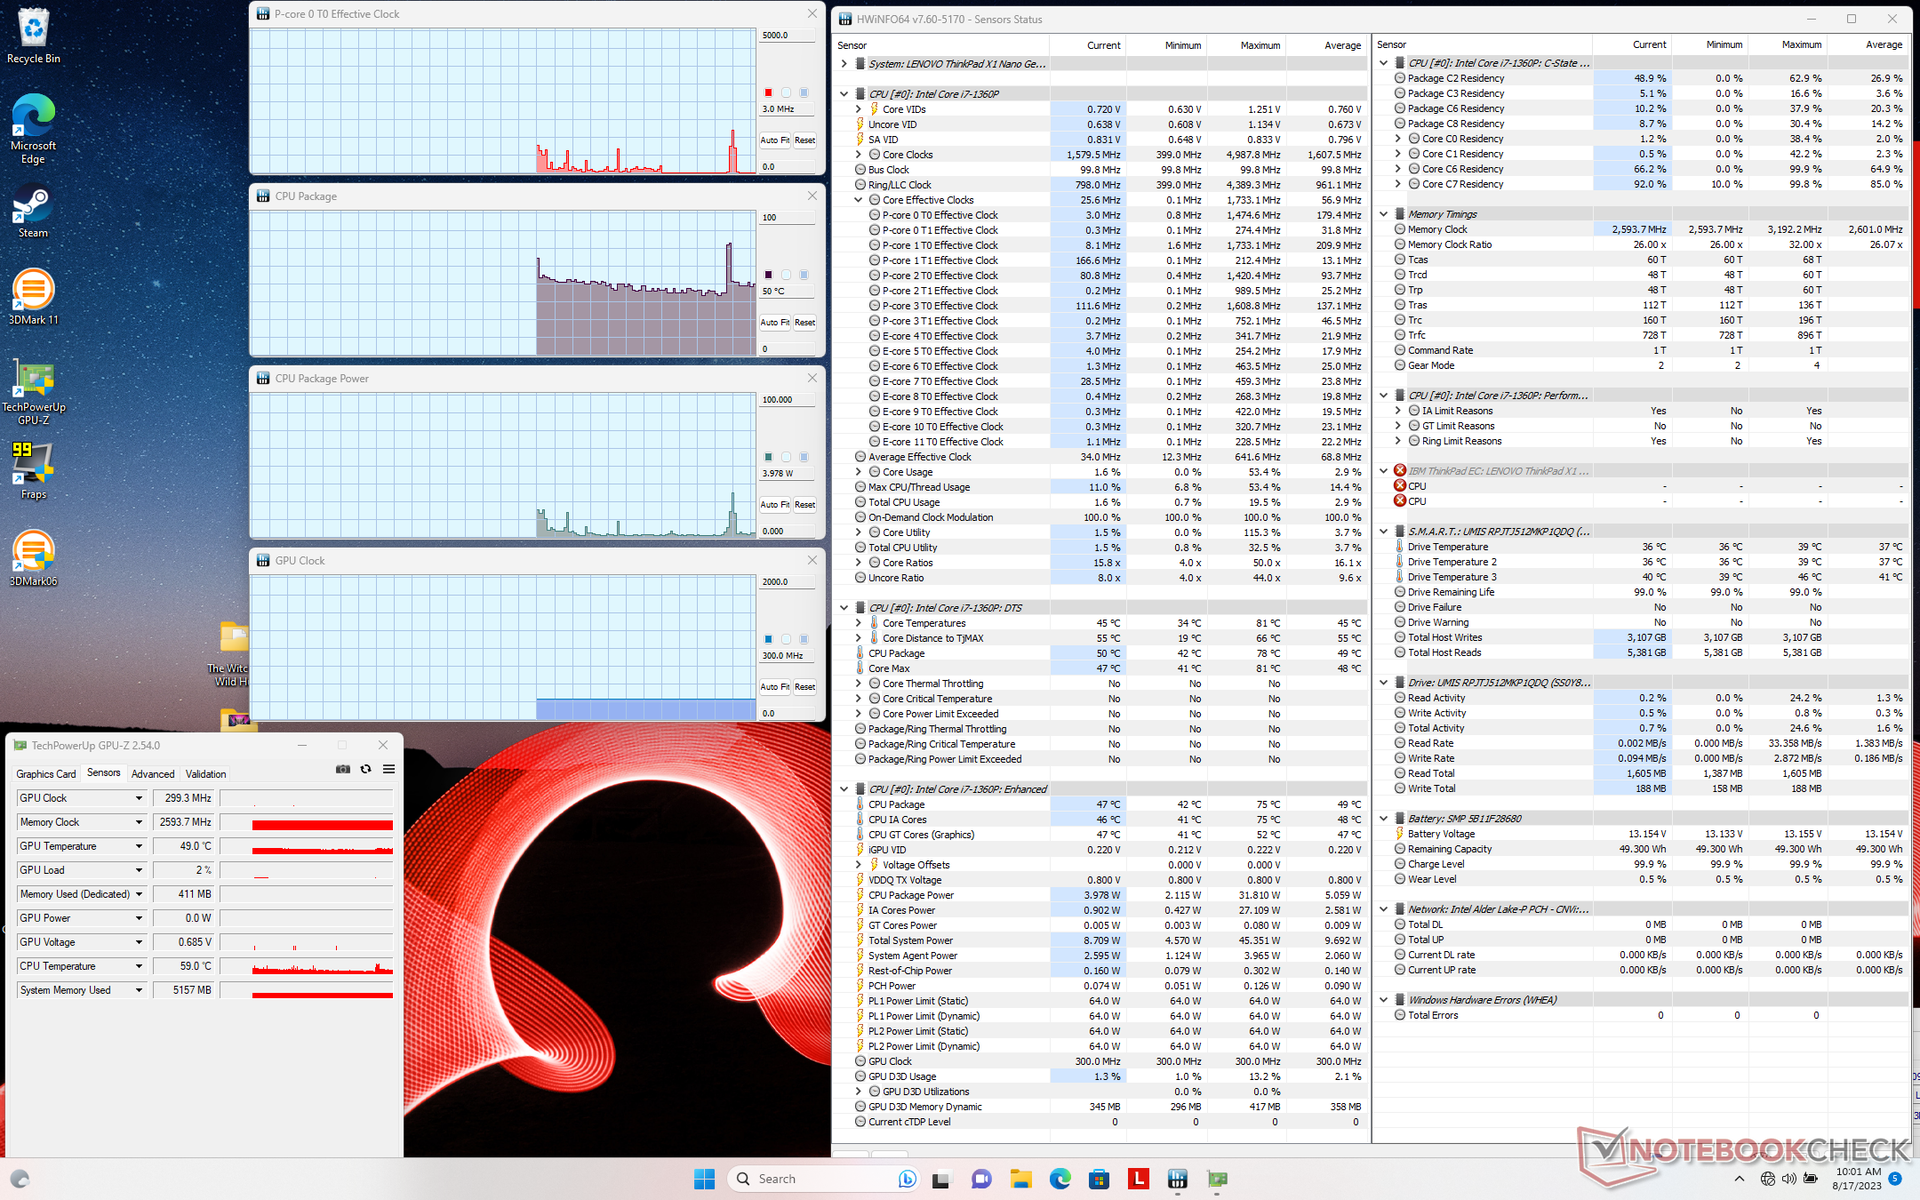
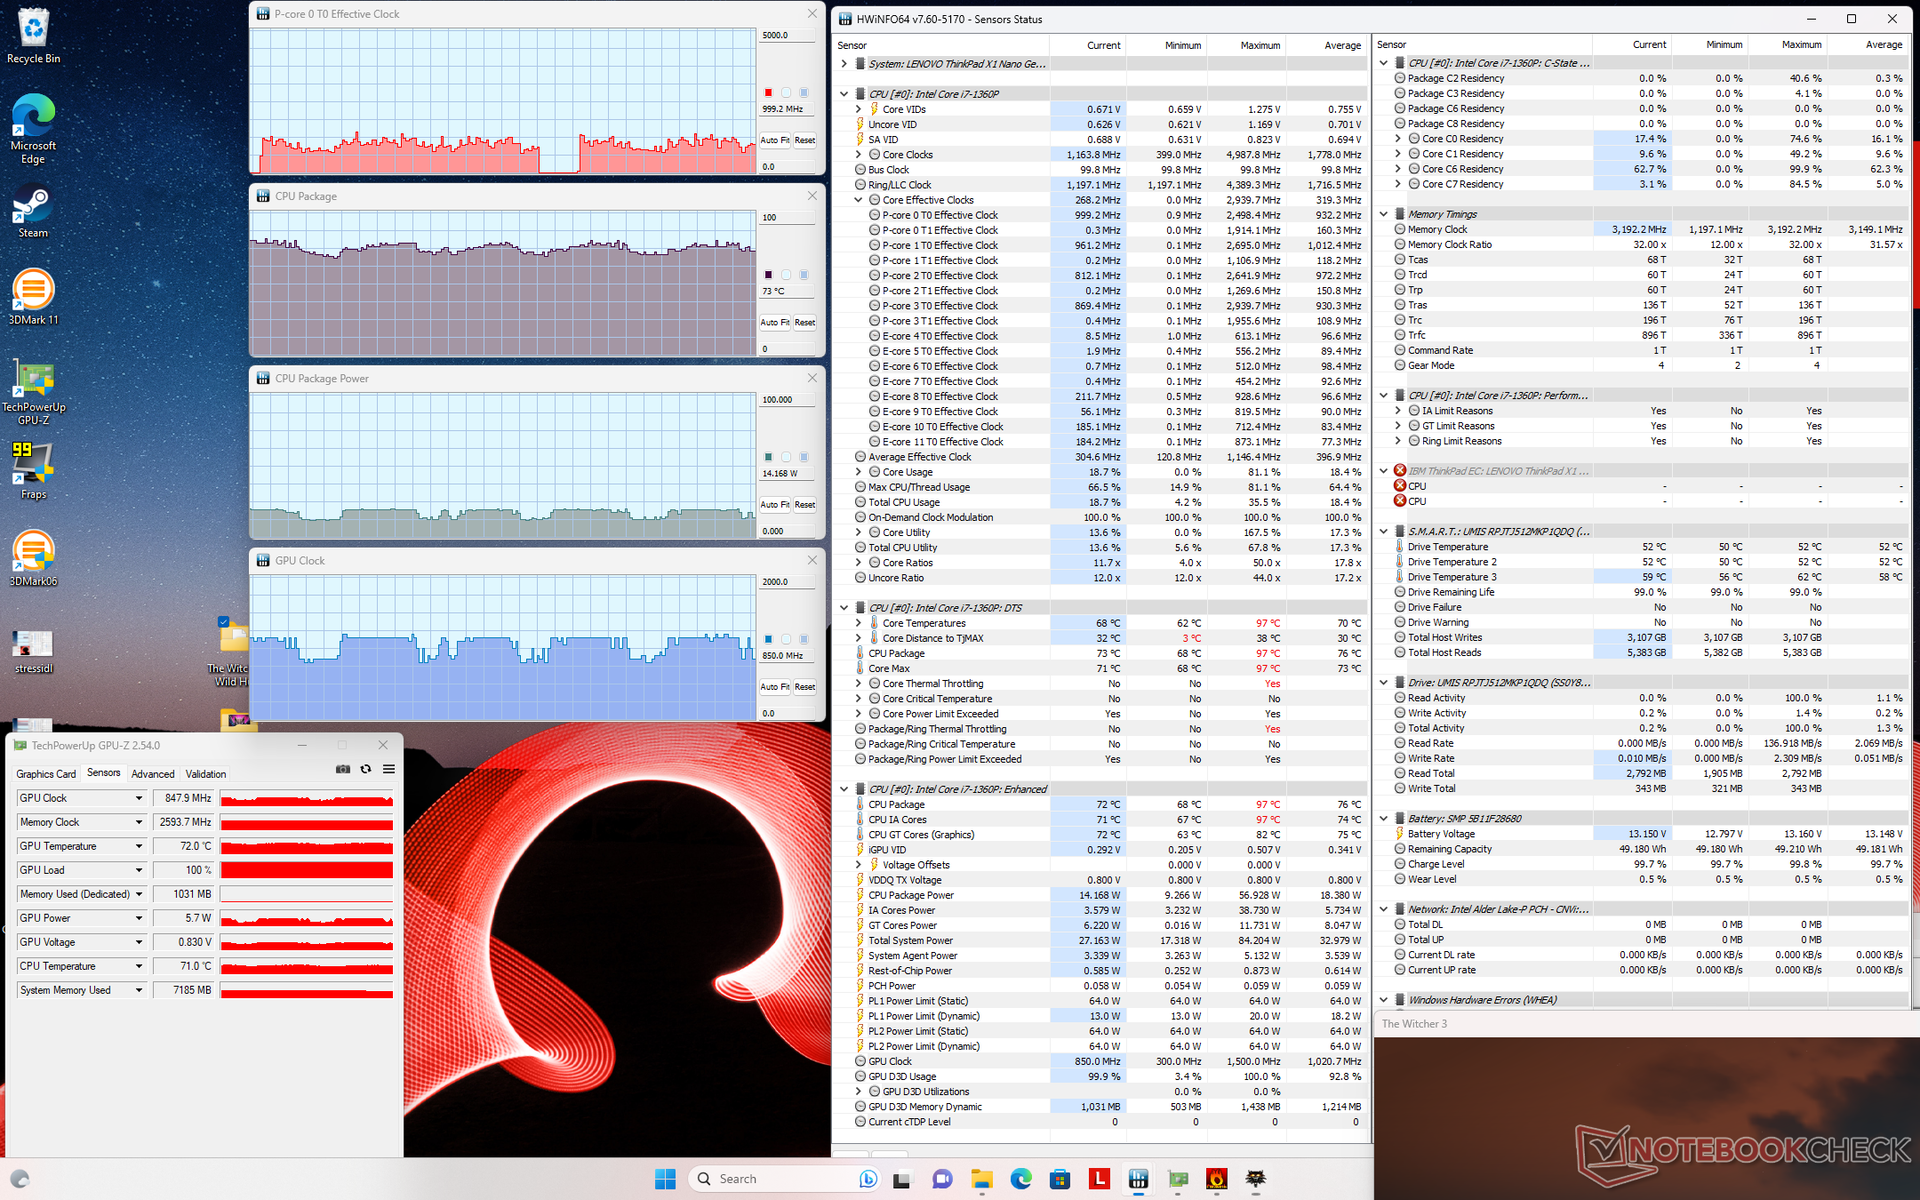
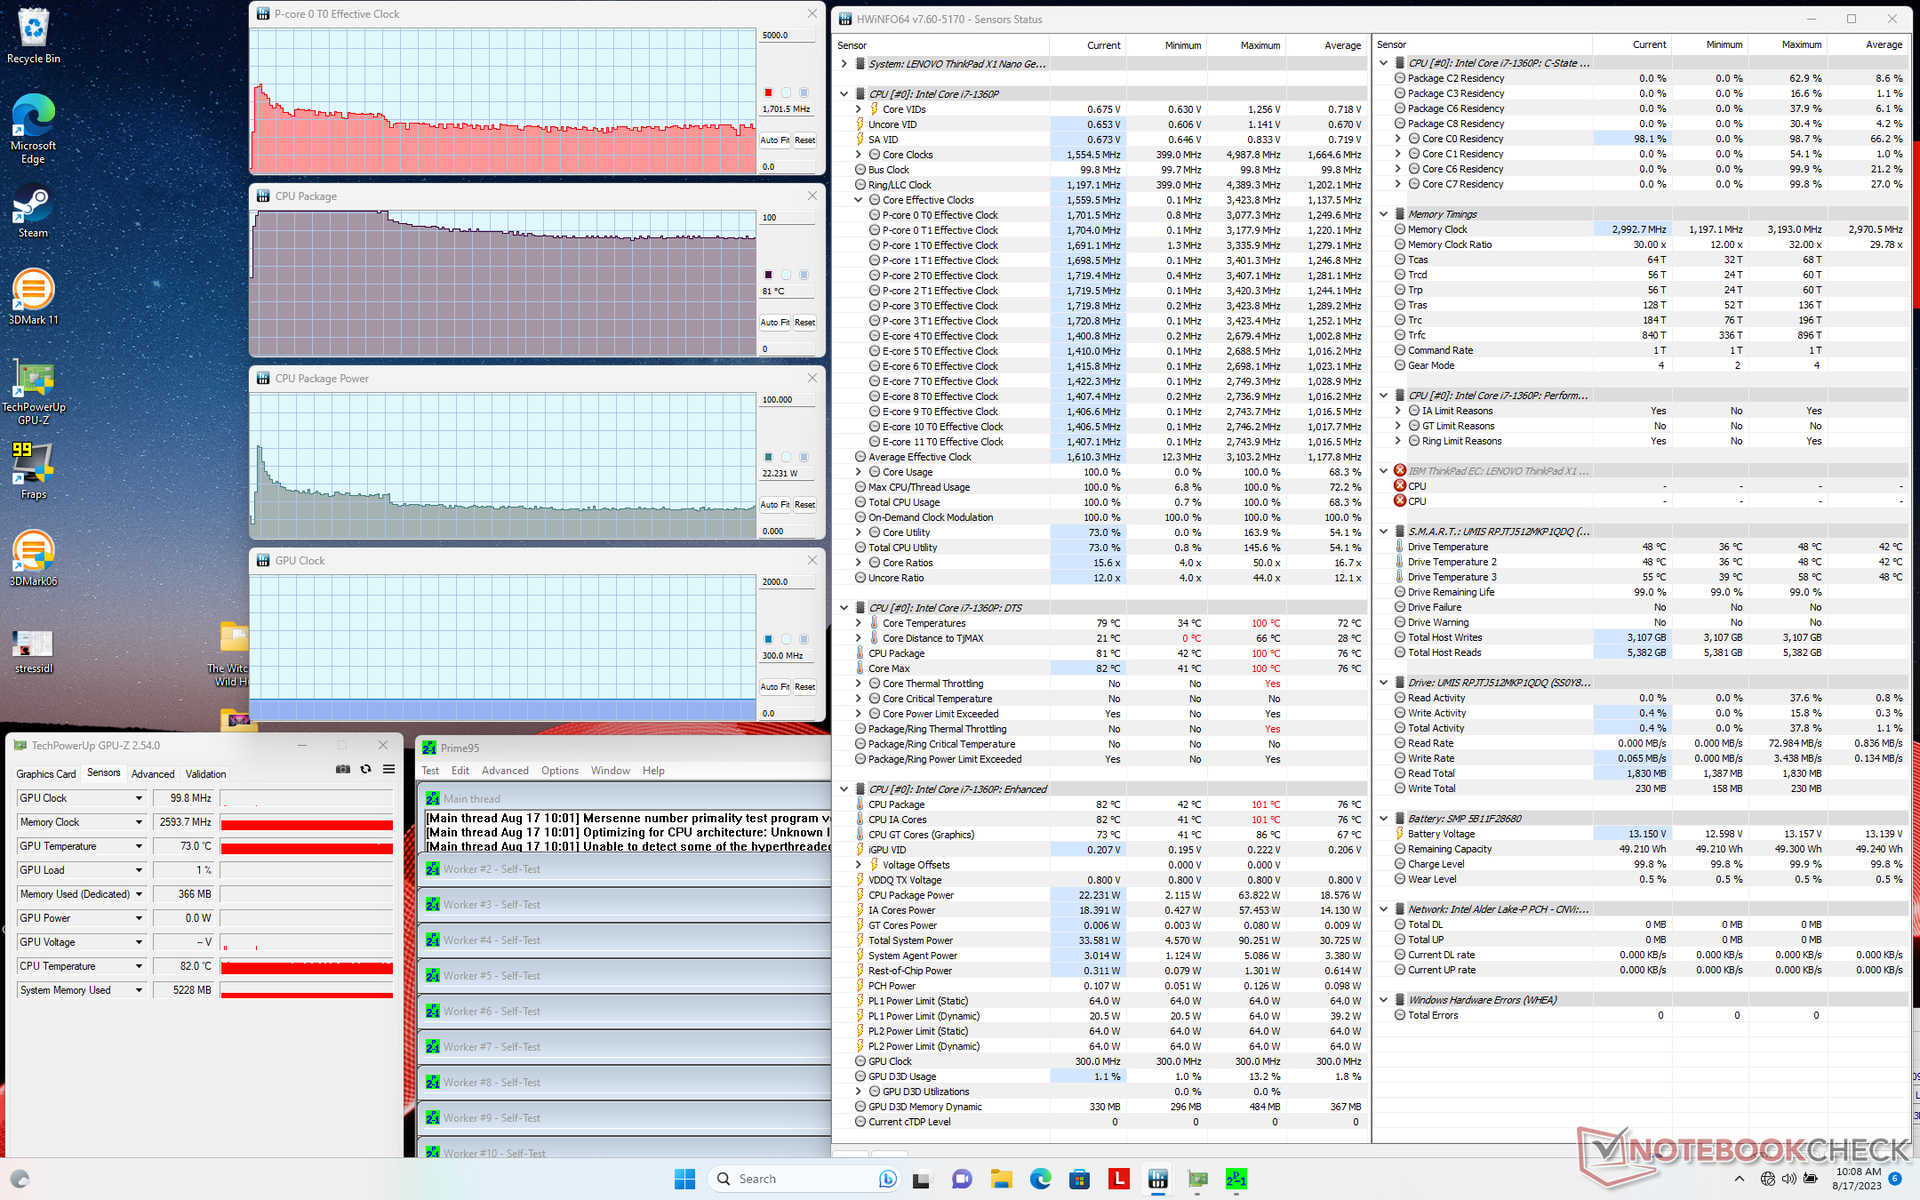
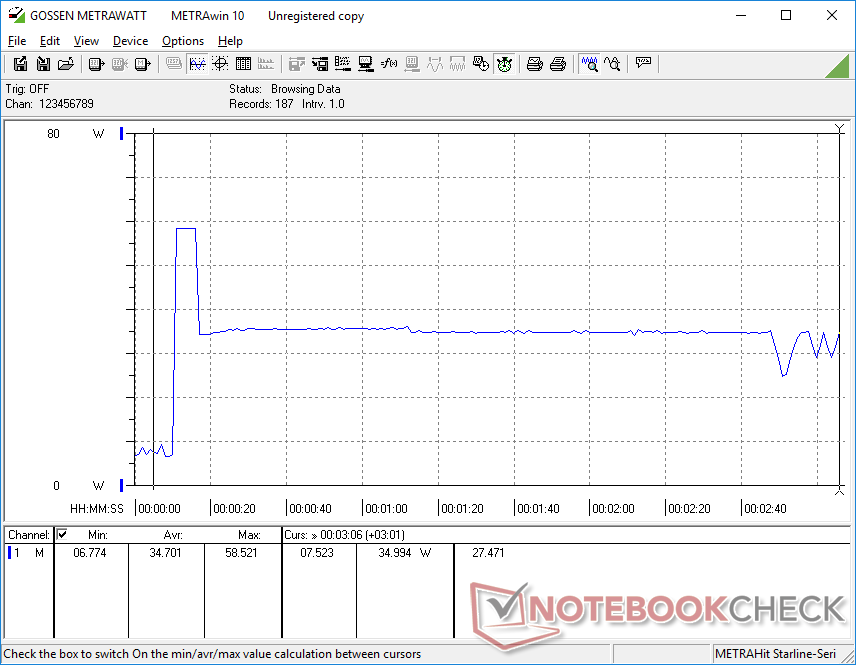
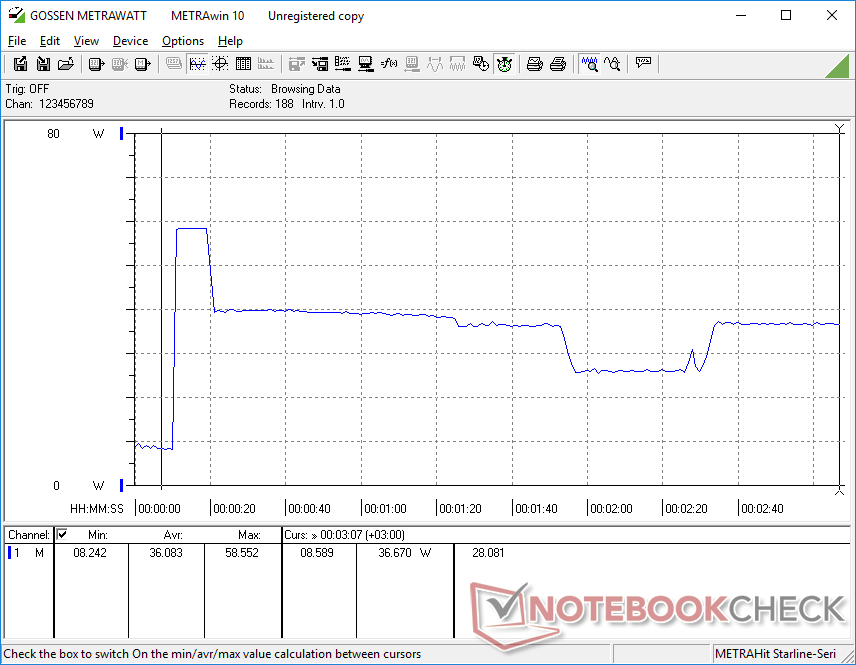
Stress Test
When running Prime95 to stress the CPU, clock rates and board power draw would spike to 3.1 GHz and 64 W, respectively, lasting for only a few seconds due to the 100 C core temperature. The CPU would then stabilize at 1.5 GHz and 23 W in order to maintain a more manageable core temperature of 90 C. Lenovo is definitely pushing the limits of the Core-P CPU given the limited cooling potential of the model. These very high core temperatures are warmer than on the Dragonfly G4 and comparable to the Latitude 9330 under similar conditions.
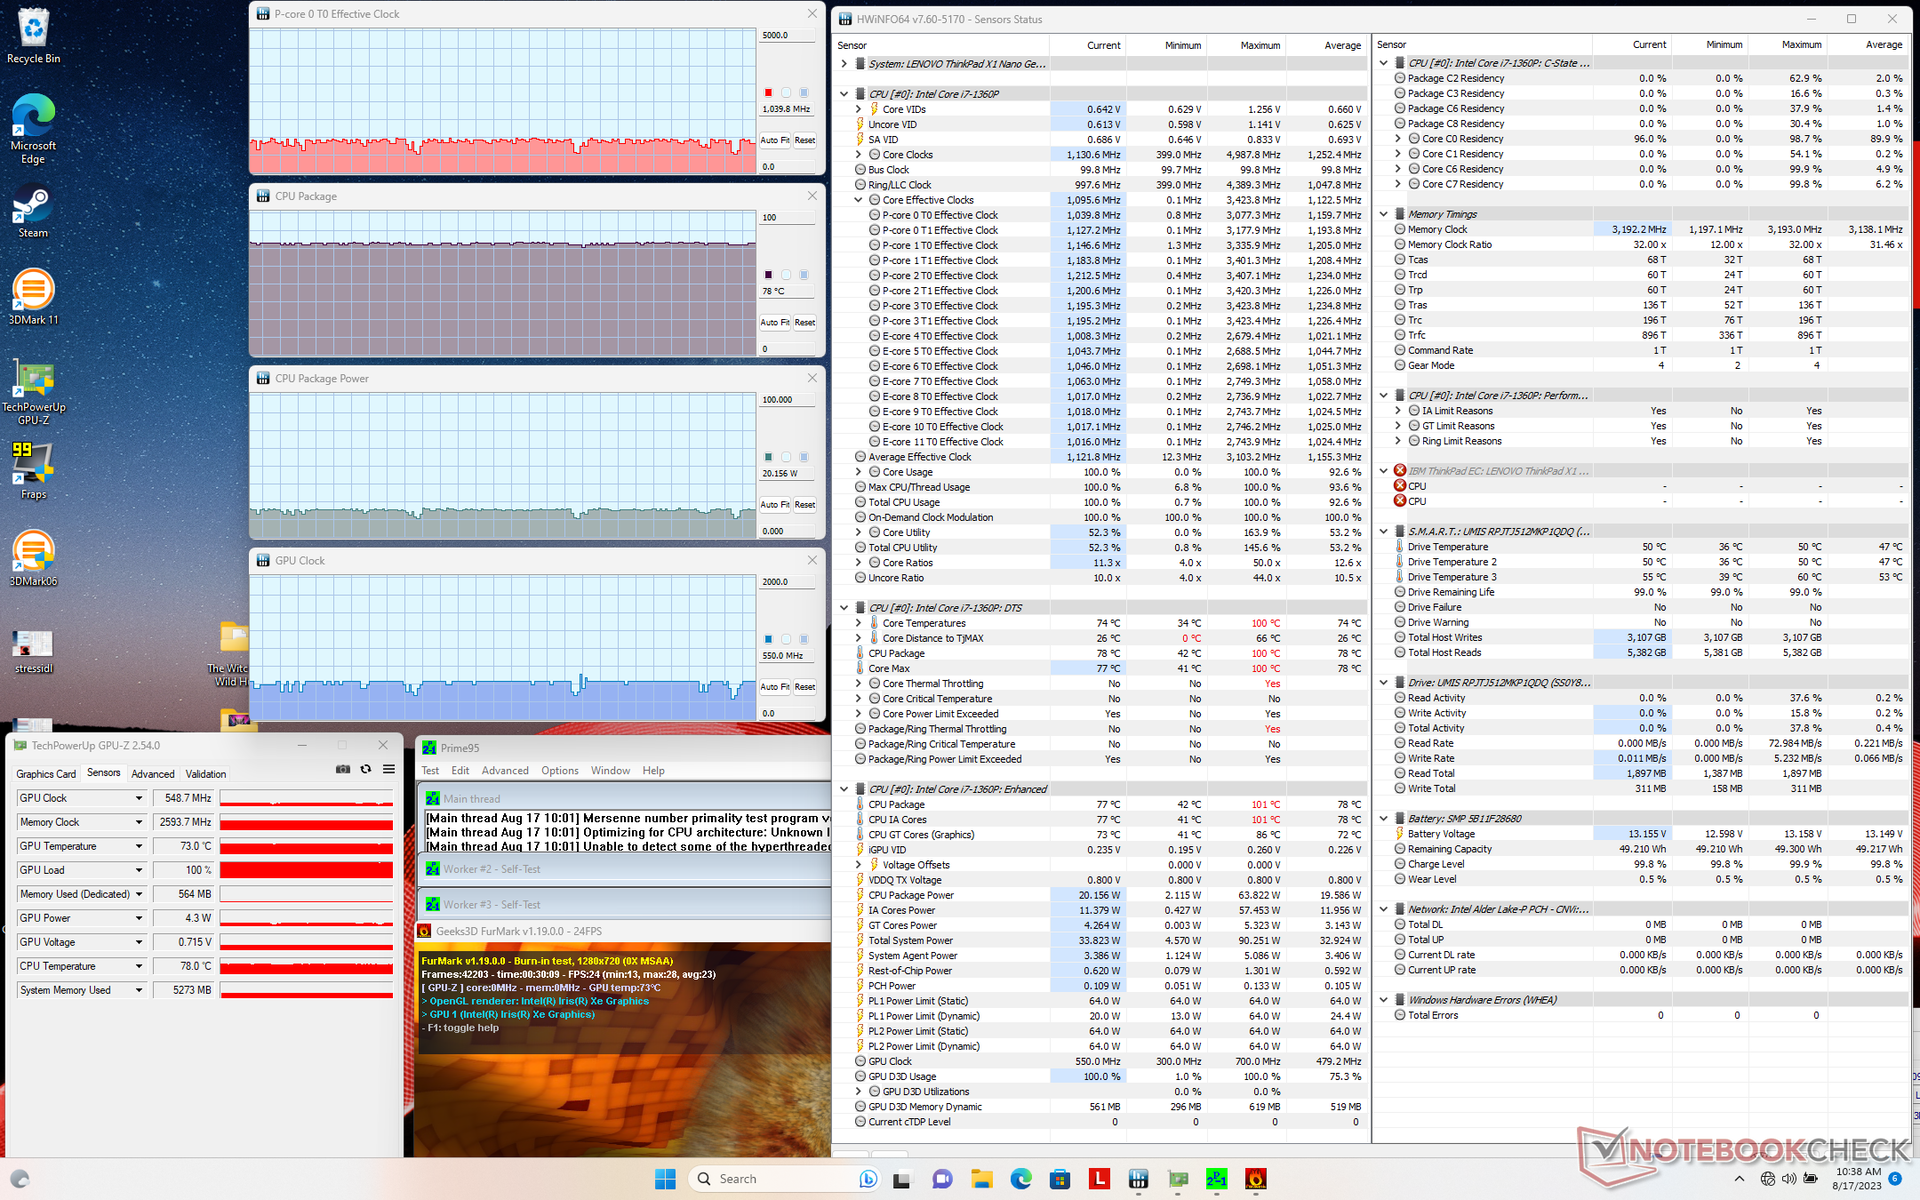
| CPU Clock (GHz) | GPU Clock (MHz) | Average CPU Temperature (°C) | |
| System Idle | -- | -- | 50 |
| Prime95 Stress | 1.7 | -- | 81 |
| Prime95 + FurMark Stress | ~1.0 | 549 | 78 |
| Witcher 3 Stress | ~1.0 | 850 - 1150 | 70 - 78 |
Speakers
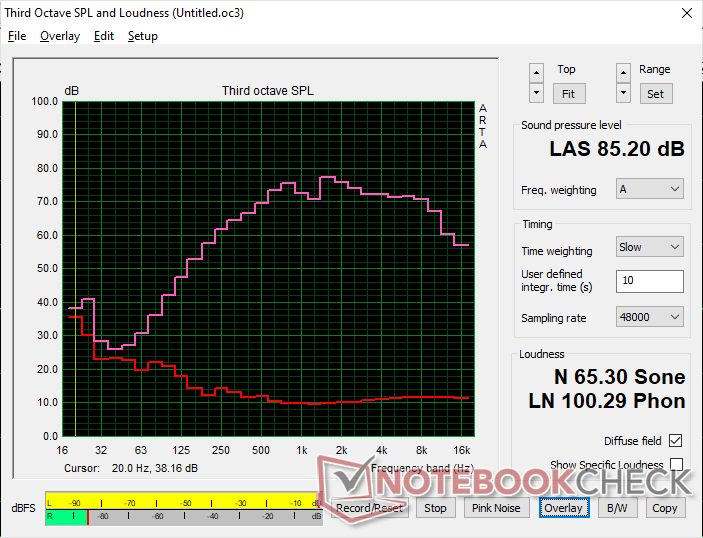
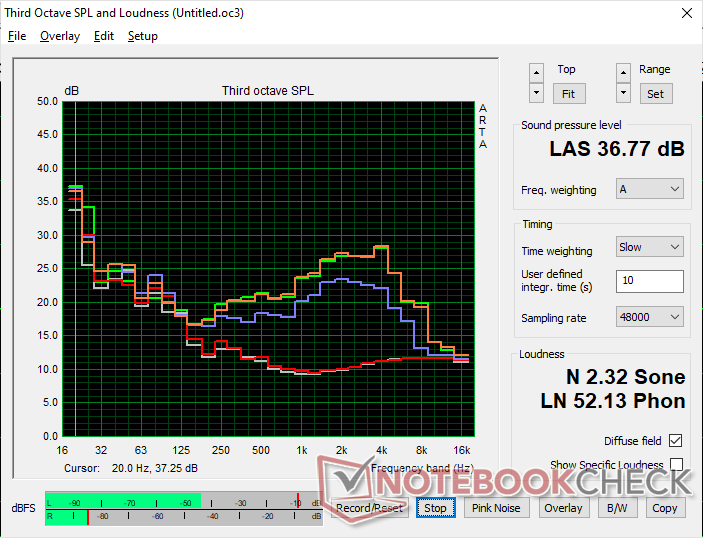
Lenovo ThinkPad X1 Nano Gen 3 audio analysis
(+) | speakers can play relatively loud (85.2 dB)
Bass 100 - 315 Hz
(-) | nearly no bass - on average 16.3% lower than median
(±) | linearity of bass is average (7.9% delta to prev. frequency)
Mids 400 - 2000 Hz
(+) | balanced mids - only 3.4% away from median
(+) | mids are linear (5.1% delta to prev. frequency)
Highs 2 - 16 kHz
(+) | balanced highs - only 1.6% away from median
(+) | highs are linear (2.3% delta to prev. frequency)
Overall 100 - 16.000 Hz
(+) | overall sound is linear (12.2% difference to median)
Compared to same class
» 11% of all tested devices in this class were better, 4% similar, 86% worse
» The best had a delta of 5%, average was 19%, worst was 53%
Compared to all devices tested
» 7% of all tested devices were better, 2% similar, 91% worse
» The best had a delta of 4%, average was 26%, worst was 134%
Apple MacBook Pro 16 2021 M1 Pro audio analysis
(+) | speakers can play relatively loud (84.7 dB)
Bass 100 - 315 Hz
(+) | good bass - only 3.8% away from median
(+) | bass is linear (5.2% delta to prev. frequency)
Mids 400 - 2000 Hz
(+) | balanced mids - only 1.3% away from median
(+) | mids are linear (2.1% delta to prev. frequency)
Highs 2 - 16 kHz
(+) | balanced highs - only 1.9% away from median
(+) | highs are linear (2.7% delta to prev. frequency)
Overall 100 - 16.000 Hz
(+) | overall sound is linear (4.6% difference to median)
Compared to same class
» 0% of all tested devices in this class were better, 0% similar, 100% worse
» The best had a delta of 5%, average was 18%, worst was 45%
Compared to all devices tested
» 0% of all tested devices were better, 0% similar, 100% worse
» The best had a delta of 4%, average was 26%, worst was 134%
Energy Management — High Power Efficiency Makes Up For The Small Battery Size
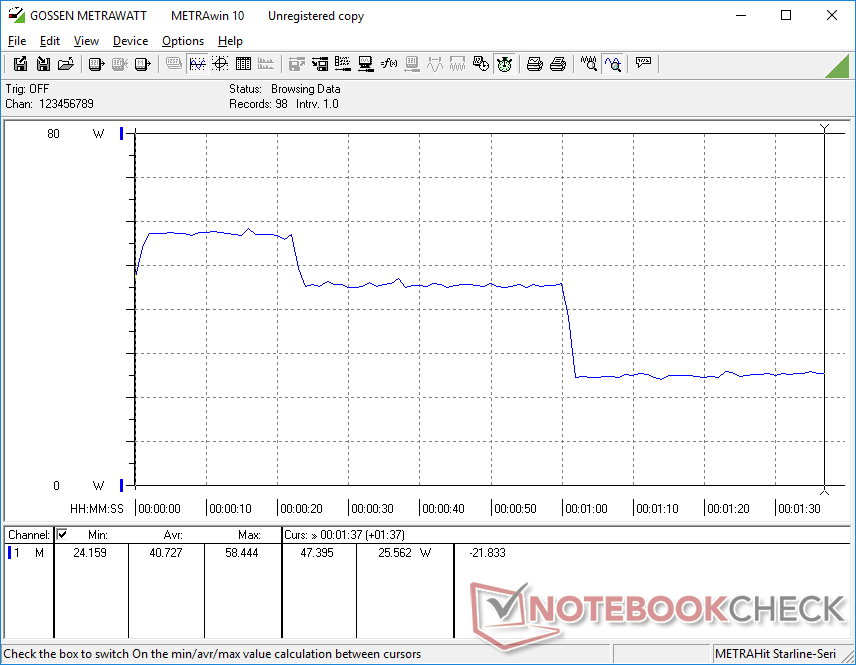
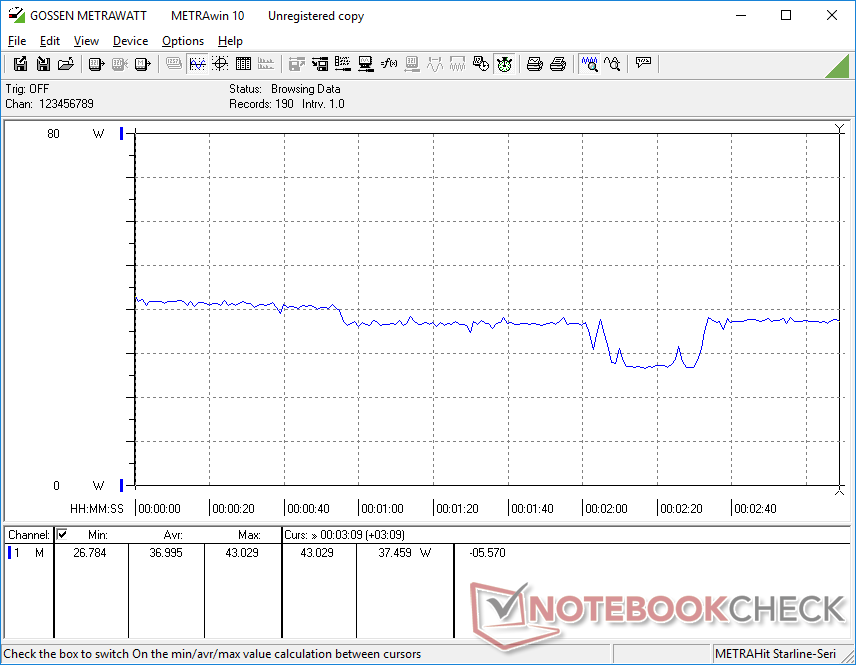
Power Consumption
Our Gen 3 model is noticeably more power efficient than the older Gen 2 model as shown by the table below. These savings are likely responsible for the overall longer battery life.
The power savings extend into higher loads like games where our unit would demand 25 percent less energy than the year before. These results align with the aforementioned 25 percent slower graphics performance and throttling behavior of our system.
| Off / Standby | |
| Idle | |
| Load |
|
| Lenovo ThinkPad X1 Nano Gen 3 i7-1360P, Iris Xe G7 96EUs, Lenovo UMIS AM6A0 RPJTJ512MKP1QDQ, IPS, 2160x1350, 13.00 | Lenovo ThinkPad X1 Nano Gen 2 Core i7-1280P i7-1280P, Iris Xe G7 96EUs, Kioxia BG5 KBG5AZNT1T02, IPS, 2160x1350, 13.00 | HP Dragonfly G4 i7-1365U, Iris Xe G7 96EUs, Micron 3400 MTFDKBA512TFH 512GB, IPS, 1920x1280, 13.50 | Framework Laptop 13.5 13th Gen Intel i7-1370P, Iris Xe G7 96EUs, WD PC SN740 SDDPNQD-1T00, IPS, 2256x1504, 13.50 | Dell Latitude 9330 i7-1260U, Iris Xe G7 96EUs, , IPS, 2560x1600, 13.30 | Apple MacBook Air M2 10C GPU M2, M2 10-Core GPU, Apple SSD AP1024Z, IPS, 2560x1664, 13.60 | LG Gram 14Z90Q i5-1240P, Iris Xe G7 80EUs, Samsung PM9A1 MZVL2512HCJQ, IPS, 1920x1200, 14.00 | |
|---|---|---|---|---|---|---|---|
| Power Consumption | -29% | -9% | -20% | -7% | 6% | -10% | |
| Idle Minimum * | 3.3 | 3.4 -3% | 4.1 -24% | 2.9 12% | 4.7 -42% | 1.9 42% | 3 9% |
| Idle Average * | 6.5 | 6.5 -0% | 7.5 -15% | 6.3 3% | 8.2 -26% | 9.6 -48% | 6 8% |
| Idle Maximum * | 7.1 | 14.4 -103% | 8.2 -15% | 9.9 -39% | 8.4 -18% | 9.7 -37% | 12 -69% |
| Load Average * | 40.7 | 54.5 -34% | 35.5 13% | 56.2 -38% | 36.8 10% | 32.4 20% | 40 2% |
| Witcher 3 ultra * | 37 | 44 -19% | 37.5 -1% | 56.6 -53% | 30.4 18% | 30.8 17% | 36.5 1% |
| Load Maximum * | 58.6 | 65.4 -12% | 66.5 -13% | 60.8 -4% | 49.9 15% | 35.7 39% | 63 -8% |
* ... smaller is better
Power Consumption Witcher 3 / Stresstest
Power Consumption external Monitor
Battery Life
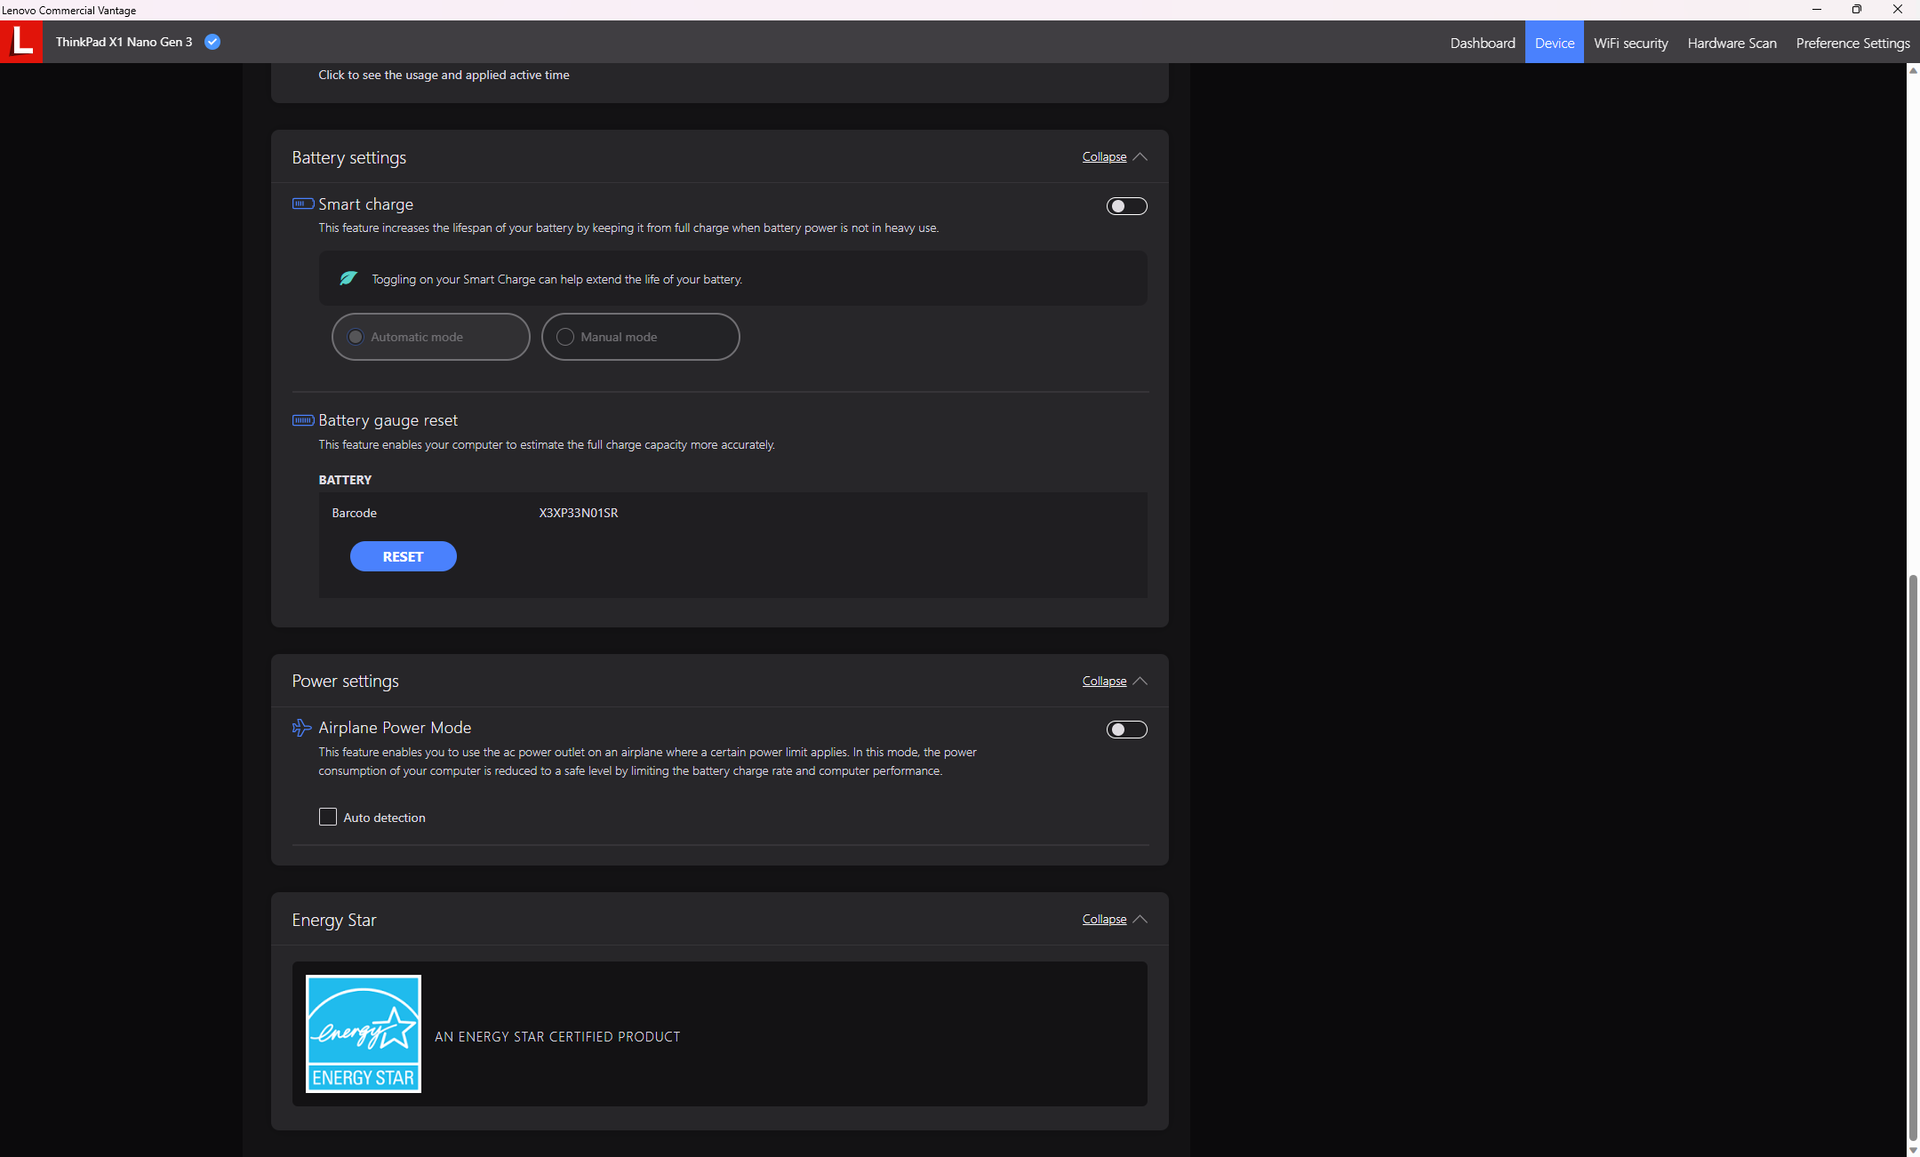
Battery capacity is small at under 50 Wh in order to maintain the very low weight. Nonetheless, battery life is still very good at almost 8 hours of real-world WLAN browsing which is an improvement over last year's model by a couple of hours.
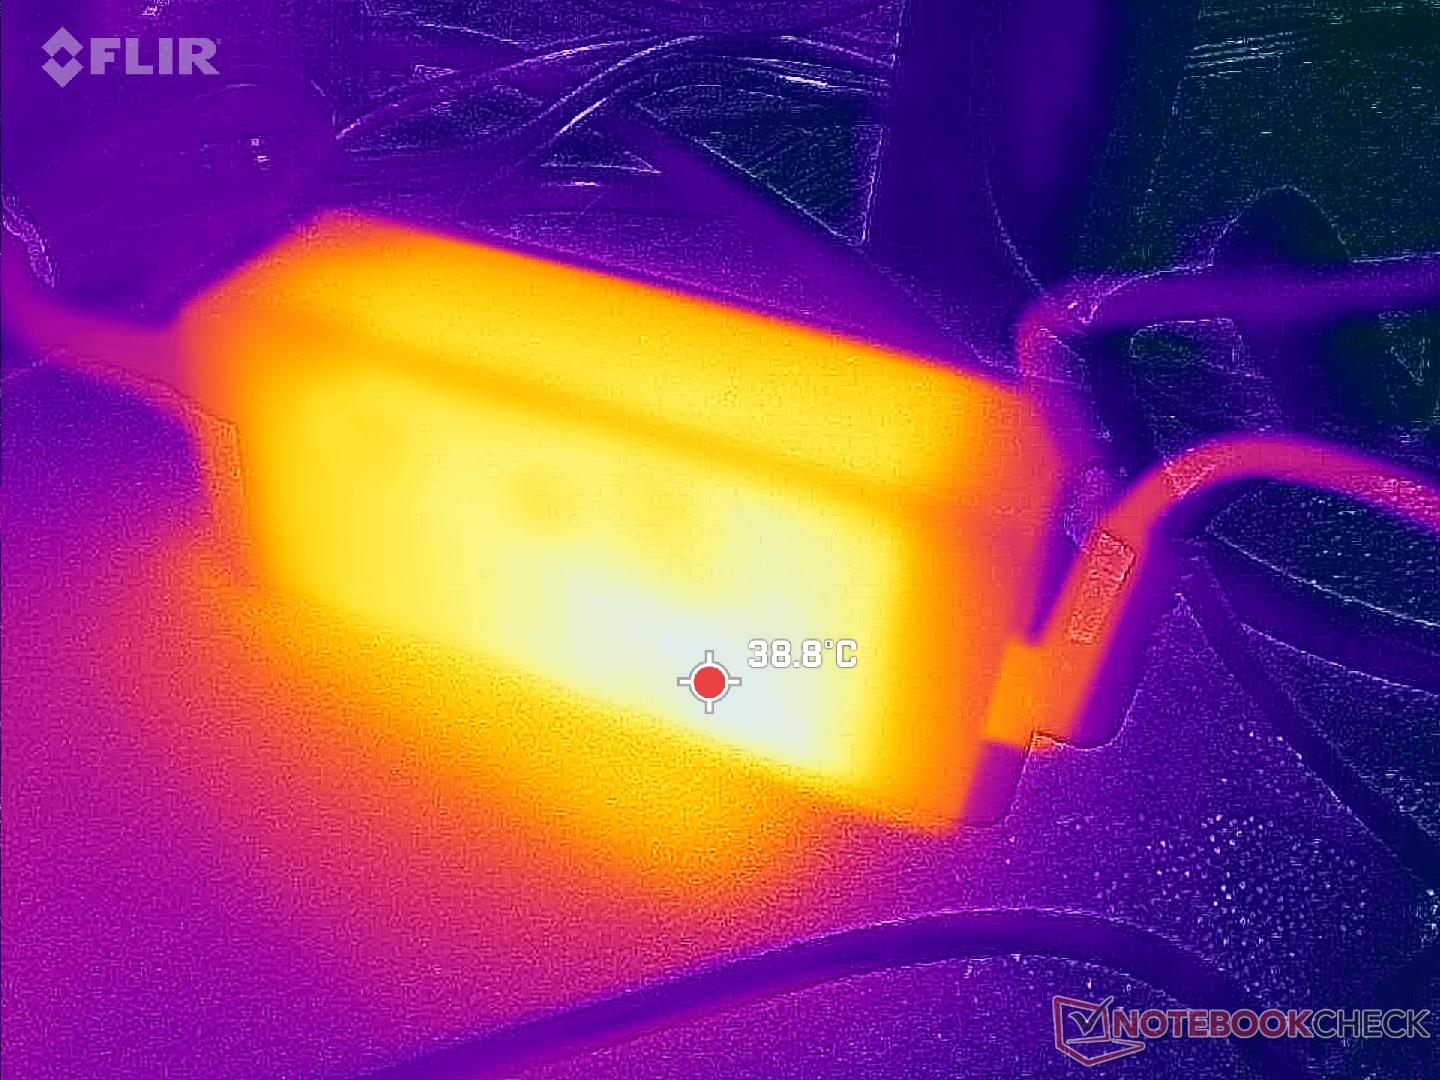
Charging from empty to full capacity takes about 90 minutes with the included AC adapter.
| Lenovo ThinkPad X1 Nano Gen 3 i7-1360P, Iris Xe G7 96EUs, 49.5 Wh | Lenovo ThinkPad X1 Nano Gen 2 Core i7-1280P i7-1280P, Iris Xe G7 96EUs, 49.5 Wh | HP Dragonfly G4 i7-1365U, Iris Xe G7 96EUs, 68 Wh | Framework Laptop 13.5 13th Gen Intel i7-1370P, Iris Xe G7 96EUs, 61 Wh | Dell Latitude 9330 i7-1260U, Iris Xe G7 96EUs, 50 Wh | Apple MacBook Air M2 10C GPU M2, M2 10-Core GPU, 52.6 Wh | LG Gram 14Z90Q i5-1240P, Iris Xe G7 80EUs, 72 Wh | |
|---|---|---|---|---|---|---|---|
| Battery Runtime | -35% | 105% | 13% | 21% | 90% | 53% | |
| WiFi v1.3 | 465 | 303 -35% | 954 105% | 527 13% | 564 21% | 884 90% | 712 53% |
| Reader / Idle | 2550 | 923 | 1736 | ||||
| Load | 192 | 140 | 169 | ||||
| H.264 | 946 |
Pros
Cons
Verdict — Performance Trade-Offs For A <1 kg Weight
The 2023 ThinkPad X1 Nano carries a few improvements over the 2022 version. Fan noise, battery life, and SSD performance have all been improved which should benefit users who are constantly on the move and away from a power source.
Keep in mind that any year-over-year performance improvements are marginal at best despite the update to the newer 13th gen Intel platform. This isn't to say that the Lenovo is slow as its Core P-series CPU is ahead of the more common Core U-series as found on most other subnotebooks, but the delta isn't as wide as one might expect due to the limited cooling capabilities of the ThinkPad X1 Nano design. After all, concessions are inevitable when aiming for a sub-kilogram final weight. The Core P CPU here is therefore at its best for short bursts of Turbo Boost performance such as when launching applications or editing photos.
The ThinkPad X1 Nano Gen 3 is one of the only 13-inch laptops under 1 kg to ship with Core P CPUs. Performance is excellent for short bursts before heat and throttling kick in.
If you're trying to save some dough, then you can get essentially the same user experience by opting for the older ThinkPad X1 Nano Gen 2 especially since Lenovo has made no changes to the display or other physical aspects of the model.
Price and Availability
Lenovo is now shipping its ThinkPad X1 Nano Gen 3 starting at $1270 USD for the base Core i5-1340P configuration up to $2000 for the highest-end Core i7-1370P configuration.
Lenovo ThinkPad X1 Nano Gen 3
-
08/25/2023 v7
Allen Ngo
More articles related to this device
Lenovo ThinkPad X1 Nano Gen 3 (ThinkPad X1 Nano Series)Related Articles


Transparency
The present review sample was made available to the author as a loan by the manufacturer or a shop for the purposes of review. The lender had no influence on this review, nor did the manufacturer receive a copy of this review before publication. There was no obligation to publish this review.
Pricecompare
