 Deutsch
 English
 Español
 Français
 Italiano
 Nederlands
 Polski
 Português
 Русский
 Türkçe
 Svenska
 Chinese
 Magyar
Lies of P tech review: Laptop and desktop benchmarks

Notebooks used in this review
Right now, our gaming benchmarks are performed using these laptops. Click on the images to visit the respective product page. All other test systems (tower PCs, mini-PCs, etc.) are listed at the end of this article.
Technical aspects
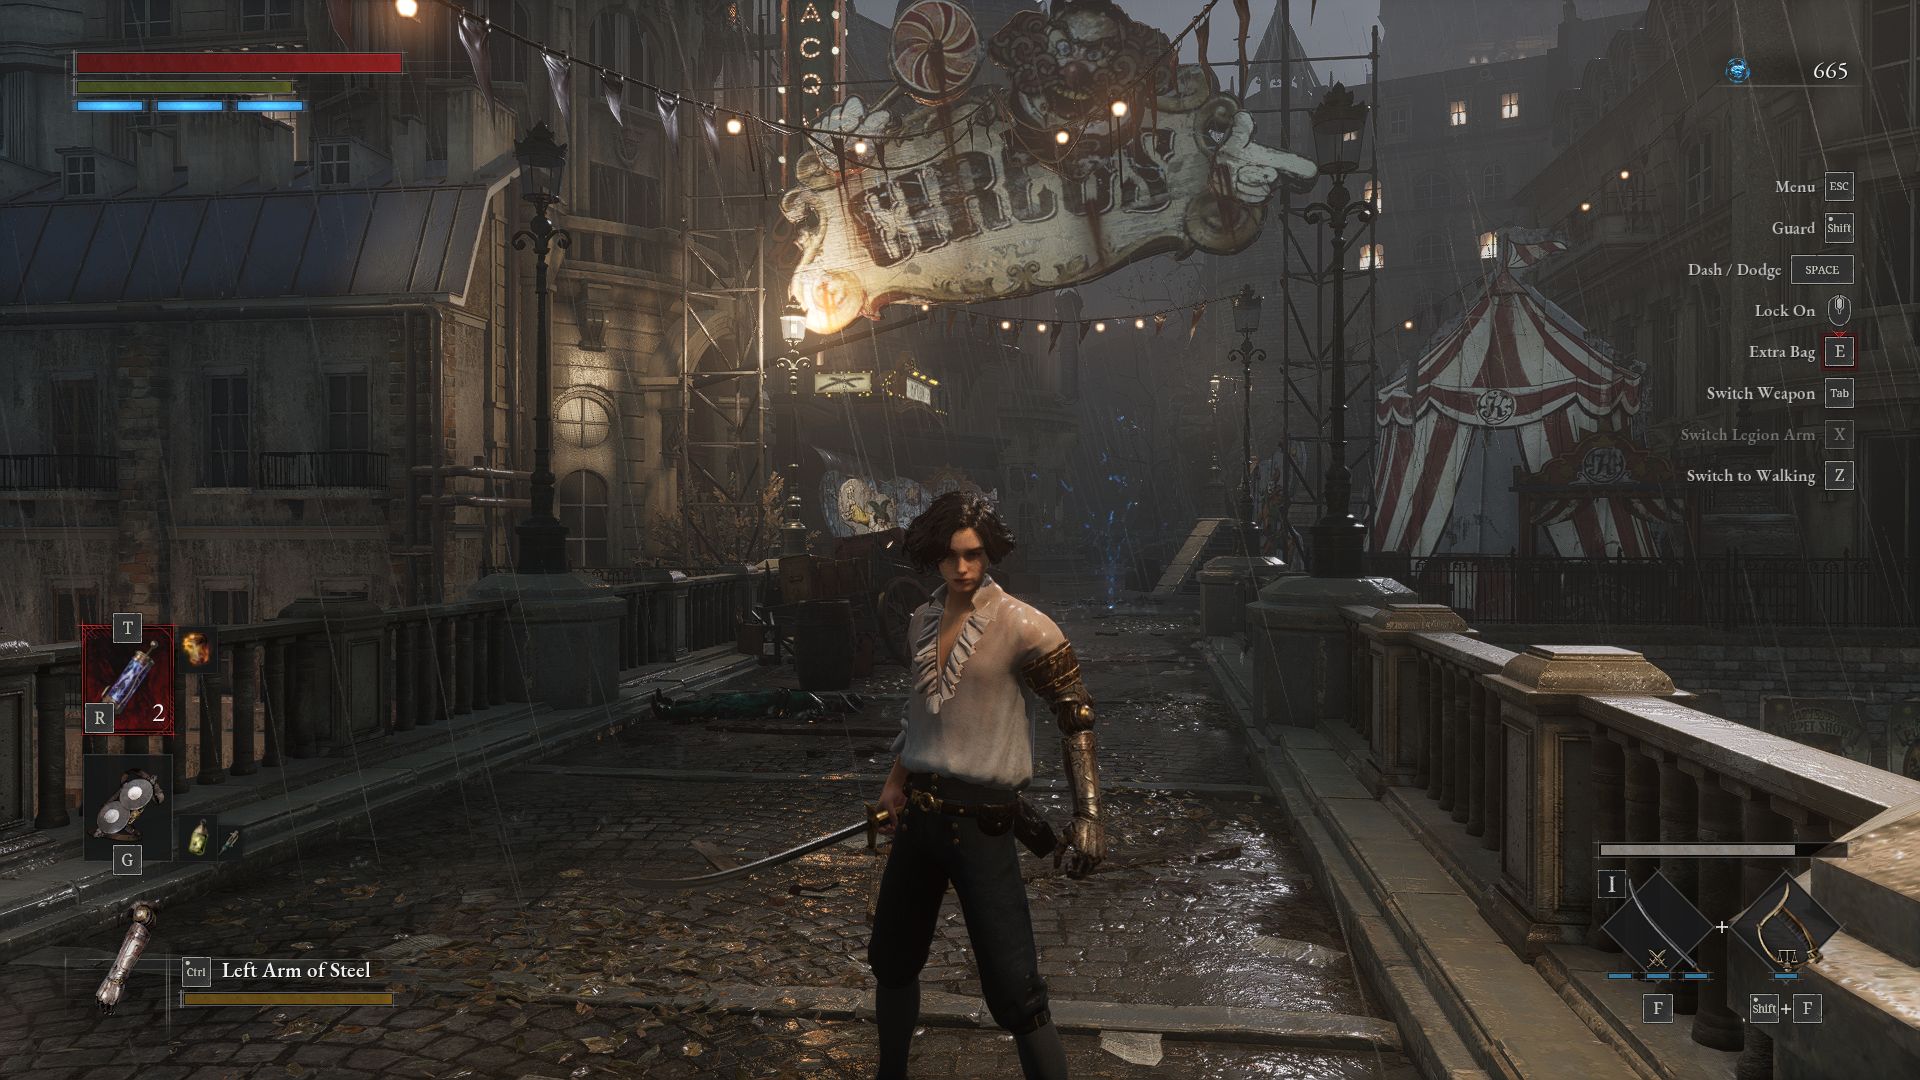
From the word go, Lies of P makes no secret of the games it uses as a template. As well as its controls, its gameplay and level design are astoundingly similar to Dark Souls and other Souls-likes. What's more, Lies of P managed to have better technical performance than its major inspirations.
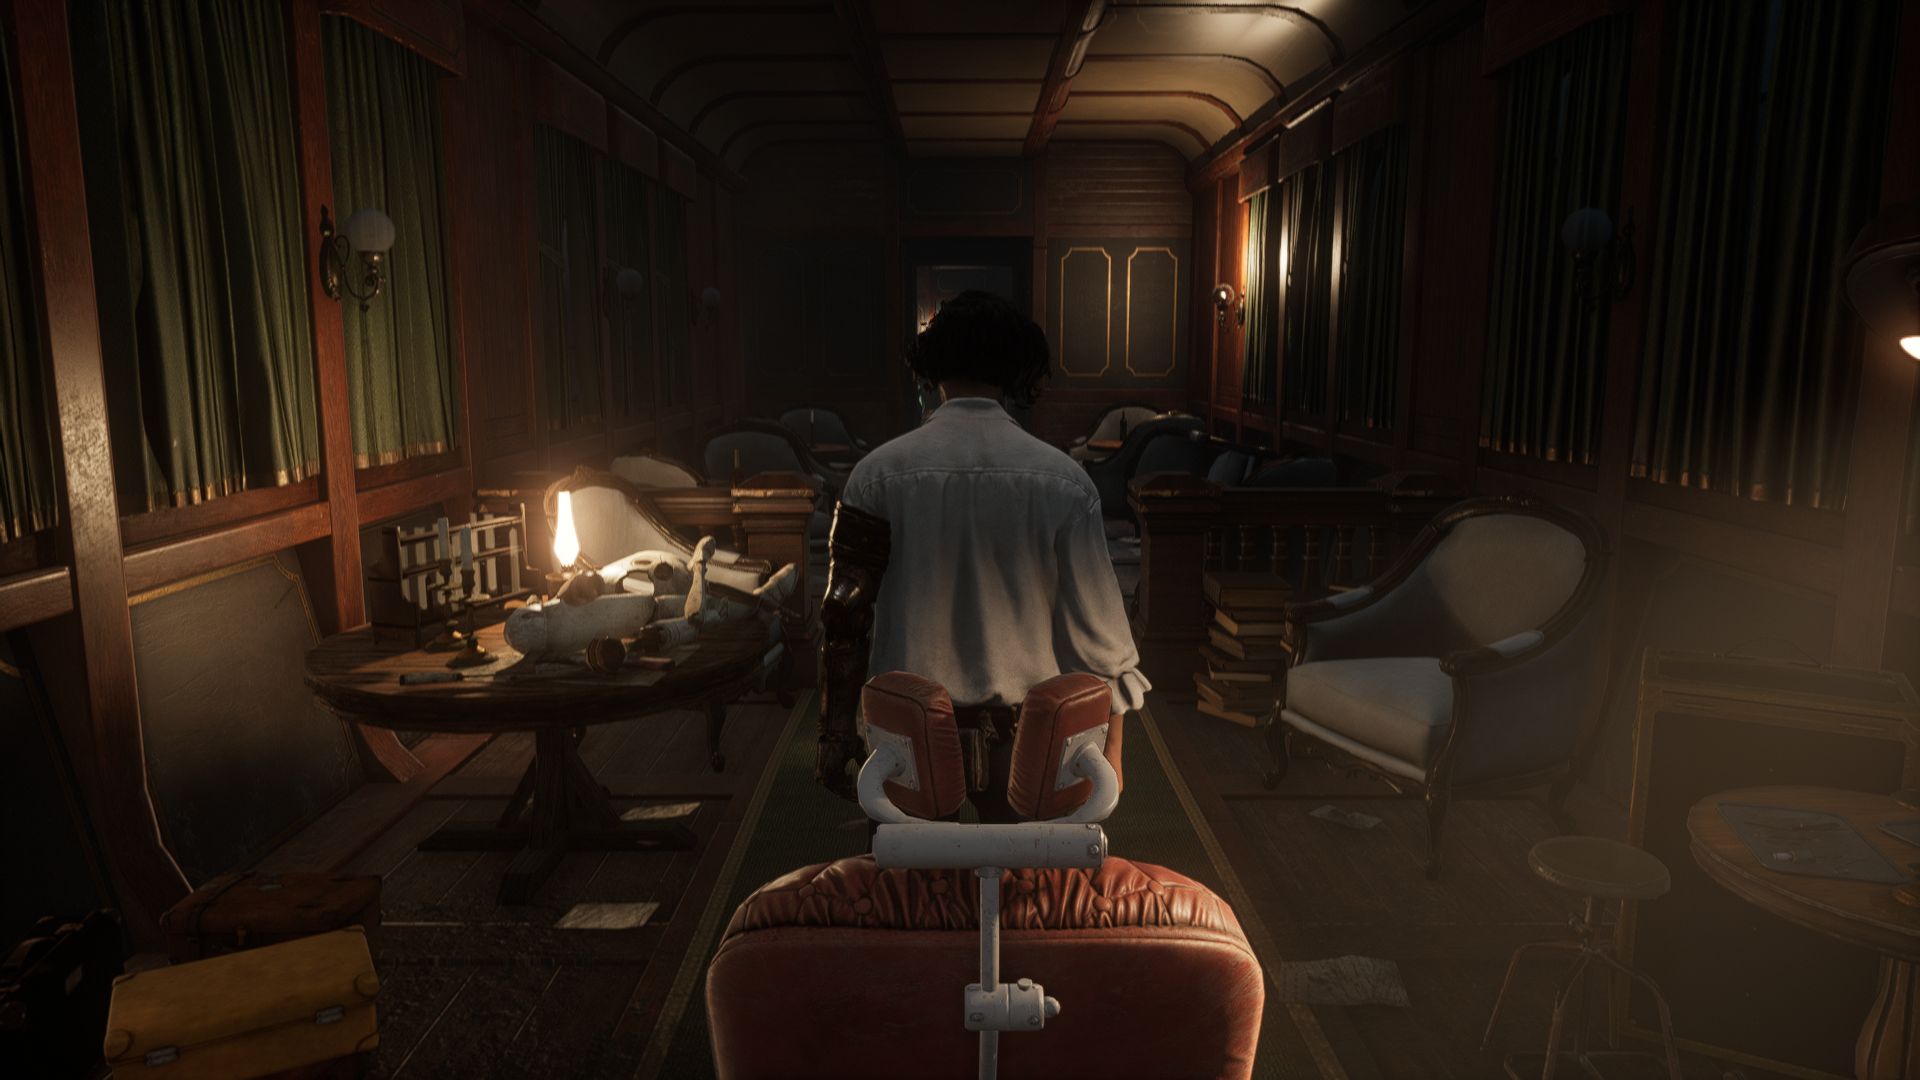

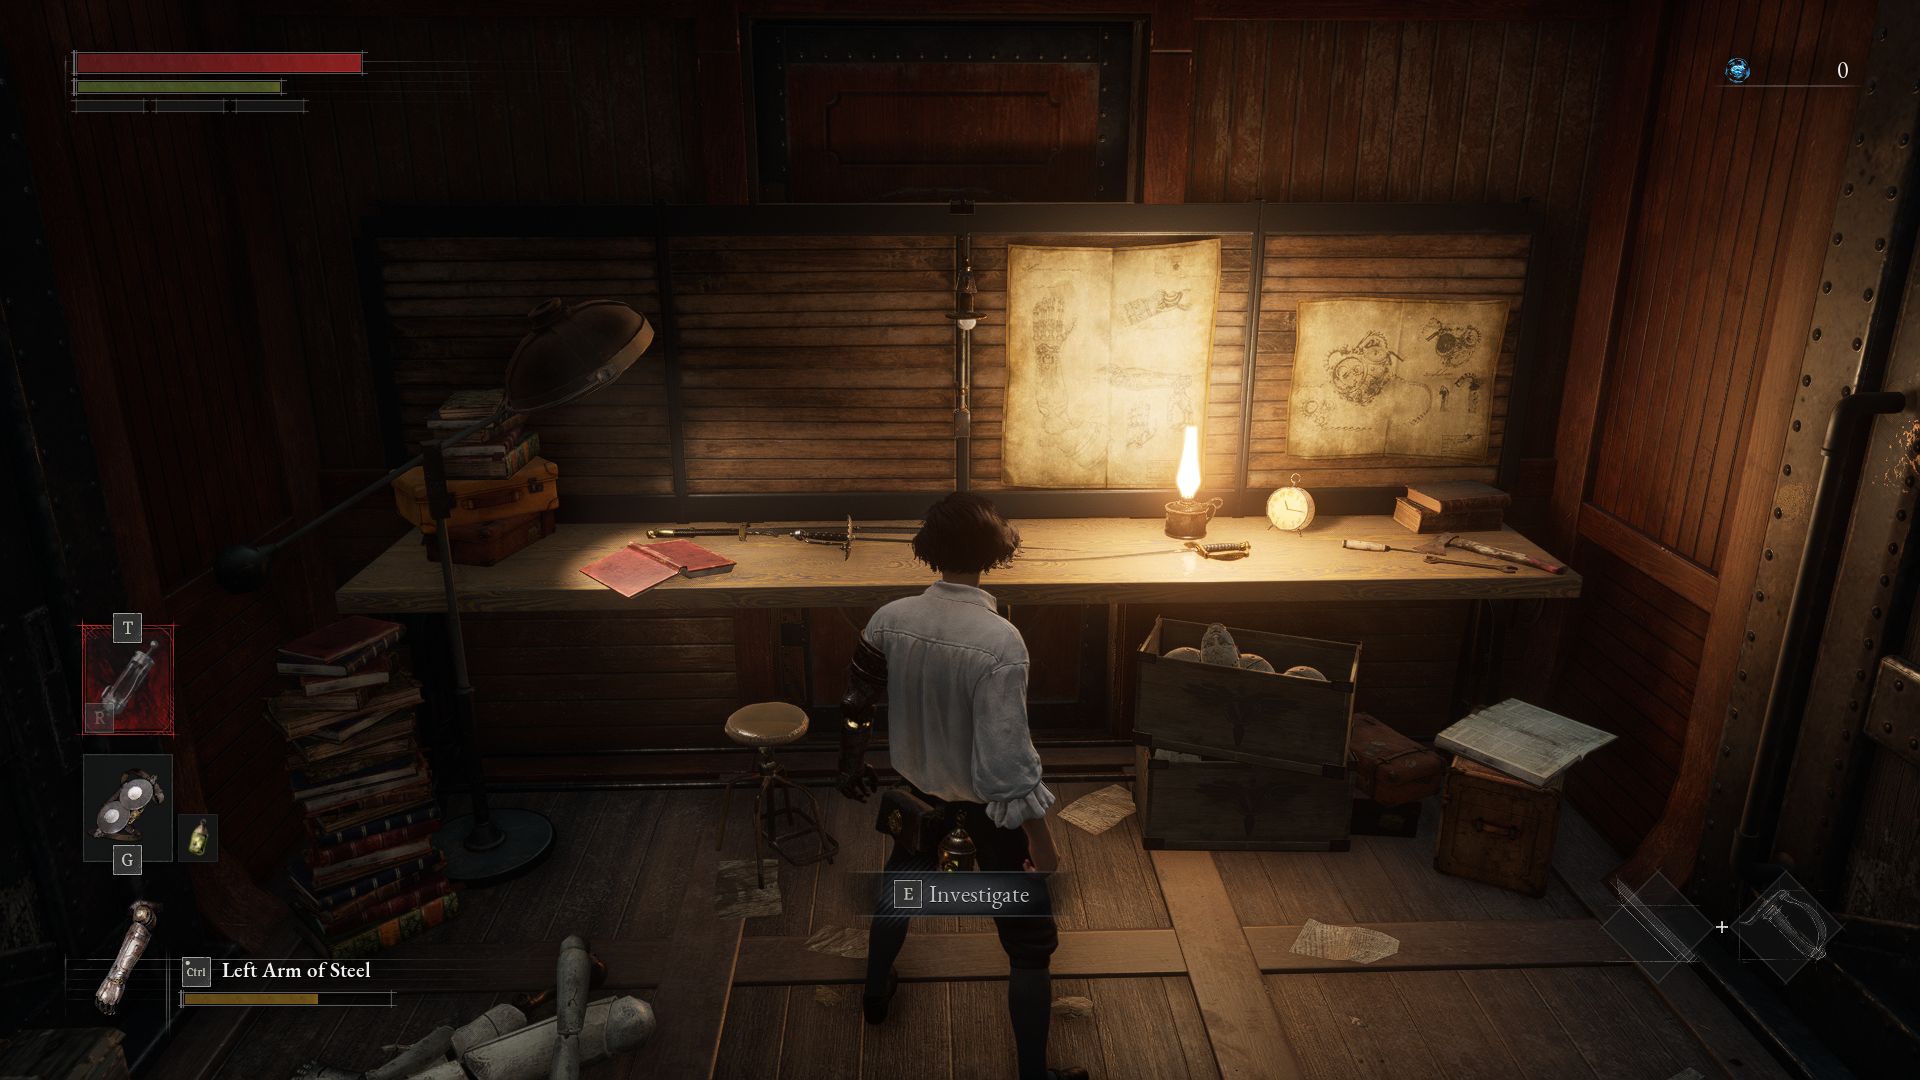
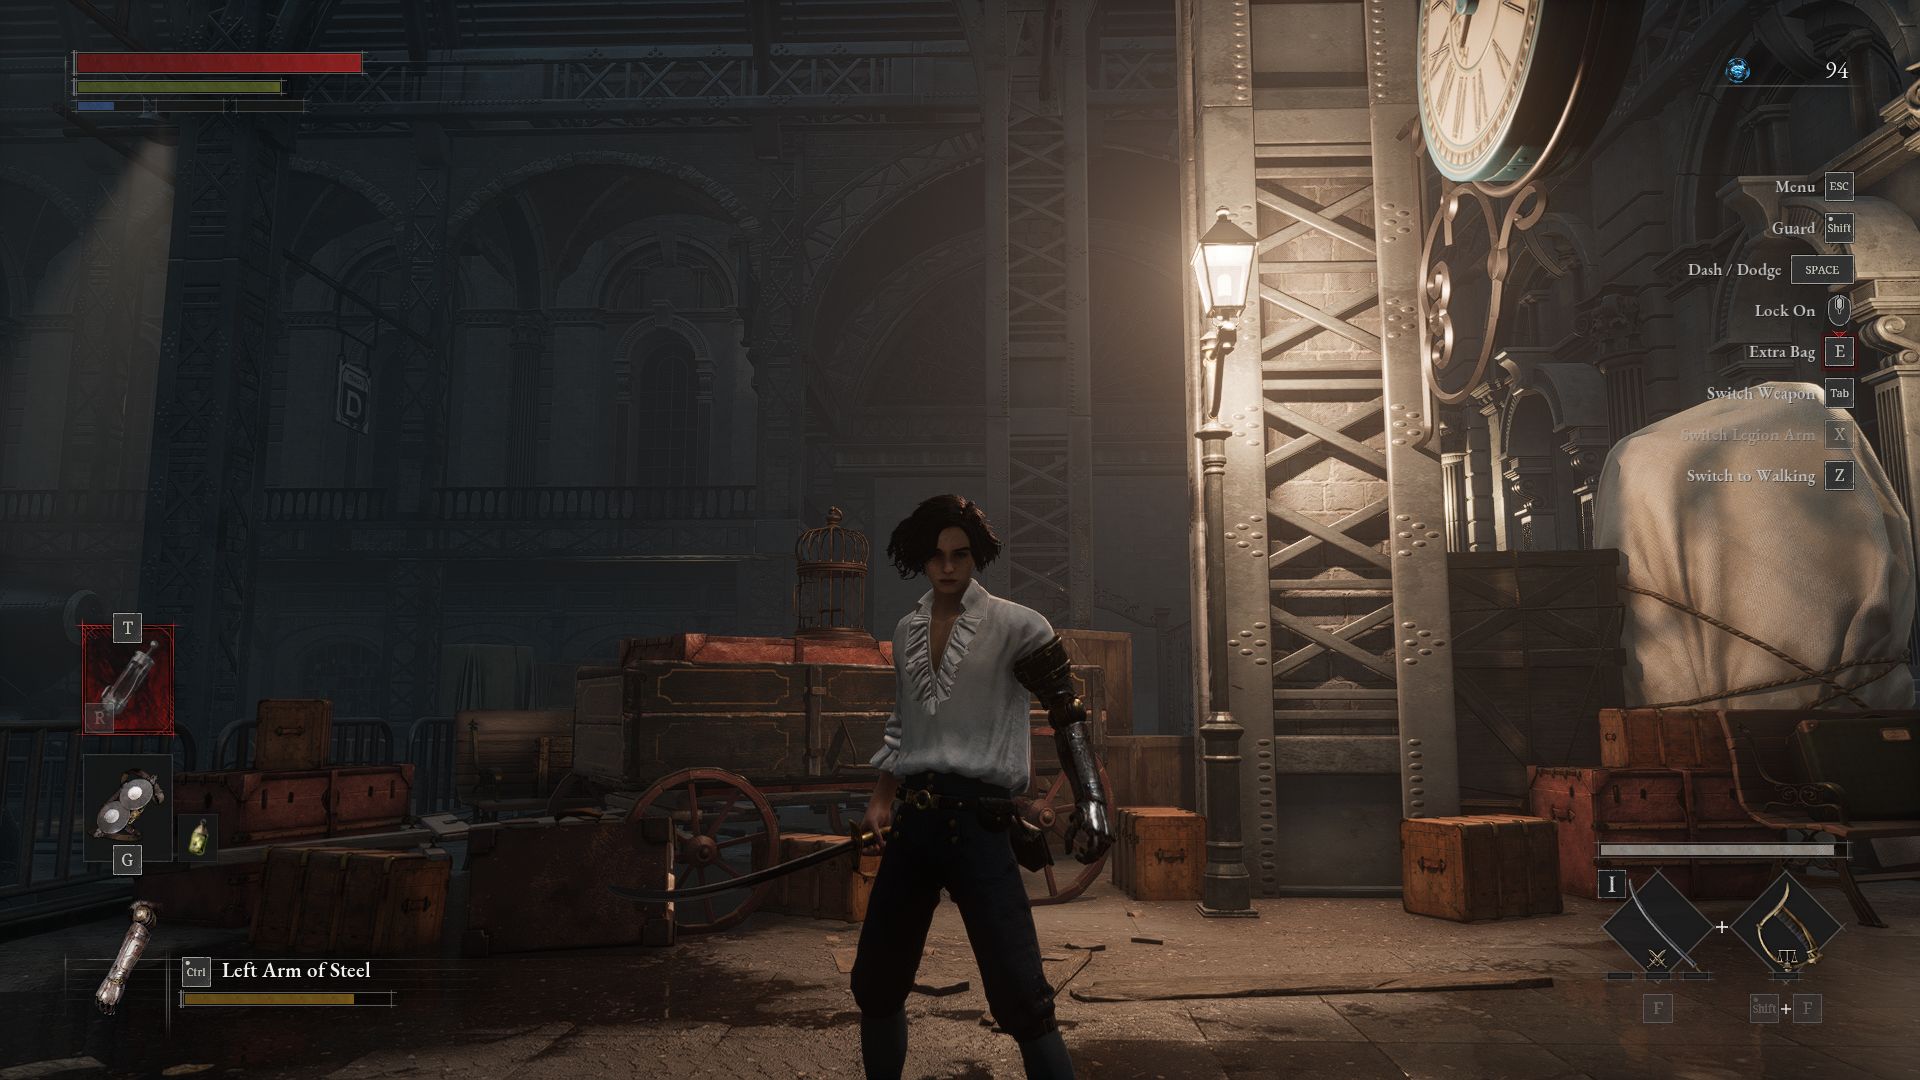
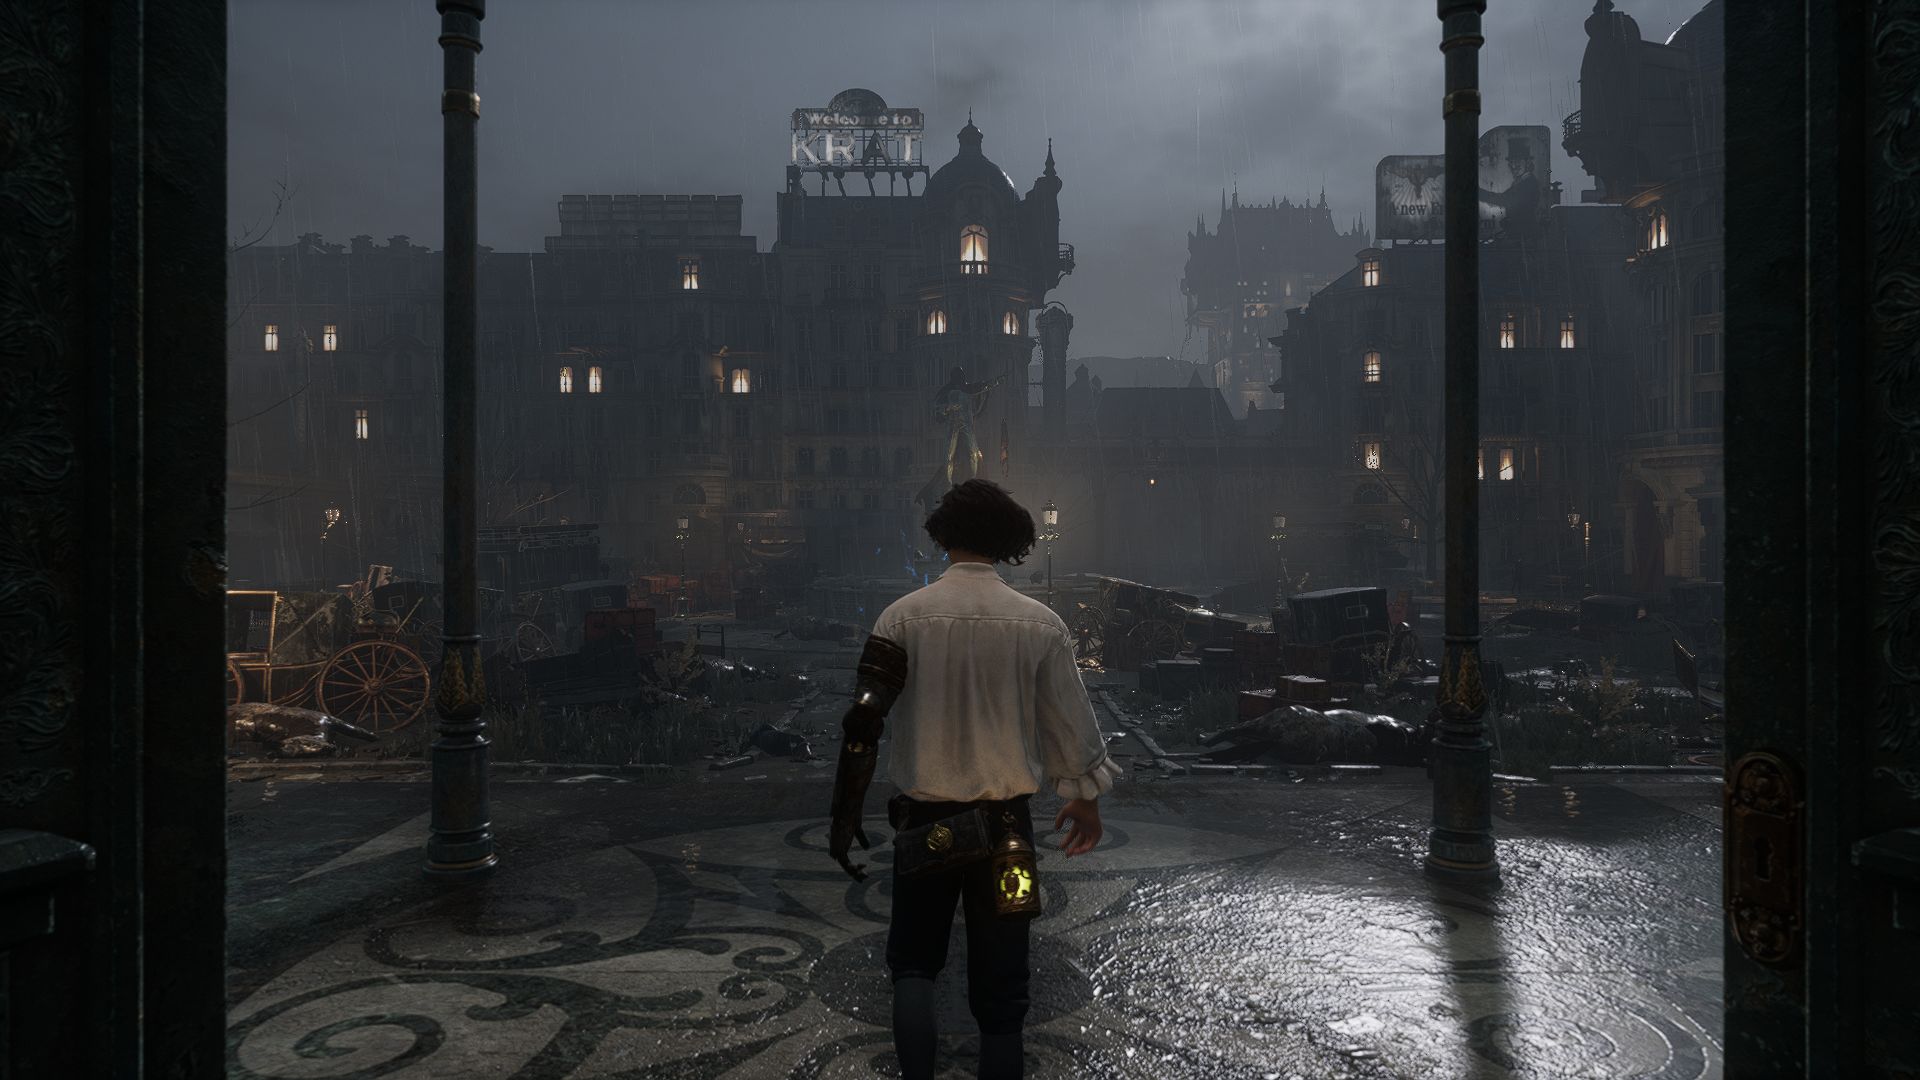
The PC version is impressive not least due to its very sharp textures, high level of detail and stylish effects. Regardless of whether it’s weather conditions, reflections or lighting, the developers have evidently put great effort into the game’s visual design. Together with top-notch art design, which took inspiration from Bloodborne amongst other things but adds its own spin, Lies of P presents a very dense and intentionally dark atmosphere on screen. Whilst often rather indirect, the storytelling doesn’t feel as minimalist as in Souls games, which some gamers are going to see as an advantage.
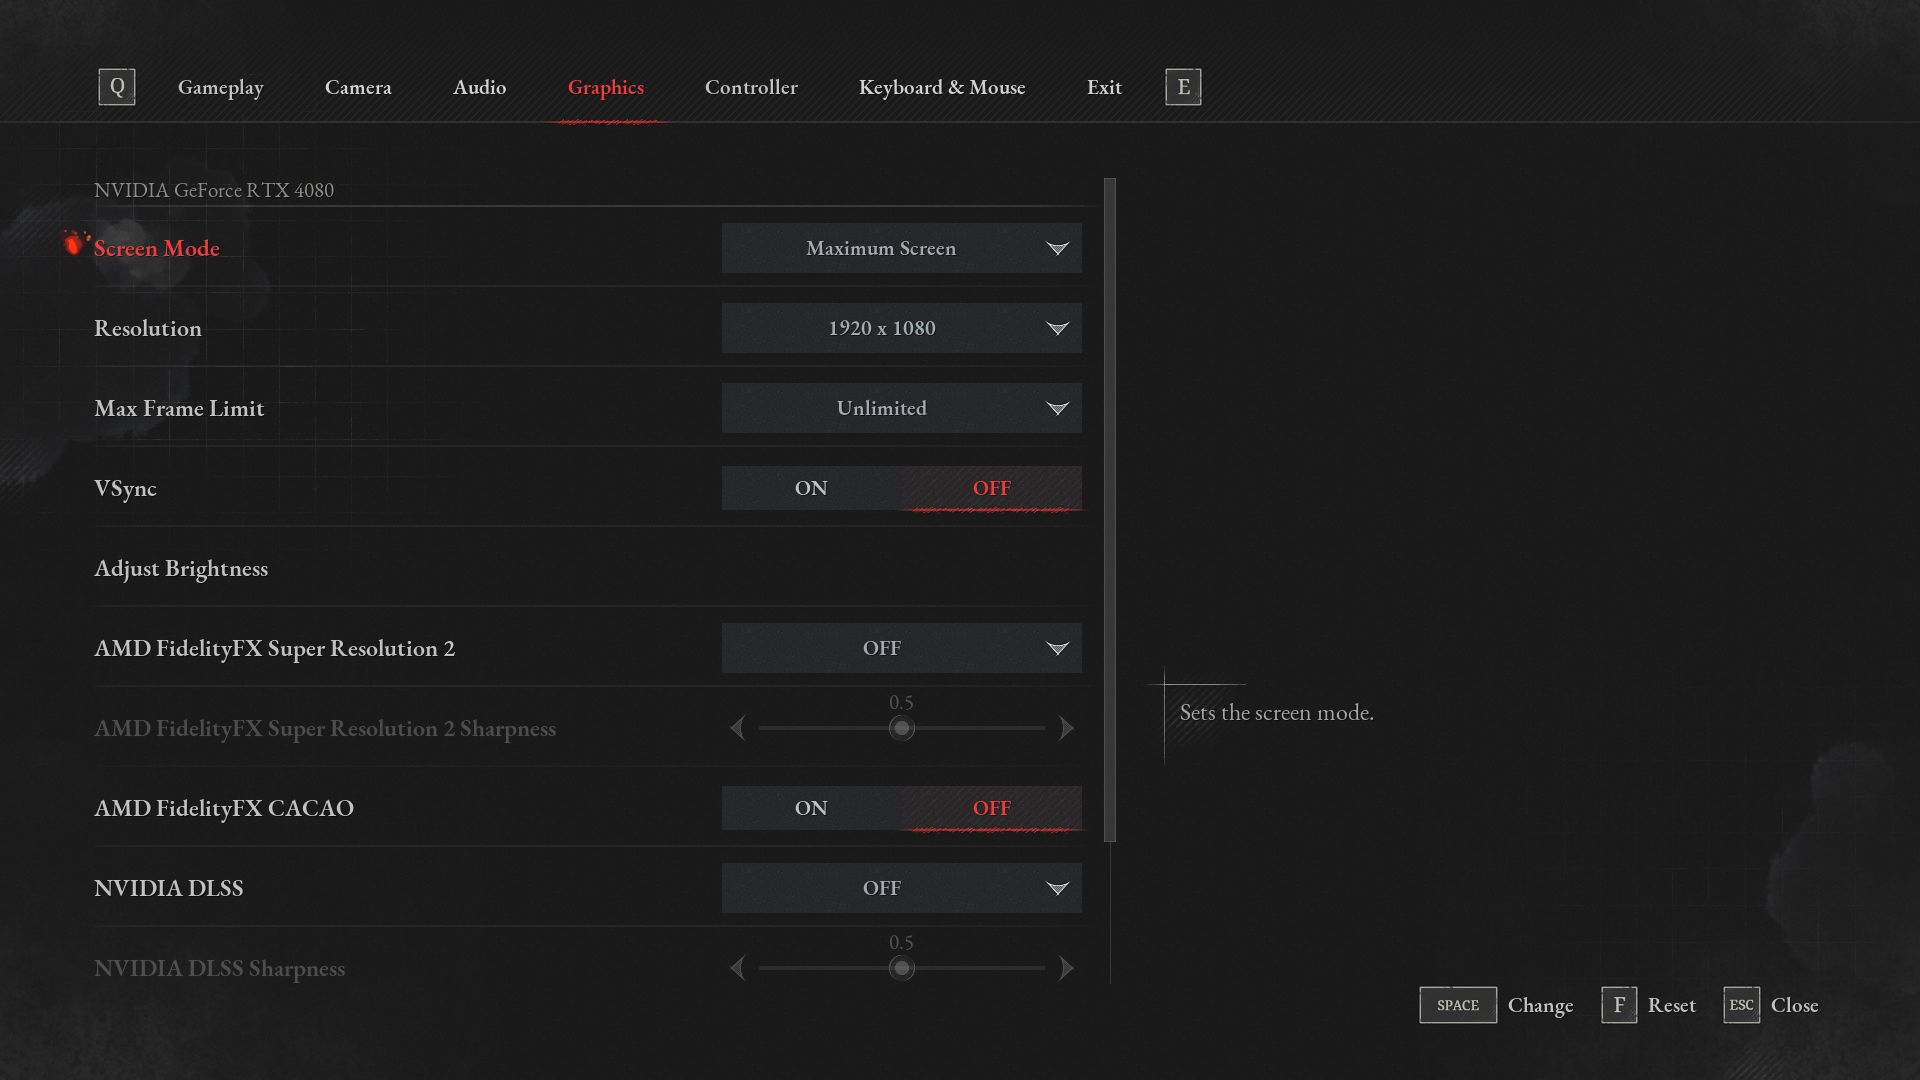
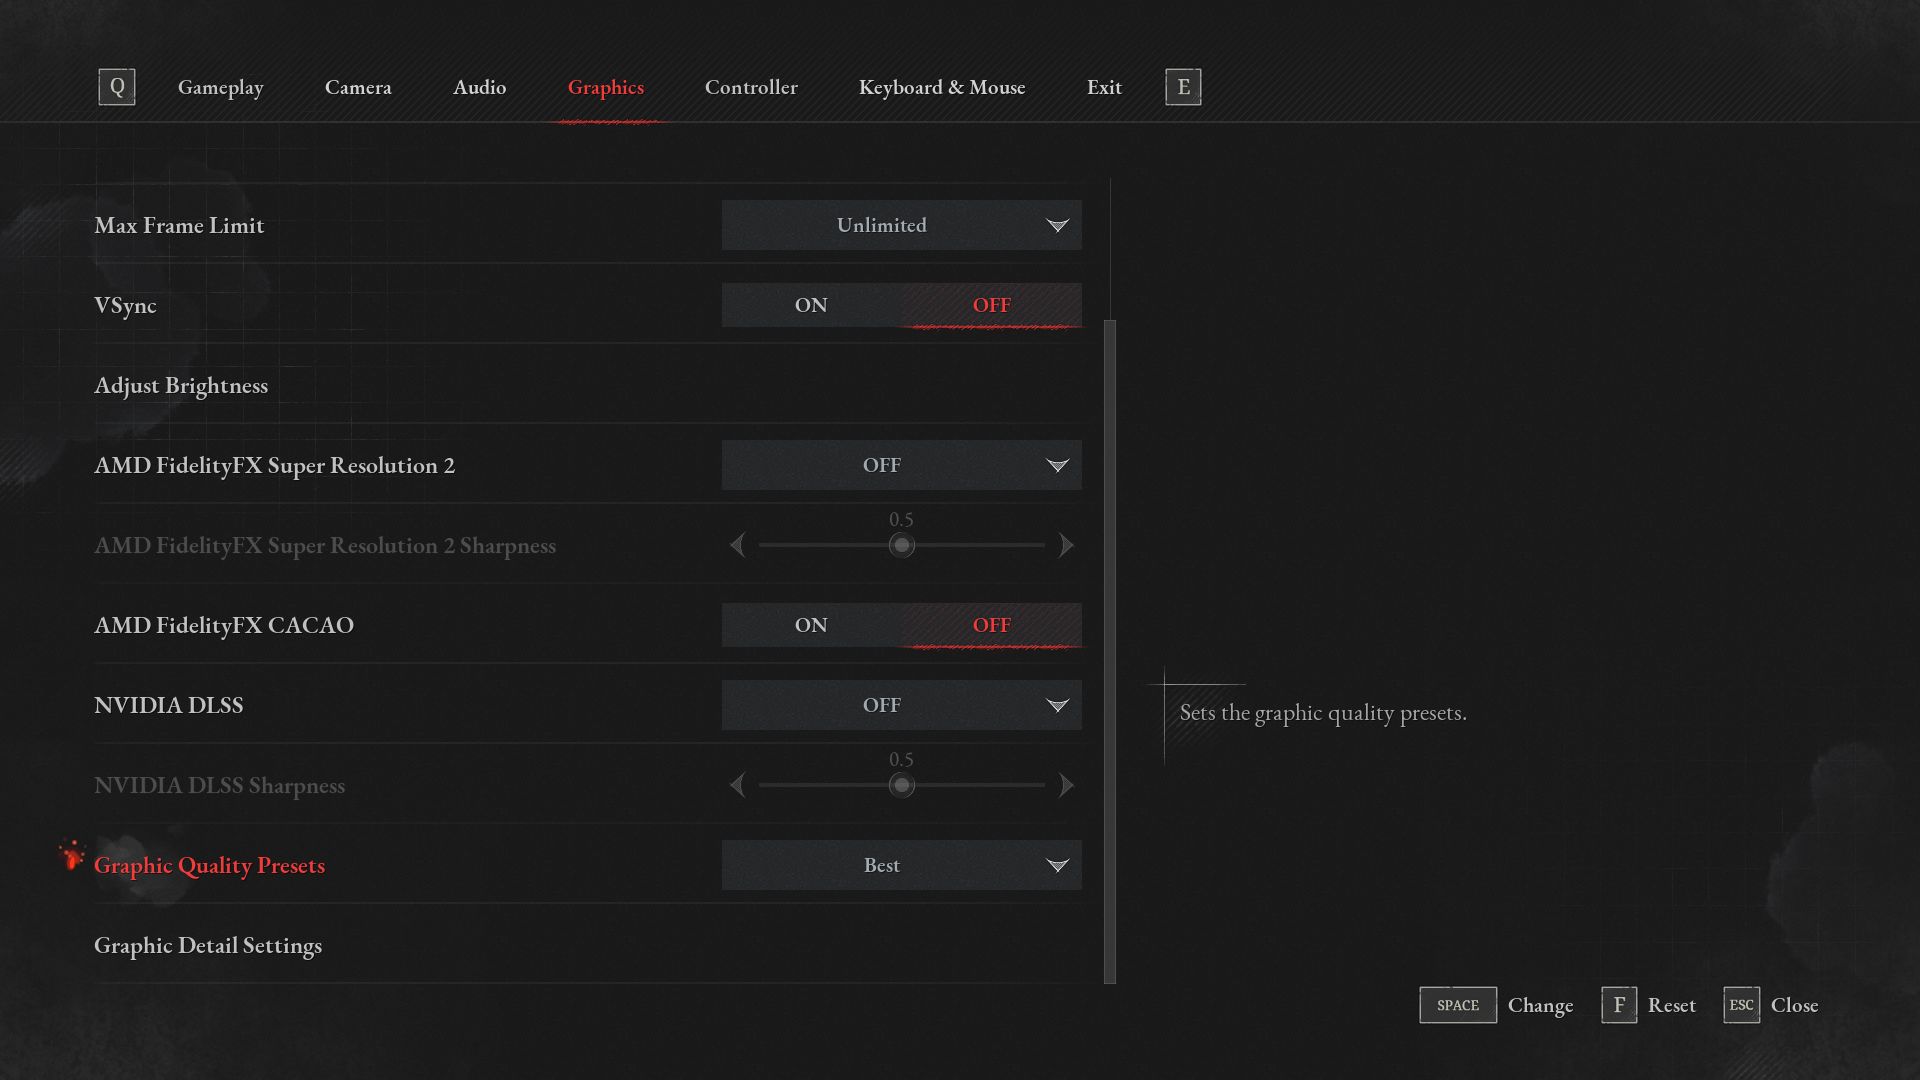
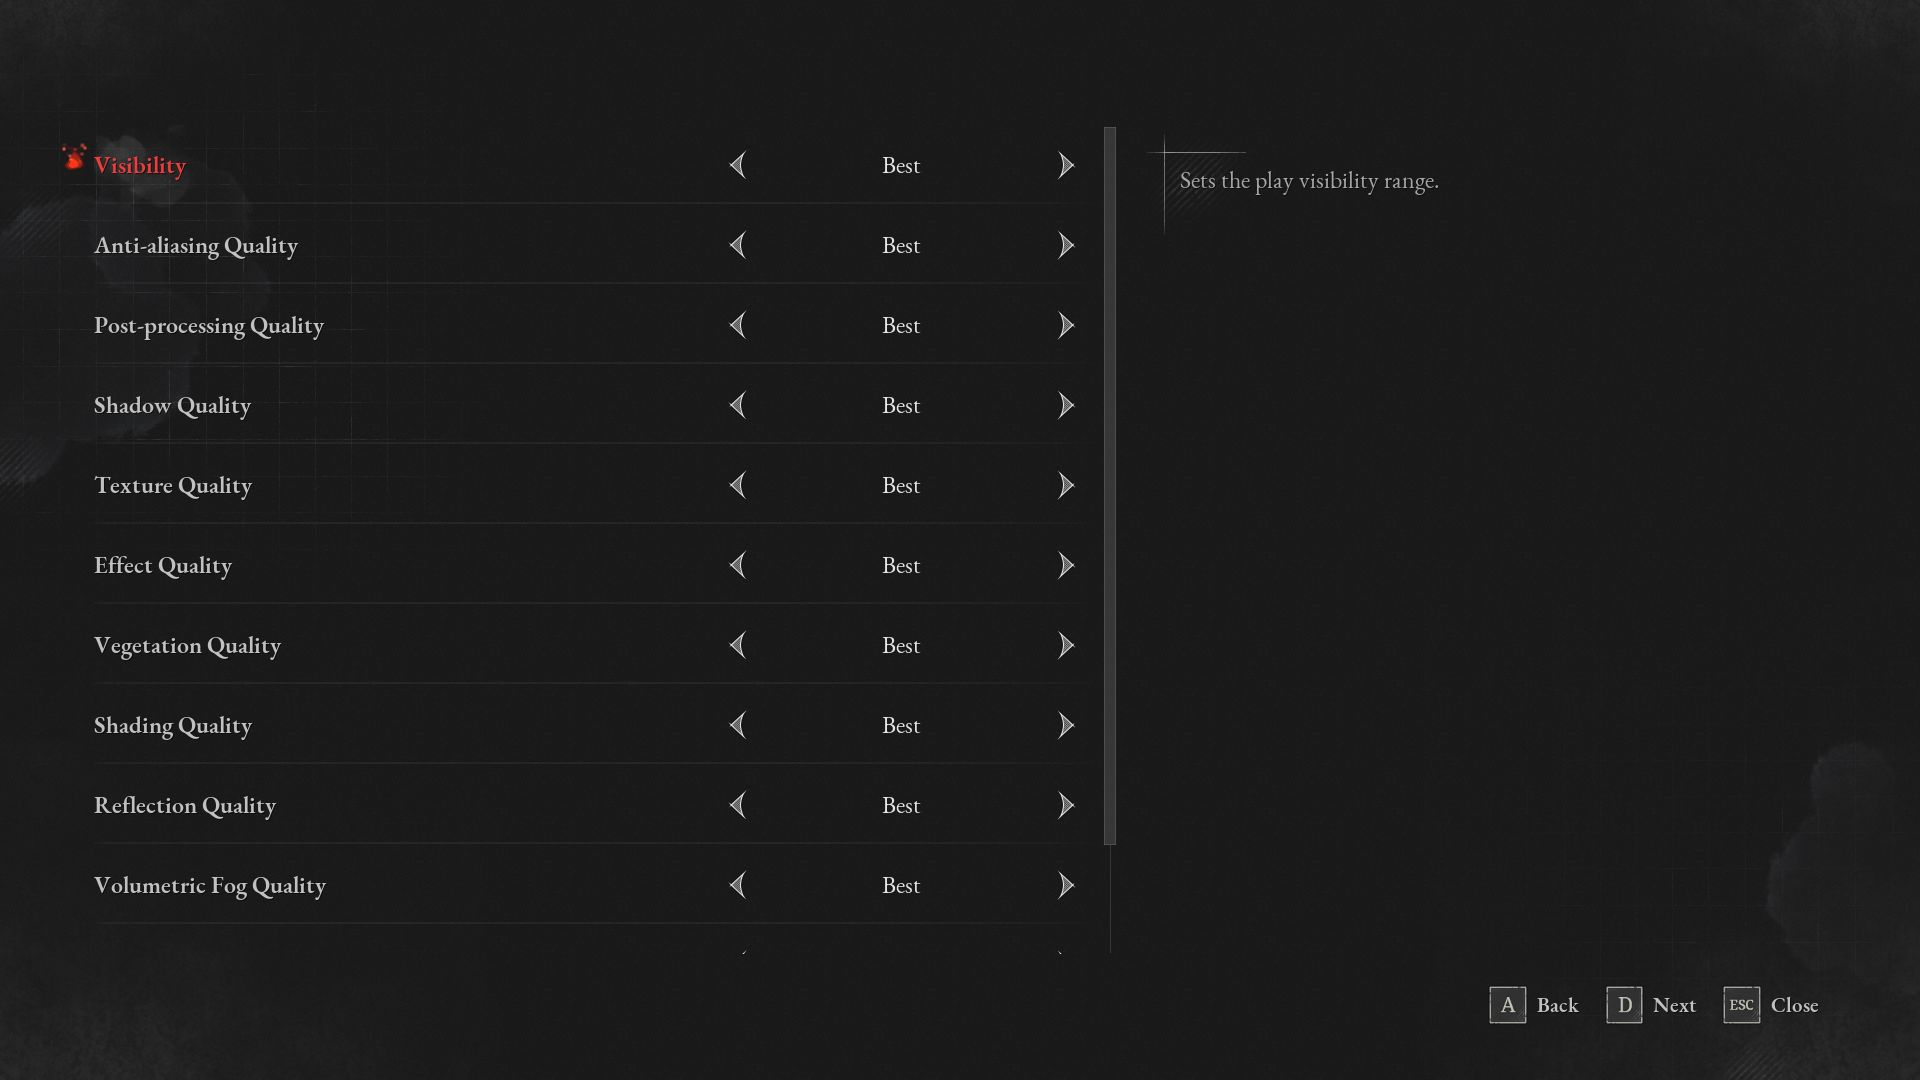
There isn’t much to complain about the graphics menu. It allows you to not only adjust screen mode, resolution and FPS limit (with an option to uncap frame rate) but also enable or disable VSync and upscaling. Lies of P supports both AMD's FSR 2 and Nvidia’s DLSS. The game also offers four presets that can be selected without requiring a restart. These presets modify ten quality and detail settings in the advanced graphics menu. Remarkably, Lies of P looks fairly beautiful even at lower settings.
During our testing, we didn’t have any complaints regarding crashes or other issues like graphical glitches. In other words, the game appears to be stable and well programmed. The game needs to compile shaders every time you launch it. But this isn’t all too annoying because the process doesn’t take overly long to complete. Load times are likewise absolutely fine. Moreover, Lies of P only takes up 40 GB of drive space, which is quite small for such an expansive game in 2023.
Benchmark
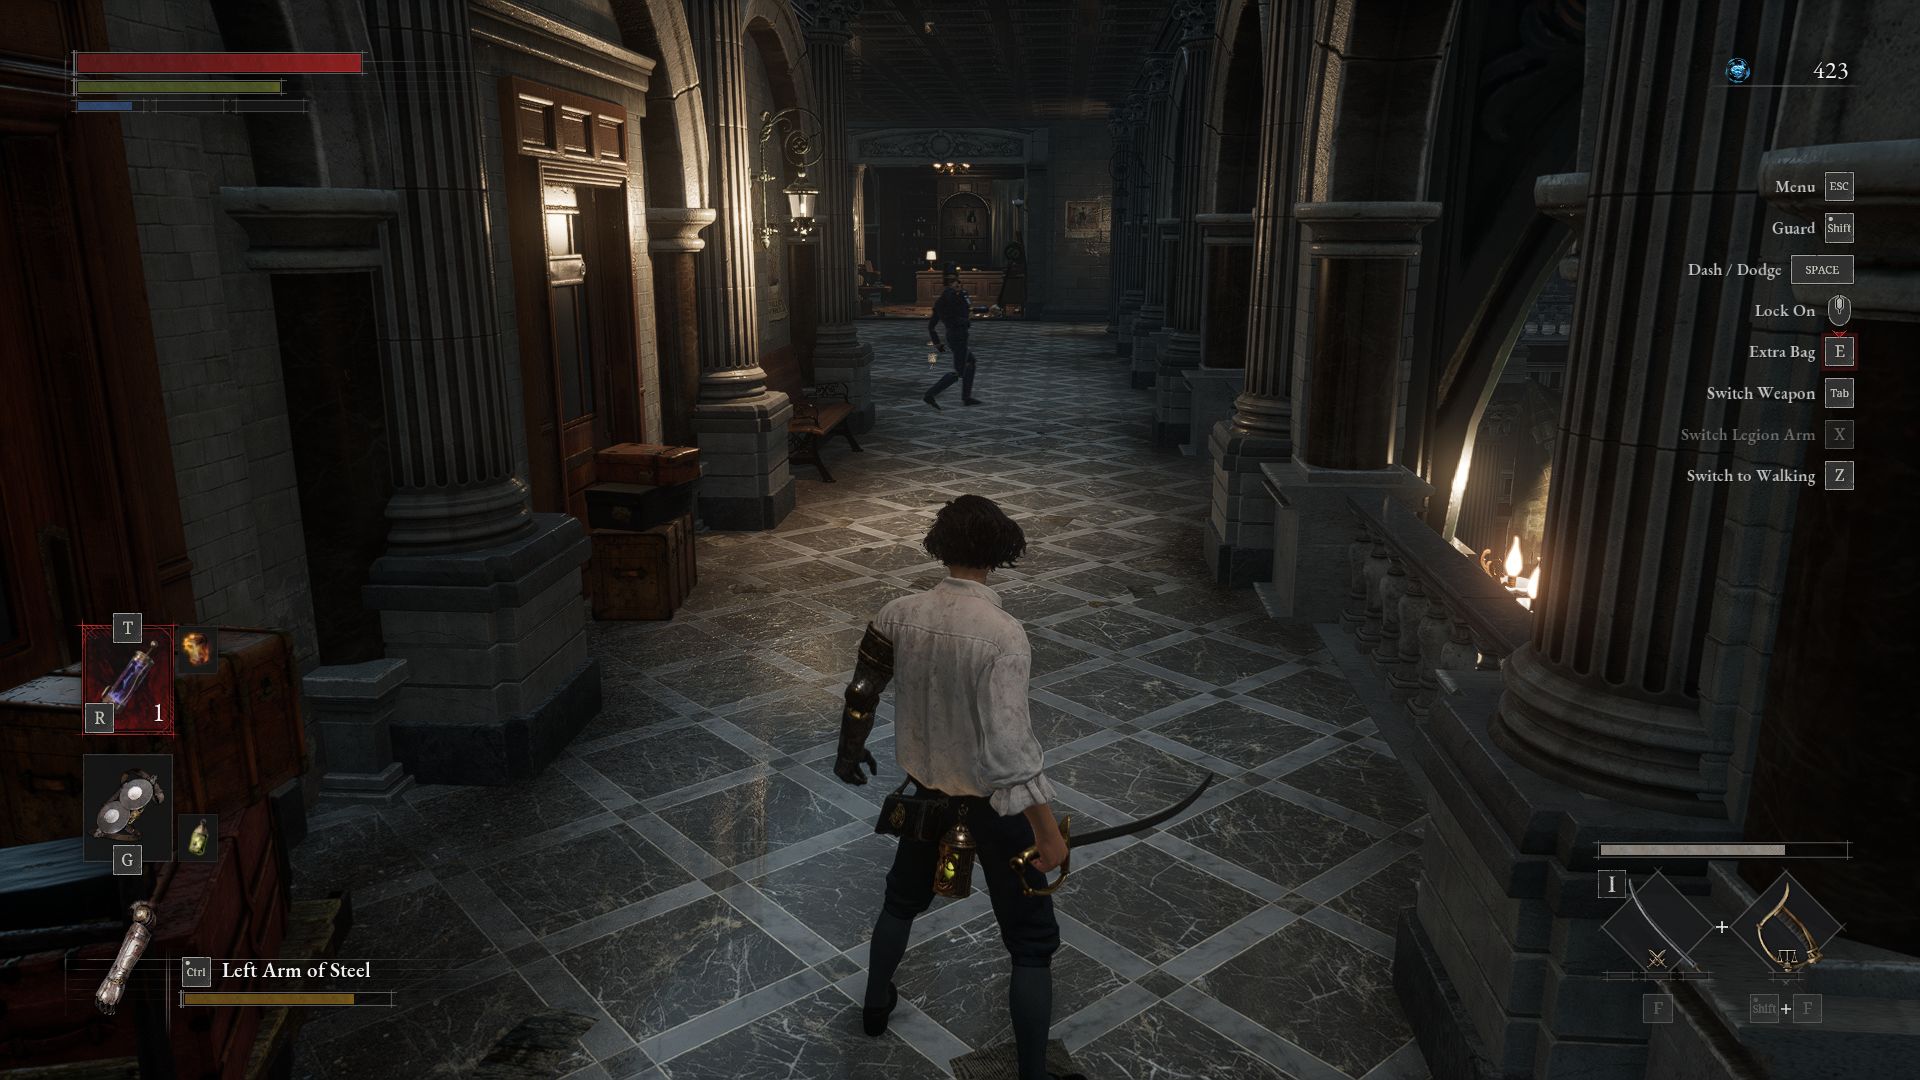
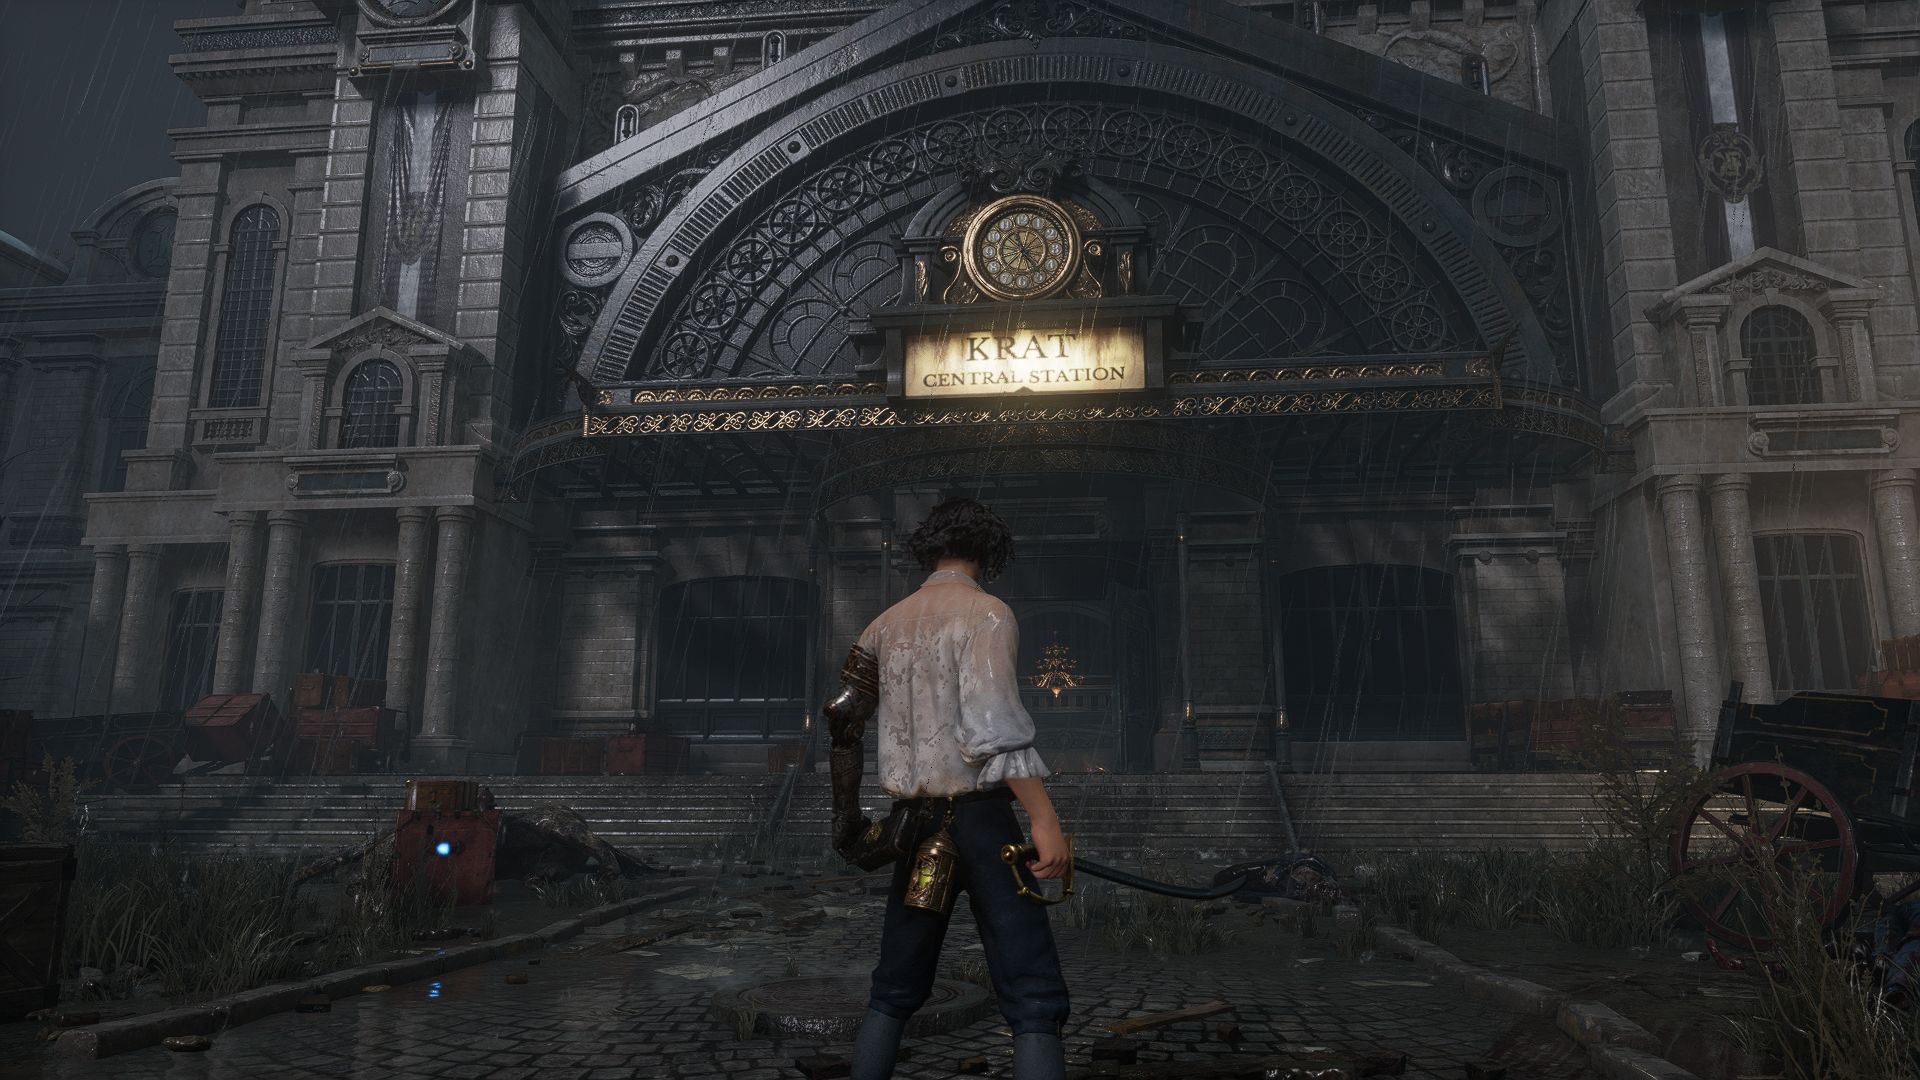
Because Lies of P doesn’t come with a built-in benchmark tool, we chose to use the square in front of “Krat Central station” for our frame rate measurements (see video). Using CapFrameX, we recorded a roughly 30-second sequence with the main character running around the fountain until it returns to the station’s entrance.
Usually, 30 FPS should be good enough to provide a solid experience in a third-person game. But we recommend running the game at 40 FPS or higher because combat in the game often requires pretty precise timing. The sequence we chose is neither easy nor particularly demanding but rather reflects the frame rate you can expect to get on average.
Results
FHD (1,920 x 1,080)
If you ignore iGPUs (the Radeon 680M, for example, can only manage over 40 FPS at 1080p and Low preset), Lies of P's hardware requirements are thankfully low. Mid-range models, such as a Radeon RX 6800S or similar, are sometimes able to break the 100 FPS mark at this resolution even when settings are turned up to high or very high.
| Lies of P | |
| 1920x1080 Low Preset 1920x1080 Medium Preset 1920x1080 High Preset 1920x1080 Best Preset | |
| NVIDIA GeForce RTX 4080, i9-13900K | |
| AMD Radeon RX 7900 XT, i9-13900K | |
| NVIDIA GeForce RTX 4090 Laptop GPU, i9-13900HX | |
| NVIDIA GeForce RTX 4080 Laptop GPU, i9-13900HX | |
| NVIDIA GeForce RTX 4070 Laptop GPU, i9-13900HX | |
| NVIDIA GeForce RTX 3080 Ti Laptop GPU, i9-12900H | |
| NVIDIA GeForce RTX 4060 Laptop GPU, i9-13900HX | |
| NVIDIA GeForce RTX 3070 Ti Laptop GPU, i7-12700H | |
| NVIDIA GeForce RTX 4050 Laptop GPU, i9-13900HX | |
| AMD Radeon RX 6800S, R9 6900HS | |
| AMD Radeon 680M, R9 6900HS | |
QHD (2,560 x 1,440)
You likewise don’t need a high-end GPU to bump up resolution to QHD. Even a GeForce RTX 4050 can run the game effortlessly at 1440p and Best preset.
| Lies of P | |
| 2560x1440 Best Preset | |
| NVIDIA GeForce RTX 4080, i9-13900K | |
| AMD Radeon RX 7900 XT, i9-13900K | |
| NVIDIA GeForce RTX 4090 Laptop GPU, i9-13900HX | |
| NVIDIA GeForce RTX 4080 Laptop GPU, i9-13900HX | |
| NVIDIA GeForce RTX 3080 Ti Laptop GPU, i9-12900H | |
| NVIDIA GeForce RTX 4070 Laptop GPU, i9-13900HX | |
| NVIDIA GeForce RTX 3070 Ti Laptop GPU, i7-12700H | |
| NVIDIA GeForce RTX 4060 Laptop GPU, i9-13900HX | |
| NVIDIA GeForce RTX 4050 Laptop GPU, i9-13900HX | |
UHD (3,840 x 2,160)
More powerful GPUs don’t even get pushed to their limits at 4K. A GeForce RTX 4060 is already capable enough to churn out more than 40 FPS at 4K and max settings. In the table below, you’ll also find results obtained with DLSS (Quality) enabled.
| Lies of P | |
| 3840x2160 Best Preset 3840x2160 Best Preset + DLSS Quality | |
| NVIDIA GeForce RTX 4080, i9-13900K | |
| AMD Radeon RX 7900 XT, i9-13900K | |
| NVIDIA GeForce RTX 4090 Laptop GPU, i9-13900HX | |
| NVIDIA GeForce RTX 4080 Laptop GPU, i9-13900HX | |
| NVIDIA GeForce RTX 3080 Ti Laptop GPU, i9-12900H | |
| NVIDIA GeForce RTX 4070 Laptop GPU, i9-13900HX | |
| NVIDIA GeForce RTX 3070 Ti Laptop GPU, i7-12700H | |
| NVIDIA GeForce RTX 4060 Laptop GPU, i9-13900HX | |
| NVIDIA GeForce RTX 4050 Laptop GPU, i9-13900HX | |
Note
Because gaming tests are very time-consuming and are often constrained by installation or activation limits, we are only able to provide you with part of the benchmark results at the time of publishing this article. We will be adding more graphics cards over the coming days and weeks.
Overview
All test systems
| Notebook | Graphics card | Processor | Memory |
|---|---|---|---|
| XMG Neo 17 E23 | Nvidia GeForce RTX 4090 @175 W TGP (16 GB GDDR6X) | Intel Core i9-13900HX | 2 x 16 GB DDR5 |
| Schenker Key 17 Pro E23 | Nvidia GeForce RTX 4080 @175 W TGP (12 GB GDDR6X) | Intel Core i9-13900HX | 2 x 16 GB DDR5 |
| XMG Pro 15 E23 | Nvidia GeForce RTX 4070 @140 W TGP (8 GB GDDR6) | Intel Core i9-13900HX | 2 x 16 GB DDR5 |
| XMG Pro 15 E23 | Nvidia GeForce RTX 4060 @140 W TGP (8 GB GDDR6) | Intel Core i9-13900HX | 2 x 16 GB DDR5 |
| XMG Focus 15 E23 | Nvidia GeForce RTX 4050 @140 W TGP (6 GB GDDR6) | Intel Core i9-13900HX | 2 x 16 GB DDR5 |
| Asus ROG Strix Scar 17 | Nvidia GeForce RTX 3080 Ti @150 W TGP (16 GB GDDR6) | Intel Core i9-12900H | 2 x 16 GB DDR5 |
| Acer Predator Helios 300 | Nvidia GeForce RTX 3070 Ti @150 W TGP (8 GB GDDR6) | Intel Core i7-12700H | 2 x 8 GB DDR5 |
| Asus ROG Zephyrus G14 | AMD Radeon RX 6800S (8 GB GDDR6) & AMD Radeon 680M | AMD Ryzen 9 6900HS | 2 x 16 GB DDR5 |
| Tower PC | Graphics card | Processor | Memory |
|---|---|---|---|
| Custom I / Asus ROG Strix Z790-F / G.Skill Trident Z5 RGB | Nvidia GeForce RTX 4080 (16 GB GDDR6X) AMD Radeon RX 7900 XT (20 GB GDDR6) |
Intel Core i9-13900K | 2 x 24 GB DDR5 |
| Custom II | Palit GeForce RTX 4090 GameRock OC (24 GB GDDR6X) Nvidia GeForce RTX 3090 FE (24 GB GDDR6X) Nvidia GeForce RTX 3060 Ti (8 GB GDDR6X) Nvidia Titan RTX (24 GB GDDR6) Nvidia GeForce RTX 2070 Super (8 GB GDDR6)Nvidia GeForce RTX 2060 Super (8 GB GDDR6) KFA2 GeForce GTX 1660 Super (6 GB GDDR6) PNY GeForce GTX 1660 (6 GB GDDR5) KFA2 GeForce GTX 1650 Super (4 GB GDDR6) AMD Radeon RX 6950 XT (16 GB DDR6) AMD Radeon RX 6800 (16 GB DDR6) AMD Radeon RX 6700 XT (12 GB DDR6) AMD Radeon RX 6650 XT (8 GB GDDR6) AMD Radeon RX 6600 (8 GB GDDR6) AMD Radeon RX 5700 XT (8 GB GDDR6) AMD Radeon RX 5700 (8 GB GDDR6) AMD Radeon RX 5600 XT (6 GB GDDR6) AMD Radeon RX 5500 XT (8 GB GDDR6) |
AMD Ryzen 9 7950X | 2 x 16 GB DDR5 |
| Mini-PC | Graphics card | Processor | Memory |
|---|---|---|---|
| Minisforum NUCXi7 | Nvidia GeForce RTX 3070 @125 W TGP (8 GB GDDR6) | Intel Core i7-11800H | 2 x 8 GB DDR4 |
| Minisforum HX99G | AMD Radeon RX 6600M @100 W TGP (8 GB GDDR6) | AMD Ryzen 9 6900HX | 2 x 16 GB DDR5 |
| Morefine S500+ | AMD Radeon RX Vega 8 | AMD Ryzen 9 5900HX | 2 x 16 GB DDR4 |
| 4K monitor | Operating system | Nvidia driver | AMD driver |
|---|---|---|---|
| Gigabyte M32U | Windows 11 | ForceWare 537.34 | Adrenalin 23.9.2 |

